10.1109/TVCG.2020.3030378 \onlineid0 \vgtcinsertpkg \authorfooter Arpit Narechania, Arjun Srinivasan, and John Stasko are from the Georgia Institute of Technology, Atlanta, GA (USA). E-mail: {arpitnarechania, arjun010}@gatech.edu, stasko@cc.gatech.edu. *Authors contributed equally. \shortauthortitleBiv et al.: Global Illumination for Fun and Profit
NL4DV: A Toolkit for Generating Analytic Specifications
for Data Visualization from Natural Language Queries
Abstract
Natural language interfaces (NLIs) have shown great promise for visual data analysis, allowing people to flexibly specify and interact with visualizations. However, developing visualization NLIs remains a challenging task, requiring low-level implementation of natural language processing (NLP) techniques as well as knowledge of visual analytic tasks and visualization design. We present NL4DV, a toolkit for natural language-driven data visualization. NL4DV is a Python package that takes as input a tabular dataset and a natural language query about that dataset. In response, the toolkit returns an analytic specification modeled as a JSON object containing data attributes, analytic tasks, and a list of Vega-Lite specifications relevant to the input query. In doing so, NL4DV aids visualization developers who may not have a background in NLP, enabling them to create new visualization NLIs or incorporate natural language input within their existing systems. We demonstrate NL4DV’s usage and capabilities through four examples: 1) rendering visualizations using natural language in a Jupyter notebook, 2) developing a NLI to specify and edit Vega-Lite charts, 3) recreating data ambiguity widgets from the DataTone system, and 4) incorporating speech input to create a multimodal visualization system.
keywords:
Natural Language Interfaces; Visualization Toolkits;K.6.1Management of Computing and Information SystemsProject and People ManagementLife Cycle;
\CCScatK.7.mThe Computing ProfessionMiscellaneousEthics
\teaser
![[Uncaptioned image]](/html/2008.10723/assets/x1.png) Examples illustrating the flexibility of natural language queries for specifying data visualizations.
NL4DV processes all three query variations, inferring
,
or ,
and
references to attributes, tasks, and visualizations.
The corresponding visualizations suggested by NL4DV in response to the individual queries are also shown.
Examples illustrating the flexibility of natural language queries for specifying data visualizations.
NL4DV processes all three query variations, inferring
,
or ,
and
references to attributes, tasks, and visualizations.
The corresponding visualizations suggested by NL4DV in response to the individual queries are also shown.
Introduction
Natural language interfaces (NLIs) for visualization are becoming increasingly popular in both academic research (e.g., [13, 46, 22, 52, 69]) as well as commercial software [34, 55]. At a high-level, visualization NLIs allow people to pose data-related queries and generate visualizations in response to those queries. To generate visualizations from natural language (NL) queries, NLIs first model the input query in terms of data attributes and low-level analytic tasks [1, 9] (e.g., filter, correlation, trend). Using this information, the systems then determine which visualizations are most suited as a response to the input query. While NLIs provide flexibility in posing data-related questions, inherent characteristics of NL such as ambiguity and underspecification make implementing NLIs for data visualization a challenging task.
To create visualization NLIs, besides implementing a graphical user interface (GUI) and rendering views, visualization system developers must also implement a natural language processing (NLP) module to interpret queries. Although there exist tools to support GUI and visualization design (e.g., D3.js [6], Vega-Lite [43]), developers currently have to implement custom modules for query interpretation. However, for developers without experience with NLP techniques and toolkits (e.g., NLTK [31], spaCy [21]), implementing this pipeline is non-trivial, requiring them to spend significant time and effort in learning and implementing different NLP techniques.
Consider the spectrum of queries in Figure NL4DV: A Toolkit for Generating Analytic Specifications for Data Visualization from Natural Language Queries issued to create visualizations in the context of an IMDb movies dataset with different attributes including the \faHashtag Worldwide Gross, \faFont Genre, and \faCalendar Release Year, among others (for consistency, we use this movies dataset for examples throughout this paper). The query “Create a histogram showing distribution of IMDB ratings” (Figure NL4DV: A Toolkit for Generating Analytic Specifications for Data Visualization from Natural Language Queries a) explicitly refers to a data attribute (IMDB Rating), a low-level analytic task (Distribution), and requests a specific visualization type (Histogram). This is an ideal interpretation scenario from a system standpoint since the query explicitly lists all components required to generate a visualization.
On the other hand, the second query “Show average gross across genres for science fiction and fantasy movies” (Figure NL4DV: A Toolkit for Generating Analytic Specifications for Data Visualization from Natural Language Queries b) does not explicitly state the visualization type or the attribute Creative Type. Instead, it explicitly references the attributes Worldwide Gross and Genre through ‘gross’ and ‘genres’, and implicitly refers to the Creative Type through the values ‘science fiction’ and ‘fantasy’. Furthermore, by specifying data values for the Creative Type attribute and the word ‘average,’ the query also mentions two intended analytic tasks: Filtering and computing Derived Values, respectively. This second query is more challenging since it requires the system to implicitly infer one of the attributes and then determine the visualization type based on the identified attributes and tasks.
Finally, the third query “Visualize rating and budget” (Figure NL4DV: A Toolkit for Generating Analytic Specifications for Data Visualization from Natural Language Queries c) is even more challenging to interpret since it neither explicitly states the desired visualization type nor the intended analytic task. Furthermore, while it explicitly references one attribute (Production Budget through ‘budget’), the reference to the second attribute is ambiguous (‘rating’ can map to IMDB Rating, Content Rating, or Rotten Tomatoes Rating).
To accommodate such query variations, visualization NLIs employ sophisticated NLP techniques (e.g., dependency parsing, semantic word matching) to identify relevant information from the query and build upon visualization concepts (e.g., analytic tasks) and design principles (e.g., choosing graphical encodings based on attribute types) to generate appropriate visualizations. For instance, given the query in Figure NL4DV: A Toolkit for Generating Analytic Specifications for Data Visualization from Natural Language Queries b, after detecting the data attributes and analytic tasks, a visualization NLI should select a visualization (e.g., bar chart) that is well-suited to support the task of displaying Derived Values (average) for Worldwide Gross (a quantitative attribute) across different Genres (a nominal attribute). Similarly, in the scenario in Figure NL4DV: A Toolkit for Generating Analytic Specifications for Data Visualization from Natural Language Queries c, a NLI must first detect ambiguities in the input query attributes, determine the visualizations suited to present those attribute combinations (e.g., scatterplot for two quantitative attributes), and ultimately infer the analytic tasks based on those attributes and visualizations (e.g., a scatterplot may imply the user is interested in finding correlations).
To support prototyping NLIs for data visualization, we contribute the Natural Language-Driven Data Visualization (NL4DV) toolkit. NL4DV is a Python package that developers can initialize with a tabular dataset. Once initialized, NL4DV processes subsequent NL queries about the dataset, inferring data attributes and analytic tasks from those queries. Additionally, using built-in mappings between attributes, tasks, and visualizations, NL4DV also returns an ordered list of Vega-Lite specifications relevant to those queries. By providing a high-level API to translate NL queries to visualizations, NL4DV abstracts out the core task of interpreting NL queries and provides task-based visualization recommendations as plug-and-play functionality. Using NL4DV, developers can create new visualization NLIs as well as incorporate NL querying capabilities into their existing visualization systems.
In this paper, we discuss NL4DV’s design goals and describe how the toolkit infers data attributes, analytic tasks, and visualization specifications from NL queries. Furthermore, we formalize the inferred information into a JSON-based analytic specification that can be programmatically parsed by visualization developers. Finally, through example applications, we showcase how this formalization can help: 1) implement visualization NLIs from scratch, 2) incorporate NL input into an existing visualization system, and 3) support visualization specification in data science programming environments.
To support development of future systems, we also provide NL4DV and the described applications as open-source software available at: https://nl4dv.github.io/nl4dv/
1 Related Work
1.1 Natural Language Interfaces for Data Visualization
In 2001, Cox et al. [10] presented an initial prototype of a NLI that supported using well-structured commands to specify visualizations. Since then, given the advent of NL understanding technology and NLIs for databases (e.g., [40, 4, 29, 39, 71, 60, 17, 20]), there has been a surge of NLIs for data visualization [54, 13, 46, 22, 52, 69, 49, 47, 50, 27, 24, 25], especially in recent years. Srinivasan and Stasko [51] summarize a subset of these NLIs, characterizing systems based on their supported capabilities including visualization-focused capabilities (e.g., specifying or interacting with visualizations), data-focused capabilities (e.g., computationally answering questions about a dataset), and system control-focused capabilities (e.g., augmenting graphical user interface actions like moving windows with NL). Along these lines, NL4DV’s current focus is primarily to support visualization specification. With this scope in mind, below we highlight systems that serve as the motivation for NL4DV’s development and are most relevant to our work.
Articulate [54] is a visualization NLI that allows people to generate visualizations by deriving mappings between tasks and data attributes in user queries. DataTone [13] uses a combination of lexical, constituency, and dependency parsing to let people specify visualizations through NL. Furthermore, detecting ambiguities in the input query, DataTone leverages mixed-initiative interaction to resolve these ambiguities through GUI widgets such as dropdown menus. FlowSense [69] uses semantic parsing techniques to support NL interaction within a dataflow system, allowing people to specify and connect components without learning the intricacies of operating a dataflow system. Eviza [46] incorporates a probabilistic grammar-based approach and a finite state machine to allow people to interact with a given visualization. Extending Eviza’s capabilities and incorporating additional pragmatics concepts, Evizeon [22] allows both specifying and interacting with visualizations through standalone and follow-up utterances. The ideas in Eviza and Evizeon were also used to design the Ask Data feature in Tableau [55]. Ask Data internally uses Arklang [47], an intermediate language developed to describe NL queries in a structured format that Tableau’s VizQL [53] can parse to generate visualizations.
The aforementioned systems all present different interfaces and capabilities, supporting NL interaction through grammar- and/or lexical-parsing techniques. A commonality in their underlying NLP pipeline, however, is the use of data attributes and analytic tasks (e.g., correlation, distribution) to determine user intent for generating the system response. Building upon this central observation and prior system implementations (e.g., string similarity metrics and thresholds [13, 46, 52], parsing rules [13, 69, 25]), NL4DV uses a combination of lexical and dependency parsing-based techniques to infer attributes and tasks from NL queries. However, unlike previous systems that implement custom NLP engines and languages that translate NL queries into system actions, we develop NL4DV as an interface-agnostic toolkit. In doing so, we formalize attributes and tasks inferred from a NL query into a structured JSON object that can be programmatically parsed by developers.
1.2 Visualization Toolkits and Grammars
Fundamentally, our research falls under the broad category of user interface toolkits [37, 38, 28]. As such, instead of presenting a single novel technique or interface, we place emphasis on reducing development viscosity, lowering development skill barriers, and enabling replication and creative exploration. Within visualization research, there exist a number of visualization toolkits with similar goals that particularly focus on easing development effort for specifying and rendering visualizations. Examples of such toolkits include Prefuse [19], Protovis [5], and D3 [6]. With the advent of visualizations on alternative platforms like mobile devices and AR/VR, a new range of toolkits are also being created to assist visualization development on these contemporary platforms. For instance, EasyPZ.js [45] supports incorporating navigation techniques (pan and zoom) in web-based visualizations across both desktops and mobile devices. Toolkits like DXR [48] enable development of expressive and interactive visualizations in Unity [57] that can be deployed in AR/VR environments. NL4DV extends this line of work on toolkits for new modalities and platforms by making it easier for visualization system developers to interpret NL queries without having to learn or implement NLP techniques.
Besides toolkits that aid programmatically creating visualizations, researchers have also formulated visualization grammars that provide a high-level abstraction for building visualizations to reduce software engineering know-how [18]. Along these lines, based on the Grammar of Graphics [62], more recently developed visualization grammars such as Vega [44] and Vega-Lite [43] support visualization design through declarative specifications, enabling rapid visualization design and prototyping. NL4DV’s primary goal is to return visualizations in response to NL queries. To enable this, in addition to a structured representation of attributes and tasks inferred from a query, NL4DV also needs to return visualization specifications most relevant to an input query. Given the conciseness of Vega-Lite and its growing usage in both web-based visualization systems and Python-based visual data analysis, NL4DV uses Vega-Lite as its underlying visualization grammar.
1.3 Natural Language Processing Toolkits
Toolkits like NLTK [31], Stanford CoreNLP [33] and NER [11], and spaCy [21] help developers perform NLP tasks such as part-of-speech (POS) tagging, entity recognition, and dependency parsing, among others. However, since these are general-purpose toolkits, to implement visualization NLIs, developers need to learn to use the toolkit and also understand the underlying NLP techniques/concepts (e.g., knowing which dependency paths to traverse while parsing queries, understanding semantic similarity metrics). Furthermore, to implement visualization systems, developers need to write additional code to convert the output from NLP toolkits into visualization-relevant concepts (e.g., attributes and values for applying data filters), which can be both complex and tedious. Addressing these challenges, NL4DV internally uses NLTK [31], Stanford CoreNLP [33], and spaCy [21] but provides an API that encapsulates and hides the underlying NLP implementation details. This allows visualization developers to focus more on front-end code pertaining to the user interface and interactions while invoking high-level functions to interpret NL queries.
2 NL4DV Overview
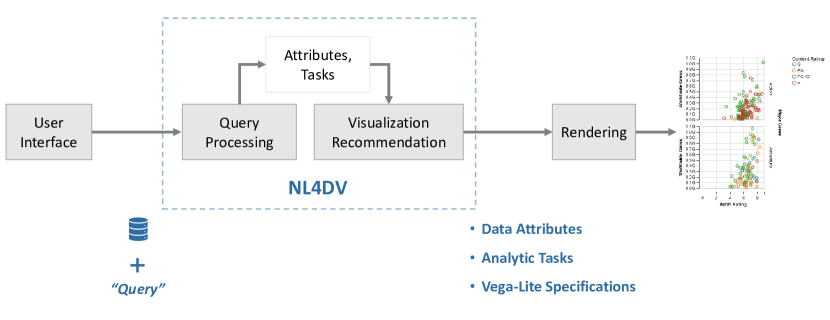
Figure 1 presents an overview of a typical pipeline for implementing NLIs that generate visualizations in response to NL queries. At a high-level, once an input query is collected through a User Interface, a Query Processor infers relevant information such as data attributes and analytic tasks from the input query. This information is then passed to a Visualization Recommendation Engine which generates a list of visualizations specifications relevant to the input query. These specifications are finally rendered through a library (e.g., D3 [6]) of the developer’s choice. In the context of this pipeline, NL4DV provides a high-level API for processing NL queries and generating Vega-Lite specifications relevant to the input query. Developers can choose to directly render the Vega-Lite specifications to create views (e.g., using Vega-Embed [59]) or use the attributes and tasks inferred by NL4DV to make custom changes to their system’s interface.
2.1 Design Goals
Four key design goals drove the development of NL4DV. We compiled these goals based on a review of design goals and system implementations of prior visualization NLIs [54, 13, 46, 22, 52, 69] and recent toolkits for supporting visualization development on new platforms and modalities (e.g, [45, 48]).
DG1. Minimize NLP learning curve. NL4DV’s primary target users are developers without a background or experience in working with NLP techniques. Correspondingly, it was important to make the learning curve as flat as possible. In other words, we wanted to enable developers to use the output of NL4DV without having to spend time learning about the mechanics of how information is extracted from NL queries. In terms of toolkit design, this consideration translated to providing high-level functions for interpreting NL queries and designing a response structure that was optimized for visualization system development by emphasizing visualization-related information such as analytic tasks (e.g., filter, correlation) and data attributes and values.
DG2. Generate modularized output and support integration with existing system components. By default, NL4DV recommends Vega-Lite specifications in response to NL queries. However, a developer may prefer rendering visualizations using a different library such as D3 or may want to use a custom visualization recommendation engine (e.g., [65, 36, 30]), only leveraging NL4DV to identify attributes and/or tasks in the input query. Supporting this goal required us to ensure that NL4DV’s output was modularized (allowing developers to choose if they wanted attributes, tasks, and/or visualizations) and that developers do not have to significantly modify their existing system architecture to use NL4DV. In terms of toolkit design, in addition to using a standardized grammar for visualizations (in our case, Vega-Lite), these considerations translated to devising a formalized representation of data attributes and analytic tasks that developers can programmatically parse to link NL4DV’s output to other components in their system.
DG3. Highlight inference type and ambiguity. NL is often underspecified and ambiguous. In other words, input queries may only include partial references to data attributes or may implicitly refer to intended tasks and visualizations (e.g., Figure NL4DV: A Toolkit for Generating Analytic Specifications for Data Visualization from Natural Language Queries b, c) [56]. Besides addressing these challenges from an interpretation standpoint, it was also important to make developers aware of the resulting uncertainty in NL4DV’s output so they can choose to use/discard the output and provide appropriate visual cues (e.g., ambiguity widgets [13]) in their systems’ interface. In terms of toolkit design, this translated to structuring NL4DV’s output so it indicates whether information is inferred through an explicit (e.g., query substring matches an attribute name) or implicit (e.g., query refers to a data attribute through the attribute’s values) reference, and highlights potential ambiguities in its response (e.g., two or more attributes map to the same word in an input query as in Figure NL4DV: A Toolkit for Generating Analytic Specifications for Data Visualization from Natural Language Queries c).
DG4. Support adding aliases and overriding toolkit defaults. Visualization systems are frequently used to analyze domain-specific datasets (e.g., sales, medical records, sports). Given a domain, it is common for data attributes to have abbreviations or aliases (e.g., “GDP” for Gross domestic product, “investment” for Capital), or values that are unique to the dataset (e.g., the letter “A” can refer to a value in a course grade dataset, but would be considered as a stopword and ignored by most NLP algorithms by default). In terms of toolkit design, these dataset-specific considerations translated to providing developers with helper functions to specify aliases or special word lists that NL4DV should consider/exclude for a given dataset.
3 NL4DV Design and Implementation
In this section, we detail NL4DV’s design and implementation, highlighting key functions and describing how the toolkit interprets NL queries. We defer discussing example applications developed using NL4DV to the following section.
Listing 2 shows the basic Python code for using NL4DV. Given a dataset (as a CSV, TSV, or JSON) and a query string, with a single function call analyze_query(query), NL4DV infers attributes, tasks, and visualizations, returning them as a JSON object (DG1). Specifically, NL4DV’s response object has an attributeMap composed of the inferred dataset attributes, a taskMap composed of the inferred analytic tasks, and a visList, a list of visualization specifications relevant to the input query. By providing attributes, tasks, and visualizations as separate keys in the response object, NL4DV allows developers to selectively extract and use parts of its output (DG2).
3.1 Data Interpretation
Once initialized with a dataset (Listing 2, line 2), NL4DV iterates through the underlying data item values to infer metadata including the attribute types (\faHashtag Quantitative, \faFont Nominal, \faListUl Ordinal, \faCalendar Temporal) along with the range and domain of values for each attribute. This attribute metadata is used when interpreting queries to infer appropriate analytic tasks and generate relevant visualization specifications.
Since NL4DV uses data values to infer attribute types, it may make erroneous interpretations. For example, a dataset may have the attribute Day with values in the range . Detecting a range of integer values, by default, NL4DV will infer Day as a quantitative attribute instead of temporal. This misinterpretation can lead to NL4DV making poor design choices when selecting visualizations based on the inferred attributes (e.g., a quantitative attribute may result in a histogram instead of a line chart). To overcome such issues caused by data quality or dataset semantics, NL4DV allows developers to verify the inferred metadata using get_metadata(). This function returns a hash map of attributes along with their inferred metadata. If they notice errors, developers can use other helper functions (e.g., set_attribute_type(attribute,type)) to override the default interpretation (DG4).
3.2 Query Interpretation
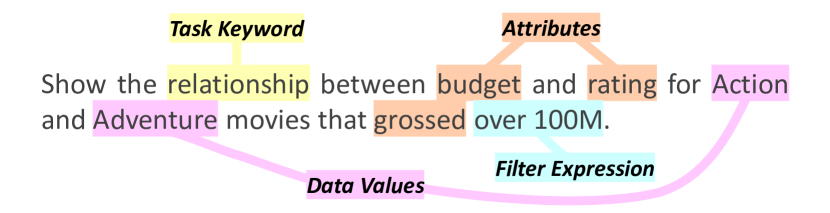
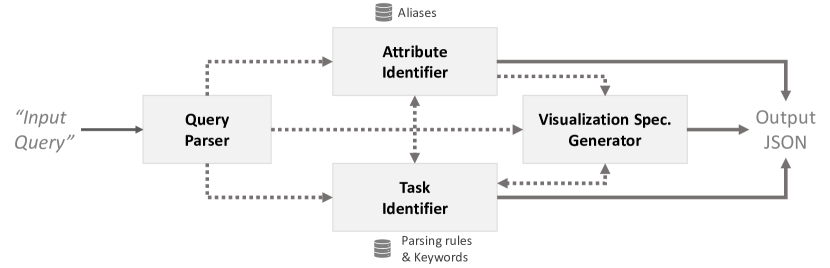
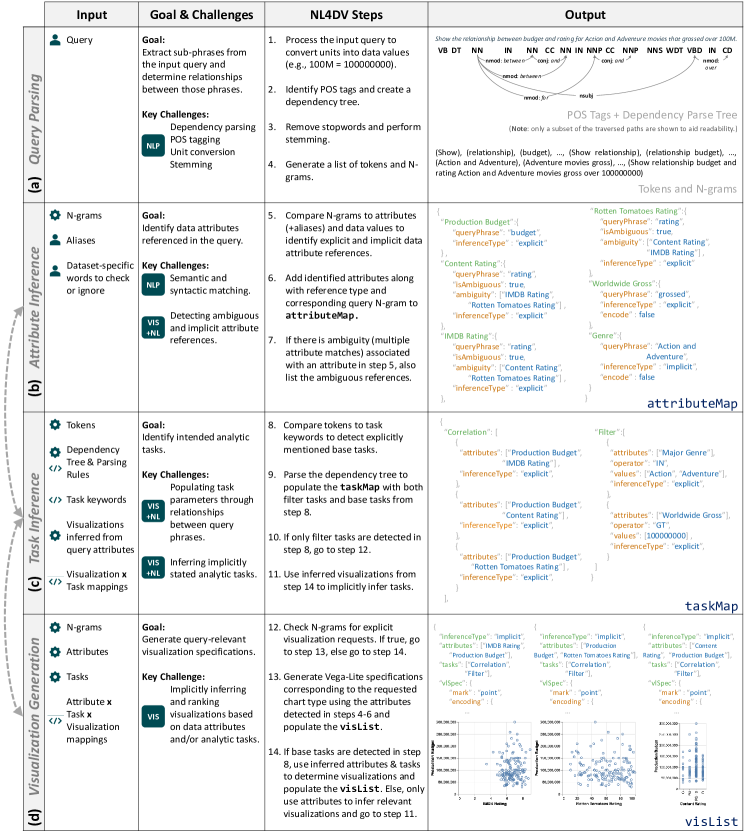
To generate visualizations in response to a query, visualization NLIs need to identify informative phrases in the query that map to relevant concepts like data attributes and values, analytic tasks, and visualization types, among others. Figure 3 shows the query in Listing 2 “Show the relationship between budget and rating for Action and Adventure movies that grossed over 100M” with such annotated phrases (we use this query as a running example throughout this section to describe NL4DV’s query interpretation strategy). To identify relevant phrases and generate the attributeMap, taskMap, and visList, NL4DV performs four steps: 1) query parsing, 2) attribute inference, 3) task inference, and 4) visualization specification generation. Figure 4 gives an overview of NL4DV’s underlying architecture. Below we describe the individual query interpretation steps (task inference is split into two steps to aid explanation) and summarize the pipeline in Figure 5.
3.2.1 Query Parsing
The query parser runs a series of NLP functions on the input string to extract details that can be used to detect relevant phrases. In this step, NL4DV first preprocesses the query to convert any special symbols or characters into dataset-relevant values (e.g., converting 100M to the number 100000000). Next, the toolkit identifies the POS tags for each token (e.g., NN: Noun, JJ: Adjective, CC: Coordinating Conjunction) using Stanford’s CoreNLP [33]. Furthermore, to understand the relationship between different phrases in the query, NL4DV uses CoreNLP’s dependency parser to create a dependency tree. Then, with the exception of conjunctive/disjunctive terms (e.g., ‘and’, ‘or’) and some prepositions (e.g., ‘between’, ‘over’) and adverbs (e.g., ‘except’, ‘not’), NL4DV trims the input query by removing all stop words and performs stemming (e.g., ‘grossed’ ‘gross’). Lastly, the toolkit generates all N-grams from the trimmed query string. The output from the query parser (POS tags, dependency tree, N-grams) is shown in Figure 5a and is used internally by NL4DV during the remaining stages of query interpretation.
3.2.2 Attribute Inference
After parsing the input query, NL4DV looks for data attributes that are mentioned both explicitly (e.g., through direct references to attribute names) and implicitly (e.g., through references to an attribute’s values). Developers can also configure aliases (e.g., ‘Investment’ for Production Budget) to support dataset- and domain-specific attribute references (DG4). To do so, developers can provide a JSON object consisting of attributes (as keys) and lists of aliases (as values). This object can be passed through the optional parameters alias_map or alias_map_url when initializing NL4DV (Listing 2, line 2) or using the helper function set_alias_map(alias_map, url="").
To infer attributes, NL4DV iterates through the N-grams generated by the query parser, checking for both syntactic (e.g., misspelled words) and semantic (e.g., synonyms) similarity between N-grams and a lexicon composed of data attributes, aliases, and values. To check for syntactic similarity, NL4DV computes the cosine similarity between a N-gram i and a tokenized lexical entity j. The possible values for range from [0,1] with 1 indicating that strings are equivalent. For semantic similarity, the toolkit checks for the Wu-Palmer similarity score [67] between a N-gram i and a tokenized lexical entry j. This score returns the distance between stemmed versions of p and a in the WordNet graph [35], and is a value in the range , with higher values implying greater similarity. If or , NL4DV maps the N-gram i to the attribute corresponding to j, also adding the attribute as a key in the attributeMap.
As shown in Figure 5b, the attributeMap is structured such that besides the attributes themselves, for each attribute, developers can also identify: (1) query substrings that led to an attribute being detected (queryPhrase) along with (2) the type of reference (inferenceType), and (3) ambiguous matches (ambiguity). For instance, given the query in Figure 3, NL4DV detects the attributes Production Budget (based on ‘budget’), Content Rating, IMDB Rating, Rotten Tomatoes Rating (ambiguity caused by the word ‘rating’), Worldwide Gross (based on ‘grossed’), and Genre (based on the values ‘Action’ and ‘Adventure’). Furthermore, since Genre is referenced by its values, it is marked as implicit whereas the other attributes are marked as explicit (DG3).
3.2.3 Explicit Task Inference
After detecting N-grams mapping to data attributes, NL4DV checks the remaining N-grams for references to analytic tasks. NL4DV currently identifies five low-level analytic tasks [1] including four base tasks: Correlation, Distribution, Derived Value, Trend, and a fifth Filter task. We separate base tasks from filter since base tasks are used to determine appropriate visualizations (e.g., correlation maps to a scatterplot) whereas filters are applied across different types of visualizations. We focus on these five tasks as a starting set since they are commonly supported in prior NLIs [54, 13, 47, 69, 24] and are most relevant to NL4DV’s primary goal of supporting visualization specification through NL (as opposed to interacting with a given chart [46, 52] or question answering [25]).
While filters may be detected via data values (e.g., ‘Action’, ‘Comedy’), to detect base tasks, NL4DV compares the query tokens to a predefined list of task keywords (e.g., ‘correlate’, ‘relationship’, etc., for the Correlation task, ‘range’, ‘spread’, etc., for the Distribution task, ‘average’, ‘sum’, etc., for Derived Value). Merely detecting references to attributes, values, and tasks is insufficient to infer user intent, however. To model relationships between query phrases and populate task details, NL4DV leverages the POS tags and the dependency tree generated by the query parser. Specifically, using the token type and dependency type (e.g., nmod, conj, nsubj) and distance, NL4DV identifies mappings between attributes, values, and tasks. These mappings are then used to model the taskMap. The task keywords and dependency parsing rules were defined based on the query patterns and examples from prior visualization NLIs [54, 46, 13, 22, 69] as well as 200 questions collected by Amar et al. [1] when formulating their analytic task taxonomy.
The taskMap contains analytic tasks as keys. Tasks are broken down as a list of objects that include an inferenceType field to indicate if a task was stated explicitly (e.g., through keywords) or derived implicitly (e.g., if a query requests for a line chart, a trend task may be implied) and parameters to apply when executing a task. These include the attributes a task maps to, the operator to be used (e.g., GT, EQ, AVG, SUM), and values. If there are ambiguities in task parameters (e.g., the word ‘fiction’ may refer to the values ‘Science Fiction,’ ‘Contemporary Fiction,’ ‘Historical Fiction’), NL4DV adds additional fields (e.g., isValueAmbiguoustrue) to highlight them (DG3). In addition to the tasks themselves, this structuring of the taskMap allows developers to detect: (1) the parameters needed to execute a task (attributes, operator, values), (2) operator- and value-level ambiguities (e.g., isValueAmbiguous), and (3) if the task was stated explicitly or implicitly (inferenceType).
Consider the taskMap (Figure 5c) for the query in Figure 3. Using the dependency tree in Figure 5a, NL4DV infers that the word ‘relationship’ maps to the Correlation task and links to the tokens ‘budget’ and ‘rating’ which are in-turn linked by the conjunction term ‘and.’ Next, referring back to the attributeMap, NL4DV maps the words ‘budget’ and ‘rating’ to their respective data attributes, adding three objects corresponding to correlations between the attributes [Production Budget, IMDB Rating], [Production Budget, Content Rating], and [Production Budget, Rotten Tomatoes Rating] to the correlation task. Leveraging the tokens ‘Action’ and ‘Adventure’, NL4DV also infers that the query refers to a Filter task on the attribute Genre, where the values are in the list (IN) [Action, Adventure]. Lastly, using the dependencies between tokens in the phrase ‘gross over 100M,’ NL4DV adds an object with the attribute Worldwide Gross, the greater than (GT) operator, and 100000000 in the values field. While populating filter tasks, NL4DV also updates the corresponding attributes in the attributeMap with the key encodeFalse (Figure 5b). This helps developers detect that an attribute is used for filtering and is not visually encoded in the recommended charts.
3.2.4 Visualization Generation
NL4DV uses Vega-Lite as the underlying visualization grammar. The toolkit currently supports the Vega-Lite marks: bar, tick, line, area, point, arc, boxplot, text and encodings: x, y, color, size, column, row, theta to visualize up to three attributes at a time. This combination of marks and encodings allows NL4DV to support a range of common visualization types including histograms, strip plots, bar charts (including stacked and grouped bar charts), line and area charts, pie charts, scatterplots, box plots, and heatmaps. To determine visualizations relevant to the input query, NL4DV checks the query for explicit requests for visualization types (e.g., Figure NL4DV: A Toolkit for Generating Analytic Specifications for Data Visualization from Natural Language Queries a) or implicitly infers visualizations from attributes and tasks (e.g., Figures NL4DV: A Toolkit for Generating Analytic Specifications for Data Visualization from Natural Language Queries b, NL4DV: A Toolkit for Generating Analytic Specifications for Data Visualization from Natural Language Queries c, and 3).
Explicit visualization requests are identified by comparing query N-grams to a predefined list of visualization keywords (e.g., ‘scatterplot’, ‘histogram’, ‘bar chart’). For instance, the query in Figure NL4DV: A Toolkit for Generating Analytic Specifications for Data Visualization from Natural Language Queries a specifies the visualization type through the token ‘histogram,’ leading to NL4DV setting bar as the mark type and binned IMDB Rating as the x encoding in the underlying Vega-Lite specification.
To implicitly determine visualizations, NL4DV uses a combination of the attributes and tasks inferred from the query. NL4DV starts by listing all possible visualizations using the detected attributes by applying well-known mappings between attributes and visualizations (Table 1). These mappings are preconfigured within NL4DV based on heuristics used in prior systems like Show Me [32] and Voyager [64, 66]. As stated earlier, when generating visualizations from attributes, NL4DV does not visually encode the attributes used as filters. Instead, filter attributes are added as a filter transform in Vega-Lite. Doing so helps avoid a combinatorial explosion of attributes when a query includes multiple filters (e.g., including the filter attributes for the query in Figure 3 would require generating visualizations that encode four attributes instead of two).
Besides attributes, if tasks are explicitly stated in the query, NL4DV uses them as an additional metric to modify, prune, and/or rank the generated visualizations. Consider the query in Figure 3. Similar to the query in Figure NL4DV: A Toolkit for Generating Analytic Specifications for Data Visualization from Natural Language Queries c, if only attributes were used to determine the charts, NL4DV would output two scatterplots (for QxQ) and one bar chart (for NxQ). However, since the query contains the token ‘relationship,’ which maps to a Correlation task, NL4DV enforces a scatterplot as the chart type, setting the mark in the Vega-Lite specifications to point. Furthermore, because correlations are more apparent in QxQ charts, NL4DV also ranks the two QxQ charts higher, returning the three visualization specifications shown in Figure 5d. These Task x Visualization mappings (Table 1) are configured within NL4DV based on prior visualization systems [36, 8, 14] and studies [26, 42].
| Attributes (x, y, color/size/row/column) | Visualizations | Task | ||
|---|---|---|---|---|
| Q x Q x {N, O, Q, T} | Scatterplot | Correlation | ||
| N, O x Q x {N, O, Q, T} | Bar Chart | Derived Value | ||
| Q, N, O x {N, O, Q, T} x {Q} |
|
Distribution | ||
| T x {Q} x {N, O} | Line Chart | Trend |
NL4DV complies the inferred visualizations into a visList (Figure 5d). Each object in this list is composed of a vlSpec containing the Vega-Lite specification for a chart, an inferenceType field to highlight if a visualization was requested explicitly or implicitly inferred by NL4DV, and a list of attributes and tasks that a visualization maps to. Developers can use the visList to directly render visualizations in their systems (via the vlSpec). Alternatively, ignoring the visList, developers can also extract only attributes and tasks using the attributeMap and taskMap, and feed them as input to other visualization recommendation engines (e.g., [65, 30]) (DG2).
3.2.5 Implicit Task Inference
When the input query lacks explicit keywords referring to analytic tasks, NL4DV first checks if the query requests for a specific visualization type. If so, the toolkit uses mappings between Visualizations x Tasks in Table 1 to infer tasks (e.g., distribution for a histogram, trend for a line chart, correlation for a scatterplot).
Alternatively, if the query only mentions attributes, NL4DV first lists possible visualizations based on those attributes. Then, using the inferred visualizations, the toolkit implicitly infers tasks (again leveraging the Visualization x Task mappings in Table 1). Consider the example in Figure NL4DV: A Toolkit for Generating Analytic Specifications for Data Visualization from Natural Language Queries c. In this case, the tasks Correlation and Derived Value are inferred based on the two scatterplots and one bar chart generated using the attribute combinations QxQ and NxQ, respectively. In such cases where the tasks are implicitly inferred through visualizations, NL4DV also sets their inferenceType in the taskMap to implicit.
4 Example Applications
4.1 Using NL4DV in Jupyter Notebook
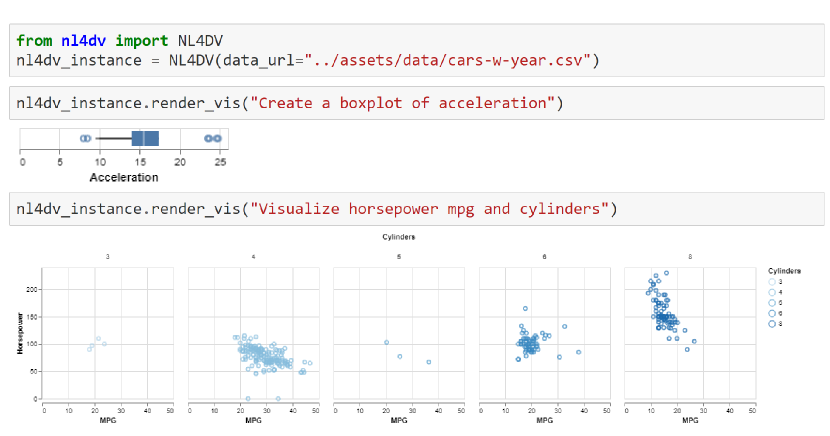
Since NL4DV generates Vega-Lite specifications, in environments that support rendering Vega-Lite charts, the toolkit can be used to create visualizations through NL in Python. Specifically, NL4DV provides a wrapper function render_vis(query) that automatically renders the first visualization in the visList. By rendering visualizations in response to NL queries in environments like Jupyter Notebook, NL4DV enables novice Python data scientists and programmers to conduct visual analysis without needing to learn about visualization design or Python visualization packages (e.g., Matplotlib, Plotly). Figure 6 shows an instance of a Jupyter Notebook demonstrating the use of NL4DV to create visualizations for a cars dataset. For the first query “Create a boxplot of acceleration,” detecting an explicit visualization request, NL4DV renders a box plot showing values for the attribute Acceleration. For the second query “Visualize horsepower mpg and cylinders”, NL4DV implicitly selects a scatterplot as the appropriate visualization using the inferred attributes (\faHashtag Horsepower, \faHashtag MPG, \faListOl Cylinders).
4.2 Creating Visualization Systems with NL4DV
The above example illustrates how the visList generated by NL4DV is used to create visualizations in Python-based data science environments. The following two examples showcase how NL4DV can assist the development of web-based NLIs for data visualization.
4.2.1 NL-Driven Vega-Lite Editor
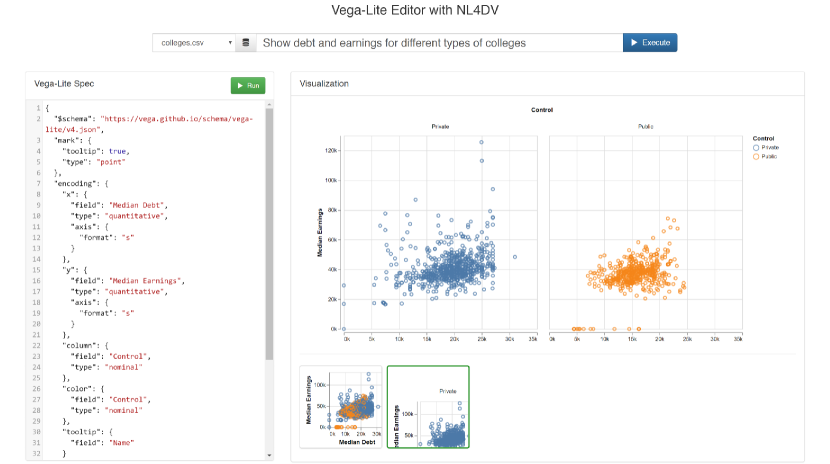
Although the declarative nature of Vega-Lite makes it an intuitive way to specify visualizations, novices unaware of visualization terminology may need to spend a significant amount of time and effort to look at examples and learn the specification grammar. NL input presents itself as a promising solution in such scenarios to help onboard users for learning Vega-Lite. With a NLI, users can load their data and express their intended chart through NL. The system in response can present both the chart and the corresponding Vega-Lite specification, allowing users to learn the underlying grammar through charts of their interest. Figure 7 illustrates this idea implemented as an alternative version of the Vega-Lite editor [58], supporting NL input. Users can enter queries through the text input box at the top of the page to specify charts and edit the specification on the left to modify the resulting visualization. Besides the main visualization returned in response to an NL query, the interface also presents a alternative visualizations using different encodings similar to the Voyager systems [64, 66].
This example is developed following a classic client-server architecture and is implemented as a Python Flask [12] application. From a development standpoint, the client-side of this application is written from scratch using HTML and JavaScript. On the Python server-side, a single call is made to NL4DV’s analyze_query(query) function where the query is collected and passed via JavaScript. As shown earlier (Listing 2), this function returns a JSON object composed of the attributeMap, taskMap, and visList. For this example, the visList returned by NL4DV is parsed in JavaScript to render the main chart along with the alternative designs (Listing 8, lines 5-8). The visualizations are rendered using Vega-Embed [59].
4.2.2 Recreating Ambiguity Widgets in DataTone
Consider a second example where we use NL4DV to replicate features of the DataTone system [13]. Given a NL query, DataTone identifies ambiguities in the query and surfaces them via “ambiguity widgets” (dropdown menus) that users can interact with to clarify their intent.
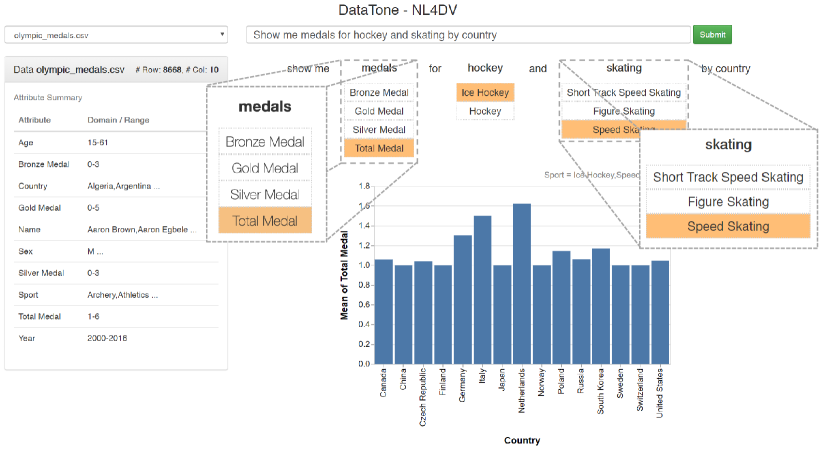
Figure 9 shows a DataTone-like interface implemented using NL4DV. This system is also implemented as a Flask web-application using HTML and JavaSript on the client-side. The example in Figure 9 illustrates the result of executing the query “Show me medals for hockey and skating by country” against an Olympics medal winners dataset (query reused from the DataTone paper [13]). Here, ‘medals’ is an ambiguous reference to four data attributes—the three medal types (Bronze, Silver, Gold) and the Total Medals. Similarly, ‘hockey’ and ‘skating’ are value-level ambiguities corresponding to the Sport attribute (e.g., ‘hockey’[Ice Hockey, Hockey]).
Similar to the Vega-Lite editor application, the server-side code only involves initializing NL4DV with the active dataset and making a call to the analyze_query(query) function to process user queries. As detailed in Listing 10, on the client-side, to highlight attribute- and value-level ambiguities in the query, we parse the attributeMap and taskMap returned by NL4DV in JavaScript, checking the isAmbiguous fields. Vega-Embed is once again used to render the vlSpecs returned as part of NL4DV’s visList. Note that we only focus on data ambiguity widgets in this example, not displaying design ambiguity widgets (e.g., dropdown menus for switching between visualization types). To generate design ambiguity widgets, however, developers can parse the visList, converting the Vega-Lite marks and encodings into dropdown menu options.
4.3 Adding NL Input to an Existing Visualization System
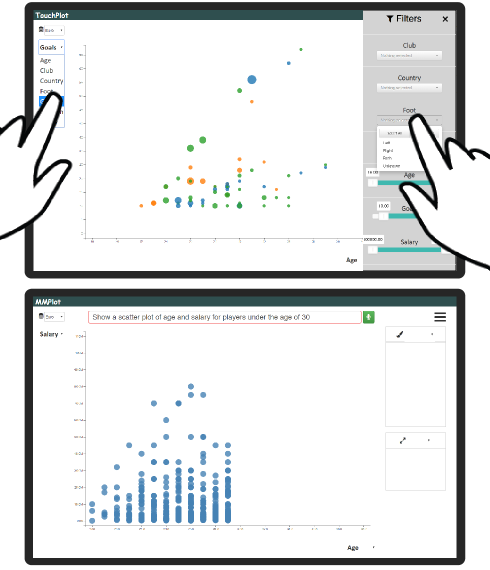
NL4DV can also be used to augment existing visualization systems with NL input. As an example, consider TouchPlot (Figure 11-top), a touch-based scatterplot visualization system running on a tablet. We modeled TouchPlot after the interface and capabilities of the scatterplot visualization system, Tangere [41]. Specifically, users can select points and zoom/pan by interacting directly with the chart canvas, bind attributes to the position, color, and size encodings using dropdown menus on axes and legends, or apply filters using a side panel. TouchPlot is implemented using HTML and JavaScript, and D3 is used for creating the visualization.
Recent work has shown that complementing touch interactions with speech can support a more fluid interaction experience during visual analysis on tablets [49]. For example, while touch can support fine-grained interactions with marks, speech can allow specifying filters without having to open and interact with the side panel, saving screen space and preserving the user workflow. To explore such fluid interactions, we developed MMPlot (Figure 11-bottom), a modified version of TouchPlot that supports multimodal touch and speech input. In addition to touch interactions, MMPlot allows issuing speech commands to specify charts (e.g., “Correlate age and salary by country”) and filter points (e.g., “Remove players over the age of 30”).
To support these interactions, we record speech input and convert it to a text string using the Web Speech API [61]. This query string is then passed to the server, where we make a call to NL4DV’s analyze_query(query). By parsing NL4DV’s response in JavaScript, TouchPlot is modified to support the required speech interactions (Listing 12). In particular, we parse the taskMap to detect and apply any filters requested as part of the query (lines 6-12). Next, we check if the input query specifies a new scatterplot that can be rendered by the system and adjust the view mappings accordingly (lines 13-16). This sequential parsing of taskMap and visList allows using speech to apply filters, specify new scatterplots, or do both with a single query (Figure 11). Unlike previous examples, since this application uses D3 (as opposed to Vega-Lite) to create the visualization, when parsing NL4DV’s output, we perform an added step of invoking the D3 code required to update the view (line 17).
Implementing the aforementioned examples (NL-based Vega-Lite editor, DataTone’s ambiguity widgets, MMPlot) would typically require developers to write hundreds of lines of code (in addition to the front-end code) requiring both NLP and visualization design knowledge (Figure 1). As illustrated above, with NL4DV, developers can accomplish the desired NLI capabilities with a single call to analyze_query() and a few additional lines of code to parse NL4DV’s response, enabling them to focus on the interface design and user experience.
5 Discussion and Future Work
5.1 Evaluation
In this paper, we illustrate NL4DV’s query interpretation capabilities through sample queries executed on different datasets111Additional queries available at: https://nl4dv.github.io/nl4dv/showcase.html. As part of this initial validation, we used NL4DV to query tabular datasets containing 300-6000 rows and up to 27 attributes. The toolkit’s response time for these queries ranged between 1-18 sec. (mean: 3 sec.)222Reported based on a MacBook Pro with a 6-core 2.9GHz processor and 16GB RAM running MacOS Catalina version 10.15.5. Besides sample queries, we also present applications employing NL4DV to highlight how the toolkit can reduce development viscosity and lower skill barriers (in terms of prior knowledge of NLP tools and techniques) [38]. However, assessing the toolkit’s usability and utility likely involves a more detailed evaluation in two ways. First, we need to formally benchmark NL4DV’s performance by executing it against a large corpus of NL queries. To this end, an important area for future work is to collect labeled data on utterances people use to specify visualizations and use it to benchmark NL4DV and other visualization NLIs. Second, we need to conduct a longitudinal study incorporating feedback from both visualization and NLP developers. Going forward, we hope that the open-source nature of this research will help us conduct such a study in the wild, enabling us to assess NL4DV’s practical usability, identify potential issues, and understand the breadth of possible applications.
5.2 Supporting Follow-up Queries
NL input presents the opportunity to support a richer visual analytic dialog through conversational interaction (as opposed to one-off utterances). For example, instead of a single query including both visualization specification and filtering requests (e.g., “Show a scatterplot of gross and budget highlighting only Action and Adventure movies”), one can issue a shorter query to first gain an overview by specifying a visualization (e.g., “Show a scatterplot of gross and budget”) and then issue a follow-up query to apply filters (e.g., “Now just show Action and Adventure movies”). However, supporting such a dialog through an interface-agnostic toolkit is challenging as it requires the toolkit to have context of system state in which the query was issued. Furthermore, not all queries in a dialog may be follow-up queries. While current systems like Evizeon [22] allow users to reset the canvas to reset the query context, explicitly specifying when context should be preserved/cleared while operating an interface-agnostic toolkit is impractical.
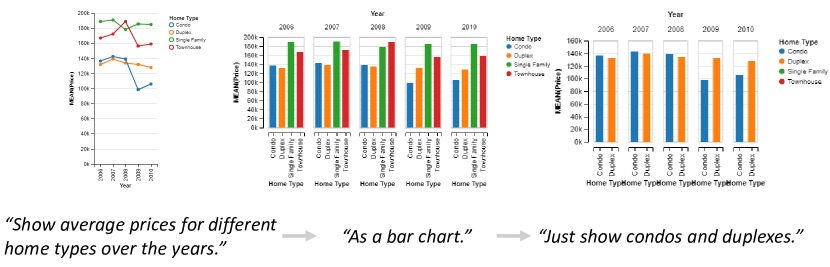
NL4DV currently does not support follow-up queries. However, as a first pass at addressing these challenges, we are experimenting with an additional dialog parameter to analyze_query() and render_vis() to support follow-up queries involving filtering and encoding changes. Specifically, setting dialogtrue notifies NL4DV to check for follow-up queries. NL4DV uses conversational centering techniques [15, 16] similar to prior visualization NLIs [22, 52, 50] to identify missing attributes, tasks, or visualization details in a query based on the toolkit’s previous response. Consider the example in Figure 13 showing queries issued in the context of a housing dataset. In response to the first query “Show average prices for different home types over the years,” NL4DV generates a line chart by detecting the attributes Price, House Type, and Year, and the task Derived Value (with the operator AVG). Next, given the follow-up query “As a bar chart,” NL4DV infers the attributes and tasks from its previous response, updating the mark type and encoding channels in the Vega-Lite specification to create a grouped bar chart. Lastly, with the third query, “Just show condos and duplexes,” detecting ‘condos’ and ‘duplexes’ as data values, NL4DV modifies the underlying taskMap and applies a filter on the House Type attribute. Besides implementing additional parameters and functions to support conversational interaction in NL4DV, a general future research challenge is to investigate how interface context (e.g., active encodings, selections) can be modeled into a structured format that can be interpreted by interface-agnostic toolkits like NL4DV.
5.3 Improving Query Interpretation and Enabling Additional Query Types
Through our initial testing, we have already identified some areas for improvement in NL4DV’s interpretation pipeline. One of these is better inference of attribute types upon initialization. To this end, we are looking into how we can augment NL4DV’s data interpretation pipeline with recent semantic data type detection models that use both attribute names and values (e.g., [70, 23]). Another area for improvement is task detection. NL4DV currently leverages a combination of lexicon- and dependency-based approach to infer tasks. Although this serves as a viable starting point, it is less reliable when there is uncertainty in the task keywords (e.g., the word “relationship” may not always map to a Correlation task) or the keywords conflict with data attributes (e.g., the query “Show the average cost of schools by region” would currently apply a Derived Value task on the Average Cost attribute even though Average Cost already represents a derived value). As we collect more user queries, we are exploring ways to complement the current approach with semantic parsers (e.g., [2, 3]) and contemporary deep learning models (e.g., [68, 7]) that can infer tasks based on the query phrasing and structure. Finally, a third area for improvement is to connect NL4DV to knowledge bases like WolframAlpha [63] to semantically understand words in the input query. Incorporating such connections will help resolve vague predicates for data values (e.g., ‘large’, ‘expensive’, ‘near’) [46, 47] and may also reduce the need for developers to manually configure attribute aliases.
Besides improving query interpretation, another theme for future work is to support additional query types. As stated earlier, NL4DV is currently primarily geared to support visualization specification-oriented queries (e.g., “What is the relationship between worldwide gross and content rating?,” “Create a bar chart showing average profit by state”). To aid development of full-fledged visualization systems, however, the toolkit needs to support a tighter coupling with an active visualization and enable other tasks such as question answering [25] (e.g., “How many movies grossed over 100M?,” “When was the difference between the two stocks the highest?”) and formatting visualizations (e.g., “Color SUVs green,” “Highlight labels for countries with a population of more than 200M”). Incorporating these new query types would entail making changes in terms of both the interpretation strategies (to identify new task categories and their parameters) and the output format (to include the computed “answers” and changes to the view).
5.4 Balancing Simplicity and Customization
NL4DV is currently targeted towards visualization developers who may not have a strong NLP background (DG1). As such, NL4DV uses a number of default settings (e.g., preset rules for dependency parsing, empirically set thresholds for attribute detection) to minimize the learning curve and facilitate ease-of-use. Developers can override some of these defaults (e.g., replace CoreNLP with spaCy [21], adjust similarity matching thresholds) and also configure dataset-specific settings to improve query interpretation (e.g., attribute aliases, special words referring to data values, additional stopwords to ignore) (DG4). Furthermore, by invoking analyze_query() with the debug parameter set to true, developers can also get additional details such as why an attribute was detected (e.g., semantic vs. syntactic match along with the match score) or how a chart was implicitly inferred (e.g., using attributes vs. attributes and tasks).
NLP or visualization experts, however, may prefer using custom modules for query processing or visualization recommendation. To this end, visualization developers can override the toolkit’s default recommendation engine by using the inferred attributes and tasks as input to their custom modules (i.e., ignoring the visList). However, NL4DV currently does not support using custom NLP models for attribute and task inference (e.g., using word embedding techniques to detect synonyms or classification models to identify tasks). Going forward, as we gather feedback on the types of customizations developers prefer, we hope to provide the option for developers to replace NL4DV’s heuristic modules with contemporary ML models/techniques. Given the end goal of aiding prototyping of visualization NLIs, a challenge in supporting this customization, however, is to ensure that the output from the custom models can be compiled into NL4DV’s output specification or to modify NL4DV’s specification to accommodate additional information (e.g., classification accuracy) generated by the custom models.
6 Conclusion
We present NL4DV, a toolkit that supports prototyping visualization NLIs. Given a dataset and a NL query, NL4DV generates a JSON-based analytic specification composing of attributes, tasks, and visualizations inferred from the query. Through example applications, we show how developers can use this JSON response to create visualizations in Jupyter notebooks through NL, develop web-based visualization NLIs, and augment existing visualization tools with NL interaction. We provide NL4DV and the example applications as open-source software (https://nl4dv.github.io/nl4dv/) and hope these will serve as valuable resources to advance research on NLIs for data visualization.
Acknowledgements.
This work was supported in part by a National Science Foundation Grant IIS-1717111.References
- [1] R. Amar, J. Eagan, and J. Stasko. Low-level components of analytic activity in information visualization. In Proceedings of IEEE InfoVis, pages 111–117, 2005.
- [2] J. Berant, A. Chou, R. Frostig, and P. Liang. Semantic parsing on freebase from question-answer pairs. In Proceedings of the EMNLP, pages 1533–1544. ACL, 2013.
- [3] J. Berant and P. Liang. Semantic parsing via paraphrasing. In Proceedings of the 52nd Annual Meeting of the ACL (Volume 1: Long Papers), pages 1415–1425, 2014.
- [4] L. Blunschi, C. Jossen, D. Kossmann, M. Mori, and K. Stockinger. Soda: Generating sql for business users. Proceedings of the VLDB Endowment, 5(10):932–943, 2012.
- [5] M. Bostock and J. Heer. Protovis: A graphical toolkit for visualization. IEEE Transactions on Visualization and Computer Graphics, 15(6):1121–1128, 2009.
- [6] M. Bostock, V. Ogievetsky, and J. Heer. D3: data-driven documents. IEEE Transactions on Visualization and Computer Graphics, 17(12):2301–2309, 2011.
- [7] T. B. Brown, B. Mann, N. Ryder, M. Subbiah, J. Kaplan, P. Dhariwal, A. Neelakantan, P. Shyam, G. Sastry, A. Askell, et al. Language models are few-shot learners. arXiv preprint arXiv:2005.14165, 2020.
- [8] S. M. Casner. Task-analytic approach to the automated design of graphic presentations. ACM Transactions on Graphics (ToG), 10(2):111–151, 1991.
- [9] Y. Chen, J. Yang, and W. Ribarsky. Toward effective insight management in visual analytics systems. In Proceedings of IEEE PacificVis, pages 49–56, 2009.
- [10] K. Cox, R. E. Grinter, S. L. Hibino, L. J. Jagadeesan, and D. Mantilla. A multi-modal natural language interface to an information visualization environment. International Journal of Speech Technology, 4(3-4):297–314, 2001.
- [11] J. R. Finkel, T. Grenager, and C. Manning. Incorporating non-local information into information extraction systems by gibbs sampling. In Proceedings of ACL, pages 363–370, 2005.
- [12] Flask. https://palletsprojects.com/p/flask/.
- [13] T. Gao, M. Dontcheva, E. Adar, Z. Liu, and K. G. Karahalios. DataTone: Managing ambiguity in natural language interfaces for data visualization. In Proceedings of ACM UIST, pages 489–500, 2015.
- [14] D. Gotz and Z. Wen. Behavior-driven visualization recommendation. In Proceedings of ACM IUI, pages 315–324, 2009.
- [15] B. J. Grosz and C. L. Sidner. Attention, intentions, and the structure of discourse. Computational linguistics, 12(3):175–204, 1986.
- [16] B. J. Grosz, S. Weinstein, and A. K. Joshi. Centering: A framework for modeling the local coherence of discourse. Computational linguistics, 21(2):203–225, 1995.
- [17] P. He, Y. Mao, K. Chakrabarti, and W. Chen. X-SQL: reinforce schema representation with context. arXiv preprint arXiv:1908.08113, 2019.
- [18] J. Heer and M. Bostock. Declarative language design for interactive visualization. IEEE Transactions on Visualization and Computer Graphics, 16(6):1149–1156, 2010.
- [19] J. Heer, S. K. Card, and J. A. Landay. Prefuse: a toolkit for interactive information visualization. In Proceedings of ACM CHI, pages 421–430, 2005.
- [20] J. Herzig, P. K. Nowak, T. Müller, F. Piccinno, and J. M. Eisenschlos. TAPAS: Weakly Supervised Table Parsing via Pre-training. arXiv preprint arXiv:2004.02349, 2020.
- [21] M. Honnibal and I. Montani. spacy 2: Natural language understanding with bloom embeddings. Convolutional Neural Networks and Incremental Parsing, 2017.
- [22] E. Hoque, V. Setlur, M. Tory, and I. Dykeman. Applying pragmatics principles for interaction with visual analytics. IEEE Transactions on Visualization and Computer Graphics, 24(1):309–318, 2018.
- [23] M. Hulsebos, K. Hu, M. Bakker, E. Zgraggen, A. Satyanarayan, T. Kraska, c. Demiralp, and C. Hidalgo. Sherlock: A deep learning approach to semantic data type detection. In Proceedings of SIGKDD. ACM, 2019.
- [24] J.-F. Kassel and M. Rohs. Valletto: A multimodal interface for ubiquitous visual analytics. In ACM CHI ’18 Extended Abstracts, 2018.
- [25] D. H. Kim, E. Hoque, and M. Agrawala. Answering questions about charts and generating visual explanations. In Proceedings of ACM CHI, pages :1–:13, 2020.
- [26] Y. Kim and J. Heer. Assessing effects of task and data distribution on the effectiveness of visual encodings. In Computer Graphics Forum, volume 37, pages 157–167. Wiley Online Library, 2018.
- [27] A. Kumar, J. Aurisano, B. Di Eugenio, A. Johnson, A. Gonzalez, and J. Leigh. Towards a dialogue system that supports rich visualizations of data. In Proceedings of the SIGDIAL, pages 304–309, 2016.
- [28] D. Ledo, S. Houben, J. Vermeulen, N. Marquardt, L. Oehlberg, and S. Greenberg. Evaluation strategies for hci toolkit research. In Proceedings of ACM CHI, pages 1–17, 2018.
- [29] F. Li and H. V. Jagadish. NaLIR: an interactive natural language interface for querying relational databases. In Proceedings of the ACM SIGMOD, pages 709–712, 2014.
- [30] H. Lin, D. Moritz, and J. Heer. Dziban: Balancing agency & automation in visualization design via anchored recommendations. In Proceedings of ACM CHI, pages 751:1–751:12, 2020.
- [31] E. Loper and S. Bird. NLTK: The natural language toolkit. In Proceedings of ACL Workshop on Effective Tools and Methodologies for Teaching Natural Language Processing and Computational Linguistics, pages 63–70, 2002.
- [32] J. Mackinlay, P. Hanrahan, and C. Stolte. Show Me: Automatic presentation for visual analysis. IEEE Transactions on Visualization and Computer Graphics, 13(6):1137–1144, 2007.
- [33] C. D. Manning, M. Surdeanu, J. Bauer, J. R. Finkel, S. Bethard, and D. McClosky. The Stanford CoreNLP natural language processing toolkit. In Proceedings of ACL: System Demonstrations, pages 55–60, 2014.
- [34] Microsoft Power BI. https://powerbi.microsoft.com/en-us.
- [35] G. A. Miller. WordNet: a lexical database for english. Communications of the ACM, 38(11):39–41, 1995.
- [36] D. Moritz, C. Wang, G. L. Nelson, H. Lin, A. M. Smith, B. Howe, and J. Heer. Formalizing visualization design knowledge as constraints: Actionable and extensible models in draco. IEEE Transactions on Visualization and Computer Graphics, 25(1):438–448, 2018.
- [37] B. Myers, S. E. Hudson, and R. Pausch. Past, present, and future of user interface software tools. ACM Transactions on Computer-Human Interaction, 7(1):3–28, 2000.
- [38] D. R. Olsen Jr. Evaluating user interface systems research. In Proceedings of ACM UIST, pages 251–258, 2007.
- [39] P. Pasupat and P. Liang. Compositional semantic parsing on semi-structured tables. In Proceedings of IJCNLP, pages 1470–1480. ACL, 2015.
- [40] A.-M. Popescu, O. Etzioni, and H. Kautz. Towards a theory of natural language interfaces to databases. In Proceedings of IUI, pages 149–157. ACM, 2003.
- [41] R. Sadana and J. Stasko. Designing and implementing an interactive scatterplot visualization for a tablet computer. In Proceedings of AVI, pages 265–272, 2014.
- [42] B. Saket, A. Endert, and Ç. Demiralp. Task-based effectiveness of basic visualizations. IEEE Transactions on Visualization and Computer Graphics, 25(7):2505–2512, 2018.
- [43] A. Satyanarayan, D. Moritz, K. Wongsuphasawat, and J. Heer. Vega-Lite: A grammar of interactive graphics. IEEE Transactions on Visualization and Computer Graphics, 23(1):341–350, 2016.
- [44] A. Satyanarayan, R. Russell, J. Hoffswell, and J. Heer. Reactive vega: A streaming dataflow architecture for declarative interactive visualization. IEEE Transactions on Visualization and Computer Graphics, 22(1):659–668, 2015.
- [45] M. Schwab, J. Tompkin, J. Huang, and M. A. Borkin. Easypz. js: Interaction binding for pan and zoom visualizations. In Proceedings of IEEE VIS: Short Papers, pages 31–35, 2019.
- [46] V. Setlur, S. E. Battersby, M. Tory, R. Gossweiler, and A. X. Chang. Eviza: A natural language interface for visual analysis. In Proceedings of ACM UIST, pages 365–377, 2016.
- [47] V. Setlur, M. Tory, and A. Djalali. Inferencing underspecified natural language utterances in visual analysis. In Proceedings of ACM IUI, pages 40–51, 2019.
- [48] R. Sicat, J. Li, J. Choi, M. Cordeil, W.-K. Jeong, B. Bach, and H. Pfister. Dxr: A toolkit for building immersive data visualizations. IEEE Transactions on Visualization and Computer Graphics, 25(1):715–725, 2018.
- [49] A. Srinivasan, B. Lee, N. H. Riche, S. M. Drucker, and K. Hinckley. InChorus: Designing consistent multimodal interactions for data visualization on tablet devices. In Proceedings of ACM CHI, pages 653:1–653:13, 2020.
- [50] A. Srinivasan, B. Lee, and J. T. Stasko. Interweaving multimodal interaction with flexible unit visualizations for data exploration. IEEE Transactions on Visualization and Computer Graphics, 2020.
- [51] A. Srinivasan and J. Stasko. Natural language interfaces for data analysis with visualization: Considering what has and could be asked. In Proceedings of EuroVis: Short Papers, pages 55–59, 2017.
- [52] A. Srinivasan and J. Stasko. Orko: Facilitating multimodal interaction for visual exploration and analysis of networks. IEEE Transactions on Visualization and Computer Graphics, 24(1):511–521, 2018.
- [53] C. Stolte, D. Tang, and P. Hanrahan. Polaris: A system for query, analysis, and visualization of multidimensional relational databases. IEEE Transactions on Visualization and Computer Graphics, 8(1):52–65, 2002.
- [54] Y. Sun, J. Leigh, A. Johnson, and S. Lee. Articulate: A semi-automated model for translating natural language queries into meaningful visualizations. In Proceedings of the International Symposium on Smart Graphics, pages 184–195, 2010.
- [55] Tableau Ask Data. https://www.tableau.com/about/blog/2018/10/announcing-20191-beta-96449.
- [56] M. Tory and V. Setlur. Do what i mean, not what i say! design considerations for supporting intent and context in analytical conversation. In Proceedings of IEEE VAST, pages 93–103, 2019.
- [57] Unity. https://unity.com/.
- [58] Vega editor. https://vega.github.io/editor/.
- [59] Vega-embed. https://github.com/vega/vega-embed.
- [60] C. Wang, K. Tatwawadi, M. Brockschmidt, P.-S. Huang, Y. Mao, O. Polozov, and R. Singh. Robust Text-to-SQL generation with execution-guided decoding. arXiv preprint arXiv:1807.03100, 2018.
- [61] https://developer.mozilla.org/en-US/docs/Web/API/Web_Speech_API, 2019.
- [62] L. Wilkinson. The grammar of graphics. Springer Science & Business Media, 2013.
- [63] WolframAlpha. https://www.wolframalpha.com/.
- [64] K. Wongsuphasawat, D. Moritz, A. Anand, J. Mackinlay, B. Howe, and J. Heer. Voyager: Exploratory analysis via faceted browsing of visualization recommendations. IEEE transactions on visualization and computer graphics, 22(1):649–658, 2015.
- [65] K. Wongsuphasawat, D. Moritz, A. Anand, J. Mackinlay, B. Howe, and J. Heer. Towards a general-purpose query language for visualization recommendation. In Proceedings of the HILDA Workshop, pages 1–6, 2016.
- [66] K. Wongsuphasawat, Z. Qu, D. Moritz, R. Chang, F. Ouk, A. Anand, J. Mackinlay, B. Howe, and J. Heer. Voyager 2: Augmenting visual analysis with partial view specifications. In Proceedings of ACM CHI, pages 2648–2659, 2017.
- [67] Z. Wu and M. Palmer. Verbs semantics and lexical selection. In Proceedings of ACL, pages 133–138, 1994.
- [68] T. Young, D. Hazarika, S. Poria, and E. Cambria. Recent trends in deep learning based natural language processing. IEEE Computational Intelligence magazine, 13(3):55–75, 2018.
- [69] B. Yu and C. T. Silva. FlowSense: A natural language interface for visual data exploration within a dataflow system. IEEE Transactions on Visualization and Computer Graphics, 26(1):1–11, 2019.
- [70] D. Zhang, Y. Suhara, J. Li, M. Hulsebos, Ç. Demiralp, and W.-C. Tan. Sato: Contextual semantic type detection in tables. arXiv preprint arXiv:1911.06311, 2019.
- [71] V. Zhong, C. Xiong, and R. Socher. Seq2SQL: Generating Structured Queries from Natural Language using Reinforcement Learning. CoRR, abs/1709.00103, 2017.