Beta decay of the very neutron-deficient 60Ge and 62Ge nuclei
Abstract
We report here the results of a study of the decay of the proton-rich Ge isotopes, 60Ge and 62Ge, produced in an experiment at the RIKEN Nishina Center. We have improved our knowledge of the half-lives of 62Ge (73.5(1) ms), 60Ge (25.0(3) ms) and its daughter nucleus, 60Ga (69.4(2) ms). We measured individual -delayed proton and emissions and their related branching ratios. Decay schemes and absolute Fermi and Gamow-Teller transition strengths have been determined. The mass excesses of the nuclei under study have been deduced. A total -delayed proton-emission branching ratio of 67(3)% has been obtained for 60Ge. New information has been obtained on the energy levels populated in 60Ga and on the 1/2- excited state in the daughter 59Zn. We extracted a ground state to ground state feeding of 85.3(3)% for the decay of 62Ge. Eight new lines have been added to the de-excitation of levels populated in the 62Ga daughter.
pacs:
23.40.-s, 23.50.+z, 21.10.-k, 27.50.+e.I Introduction
The investigation of nuclear structure close to the limits of nuclear existence is one of the frontiers of modern Nuclear Physics. The study of the properties of exotic nuclei is crucial to provide tests of the predictions of nuclear models at extreme values of isospin. The experimental challenge involved with the production of such unstable nuclei has resulted in a worldwide effort to build next-generation facilities producing and accelerating radioactive ion beams (RIBs) of very high intensity. Heavy neutron-deficient nuclei can now be produced up to the proton drip-line, enabling the realization of detailed decay studies and the observation of new exotic decay modes Blank and Borge (2008); Pfützner et al. (2012); Orrigo et al. (2014, 2016a).
The structural properties of exotic proton-rich nuclei are also important for Nuclear Astrophysics, because many of them lie on the -process (rapid proton-capture) reaction pathway leading to the production of the heavy elements in the Universe in explosive stellar environments Schatz et al. (1998); Fisker et al. (2008); Parikh et al. (2013); Galloway et al. (2004).
Decay spectroscopy experiments with implanted RIBs are a powerful tool to explore the properties of exotic nuclei and provide rich spectroscopic information: -decay half-lives, delayed emission of rays, particle-decay branching ratios (commonly protons are emitted in the case of proton-rich nuclei), excited states populated in the daughter nucleus, and so on. Furthermore decay provides direct access to the absolute values of the Fermi (F) and Gamow-Teller (GT) transition strengths.
In this paper we present new results on the decay of the neutron-deficient Ge isotopes, 62Ge and 60Ge. They were produced and implanted in unprecedented numbers at the Radioactive Ion Beam Factory (RIBF) of the RIKEN Nishina Center (Japan) thanks to the availability of a high-intensity beam of 78Kr. 62Ge is a nucleus about which little was known at the time of our experiment. 60Ge is a nucleus whose decay is almost unknown, apart from a first measurement of its half-life with 28 events Ciemny et al. (2016). 60Ge is a semi-magic = 28 isotone and the heaviest one for which the mirror 60Ni nucleus is stable, allowing one to explore mirror symmetry. The 60Ga daughter lies right at the proton drip-line and nothing is known of its level scheme. Hence our study provides brand new information.
In a more general context, this work is part of a systematic study of proton-rich nuclei which we have carried out at different RIB facilities Orrigo et al. (2014, 2016a, 2016b); Kucuk et al. (2017); Molina et al. (2015), also in comparison with mirror charge-exchange experiments done on the mirror stable target Fujita et al. (2011). One focus of interest for the nuclei such as 60Ge is to explore the competition between the de-excitation and (isospin-forbidden) proton emission from the = 2 Isobaric Analogue State (IAS), that is populated in the daughter nucleus by the decay. This feature has been observed in all the lighter systems already studied Orrigo et al. (2014, 2016a). The nuclei such as 62Ge are also of interest to check whether the suppression of the isoscalar transitions between = 1+, = 0 states (Warburton and Weneser - Morpurgo (1958); Wilkinson (1969)) observed in previous cases Molina et al. (2015) persists.
The paper is organized as follows. Section II describes the experiment and the setup. The details of the data analysis are described in Section III. The results obtained on the decay of 60Ge are given in Section IV, together with new results on the decay of the 60Ga daughter. Section V shows the results on the decay of 62Ge. Finally, Section VI summarises the conclusions.
II The experiment
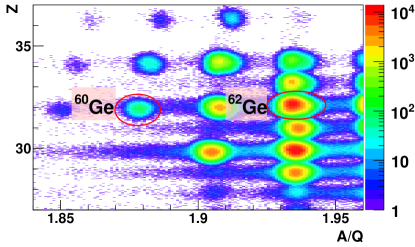
The 60Ge and 62Ge proton-rich nuclei were produced with unprecedented intensity in an experiment performed at RIBF, RIKEN Nishina Center (Japan). A high-intensity (up to 250 pnA) 78Kr primary beam was accelerated to 345 MeV/nucleon and fragmented on a 9Be target with thickness of 5 mm. The exotic fragments produced in this way were separated, selected and identified in the BigRIPS separator Kubo (2003); Kubo et al. (2012) by means of the method Fukuda et al. (2013). A series of parallel-plate avalanche counters (PPAC), multisampling ionization chambers (MUSIC) and plastic scintillators constitute the detection setup of BigRIPS and are employed to measure the position of the transmitted ions at different focal planes (which is related to the magnetic rigidity ), their energy loss and time of flight , respectively. Standard particle-identification procedures, together with additional off-line cuts on the BigRIPS variables to remove background events thoroughly, allow one to identify the ions by their atomic number and mass-to-charge ratio with high resolution Fukuda et al. (2013); Blank et al. (2016). An example of the two-dimensional identification matrix obtained for the BigRIPS setting optimized for 65Br is shown in Fig. 1, where the positions of 60Ge and 62Ge are indicated. It should be noted that the odd 59Ge and 61Ge isotopes were also produced and their decay was studied in Refs. Blank et al. (2016); Goigoux et al. (2016).
The selected and identified fragments were then transmitted to the exit of the ZeroDegree spectrometer (ZDS) Kubo et al. (2012) where a setup for -decay spectroscopy was installed. This setup consisted of the Wide-range Active Silicon Strip Stopper Array for Beta and ion detection (WAS3ABi) Nishimura (2012) and the EUroball-RIKEN Cluster Array (EURICA) Söderström et al. (2013). A common timestamp with a frequency of 108 Hz was used to correlate the data acquisition systems of BigRIPS, WAS3ABi and EURICA.
The WAS3ABi array was used to detect both the implanted heavy-ions and subsequent charged-particle ( particles and protons) decays, measuring their energy, position and time. WAS3ABi consisted of three 1-mm-thick Double-Sided Silicon-Strip Detectors (DSSSD), each one having a 64 cm2 area. Each DSSSD was segmented into 60 vertical () and 40 horizontal () strips with a pitch of 1 mm, defining a total of 2400 pixels. Each strip was read individually by standard analogue electronics providing energy and time signals. A plastic scintillator was placed behind WAS3ABi acting as a veto, i.e., tagging the fragments that were not stopped inside WAS3ABi and also those undergoing secondary reactions in WAS3ABi.
In order to optimize the resolution for the particles, the gain was set to achieve a full energy range of 4 MeV for the strips, while the energy range of the strips was increased to 10 MeV to allow the detection of high-energy protons. Known -delayed proton emitters (57Zn, 61Ge and 65Se) produced during the experiment, together with conversion electrons from a 207Bi source, were used for the energy calibration of WAS3ABi Goigoux et al. (2016).
An implantation signal in WAS3ABi is characterised by an overflow energy signal. This is because the implanted fragments reach the array with energies well above 1 GeV and, with the gain settings mentioned above, they saturate the electronics. Since it is not only the implantation strip that saturates, but also the neighbouring ones, the position (,) at which the implantation took place was determined by the fastest and strips to fire.
WAS3ABi was surrounded by the EURICA array Söderström et al. (2013), employed to detect both the prompt and -delayed rays after the implantation event and measure their energies and times. In the present experiment EURICA used a total of 84 high-purity germanium detectors, arranged in 12 clusters containing 7 Ge crystals each. The -ray signals were acquired up to 100 s after WAS3ABi provided a trigger in order to allow for the detection of the decay of isomeric states. EURICA was calibrated in energy using rays from 133Ba, 152Eu and 244Cm sources Söderström et al. (2013). The efficiency was calibrated using the 133Ba and 152Eu sources, together with known rays from 129Cd and 132Sn observed in a previous experiment Taprogge et al. (2015). The array had an absolute detection efficiency of 10% at 662 keV Morales et al. (2017).
III The data analysis
During the experimental campaign BigRIPS was optimised for different settings Goigoux et al. (2016); Morales et al. (2017). In the present paper we report the analysis of data from two of them. The first was a setting optimised for 65Br, where both 60Ge and 62Ge were implanted. The second was optimised for 64Se, where only 62Ge was implanted. The WAS3ABi deadtime fraction , determined by comparing free and accepted triggers recorded for each run, was 22(3)% for the first setting (60Ge) and 26(3)% for the combination of both settings (62Ge).
Provided that the ions were identified in BigRIPS as explained in Section II, an implantation event had also to simultaneously satisfying the following conditions: (a) a signal in the last fast-plastic scintillator (F11) of the BigRIPS+ZDS spectrometer setup, (b) an overflow energy signal in WAS3ABi and (c) no signal in the veto plastic behind WAS3ABi. A -decay event was defined as an event simultaneously satisfying the following conditions: (A) no signal in F11, (B) no overflow energy signal in the strips of WAS3ABi and (C) an energy signal above threshold (typically 50 keV) in WAS3ABi.
Standard techniques, extensively described in Section III of Ref. Orrigo et al. (2016a), were employed to perform the data analysis, starting with the time correlations between implantation and decay events, the construction of the charged-particle decay-energy spectrum and the -delayed -ray energy spectrum for decay events correlated with implantations of a given nuclear species and the determination of the Fermi and Gamow-Teller transition strengths.
In particular, in the present case, for a specified DSSSD in WAS3ABi each implantation event was correlated in time with any decay event occurring before and after it in the same pixel and in the 8 pixels surrounding it. This is because given the smaller size of the pixels, namely 1 mm2, the truly-correlated decay event may also occur in one of the closest pixels. This procedure accounts for the true time correlations, but at the price of introducing many random correlations. These latter will contribute to a flat background in the correlation-time spectrum which adds to the typical decay curve described by the Bateman equations Bateman (1910) and can easily be taken into account in the half-life fit Orrigo et al. (2016a). Here the time correlations were performed over a period of time of [-1 s, +1 s], where the backward-correlations part [-1 s, 0] clearly includes only random correlations and is used in the background estimation procedure. The half-life results are reported with their statistical uncertainties.
For a given nuclear species, the charged-particle decay-energy spectrum measured in WAS3ABi was obtained as the sum of the spectra from all the pixels. As in Ref. Orrigo et al. (2016a) a clean decay-energy spectrum was formed by subtracting a background energy spectrum, constructed by setting a gate of [-1 s, 0] on the correlation time, from the decay-energy spectrum constructed in [0, 1 s].
The -ray energy spectrum correlated with implantations of a given nuclear species was obtained by summing all the Ge crystals of EURICA, producing spectra both with and without addback. It should be noted that in this paper we show those with addback. A similar background subtraction procedure was employed to obtain a clean -energy spectrum, using the same gates of [-1 s, 0] and [0, 1 s] on the correlation time. In addition, the -ray time was restricted to [0, 800 ns] with respect to the decay signal in WAS3ABI.
IV Beta decay of 60Ge
The exotic neutron-deficient 60Ge nucleus is a special system to study. It is a semi-magic = 28 isotone and the heaviest one for which the mirror nucleus (60Ni) is stable, which makes it easier to investigate mirror symmetry. Furthermore, the decay of 60Ge is almost unknown. Nothing is known about the level scheme of the 60Ga daughter, which is a nucleus lying right at the proton drip-line. There exists a first measurement of the half-life of 60Ge Ciemny et al. (2016) with 28 implantation events (19 of them with observation of -delayed protons). The RIKEN high-intensity 78Kr beam allowed us to achieve the unprecedented statistics of 1.5104 implants of 60Ge. Moreover, 60Ge is a nucleus, hence its study may shed light on the possible competition between the -delayed proton emission and de-excitation from the IAS in the daughter, as already observed in the decay of lighter systems Dossat et al. (2007); Orrigo et al. (2014, 2016a).
The charged-particle energy spectrum for decay events correlated with 60Ge implants is shown in Fig. 2. The bump visible in Fig. 2(a) at low energy is due to the detection of particles and is fitted by an exponential function (green line). Eight peaks are observed at higher energy, corresponding to -delayed proton emission. Their fit is shown in Fig. 2(b). The best candidate for the de-excitation of the IAS of 60Ge in 60Ga is the most intense peak at = 2522 keV which, as explained later in the text, corresponds to an excitation energy = 2612 keV in 60Ga. As expected in this kind of experiment, the summing of the proton signals with those of the coincident particles affects the line shape of the peaks. Following our procedure Orrigo et al. (2014, 2016a), the line shape was determined by Monte Carlo simulations and checked by fitting the well-known 57Zn peaks. The decay energies and their intensities per 100 decays are shown in Table 1. It should be noted that is the total energy released in the proton decay including the energy of the recoiling nucleus.
Fig. 3 shows the correlation-time spectrum obtained for 60Ge selecting only the -delayed proton decays, by setting the condition WAS3ABi energy 1 MeV. The half-life is determined by a least squares fit to the data including the parent activity and a linear background, fixed by a fit to the backward-correlations part, as in Ref. Orrigo et al. (2016a). A value of = 25.0(3) ms was obtained for 60Ge. A fit using a maximum likelihood minimization method gives a consistent result. We have improved the precision on the half-life value in comparison with the only existing measured value of 20 ms Ciemny et al. (2016).
The total proton-emission branching ratio is determined, as in Ref. Orrigo et al. (2016a), by comparing the total number of protons, (obtained from the fit shown in Fig. 3), with the total number of implanted nuclei, , according to:
| (1) |
where is the deadtime fraction (see Section III). A value = 67(3)% is obtained, where the uncertainty takes into account both the statistical and systematics ones. The latter was estimated as previously Dossat et al. (2007); Orrigo et al. (2016a) by repeating the determination of changing the condition on the energy by 100 keV.
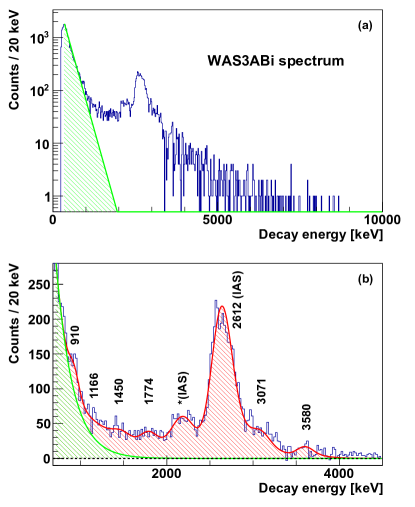
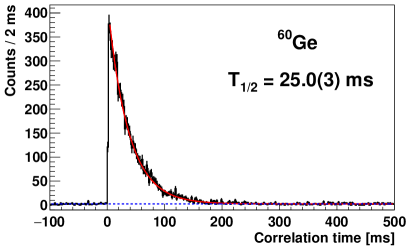
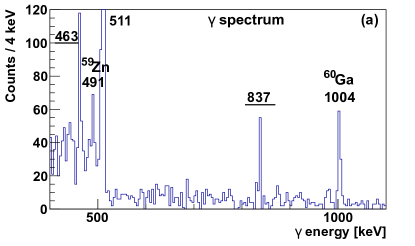
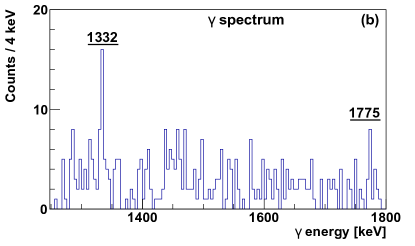
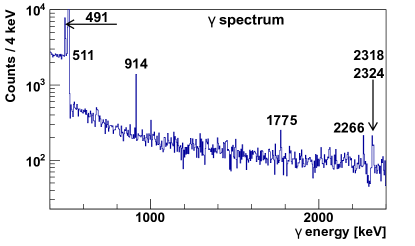
Fig. 4 shows the -ray energy spectrum from the decay of 60Ge () to 60Ga (). Besides the 511 keV line associated with the annihilation of the positrons emitted in the decay, seven lines are observed at 463, 491, 837, 1004, 1332, 1775 and 3848 keV. These transitions belong to different nuclei in the decay chain of 60Ge, as we discuss in detail below. The lines which we observe for the first time are underlined in the figure. In particular, the lines at 837, 1332 and 1775 keV are associated with the de-excitation of states in the 60Ga daughter. The energies and intensities of all the rays observed in Fig. 4 are given in Table 1. The intensities are obtained as:
| (2) |
where represents the number of counts obtained from the integral of the peak and is the corresponding efficiency for detection (Section II). The data acquisition system was triggered by either an implantation event or a decay event and the rays were not included in the trigger. They were acquired in coincidence with decay events ( or p) and thus affected by the decay detection efficiency . This efficiency was estimated as in Ref. Orrigo et al. (2016a) and it was 58(2)% for rays coincident with pure events, and 1 for the 463 keV ray coincident with p events.
| -delayed proton emission | -delayed de-excitation | ||
|---|---|---|---|
| (keV) | (%) | (keV) | (%) |
| 820(13) | 2.8(4) | 463.3(1) | 8(1) |
| 1076(23) | 4.0(5) | 491.2(2) | 7(1) |
| 1359(19) | 5.1(4) | 837.2(2) | 9(1) |
| 1684(17) | 4.2(3) | 1003.3(2) | 15(2) |
| 2067(15)a | 10.2(5) | 1332.3(4) | 4(1) |
| 2522(15)b | 33(1) | 1774.6(9) | 2(1) |
| 2981(23) | 3.2(3) | 3848.0(9) | 13(3) |
| 3490(22) | 1.9(2) | ||
a IAS proton emission to the first excited state of 59Zn.
b IAS proton emission to the g.s. of 59Zn.

| (keV) | (%) | (keV)a | ab | (%)ac |
|---|---|---|---|---|
| 669.3(3) | 0.36(9) | |||
| 850.8(2) | 0.75(10) | |||
| 913.9(3) | 0.3(1) | |||
| 1003.5(1) | 62(3) | 1003.7(2) | 100(17) | 62(11) |
| 1028.6(3) | 0.38(8) | |||
| 1188.4(2) | 1.6(1) | |||
| 1201.8(3) | 0.29(7) | |||
| 1413.7(3) | 0.35(7) | |||
| 1442.1(3) | 0.40(8) | |||
| 1481.4(3) | 1.3(1) | |||
| 1554.7(3) | 7.0(5) | 1554.9(6) | 12(5) | 7.4(31) |
| 1780.8(7) | 0.2(1) | |||
| 2047.2(6) | 0.7(2) | |||
| 2293.2(4) | 6.3(5) | 2293.0(10) | 10(5) | 6.2(31) |
| 2334.2(5) | 0.8(2) | |||
| 2434.2(4) | 1.8(2) | |||
| 2558.7(4) | 8.5(6) | 2559.0(8) | 13(5) | 8.1(31) |
| 2624.3(7) | 0.3(1) | |||
| 2826.0(5) | 1.3(2) | |||
| 2884.0(5) | 0.8(2) | |||
| 2996.8(5) | 2.0(3) | |||
| 3337.4(4) | 7.1(6) | |||
| 3394.8(4) | 7.0(6) | |||
| 3848.5(4) | 38(3) | 3848.3(7) | 57(13) | 35(8) |
| 3889.1(5) | 2.8(8) | |||
| 4000.9(5) | 2.8(4) | |||
| 4805.0(5) | 0.4(1) | |||
| 4850.2(6) | 0.2(1) | |||
| 4891.9(5) | 0.4(1) |
a From Ref. Mazzocchi et al. (2001).
b Relative intensity.
c Absolute intensity (calculated using our measured intensity for the 1004 keV ray).
The reader may refer to Fig. 8 for a summary of the decays that intervene in the following discussions. Below we discuss in detail the origin of all the observed lines. As shown in Fig. 2, -delayed proton emission takes place in the decay of 60Ge. This process, passing through proton-unbound excited states of 60Ga, populates states in 59Zn (). 59Zn then decays to its mirror nucleus, 59Cu () with = 182.4(4) ms (see below). The 491 keV line is known and is the transition connecting the 1/2- first excited state of 59Cu to its 3/2- ground state (g.s.) Honkanen et al. (1981); Arai et al. (1984).
Analysing the direct implantation of 59Zn (2.5106 implants) we obtained = 182.4(4) ms, that may be compared with the previous values of 210(20) Honkanen et al. (1981), 182.0(18) Arai et al. (1984), 173(14) López Jiménez et al. (2002) and 174(2) Kucuk et al. (2017) ms. We also obtained the -ray energy spectrum correlated with 59Zn implants (shown in Fig. 5) where, as expected, we observe known lines de-exciting levels in 59Cu. Comparing the lines of Figs. 4 and 5, the new lines (463, 837 and 1332 keV) are not present in Fig. 5, while in both figures there is a line at 1775 keV. A known 1775-keV ray de-excites the 2267 level in the 59Cu daughter nucleus, populating the 491 keV level. We think that the 1775 keV line of Fig. 4 belongs to a different transition, because otherwise we should have also observed the more intense 914 keV line in Fig. 4. The proton separation energy in 59Zn is 2836.8(7) keV Wang et al. (2017) and the total -delayed proton-emission branching ratio is 0.023(8)% Honkanen et al. (1981), hence the contribution of the proton emission from 59Zn is negligible in the decay chain of 60Ge.
As mentioned above, the first excited state in 59Cu is 1/2- with 491 keV excitation energy and de-excites to its 3/2- g.s. through a transition of the same energy Honkanen et al. (1981); Arai et al. (1984). The g.s. of 59Zn is also 3/2- Honkanen et al. (1981) but the energy of the expected 1/2- excited state is not known. The isopin symmetry and the expected similarity between 59Cu and 59Zn suggest that the 463 keV line of Fig. 4 may be associated with the transition between the expected 1/2- excited state of 59Zn and its 3/2- g.s. An additional hint at this conclusion comes from the energy difference between the proton peaks at = 2067(15) and 2522(15) keV (Table 1) which agrees, within the uncertainty, with the value of 463 keV. This suggests that the two proton peaks are indeed a doublet corresponding to the transitions from the IAS in 60Ga to the first excited and ground states of 59Zn, respectively. It should be noted that the parent of 59Zn, 59Ga, is probably unbound, therefore the -delayed proton decay from 60Ge is presumably the best way to populate the first excited state at 463 keV in 59Zn.
| = 60, = 2 input values | |||
| = +2 | = +1 | = 0 | = -1 |
| -64473.1(4)a | -55804(5)a | -46807(24)a | -37405(15)b |
| IMME result for = -2 | 2016 AME Audi et al. (2017) | 2003 AME Audi et al. (2003a) | |
| -27678(22) | -27090#(300#) | -27770#(230#) | |
a From Ref. Audi et al. (2017).
b From the present -delayed proton emission data.
# Values obtained from systematics.
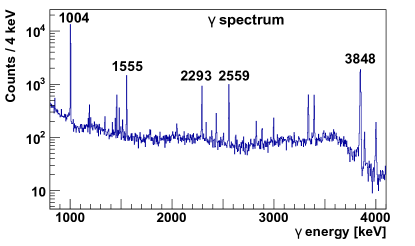
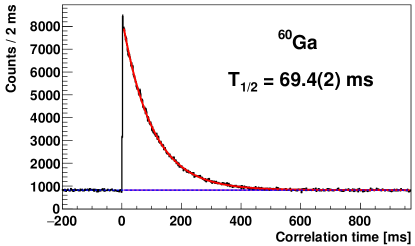
On the other hand, the decay of 60Ge populates directly states in the 60Ga daughter. The latter then decays to 60Zn (with and being its own mirror since ) populating its IAS at 4852 keV, which de-excites mainly by the cascade of 3848 and 1004 keV rays Mazzocchi et al. (2001) that are both observed in Fig. 4. Looking at the direct implantation of 60Ga (7.6105 implants), we obtained the -ray energy spectrum of Fig. 6, showing the de-excitation in 60Zn. In this spectrum we observe all the most intense transitions at 1004, 1555, 2293, 2559 and 3848 keV, already seen in Ref. Mazzocchi et al. (2001), and several other lines listed in Table 2. The intensities of the five known transitions agree with those observed in Ref. Mazzocchi et al. (2001). None of the new lines (837, 1332 and 1775 keV) of Fig. 4 is observed in Fig. 6. A value = 1.6(7)% was obtained for the -delayed proton emission from 60Ga Mazzocchi et al. (2001), populating 59Cu. Thus this process could also make a minor contribution to the observed 491 keV line (Fig. 4), even if we do not see this line in Fig. 6. Analysing the charged-particle spectrum for decay events correlated with 60Ga implants, we found the contribution of the -delayed proton emission from 60Ga to be of the order of 1% in comparison to that from 60Ge (Fig. 2). Last but not least, we have improved our knowledge of the 60Ga half-life, obtaining = 69.4(2) ms from the fit shown in Fig. 7, that may be compared with the previous values of 70(15) Mazzocchi et al. (2001) and 76(3) ms Kucuk et al. (2017).
The mass of 59Zn is known Audi et al. (2017), but the mass of 60Ga has not been measured, which makes difficult to estimate properly the excitation energy of the IAS and other nuclear levels populated in the 60Ga daughter based on the observation of the proton peaks. The mass excess of 60Ge has also not been measured. From systematics (#) the most recent atomic mass evaluation (AME) Audi et al. (2017) gives a g.s. mass excess of -27090#(300#) keV for 60Ge and -39590#(200#) keV for 60Ga. From these masses the value = 12500#(360#) keV is obtained Wang et al. (2017). The proton separation energy in 60Ga is also not known experimentally. Systematics gives us = -340#(200#) keV Wang et al. (2017), while a semiempirical estimate gives 40(70) keV Mazzocchi et al. (2001). A systematic value for the excitation energy of the IAS is = 2540#(50#) keV Audi et al. (2017). Ref. Ciemny et al. (2016) calculated a value of 2520(280) keV based on Coulomb energy difference.
From our experimental data we can obtain the mass excess of the IAS in 60Ga. The information from the -delayed proton emission gives us a proton energy = 2522(15) keV (Table 1), remembering that . Using our and the measured value for the mass excess of the 59Zng.s., -47215.6(8) keV Audi et al. (2017), one can determine the mass excess of 60GaIAS being -37405(15) keV. Considering the latter mass together with the measured masses for the other three members of the = 2 isospin multiplet (60ZnIAS, 60CuIAS and 60Nig.s., listed in Table 3), one can apply the Isobaric Multiplet Mass Equation (IMME) Wigner (1957); Benenson and Kashy (1979) to determine the 60Geg.s. mass excess, obtaining a value of -27678(22) keV. The 2003 AME value of -27770#(230#) keV Audi et al. (2003a) agrees with our value better than the most recent AME mass excess. In Section V we observe similar behaviour for the case of 62Ge. Issues with AMEs subsequent to that in 2003 have been reported already for proton-rich nuclei in this region of the mass chart Orrigo et al. (2014); Santo et al. (2014); Orrigo et al. (2016a) and we believe that more mass measurements would be very useful to constrain the future AME in this mass region.
The IAS in 60Cu, which is the mirror nucleus of 60Ga, lies at 2536.0(6) keV and de-excites through a cascade with energies 1866 and 670 keV Browne and Tuli (2013). Based on mirror symmetry, together with the observed intensities for the 837 and 1775 keV rays (Table 1), we think that the IAS in 60Ga de-excites through a cascade consisting of the 1775 and 837 keV rays, in this order. From the energies of these rays we can determine the excitation energy of the 60GaIAS, = 2611.8(9) keV, which agrees with the expected values Audi et al. (2017); Ciemny et al. (2016). We can also deduce other properties of 60Ga, such as the g.s. mass excess, -40016(15) keV, and = 90(15) keV. Finally, we calculate the value = 12338(27) keV for the decay of 60Ge.
| (keV) | (%) | (F) | (GT) |
|---|---|---|---|
| 3580(27) | 1.9(2) | 0.14(1) | |
| 3071(28) | 3.2(3) | 0.18(2) | |
| 2611.8(9)a | 45.3(20) | 3.1(1) | |
| 1774(23) | 4.2(3) | 0.11(1) | |
| 1450(25) | 5.1(4) | 0.11(1) | |
| 1166(28) | 4.0(5) | 0.074(9) | |
| 910(20) | 2.8(4) | 0.044(6) | |
| 837.2(2) | 7(2) | 0.11(3) |
a IAS.
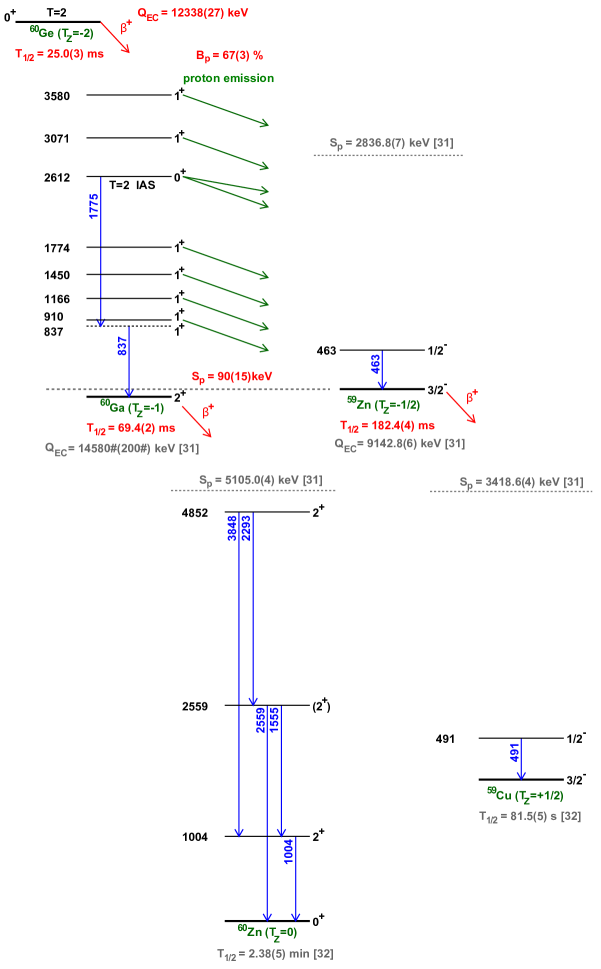
The quantities deduced above are used to determine the excitation energies of the levels in 60Ga, the Fermi (F) and Gamow-Teller (GT) transition strengths. They are reported in Table 4 together with the feeding to each level, inferred from the intensities measured for both the -delayed proton and emissions (Table 1). The level scheme deduced from the results of the present experiment is shown in Fig. 8.
We obtain a value (F) = 3.1(1) that is smaller than the expected (F) = = 4. From Table 4, = 45.3% but we would need a feeding of 58% in order to get the correct Fermi strength. A possible explanation could be that we are missing weak branches de-exciting the IAS. As a matter of fact, we do not have enough information to place the 1332 keV ray in the level scheme. If it de-excites the IAS, this latter would gain an additional feeding of 4% (see Table 1) out of the missing 12.7%.
Another possible scenario would be to invert the order of the rays in the cascade de-exciting the IAS, i.e., first the 837 and then the 1775 keV rays. In this way the IAS would gain an additional feeding of 7% and we would obtain a higher value for the strength, (F) = 3.6(2). According to this possibility, the 837 keV ray would populate the level at = 1774 keV, which we already observed from the proton emission, but the balance of feeding populating and de-exciting this level would be negative (-3.0(15) %). The 837 keV level would be removed from the decay scheme of Fig. 8 and for this reason we indicated it with a dashed line. If this second scenario is confirmed, the emission of the 837 keV ray followed by the emission of the proton from the 1774 keV level would be a new observation of -delayed -proton decay, an exotic decay mode that we already observed in 56Zn Orrigo et al. (2014). A new experiment with higher statistics would be desirable to shed light on these aspects.
In the decay of the nuclei the -delayed proton emission from the IAS populated in the daughter nucleus is isospin-forbidden, but usually it is observed and this is attributed to a = 1 isospin impurity in the IAS wave function Orrigo et al. (2014, 2016a). As in other cases, in the decay of 60Ge we observe competition between the -delayed proton and emissions from the IAS populated in 60Ga. However here the proton emission is found to be dominant, being 95% of the observed IAS de-excitation (74.5% if we account for the missing feeding). The explanation for this behaviour may lie in nuclear structure reasons.
V Beta decay of 62Ge
62Ge is a proton-rich nucleus which was only poorly known at the time of the present experiment. The high-intensity 78Kr beam available at RIKEN made it possible to record the unprecedented statistics of 2.1106 implants of 62Ge.
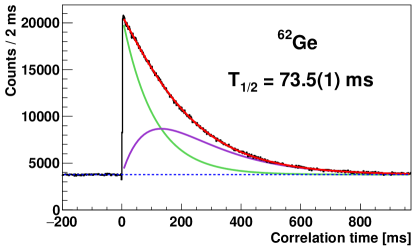
Fig. 9 shows the correlation-time spectrum obtained for the decay of 62Ge. The 62Ge half-life was determined by fitting the correlation-time spectrum using the Bateman equations Bateman (1910) including the decay of 62Ge, the growth and decay of its daughter 62Ga (with = 116.121(21) ms Audi et al. (2017)) and the random correlation background. A half-life of = 73.5(1) ms is obtained. The maximum likelihood and least squares minimization methods gave the same result. This half-life value agrees with and improves the precision of our previous measurement (76(6) ms obtained with 6.1103 implants of 62Ge Kucuk et al. (2017)). As already discussed in Ref. Kucuk et al. (2017), there is an older measurement, 129(35) ms López Jiménez et al. (2002), lying inside two standard deviations mainly because of the poorer statistics. Additionally, another value of 82.9(1.4) ms is reported in Ref. Grodner et al. (2014) again with much poorer statistics.
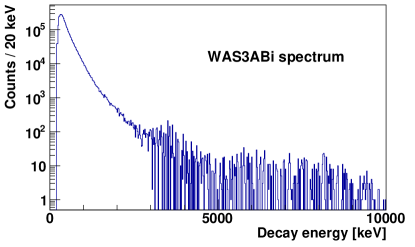
The charged-particle energy spectrum from the decay of 62Ge is shown in Fig. 10. The bump at low energy is due to the detection of particles, while no discrete peaks from -delayed proton emission are observed. The proton separation energy in the 62Ga daughter is 2927(16) keV Wang et al. (2017), above this value proton emission is allowed. From our data we estimated an upper limit of 5‰ for the total proton-emission branching ratio.
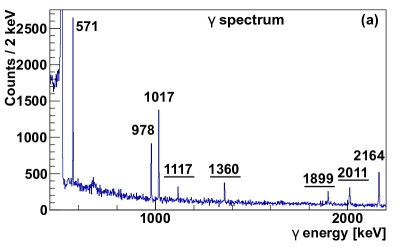
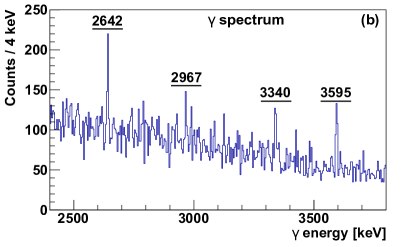
The -ray energy spectrum from the decay of 62Ge is shown in Fig. 11. We observed twelve lines at 571, 978, 1017, 1117, 1360, 1899, 2011, 2164, 2642, 2967, 3340 and 3595 keV. Eight of them were observed for the first time, while the four most intense lines (571, 978, 1017 and 2164 keV) were also seen in Ref. Grodner et al. (2014) together with two other lines at 1247 and 2414 keV which we did not see. The lines which we observed for the first time are underlined in Fig. 11.
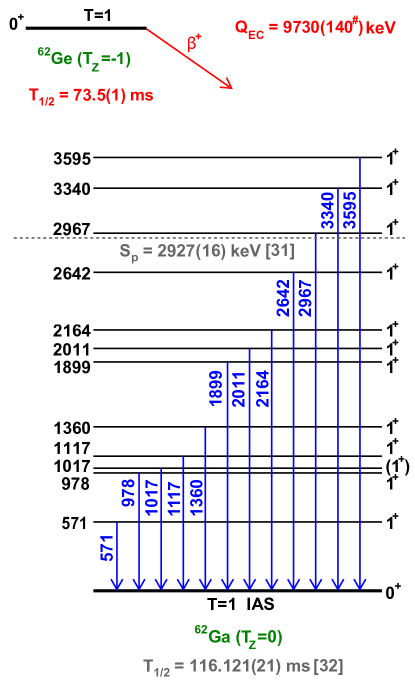
The decay scheme of 62Ge deduced from the results of the present experiment is shown in Fig. 12. The decay of the = 0+, = 1 g.s. of 62Ge () populates the 0+, = 1 IAS in the 62Ga daughter () through a super-allowed Fermi transition and 1+, = 0 states through Gamow-Teller transitions. According to the - of Warburton and Weneser, namely that the M1 transitions between = 1+, = 0 states are strongly suppressed Morpurgo (1958); Wilkinson (1969), one can expect that all the populated 1+, = 0 states decay predominantly to the 0+, = 1 g.s. of 62Ga. We have found evidence for this - in other cases Molina et al. (2015). In order to test this rule for the present case, we looked for small branches from the upper 1+ states to the lower 1+ levels. Even considering the most favourable case, i.e., a transition from the 1+ state at 2164 keV to the first 1+ state at 571 keV, the de-exciting ray was not observed. We set an upper limit of 1 ‰ on its intensity.
In a fusion-evaporation-reaction study of 62Ga Rudolph et al. (2004) a 2+ level was proposed at 1017 keV based on the observation of a weak ray at 446 keV in coincidence with the 571 keV ray, with no observation of the 1017 keV ray. Considering two following in-beam studies, Ref. David et al. (2013) also reported the 446 keV ray, but Ref. Henry et al. (2015) did not observe it; moreover in both references the 1017 keV ray was not seen. In the present -decay experiment and also in those of Ref. Grodner et al. (2014) an intense ray was seen at 1017 keV, while the 446 keV ray was not observed. Hence we think that the level we see at 1017 keV is not the same level as in Ref. Rudolph et al. (2004) and therefore it is a 1+ state, like the other levels populated in the decay. This is further supported by the non-observation of weak branches from the upper excited 1+ levels to the 1017 keV level which, if it were a 2+ level, would not be affected by the Warburton and Weneser -.
Since there is no appreciable -delayed proton emission from 62Ge, Eq. 2 is simplified and the intensity of each -delayed ray can be calculated as follows:
| (3) |
with the advantage of not depending on . Here represents the total number of events correlated with 62Ge and is obtained from the half-life fit in Fig. 9.
| (keV) | (%) | (keV) | (%) | (F) | (GT) |
|---|---|---|---|---|---|
| 3594.7(5) | 0.6(1) | 3594.7(5) | 0.6(1) | 0.07(1) | |
| 3339.6(5) | 0.30(6) | 3339.6(5) | 0.30(6) | 0.030(7) | |
| 2966.8(5) | 0.35(6) | 2966.8(5) | 0.35(6) | 0.028(5) | |
| 2641.8(5) | 0.4(1) | 2641.8(5) | 0.4(1) | 0.029(7) | |
| 2164.1(4) | 2.6(2) | 2164.1(4) | 2.6(2) | 0.13(1) | |
| 2010.9(4) | 0.96(8) | 2010.9(4) | 0.96(8) | 0.045(5) | |
| 1899.3(4) | 0.58(6) | 1899.3(4) | 0.58(6) | 0.025(3) | |
| 1359.7(2) | 0.70(5) | 1359.7(2) | 0.70(5) | 0.022(2) | |
| 1117.4(2) | 0.41(4) | 1117.4(2) | 0.41(4) | 0.011(2) | |
| 1017.1(1) | 2.6(1) | 1017.1(1) | 2.6(1) | 0.067(6) | |
| 978.3(1) | 1.8(1) | 978.3(1) | 1.8(1) | 0.047(4) | |
| 571.3(1) | 3.4(1) | 571.3(1) | 3.4(1) | 0.068(6) | |
| g.s.a | 85.3(3)b | 2.0 |
a IAS.
b The g.s. to g.s. feeding is .
Table 5 summarises our results for 62Ge. The -ray energies and intensities are reported in the first two columns of the table. Assuming that all the populated 1+ states decay directly to the 0+ g.s. of 62Ga (as discussed above), the excitation energies of the levels in 62Ga are deduced directly from the corresponding . Similarly, the feeding to each level is inferred from the respective . The third and fourth columns of Table 5 give and , respectively. Finally, the last two columns give the (F) and (GT) transition strengths, where the (GT) values are obtained by setting (F) = 2.0 (see the discussion below).
The Fermi transition connects the 62Geg.s. to its IAS, the 62Gag.s.. The IAS feeding (g.s.-to-g.s.) is calculated by subtracting all the indirect feeding to the 62Gag.s., = 85.3(3)%. Then, in order to calculate the -decay strengths, one needs to know the mass excesses of the nuclear states involved in the transition. The mass excess of the 62Gag.s. is known experimentally and has a value of -51986.9(6) keV Audi et al. (2017). However the g.s. mass of 62Ge is not known. Since the = 62, = 1 isospin multiplet is a triplet (62Ge, 62Ga and 62Zn), we cannot use the IMME Wigner (1957); Benenson and Kashy (1979) to determine the 62Geg.s. mass, hence we have to rely on systematics. The most recent AME gives a value of -41740#(140#) keV Audi et al. (2017), which gives a Fermi strength of 1.5(1), i.e., much smaller than the expected (F) = = 2. If we make the Fermi strength equal to 2, then we obtain a mass excess of -42258 keV for the 62Geg.s. and, assuming for this mass a conservative uncertainty of 140 keV as in the mass evaluation systematics, we obtain the value = 9730(140#) keV shown in Fig. 12. The 2003 AME value of -42240#(140#) keV Audi et al. (2003a) is in agreement with our deduced mass. In addition to the cases of 62Ge and 60Ge (Table 3), similar issues with the AMEs subsequent to the 2003 AME have been already reported for proton-rich nuclei in this region of the mass chart Orrigo et al. (2014); Santo et al. (2014); Orrigo et al. (2016a). More mass measurements are required in this region to constrain the future AME.
From our deduced g.s. mass excesses for 60Ge and 62Ge we can extract the two-neutron separation energy in 62Ge, = 30723(142) keV. It should be noted that the values from both the 2016 (30970#(330#) keV Wang et al. (2017)) and 2003 (30620#(270#) keV Audi et al. (2003b)) AME systematics agree well with our value.
VI Conclusions
We have studied the decay of the very neutron deficient 60Ge and 62Ge isotopes. We measured half-lives of = 25.0(3) ms for 60Ge, 69.4(2) ms for the daughter 60Ga and 73.5(1) ms for 62Ge. In all cases we have improved the precision in comparison with values in the literature Ciemny et al. (2016); Mazzocchi et al. (2001); Kucuk et al. (2017); Grodner et al. (2014).
The decay of 60Ge proceeds mainly by -delayed proton emission populating 59Zn with a total branching ratio of 67(3)%. Through this process we have observed for the first time the 1/2- first excited state in 59Zn and determined its excitation energy as 463.3(1) keV. The -delayed emission is also seen in competition, populating energy levels previously unknown in the drip-line 60Ga nucleus. Three new lines (837, 1332 and 1775 keV) have been observed and the level scheme deduced.
The decay of 62Ge proceeds mostly by direct population of the 62Ga ground state with a g.s. to g.s. feeding of 85.3(3)%. A total of twelve lines have been observed, eight of them for the first time. The Warburton and Weneser - Morpurgo (1958); Wilkinson (1969), already observed in previous cases Molina et al. (2015), has again been confirmed here. Moreover, even if there are a few differences in the observed rays with respect to Ref. Grodner et al. (2014), our study confirms that there is no evidence of enhanced low-lying Gamow-Teller strength in 62Ga due to isoscalar proton-neutron pairing.
Finally, the g.s. mass excesses of 60Ge, 60Ga and 62Ge have been deduced and the absolute -decay transition strengths have been determined.
Acknowledgements.
This work was supported by the Spanish MICINN grants FPA2014-52823-C2-1-P and FPA2017-83946-C2-1-P (MCIU/AEI/FEDER); Centro de Excelencia Severo Ochoa del IFIC SEV-2014-0398; Programme (CSIC JAE-Doc contract) co-financed by FSE; MCIU grant IJCI-2014-19172. We acknowledge the support of the Generalitat Valenciana Grant No. PROMETEO/2019/007. We acknowledge the support of STFC(UK) grant P005314/1 and ANID/CONICYT FONDECYT Regular 1171467. R.B.C. acknowledges support from the Max-Planck Partner group.References
- Blank and Borge (2008) B. Blank and M. J. G. Borge, Prog. Part. Nucl. Phys. 60, 403 (2008).
- Pfützner et al. (2012) M. Pfützner, M. Karny, L. V. Grigorenko, and K. Riisager, Rev. Mod. Phys. 84, 567 (2012).
- Orrigo et al. (2014) S. E. A. Orrigo, B. Rubio, Y. Fujita, B. Blank, W. Gelletly, J. Agramunt, A. Algora, P. Ascher, B. Bilgier, L. Cáceres, et al., Phys. Rev. Lett. 112, 222501 (2014).
- Orrigo et al. (2016a) S. E. A. Orrigo, B. Rubio, Y. Fujita, W. Gelletly, J. Agramunt, A. Algora, P. Ascher, B. Bilgier, B. Blank, L. Cáceres, et al., Phys. Rev. C 93, 044336 (2016a).
- Schatz et al. (1998) H. Schatz, A. Aprahamian, J. Görres, M. Wiescher, T. Rauscher, J. F. Rembges, F.-K. Thielemann, B. Pfeiffer, P. Möller, K.-L. Kratz, et al., Phys. Rep. 294, 167 (1998).
- Fisker et al. (2008) J. L. Fisker, H. Schatz, and F.-K. Thielemann, The Astroph. J. Supplement Series 174, 261 (2008).
- Parikh et al. (2013) A. Parikh, J. José, G. Sala, and C. Iliadis, Prog. Part. Nucl. Phys. 69, 225 (2013).
- Galloway et al. (2004) D. K. Galloway, A. Cumming, E. Kuulkers, L. Bildsten, D. Chakrabarty, and R. E. Rothschild, The Astroph. J. 601, 466 (2004).
- Ciemny et al. (2016) A. A. Ciemny, W. Dominik, T. Ginter, R. Grzywacz, Z. Janas, M. Kuich, C. Mazzocchi, K. Miernik, M. Pfützner, M. Pomorski, et al., Eur. Phys. J. A 52, 89 (2016).
- Orrigo et al. (2016b) S. E. A. Orrigo, B. Rubio, W. Gelletly, B. Blank, Y. Fujita, J. Giovinazzo, J. Agramunt, A. Algora, P. Ascher, B. Bilgier, et al., Phys. Rev. C 94, 044315 (2016b).
- Kucuk et al. (2017) L. Kucuk, S. E. A. Orrigo, A. Montaner-Pizá, B. Rubio, Y. Fujita, W. Gelletly, B. Blank, Y. Oktem, T. Adachi, A. Algora, et al., Eur. Phys. J. A 53, 134 (2017).
- Molina et al. (2015) F. Molina, B. Rubio, Y. Fujita, W. Gelletly, J. Agramunt, A. Algora, J. Benlliure, P. Boutachkov, L. Cáceres, R. B. Cakirli, et al., Phys. Rev. C 91, 014301 (2015).
- Fujita et al. (2011) Y. Fujita, B. Rubio, and W. Gelletly, Prog. Part. Nucl. Phys. 66, 549 (2011).
- Morpurgo (1958) G. Morpurgo, Phys. Rev. 110, 721 (1958).
- Wilkinson (1969) D. H. Wilkinson, Isospin in Nuclear Physics. SBN 7204 0155 0 (1969).
- Kubo (2003) T. Kubo, Nucl. Instrum. Methods B 204, 97 (2003).
- Kubo et al. (2012) T. Kubo, D. Kameda, H. Suzuki, N. Fukuda, H. Takeda, Y. Yanagisawa, M. Ohtake, K. Kusaka, K. Yoshida, N. Inabe, et al., Progr. Theor. Exp. Phys. 2012, 03C003 (2012).
- Fukuda et al. (2013) N. Fukuda, T. Kubo, T. Ohnishi, N. Inabe, H. Takeda, D. Kameda, and H. Suzuki, Nucl. Instrum. Methods B 317, 323 (2013).
- Blank et al. (2016) B. Blank, T. Goigoux, P. Ascher, M. Gerbaux, J. Giovinazzo, S. Grévy, T. Kurtukian Nieto, C. Magron, J. Agramunt, A. Algora, et al., Phys. Rev. C 93, 061301 (2016).
- Nishimura (2012) S. Nishimura, Progr. Theor. Exp. Phys. 2012, 03C006 (2012).
- Söderström et al. (2013) P.-A. Söderström, S. Nishimura, P. Doornenbal, G. Lorusso, T. Sumikama, H. Watanabe, Z. Xu, H. Baba, F. Browne, S. Go, et al., Nucl. Instrum. Methods B 317, 649 (2013).
- Goigoux et al. (2016) T. Goigoux, P. Ascher, B. Blank, M. Gerbaux, J. Giovinazzo, S. Grévy, T. Kurtukian Nieto, C. Magron, P. Doornenbal, G. G. Kiss, et al., Phys. Rev. Lett. 117, 162501 (2016).
- Taprogge et al. (2015) J. Taprogge, A. Jungclaus, H. Grawe, S. Nishimura, P. Doornenbal, G. Lorusso, G. S. Simpson, P.-A. Söderström, T. Sumikama, Z. Y. Xu, et al., Phys. Rev. C 91, 054324 (2015).
- Morales et al. (2017) A. I. Morales, A. Algora, B. Rubio, K. Kaneko, S. Nishimura, P. Aguilera, S. E. A. Orrigo, F. Molina, G. de Angelis, F. Recchia, et al., Phys. Rev. C 95, 064327 (2017).
- Bateman (1910) H. Bateman, Proc. Cambridge Phil. Soc. 15, 423 (1910).
- Dossat et al. (2007) C. Dossat, N. Adimi, F. Aksouh, F. Becker, A. Bey, B. Blank, C. Borcea, R. Borcea, A. Boston, M. Caamano, et al., Nucl. Phys. A 792, 18 (2007).
- Mazzocchi et al. (2001) C. Mazzocchi, Z. Janas, J. Döring, M. Axiotis, L. Batist, R. Borcea, D. Ott, E. Caurier, G. de Angelis, E. Farnea, et al., Eur. Phys. J. A 12, 269 (2001).
- Honkanen et al. (1981) J. Honkanen, M. Kortelahti, K. Eskola, and K. Vierinen, Nucl. Phys. A 366, 109 (1981).
- Arai et al. (1984) Y. Arai, E. Tanaka, H. Miyatake, M. Yoshii, T. Ishimatsu, T. Shinozuka, and M. Fujioka, Nucl. Phys. A 420, 193 (1984).
- López Jiménez et al. (2002) M. J. López Jiménez, B. Blank, M. Chartier, S. Czajkowski, P. Dessagne, G. de France, J. Giovinazzo, D. Karamanis, M. Lewitowicz, V. Maslov, et al., Phys. Rev. C 66, 025803 (2002).
- Wang et al. (2017) M. Wang, G. Audi, F. G. Kondev, W. Huang, S. Naimi, and X. Xu, Chin. Phys. C 41, 030003 (2017).
- Audi et al. (2017) G. Audi, F. G. Kondev, M. Wang, W. Huang, and S. Naimi, Chin. Phys. C 41, 030001 (2017).
- Audi et al. (2003a) G. Audi, O. Bersillon, J. Blachot, and A. Wapstra, Nucl. Phys. A 729, 3 (2003a).
- Wigner (1957) E. Wigner, Proc. Robert A. Welch Found. Conf. 1, 67 (1957).
- Benenson and Kashy (1979) W. Benenson and E. Kashy, Rev. Mod. Phys. 51, 527 (1979).
- Santo et al. (2014) M. D. Santo, Z. Meisel, D. Bazin, A. Becerril, B. A. Brown, H. Crawford, R. Cyburt, S. George, G. F. Grinyer, G. Lorusso, et al., Phys. Lett. B 738, 453 (2014).
- Browne and Tuli (2013) E. Browne and J. K. Tuli, Nucl. Data Sheets 114, 1849 (2013).
- Grodner et al. (2014) E. Grodner, A. Gadea, P. Sarriguren, S. M. Lenzi, J. Gre¸bosz, J. J. Valiente-Dobón, A. Algora, M. Górska, P. H. Regan, D. Rudolph, et al., Phys. Rev. Lett. 113, 092501 (2014).
- Rudolph et al. (2004) D. Rudolph, C. Andreoiu, J. Ekman, C. Fahlander, M. N. Mineva, S. M. Lenzi, E. Farnea, C. Rossi-Alvarez, C. A. Ur, M. Axiotis, et al., Phys. Rev. C 69, 034309 (2004).
- David et al. (2013) H. M. David, P. J. Woods, G. Lotay, D. Seweryniak, M. Albers, M. Alcorta, M. P. Carpenter, C. J. Chiara, T. Davinson, D. T. Doherty, et al., Phys. Lett. B 726, 665 (2013).
- Henry et al. (2015) T. W. Henry, M. A. Bentley, R. M. Clark, P. J. Davies, V. M. Bader, T. Baugher, D. Bazin, C. W. Beausang, J. S. Berryman, A. M. Bruce, et al., Phys. Rev. C 92, 024315 (2015).
- Audi et al. (2003b) G. Audi, A. Wapstra, and C. Thibault, Nuclear Physics A 729, 337 (2003b).