Mass testing and proactiveness affect epidemic spreading
Abstract
The detection and management of diseases become quite complicated when pathogens contain asymptomatic phenotypes amongst their ranks, as evident during the recent COVID-19 pandemic. Spreading of diseases has been studied extensively under the paradigm of Susceptible - Infected - Recovered - Deceased (SIRD) dynamics. Various game-theoretic approaches have also addressed disease spread, many of which consider , , , and as strategies rather than as states. Remarkably, most studies from the above approaches do not account for the distinction between the symptomatic or asymptomatic aspect of the disease. It is well-known that precautionary measures like washing hands, wearing masks and social distancing significantly mitigate the spread of many contagious diseases. Herein, we consider the adoption of such precautions as strategies and treat , , , and as states. We also attempt to capture the differences in epidemic spreading arising from symptomatic and asymptomatic diseases on various network topologies. Through extensive computer simulations, we examine that the cost of maintaining precautionary measures as well as the extent of mass testing in a population affects the final fraction of socially responsible individuals. We observe that the lack of mass testing could potentially lead to a pandemic in case of asymptomatic diseases. Network topology also seems to play an important role. We further observe that the final fraction of proactive individuals depends on the initial fraction of both infected as well as proactive individuals. Additionally, edge density can significantly influence the overall outcome. Our findings are in broad agreement with the lessons learnt from the ongoing COVID-19 pandemic.
I Introduction
Occasionally, an infectious disease can spread to such an extent, that it significantly affects a vast number of people and indeed the majority of the population. Such a scenario is referred to as an epidemic [1]. It becomes pandemic in nature when it affects multiple countries, perhaps at the global level. The impact of an epidemic can reach the height of devastation, especially if the pathogen also causes asymptomatic carriers [2, 3]. Obviously, such asymptomatic infections present a stark contrast to symptomatic infections — wherein the symptoms of infections are clearly manifest. Henceforth, we will refer to the former as class infections and the latter as class infections. An infection with asymptomatic phenotypes presents remarkable consequences. It severely hinders the containment of infection and the management of the infected. These unfortunate effects have been in full display during the recent Covid-19 pandemic [4] as well as the “Spanish influenza” [5]. Revolutionary advances in medicine have been achieved between these two catastrophes separated by a century. And yet, little can evidently be done to contain the spread of such pandemics — when in full rage.
Epidemic spreading has been modelled extensively through SIRD dynamics on networks [6, 7, 8, 9]. It has also been studied independently through game-theoretic approaches, many of which involve networks [10, 11]. Herein, we adopt a game-theoretic approach towards epidemic spreading on heterogeneous networks [12, 13, 10, 14, 14, 6, 15]. There are not many studies addressing the distinction between class and class type infections in existing literature [16, 17]. One of our prime objectives is to clearly demonstrate the effects arising from differences in asymptomatic and symptomatic phenotype on epidemic modeling.
Furthermore, in existing literature on game theoretic modeling of epidemic spreading on networks , , and have been predominantly considered as strategic options [10]. However, herein we consider these as states rather than strategies. Conversion of an individual’s condition from susceptible to infected during epidemic spreading is not always a choice. Therefore, , , and are perhaps more aptly considered as states of an individual. On the other hand, individuals may either cooperate or defect in being precautious. Such proactiveness of individuals is more of a choice and could be considered as a strategy rather than a state. This rather important biological aspect has not been accorded sufficient attention in studies on epidemic spreading involving game-theoretic approaches on networks and SIRD dynamics.
Generally, to prevent the spread of any transmissible disease, mass administration of vaccines – if available – is the most desirable option. Significant research has been conducted to scrutinize the vaccination process and its effect on the spread of an epidemic [18, 13]. However, in the absence of vaccines, asymptomatically infected individuals (especially in class diseases), are likely to be unaware of their own condition. They can unwittingly act as spreaders or even as super-spreaders if they do not resort to proper precautionary measures [19]. As is well-known, precautionary measures in the form of frequently washing one’s hands, wearing masks, and social distancing are some effective strategies to limit the spread of many contagious diseases. In more extreme cases, lockdown may be required, which obviously presents significant economic and social costs.
Susceptible-Infected-Recovered-Deceased or SIRD dynamics specifies that every member of the population would be in one of the following four states, at any given instant of time, . Borrowing from the notions of set theory, we can pool individuals in a similar state as belonging to the same set. Sets representing these states are susceptible, , infected, , recovered, , and deceased, and would also be frequently referred to hereinafter as , , , and respectively [20]. If is the universal set denoting the whole population, then obviously .
Irrespective of their state, susceptible individuals and infected yet undetected individuals can choose from either of the following two strategies when facing an epidemic. These individuals can either adopt precautionary measures and act responsibly or they can remain careless and spread the disease. Any proactive person would obviously need to pay a certain “cost” in order to sustain these measures and act responsibly. In addition, mass testing would surely go a long way in identifying infected individuals. Mass testing ratio, , denotes the fraction of the entire population, which has been tested for a given disease. Its importance in class diseases especially can hardly be overemphasised. A prime motivation of this work is to examine the manner in which precautionary measures and mass testing can affect the spread of an epidemic.
In any infection, the infected individuals definitely possess the capacity to be quite contagious during the incubation period. This is true for both class and class diseases. Generally, most diseases are neither purely symptomatic nor purely asymptomatic. However, many diseases are predominantly symptomatic or predominantly asymptomatic. During the course of an epidemic some infected individuals may exhibit symptoms, while many others may not. The manifestation of symptoms may depend on the nature and severity of the disease, the immunity of the infected individuals, and sundry other factors. Herein, we distinguish between class and class diseases by using the parameter, , which is the Symptom Manifestation Ratio. Of all infected individuals, is the fraction of infected individuals who clearly demonstrate the symptoms of a given disease. represents the scenario, where all infected individuals are asymptomatic. On the other hand, signifies that all infected individuals clearly exhibit symptoms of a given disease. Generally, . The estimate of for a given disease can be obtained from empirical data.
The decisive role of topology is well known in networks in fields as diverse as infrastructure, image processing, optogenetics and phage-bacteria interactions[21, 22, 23, 24, 25, 26]. The dependence of the outcome of games played on heterogeneous structures depends non-trivially on the underlying topology [10, 27, 28, 29]. To understand the role of the underlying topology on the dynamics, we consider various population structures in our simulations. We have predominately studied the dynamics on Barabási-Albert (BA) networks, which is known to emulate many real-world scenarios. In addition, we have also studied the dynamics on Watts–Strogatz small-world (SW) and Erdös-Rényi (ER) models.
II Model
Our model is quite general and addresses both symptomatic (class ) and asymptomatic (class ) diseases. Contagious diseases can spread through several different mechanisms. These could range from being in the mere proximity of an infected individual or coming in contact with contaminated items used or even touched by the individual. It could also spread through the bodily secretions of an infected person, through sexual or other physical contact or through various vectors.
Proactive individuals will choose precautionary measures of their own accord. Examples of such precautionary measures are the maintenance of social distance, wearing masks, and frequently washing hands. These measures would surely lower the rate of the infection spreading. However, adopting these measures comes at the cost of a varying degree of restriction in one’s everyday life. On the other hand, a careless individual will not choose adequate or proper protection against infection. Such individuals are not merely a danger to many others but even to themselves. Their uncooperative and carefree behaviour is likely to increase the rate of spread of infection.
Thus, we observe that broadly two strategies are possible – cooperation and defection [30]. Proactive individuals are cooperators , who act towards preventing the spread of infection by taking proper precaution. However, this comes at a cost, . If an individual’s neighbor happens to be a cooperator, it automatically obtains a benefit . On the other hand, careless individuals can be considered as defectors . They will not spend any cost and therefore, for such defectors, . In spite of their callous behaviour – these defectors still enjoy benefit, , due to the accommodating behaviour of cooperators in the population. Since this benefit comes at no cost, these defectors effectively act like free-riders in a population. When two cooperators, , interact – they will be mutually benefited by each other’s proactive actions. However, this benefit has been arrived at by expending a cost . Therefore, the actual reward enjoyed by these cooperators is .
The interaction between two defectors, , will not lead to any benefit or cost, for either of them. Thus, this will result in zero payoffs. For the interaction between a cooperator and a defector; will obtain temptation amounting to , while will derive the sucker’s payoff equaling . True to their nature, defectors would try to avoid paying any cost. Table 1 displays the payoff matrix incorporating all the above interactions modeled on the Prisoner’s Dilemma.
| , | , | |
| , | , |
Asymptomatic individuals in class diseases are rather dangerous because they do not display clear symptoms of infection and unwittingly act as spreaders or even super-spreaders. Perhaps the only way to identify such infected individuals is through mass testing. Mass testing allows the identification of both symptomatic and asymptomatic infected individuals – even the mild ones. The infected individuals who have been detected by mass testing, are kept in quarantine and denoted by . Individuals in do not take part in the game anymore. For simplicity and without the loss of generalisation, we presume here that they can not harm members of the susceptible population anymore. They can either recover, which depends on recovery rate, , or die depending on the death rate, . On the other hand, individuals who are infected but remain undetected, , cause further infection in the population. can be of two types, and . Without medical intervention, individuals can also recover at a “self-recovery rate”, . All the states and the possible strategies associated with each state are listed in Table 2.
| State | Strategic choice |
|---|---|
| Susceptible () | Susceptible but proactive () |
| Susceptible but careless() | |
| Infected () | Infected but proactive () |
| (undetected, asymptomatic) | Infected but careless () |
| Infected () | No active strategic choice |
| (detected, symptomatic) | |
| Recovered () | No active strategic choice |
| Deceased () | No active strategic choice |
We consider that the rate of infection spread will depend on the strategies of individuals. In a population, and individuals are likely to interact with each other causing the spread of infection. Both and individuals can adopt either cooperation or defection as their strategy. and denote susceptible cooperators and infected cooperators respectively. and are both proactive and resort to appropriate precaution while interacting with others. On the other hand, and denote susceptible defectors and infected defectors respectively. Cost, , reflects the extent of precaution undertaken by an individual while the benefit obtained from another proactive individual’s precautionary actions is reflected in , as aforementioned. The fraction indicates the extent of precaution undertaken by an individual, where obviously . We can also define risk as . will resort to precaution at some cost to lower the risk. However, for , implying , i.e., high risk. Let and denote the risk related to two interacting individuals and . If one of these individuals is infected and other one is susceptible, the probability of the susceptible individual getting infected due to the interaction is . This indicates that of due to interaction with is . Expectedly this is low because both of them have resorted to adequate precaution. However, the probability that an individual gets infected due to an interaction with an individual is . Again, this is expectedly high because none of the individuals have resorted to due precaution. Similarly, . Let us recall that individuals in the susceptible and infected state can employ either of the two strategies – cooperation or defection. At any time instant, if and denote the susceptible and infected cooperators respectively, then . Similarly, if and denote the susceptible and infected defectors, then . If and denote undetected individuals, then . Obviously, and .
III Algorithm
In our simulations, a heterogeneous population structure has been considered in the form of a Barabási-Albert (BA) network, with average degree . It is well-known that BA networks possess a power-law degree distribution. Simultaneously, we have also considered small-world and random networks in the form of Watts–Strogatz small-world (SW) and Erdös-Rényi (ER) models. Each time step during both transient time and counting time sequentially incorporates the events of: (a) payoff determination, (b) strategy upgradation, and (c) state upgradation. Initially every individual in the population is susceptible. At the start of an epidemic session, some of these individuals get infected randomly. Thus now, we have two states – susceptible and infected. The population has been divided into cooperators, , and defectors, . If represents the set of initially infected individuals, remains undetected i.e., and . Thus, on the basis of both strategy and state, there exist four types of individuals, namely, , , , and . Initially, prisoner’s dilemma is played between and , irrespective of the state they belong to. They will accumulate their payoffs by interacting with each other. It is rather superfluous to consider any strategy for recovered and dead individuals and they do not take part in the game. After determination of payoffs, all cooperators and defectors randomly select a neighbor for strategy upgradation. Following Fermi’s rule of strategy upgradation – an individual, , will adopt the strategy of a randomly chosen neighbor, , with a probability . and denote the total payoffs accumulated by and respectively [32, 33]. Strong selection has been considered here.
After strategy upgradation, state upgradation takes place. In the previous step, and individuals decide to be either or . But in this step, infection will spread in the population. It has been considered that the infection can spread through contact. Thus, susceptible neighbors of an infected individual are vulnerable. But depending on the strategy of both the interacting individuals i.e., or , the probability of spreading of infection will be different.
While upgrading its state, will randomly interact with one of its neighbors. If that randomly chosen neighbor is , may get infected with a probability, . The newly infected individuals may or may not manifest the symptoms. This would depend on the symptom manifestation rate of the infection, . The symptomatic individuals would be quarantined and they would not interact with the rest of the population anymore. As mentioned earlier, these individuals are identified as . The asymptomatic individuals will remain in population and would cause further infection.
All individuals would hence undergo mass testing with probability, . Depending on , some infected individuals can also be identified as . The remaining would remain in the population. Since they are unaware of their own situation they will unwittingly infect others. They may undergo self-recovery depending on or die without getting any medical help, depending on the value of . On the other hand, individuals may either recover, depending on the value of , or die, depending on the value of . Here for simplicity, the value of of and has been considered to be the same. In our simulations, reinfection of recovered individuals has not been considered.
In all simulations, a transient time of generations is considered. After this transient time, if be the number of susceptible cooperators, , is calculated over a counting time of generations. Every network has nodes and the average degree is denoted by . The overall simulations have been performed over networks. In all simulations, a definite fraction of nodes is initially assigned to be cooperators, at random. If denotes the initial fraction of cooperators in the population, then denotes the initial fraction of defectors. Apart from strategies, a definite number of nodes, i.e. individuals, are also randomly chosen to get infected. We denote the initial number of infected and susceptible individuals by and respectively. Obviously, denotes the total number of individuals in the population. The fraction of and is denoted by and respectively. Here, . At the very onset of the epidemic, all initially infected individuals would be undetected. Hence, initially and . Here, and denote the number of undetected and detected individuals respectively.
IV Results
Prisoner’s Dilemma game is played initially in the absence of any infection, i.e., between and only, which implies and . In that case, , depends only on . dominates at lower values of but decreases at higher values of , as shown in Fig 1. This implies that if increases, individuals would be quite unwilling to adopt precautionary measures and would try to defect.
IV.1 Asymptomatic infections: class
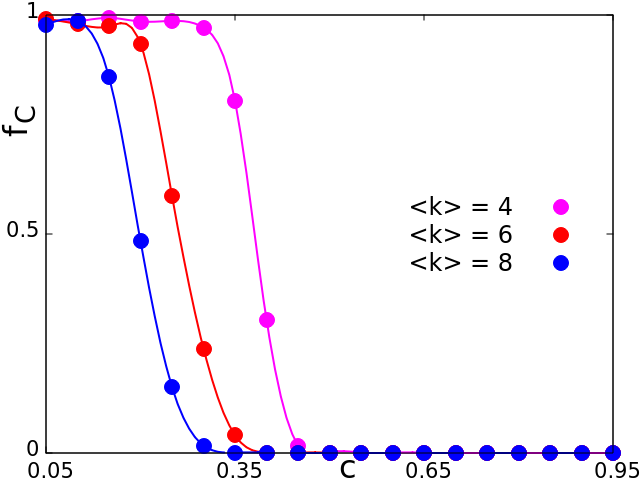
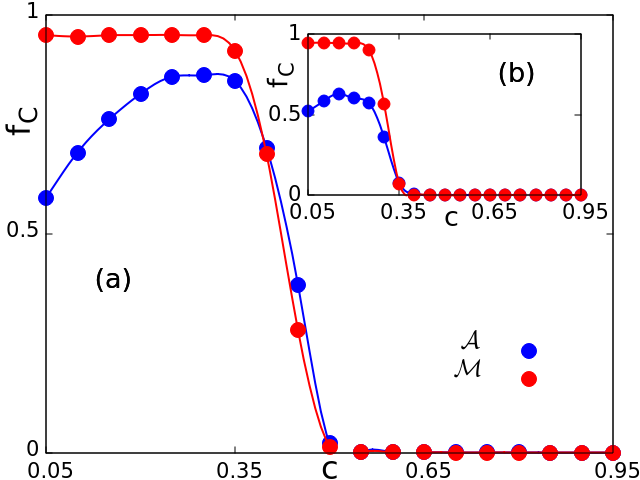
First, we have considered class , where the symptom manifestation ratio, , is very low. There are various diseases where manifestation of symptoms can not often be observed clearly, such as infections associated with Cytomegalovirus, Rhinoviruses, Salmonella or Ebola [34, 35, 36] infections. In the Zika virus infection, symptoms of clinical illness were absent in more than 80% of infected patients. These individuals played a crucial role in the initial transmission of the Zika virus [37]. Similarly, the asymptomatic pine trees, harbouring B. xylophilus nematodes play a vital role in the spreading of pine wilt epidemic [3]. The ongoing pandemic due to COVID‐19 virus is also associated with a high number of asymptomatic carriers [38]. Herein, we have considered that initially individuals have been infected. Fig. 2 is for the asymptomatic case. It can be observed that decreases with the increase of . Hence, it can be concluded that individuals in the population will only cooperate for low value of . But due to the presence of infection, low implies higher risk.
Hence, alongside defectors, these cooperators are also likely to get infected at lower values of . However, if we increase , better protection ensures higher . For a network with , we observe that is higher when . Though a higher cost implies lower risk, it also inhibits the lifestyle of individuals. Naturally, cooperation would be hindered at higher values of . Hence, with increasing costs, individuals tend to becomes careless, implying that individuals would be likely to dominate. Also individuals would get infected at a higher rate due to the absence of proper precaution on their part. In the case of high graphs, as shown in Fig. 2, it has been observed the peak shifts towards the lower value of . Generally, the maintenance of cooperation is lower when of the graph is high.
IV.2 Symptomatic infections: class
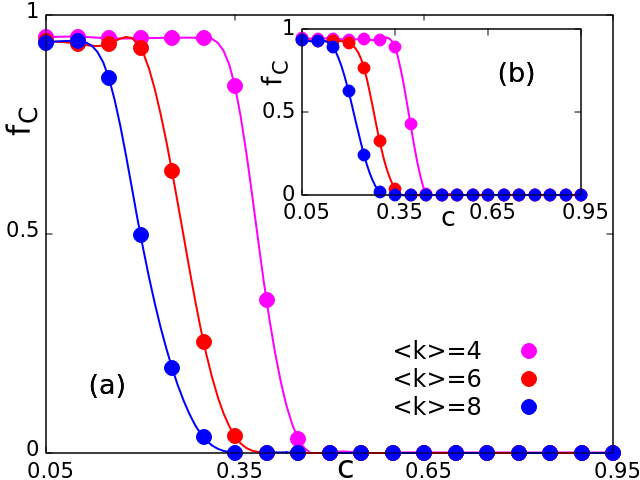
Class diseases obviously have a high symptom manifestation ratio associated with them. Infections like Vibrio cholerae and Poxviruses are examples of such symptomatic diseases [39]. This scenario has been examined in Fig. 3. Here too, is observed to decrease with an increase of at different values of .
IV.3 Comparing symptomatic and asymptomatic infection
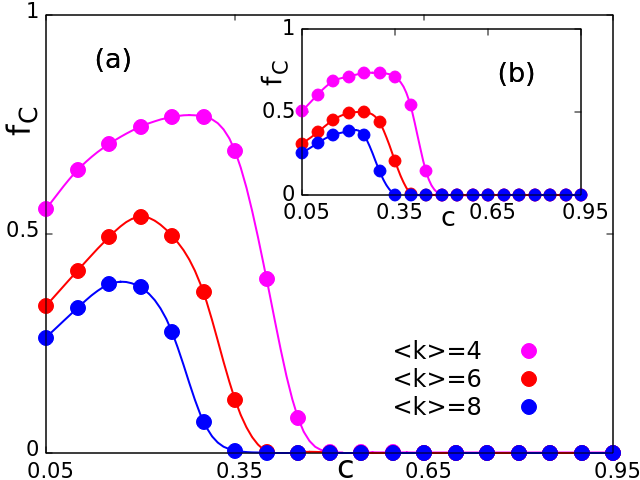
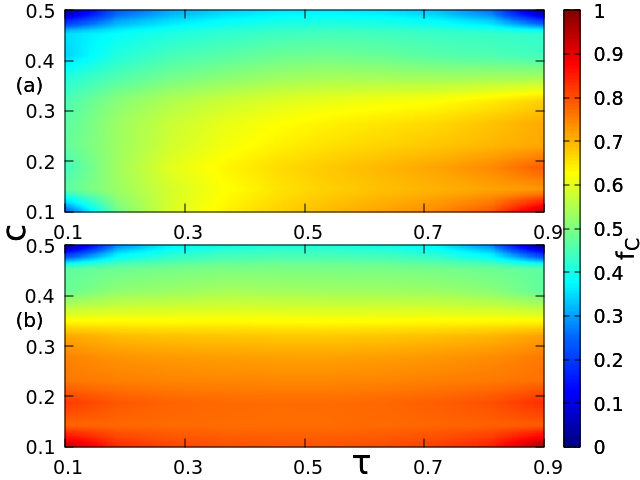
We study the fraction of cooperators, , in both symptomatic and asymptomatic infections at in Fig. 4 for a range of values of cost, . In order to find how varies with the initial fraction of cooperators we measure for in Fig. 5(a) and in Fig. 5(b). We observe that the value of the initial fraction of cooperators does affect the final fraction of proactive individuals to an extent.
From Fig. 4 it is also evident that both mass testing and cost due to precautionary measures have a significant impact on . At higher values of , cooperation will not be maintained in the population. But at lower values of , the maintenance of cooperation would depend on the value of . In class diseases, it is difficult to maintain cooperation at lower values of . This can be intuitively inferred from the fact that it is rather difficult to identify infected individuals without mass testing. Therefore, higher values of can lead to relatively higher cooperation. On the other hand, does not really have a significant impact in class diseases.
Therefore, it is worth noting that when the mass testing ratio, , is low, an asymptomatic disease is likely to infect susceptible individuals more. Naturally, if the infected individuals are not identified early on, then every asymptomatic disease possess the potential to generate a pandemic. On the other hand, individuals belonging to in class diseases, can be identified more easily via clearly manifest symptoms.
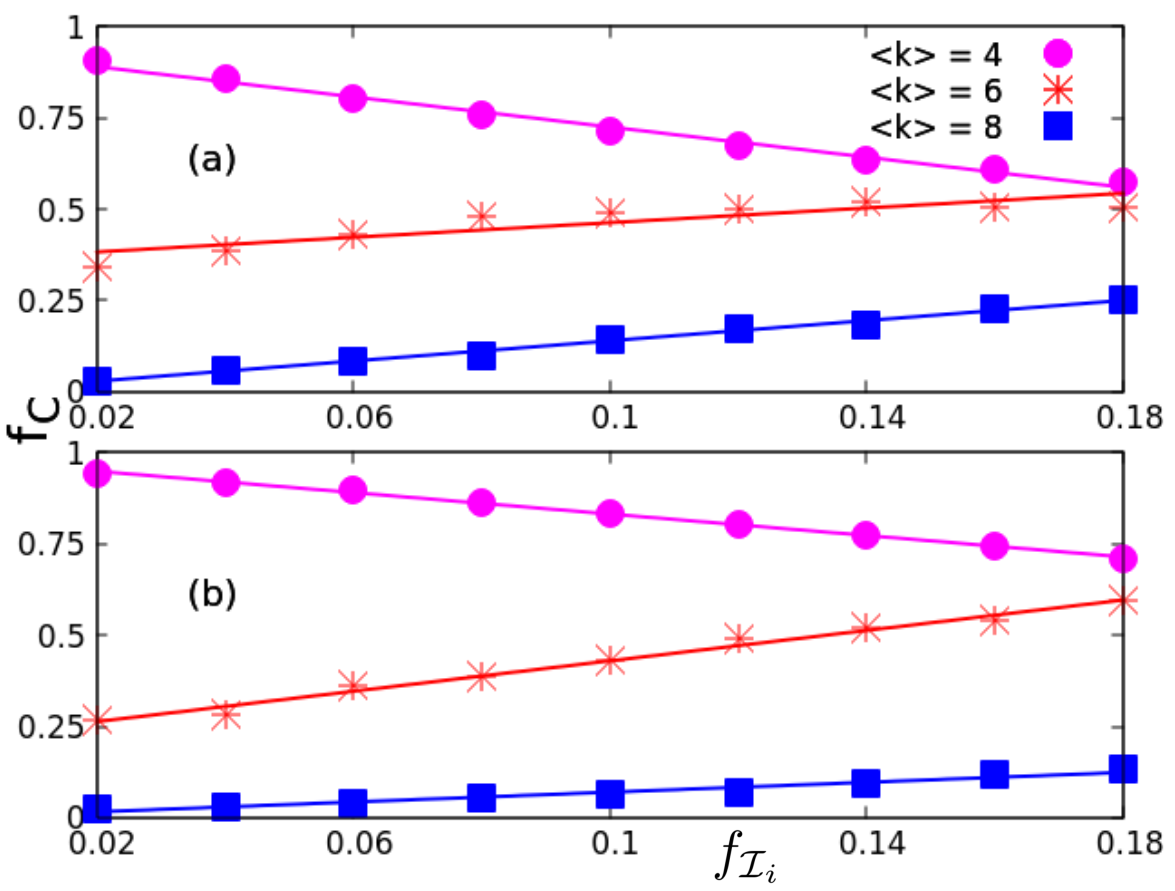
The initial fraction of infected individuals, , reflects the scenario during the initial outbreak of an epidemic. We explore the behaviour of with respect to [40]. A fraction of the population, , is infected right at the onset of the epidemic, before consciousness has taken root in the general population. Consciousness is expected to increase subsequently and the general populace would become aware and responsible. Fig. 6 implies that the final fraction of proactive individuals would decrease in the population at lower . However, at higher , the scenario is not quite similar. In this regime, the final fraction of responsible people would increase slightly in the population. Notably, the broad behaviour is the same for both class and class epidemics.
IV.4 Role of network topology
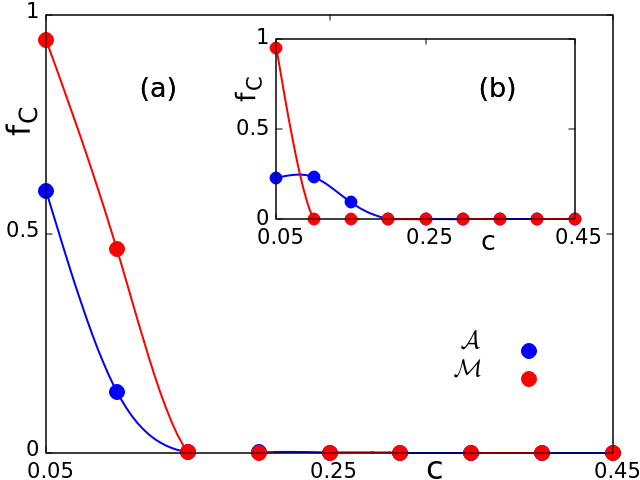
Thus far, we have extensively studied the dynamics on BA networks. We would further like to ascertain the role of network topology on the dynamics of epidemic spreading. Towards this end, we have studied the dynamics on Watts-Strogatz small-world networks (SW) and Erdös-Rényi (ER) networks as demonstrated in Figs. 7(a) and 7(b) respectively. In comparison with the earlier results on BA networks, we observe the final fraction of proactive individuals to vanish at far lower values of the cost in both ER and SW networks for both class and class . This effect is most prominent for class diseases in ER networks. Therefore, population structures on SW and more so on ER networks seem vulnerable to pandemics.
V Discussion
Accurate models of epidemic spreading are essential [41, 42, 43], as has been clearly underscored during the ongoing COVID-19 pandemic, which has raged for more than a year now and caused enormous setback to life, economy and society. Prevalence of asymptomatic carriers complicates the detection and management of any disease to a significant extent [44, 45, 46]. Indeed, the crucial role of asymptomatic carriers has been clearly highlighted in the ongoing COVID-19 pandemic.
Models based on SIRD dynamics or game-theoretic approaches are not be able to capture the complete picture as they usually do not consider the important aspect of asymptomatic carriers [47, 10]. Our model explores the possible effect of various factors in epidemic spreading on various network topologies. We find that the absence of vaccines makes individual and social proactiveness as important factors, which can inhibit disease spreading.
Also, the fraction of the population which has undergone testing is an essential factor in diseases involving asymptomatic phenotypes. In the absence of high enough testing – an asymptomatic disease bears the potential to get converted into a pandemic. We also observe that the fraction of proactive individuals depends upon the initial fraction of both infected as well as proactive individuals. Additionally, edge density can significantly influence the dynamics of epidemic spreading. Furthermore, population structures on small-world networks and more so on Erdös-Rényi networks seem vulnerable to pandemics.
VI Acknowledgements
DN acknowledges his fellowship from the Council of Scientific and Industrial Research (CSIR), India. SR thanks Tarik Hadzibeganovic of University of Graz, Austria for helpful discussions. We are grateful to the three anonymous reviewers of the manuscripts for their critical comments.
DN and SS contributed equally to this work.
References
- Daley and Gani [2001] Daley DJ, Gani J (2001) Epidemic modelling: an introduction. Cambridge University Press
- Riggs et al [2007] Riggs MM, Sethi AK, Zabarsky TF, Eckstein EC, Jump RL, Donskey CJ (2007) Asymptomatic carriers are a potential source for transmission of epidemic and nonepidemic clostridium difficile strains among long-term care facility residents. Clinical Infectious Diseases 45(8):992–998
- Futai [2003] Futai K (2003) Role of asymptomatic carrier trees in epidemic spread of pine wilt disease. Journal of Forest Research 8(4):253–260
- Spinelli and Pellino [2020] Spinelli A, Pellino G (2020) Covid-19 pandemic: perspectives on an unfolding crisis. The British Journal of Surgery 107(7):785–787
- Johnson and Mueller [2002] Johnson NP, Mueller J (2002) Updating the accounts: global mortality of the 1918-1920” spanish” influenza pandemic. Bulletin of the History of Medicine 76:105–115
- Kenah and Miller [2011] Kenah E, Miller JC (2011) Epidemic percolation networks, epidemic outcomes, and interventions. Interdisciplinary Perspectives on Infectious Diseases 2011(543520)
- Wu and Hadzibeganovic [2020] Wu Q, Hadzibeganovic T (2020) An individual-based modeling framework for infectious disease spreading in clustered complex networks. Applied Mathematical Modelling 83:1–12
- Hu et al [2018] Hu P, Ding L, Hadzibeganovic T (2018) Individual-based optimal weight adaptation for heterogeneous epidemic spreading networks. Communications in Nonlinear Science and Numerical Simulation 63:339–355
- Wu and Hadzibeganovic [2018] Wu Q, Hadzibeganovic T (2018) Pair quenched mean-field approach to epidemic spreading in multiplex networks. Applied Mathematical Modelling 60:244–254
- Chang et al [2020] Chang SL, Piraveenan M, Pattison P, Prokopenko M (2020) Game theoretic modelling of infectious disease dynamics and intervention methods: a review. Journal of Biological Dynamics 14(1):57–89
- Adiga et al [2020] Adiga A, Chen J, Marathe M, Mortveit H, Venkatramanan S, Vullikanti A (2020) Data-driven modeling for different stages of pandemic response. Journal of the Indian Institute of Science 100:901–915
- de Arruda et al [2020] de Arruda GF, Petri G, Rodrigues FA, Moreno Y (2020) Impact of the distribution of recovery rates on disease spreading in complex networks. Physical Review Research 2(1):013,046
- Sharma et al [2019] Sharma A, Menon SN, Sasidevan V, Sinha S (2019) Epidemic prevalence information on social networks can mediate emergent collective outcomes in voluntary vaccine schemes. PLoS Computational Biology 15(5):e1006,977
- Castellano and Pastor-Satorras [2020] Castellano C, Pastor-Satorras R (2020) Cumulative merging percolation and the epidemic transition of the susceptible-infected-susceptible model in networks. Physical Review X 10(1):011,070
- Li et al [2014] Li CH, Tsai CC, Yang SY (2014) Analysis of epidemic spreading of an sirs model in complex heterogeneous networks. Communications in Nonlinear Science and Numerical Simulation 19(4):1042–1054
- Leung et al [2018] Leung KY, Trapman P, Britton T (2018) Who is the infector? epidemic models with symptomatic and asymptomatic cases. Mathematical Biosciences 301:190–198
- Choi and Shim [2020] Choi W, Shim E (2020) Optimal strategies for vaccination and social distancing in a game-theoretic epidemiologic model. Journal of Theoretical Biology 505:110,422
- Hoelscher et al [2008] Hoelscher M, Gangappa S, Zhong W, Jayashankar L, Sambhara S (2008) Vaccines against epidemic and pandemic influenza. Expert Opinion on Drug Delivery 5(10):1139–1157
- Bai et al [2020] Bai Y, Yao L, Wei T, Tian F, Jin DY, Chen L, Wang M (2020) Presumed asymptomatic carrier transmission of covid-19. The Journal of the American Medical Association 323(14):1406–1407
- Liu and Stechlinski [2017] Liu X, Stechlinski P (2017) Infectious Disease Modeling, vol 19. Springer
- Banerjee and Roy [2012] Banerjee SJ, Roy S (2012) Key to network controllability. arXiv arXiv:1209.3737
- Banerjee et al [2015a] Banerjee SJ, Sinha S, Roy S (2015a) Slow poisoning and destruction of networks: Edge proximity and its implications for biological and infrastructure networks. Physical Review E 91(2):022,807
- Banerjee et al [2015b] Banerjee SJ, Azharuddin M, Sen D, Savale S, Datta H, Dasgupta AK, Roy S (2015b) Using complex networks towards information retrieval and diagnostics in multidimensional imaging. Scientific Reports 5:17,271
- Kaur Grewal et al [2015] Kaur Grewal R, Mitra D, Roy S (2015) Mapping networks of light–dark transition in lov photoreceptors. Bioinformatics 31(22):3608–3616
- Deb et al [2020] Deb A, Grewal RK, Roy S, Mitra D (2020) Residue interaction dynamics in vaucheria aureochrome1 light-oxygen-voltage: Bridging theory and experiments. Proteins: Structure, Function, and Bioinformatics 88(12):1660–1674
- Sinha et al [2021] Sinha S, Samaddar S, Das Gupta SK, Roy S (2021) Network approach to mutagenesis sheds insight on phage resistance in mycobacteria. Bioinformatics 37(2):213–220
- Sinha et al [2019] Sinha S, Ghosh S, Roy S (2019) A pedestrian review of games on structured populations. International Journal of Advances in Engineering Sciences and Applied Mathematics 11(2):138–152
- Nath et al [2021] Nath D, Sinha S, Roy S (2021) Scale-free networks may not necessarily witness cooperation. arXiv arXiv:2101.01167
- Sinha et al [2021] Sinha S, Nath D, Roy S (2021) Topology dependent payoffs can lead to escape from prisoner’s dilemma. The European Physical Journal B 94(4):80
- Rowlett and Karlsson [2020] Rowlett J, Karlsson CJ (2020) Decisions and disease: the evolution of cooperation in a pandemic. Scientific Reports 10:13,113
- Chen [2020] Chen X (2020) Infectious disease modeling and epidemic response measures analysis considering asymptomatic infection. IEEE Access 8:149,652–149,660
- Liu et al [2017] Liu X, He M, Kang Y, Pan Q (2017) Fixation of strategies with the moran and fermi processes in evolutionary games. Physica A: Statistical Mechanics and its Applications 484:336–344
- Santos and Pacheco [2005] Santos FC, Pacheco JM (2005) Scale-free networks provide a unifying framework for the emergence of cooperation. Physical Review Letters 95(9):098,104
- Kemper [1978] Kemper JT (1978) The effects of asymptomatic attacks on the spread of infectious disease: a deterministic model. Bulletin of Mathematical Biology 40(6):707–718
- De la Sen et al [2017] De la Sen M, Ibeas A, Alonso-Quesada S, Nistal R (2017) On a new epidemic model with asymptomatic and dead-infective subpopulations with feedback controls useful for ebola disease. Discrete Dynamics in Nature and Society 2017
- Israel [2017] Israel P (2017) Asymptomatic infections: The hidden epidemic. International Journal of Clinical Research & Trials 2(118)
- Moghadas et al [2017] Moghadas SM, Shoukat A, Espindola AL, Pereira RS, Abdirizak F, Laskowski M, Viboud C, Chowell G (2017) Asymptomatic transmission and the dynamics of zika infection. Scientific reports 7(1):1–8
- Nishiura et al [2020] Nishiura H, Kobayashi T, Miyama T, Suzuki A, Jung Sm, Hayashi K, Kinoshita R, Yang Y, Yuan B, Akhmetzhanov AR, et al (2020) Estimation of the asymptomatic ratio of novel coronavirus infections (covid-19). International Journal of Infectious Diseases 94:154
- Lewis-Jones [2004] Lewis-Jones S (2004) Zoonotic poxvirus infections in humans. Current Opinion in Infectious Diseases 17(2):81–89
- Sahneh et al [2012] Sahneh FD, Chowdhury FN, Scoglio CM (2012) On the existence of a threshold for preventive behavioral responses to suppress epidemic spreading. Scientific Reports 2:632
- Liang [2020] Liang K (2020) Mathematical model of infection kinetics and its analysis for covid-19, sars and mers. Infection, Genetics and Evolution 82:104,306
- McBryde et al [2020] McBryde ES, Meehan MT, Adegboye OA, Adekunle AI, Caldwell JM, Pak A, Rojas DP, Williams B, Trauer JM (2020) Role of modelling in covid-19 policy development. Paediatric Respiratory Reviews 35:57–60
- Currie et al [2020] Currie CS, Fowler JW, Kotiadis K, Monks T, Onggo BS, Robertson DA, Tako AA (2020) How simulation modelling can help reduce the impact of covid-19. Journal of Simulation 14(2):83–97
- Yu and Yang [2020] Yu X, Yang R (2020) Covid-19 transmission through asymptomatic carriers is a challenge to containment. Influenza and Other Respiratory Viruses 14(4):474–475
- Recalcati [2020] Recalcati S (2020) Cutaneous manifestations in covid-19: a first perspective. Journal of the European Academy of Dermatology and Venereology 34(5):e212–e213
- Lai et al [2020] Lai CC, Liu YH, Wang CY, Wang YH, Hsueh SC, Yen MY, Ko WC, Hsueh PR (2020) Asymptomatic carrier state, acute respiratory disease, and pneumonia due to severe acute respiratory syndrome coronavirus 2 (sars-cov-2): Facts and myths. Journal of Microbiology, Immunology and Infection 53(3):404–412
- Iwamura and Tanimoto [2018] Iwamura Y, Tanimoto J (2018) Realistic decision-making processes in a vaccination game. Physica A: Statistical Mechanics and its Applications 494:236–241
- Biswas and Pathi [2020] Biswas S, Pathi K (2020) India’s new paper covid-19 test could be a ‘game changer’. BBC News URL https://www.bbc.com/news/world-asia-india-54338864
- Žilinskas et al [2021] Žilinskas J, Lančinskas A, Guarracino MR (2021) Pooled testing with replication as a mass testing strategy for the COVID-19 pandemics. Scientific Reports 11:3459
- Costello [2020] Costello A (2020) Mass testing is the only way to stop the virus – it’s long overdue. The Guardian URL https://www.theguardian.com/commentisfree/2020/mar/25/mass-covid-19-testing-is-vital-but-the-data-must-be-localised
- Gallagher [2020] Gallagher J (2020) Mass testing: Can it save us from another lockdown? BBC News URL https://www.bbc.com/news/health-54826403
- Yang et al [2021] Yang Q, Saldi TK, Gonzales PK, Lasda E, Decker CJ, et al (2021) Just 2% of sars-cov-2-positive individuals carry 90% of the virus circulating in communities. Proceedings of the National Academy of Sciences 118(21), DOI 10.1073/pnas.2104547118