11email: evgeniizh@campus.technion.ac.il; chaimbaskin@campus.technion.ac.il; bron@cs.technion.ac.il; avi.mendelson@cs.technion.ac.il
Self-Supervised Learning for Large-Scale Unsupervised Image Clustering
Abstract
Unsupervised learning has always been appealing to machine learning researchers and practitioners, allowing them to avoid an expensive and complicated process of labeling the data. However, unsupervised learning of complex data is challenging, and even the best approaches show much weaker performance than their supervised counterparts. Self-supervised deep learning has become a strong instrument for representation learning in computer vision. However, those methods have not been evaluated in a fully unsupervised setting. In this paper, we propose a simple scheme for unsupervised classification based on self-supervised representations. We evaluate the proposed approach with several recent self-supervised methods showing that it achieves competitive results for ImageNet classification ( accuracy on ImageNet with clusters and with overclustering). We suggest adding the unsupervised evaluation to a set of standard benchmarks for self-supervised learning. The code is available at https://github.com/Randl/kmeans_selfsuper.
Keywords:
Deep Neural Networks, Unsupervised Deep Learning, Representation learning, Self-Supervised Learning1 Introduction
Deep learning has become the primary tool in various computer vision tasks, being especially successful in image classification, detection, and segmentation. However, along with massive computing resources required to train state-of-the-art neural networks (NNs), massive datasets with millions of labeled samples are a necessary part of its success. Since creating those datasets is a costly procedure, researchers have recently started looking at the methods of training NNs without labeled data. Those methods commonly referred to as self-supervised learning recently has become a powerful instrument for large-scale computer vision.
A result of training a network in a self-supervised manner is usually a representation: a vector in a latent space. Evaluation of those representations proceeds mainly by two following approaches: fine-tuning the network as a feature extractor for some task (common choices are segmentation tasks or ImageNert classification on a small amount of data, e.g., of labels) or training a linear classifier on the extracted features. A variation of the latter is to train a -nearest neighbor classifier instead of a linear classifier. While linear classification directly evaluates the learned representation, it is not always capable of predicting performance on downstream tasks Resnick et al. (2019). On the other hand, performance of a fine-tuned network strongly depends on the training procedure which is hard to separate from the quality of the representation itself.
In computer vision, the main approaches to training a network in a self-supervised manner are contrastive losses, pretext tasks, and generative models. Contrastive methods van den Oord et al. (2018); Ye et al. (2019); Ermolov et al. (2020) try to create different views of the same image and bring a representation of different views closer and representations of different images farther apart. Alternatively, it is possible to train the network to perform some label-free pretext task, such as predicting context Doersch et al. (2015), image rotation Gidaris et al. (2018); Kolesnikov et al. (2019), colorization Zhang et al. (2016), solving “jigsaw puzzle” Kim et al. (2018), etc. Generative-based representation learning uses the latent vectors of a generative model, e.g., Boltzmann machines Lee et al. (2009), autoencoders Caron et al. (2018a) or GANs Donahue et al. (2016); Donahue and Simonyan (2019), as a representation.
The overview of recent methods of self-supervised and unsupervised approaches is given in Table 1.
| Method | Code | Checkpoints | ResNet-50 | Best |
| CPC van den Oord et al. (2018) | – | – | – | |
| CPC v2 Hénaff et al. (2019) | – | – | ||
| AMDIM Bachman et al. (2019) | + | + | – | |
| CMC Tian et al. (2019) | + | + | ||
| BigBiGAN Donahue and Simonyan (2019) | – | + | – | |
| MoCo He et al. (2019) | + | + | ||
| Self-Label Asano et al. (2019) | + | + | ||
| SimCLR Chen et al. (2020b) | + | + | ||
| MoCo v2 Chen et al. (2020d) | + | + | ||
| InfoMin Tian et al. (2020) | + | + | ||
| BYOL Grill et al. (2020) | + | + | ||
| SwAV Caron et al. (2020) | + | + | ||
| SimCLRv2 Chen et al. (2020c) | + | + | ||
| iGPT Chen et al. (2020a) | + | + | ||
| Clustering from pretext Van Gansbeke et al. (2020) | + | + | – | – |
Contribution
In this paper, we propose an additional way of evaluating self-supervised learning: training a clustering algorithm on extracted features in an unsupervised manner. While this method suffers from similar disadvantages as linear evaluation, it can provide additional insights and a benchmark for unsupervised learning on large-scale datasets, such as ImageNet. We also show that self-supervised learning provides a strong baseline for unsupervised computer vision and mentions some possible direction for the current self-supervised methods performance improvement.
Thanks to the increasing trend of publishing pre-trained models and code, we were able to test the existing approaches on the proposed benchmark. In particular, we show that the best-performing self-supervised algorithm achieves almost top-1 accuracy on ImageNet without any supervision. Those results are on par with a specialized clustering approach by Van Gansbeke et al. (2020). We also evaluate ObjectNet Barbu et al. (2019), a dataset created for testing image classification algorithms in conditions closer to real-life, and conclude that it is hard to achieve generalization in unsupervised settings.
This benchmark provides a more challenging task for future self-supervised learning approaches, allowing them to better track their progress.
2 Method
2.1 Metrics
The evaluation of unsupervised learning methods is a complicated topic, and many different metrics were developed. In this section, we briefly review the metrics we utilized for clustering evaluation.
Accuracy
In the presence of ground truth labels, it is possible to evaluate the prediction accuracy by assigning classes to predicted clusters. Similarly to previous works Xie et al. (2015); Jiang et al. (2016); Van Gansbeke et al. (2020) we use linear assignment Kuhn (1955); Crouse (2016) for assignment of clusters to the classes. In cases when the number of clusters is larger than the number of classes (overclustering), we assign one cluster to each class, while the rest is assigned greedily to maximize accuracy.
Normalized Mutual Information (V-measure)
For a partition of the instances, , we define entropy as
| (1) |
and mutual information between two partitions as
| (2) |
where
| (3) | ||||
| (4) |
To be able to compare mutual information in different cases, it is usually normalized Kvalseth (1987):
| (5) |
where is some function, in our case the arithmetic mean.
Adjusted Mutual Information
Since mutual information tends to have larger values when the number of clusters is large, mutual information should be adjusted for random chance Vinh et al. (2010)
| (6) |
Adjusted Rand Index
Rand index Rand (1971) is another measure of clustering quality. It can be viewed as an accuracy measure over pairs of instances: denoting the number of pairs as , the number of pairs of instances that belong to the same set in both partitions as TP, and the number of pairs of instances that belong to the different sets in both partitions as TN, we define Rand index as
| (7) |
We also adjust the index for chance in the usual manner Hubert and Arabie (1985):
| (8) |
where is the maximal value of Rand index.
2.2 Evaluation
To train a clustering model, we extract features of both the training and the validation set with a pre-trained model. We do not apply any augmentations during feature extraction. As opposed to the existing clustering approaches, e.g., DeepCluster Caron et al. (2018b), our method does not utilize a clustering objective as a part of feature extractor training, but merely uses a feature extractor pre-trained in a self-supervised manner.
Modern clustering approaches are usually based on some distance between different samples. Unfortunately, if the dimension of space is high, the distance between samples provides a little information. In our case, since most of the methods provide at least -dimensional embeddings, we apply dimensional reduction. In particular, we train incremental PCA model with batch size , where is the dimension of extracted features.
After applying dimensional reduction, we train mini-batch variation of k-means with the transformed features. Since the features are extracted only once, the training clustering model is relatively cheap. Depending on the model, it takes a couple of hours on CPU. Using augmentation and training first PCA and then clustering models can boost performance but is much more resource-demanding.
While by default, we set the number of clusters to be (number of ImageNet classes), we also experiment with overclustering, following Van Gansbeke et al. (2020).
3 Experimental Results
We evaluate recent state-of-the-art approaches with the proposed protocol: MoCo v2 Chen et al. (2020d), InfoMin Tian et al. (2020), SwAV Caron et al. (2020), SimCLRv2 Chen et al. (2020c), and BigBiGAN Donahue and Simonyan (2019). For every paper, we evaluate ResNet-50 and best performing network. We also add results for three models trained in supervised manner111We employ evaluation code by Wightman (2020).: ResNet-152, EfficientNet-L2 Xie et al. (2019), and IG-ResNeXt-101 3248d Mahajan et al. (2018).
For experiments, we utilize feature extracted from two different datasets: ImageNet and ObjectNet Barbu et al. (2019).
We trained k-means for 60 epochs, but even 1 epoch often gets decent results.
ImageNet
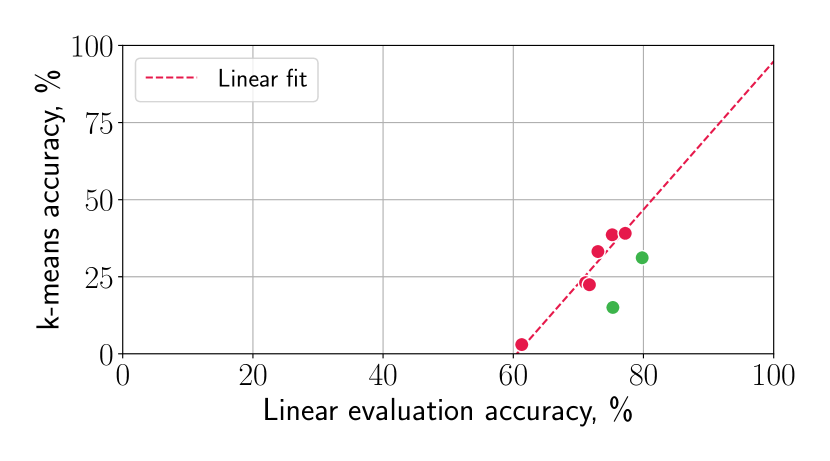
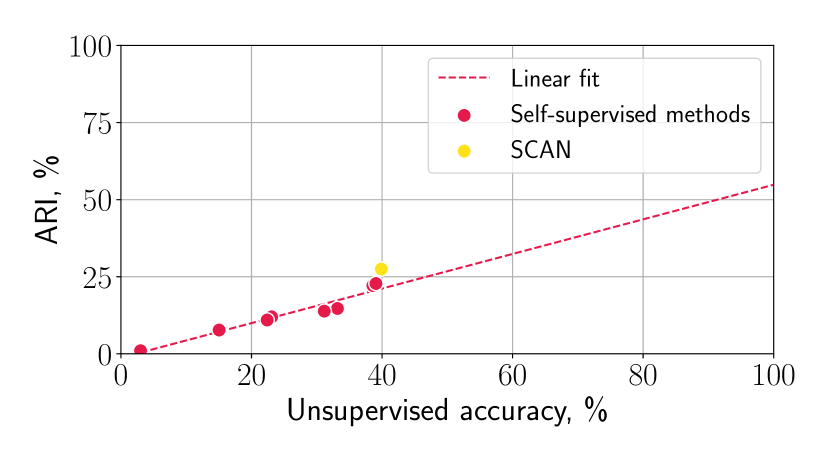
Experimental results for ImageNet are shown in Table 2. During accuracy calculation, we used training labels for cluster assignment. In addition, we visualize different metrics in Fig. 1. We note a strong correlation between linear evaluation accuracy and k-means accuracy, except for SimCLRv2 (ResNet-152 3, SK) and SwAV. We note that SCAN Van Gansbeke et al. (2020) gives significantly larger ARI for similar accuracy values. We also note that both supervised and self-supervised methods with high-dimensional embeddings ( ResNet-152 3 and EfficientNet-L2) show weaker results than their counterparts.
| Method | Linear (super.) | ACC | ARI | AMI | NMI |
|---|---|---|---|---|---|
| MoCo v2 (ResNet-50) | |||||
| InfoMin (ResNet-50) | |||||
| SwAV (ResNet-50) | |||||
| SimCLRv2 (ResNet-50) | |||||
| BigBiGAN (RevNet-50 4) | |||||
| InfoMin (ResNeXt-152) | |||||
| SimCLRv2 (ResNet-152, SK) | |||||
| SimCLRv2 (ResNet-152 3, SK) | |||||
| SimCLRv2 (ResNet-152, SK, 1.5 over.) | |||||
| SCAN Van Gansbeke et al. (2020) | |||||
| Self-label Asano et al. (2019) | |||||
| Self-label over. Asano et al. (2019) | |||||
| ResNet-152 (super.) | |||||
| IG-ResNeXt-101 3248d (super.) | |||||
| EfficientNet-L2 (super.) |
ObjectNet
To access the generalization of acquired clustering, in addition to ImageNet, we evaluate the proposed method on ObjectNet. ObjectNet is a test set for vision tasks, created to control the performance of vision algorithms in settings close to real life.
Table 3 shows results for k-means trained on ImageNet training set. In this case, we evaluated only on intersecting classes between ImageNet and ObjectNet. We show accuracy both for cluster assignment based on ImageNet training set (ACC-tr) and ObjectNet itself (ACC-val). Note that since some ObjectNet classes are mapped to two different ImageNet classes, assigning all images to a single class will result in accuracy. By manually inspecting the predictions of the k-means, we conclude that in many cases, assignment of a large part of instances to a single class indeed happens.
When the ImageNet cluster assignment is used, no network, including supervised ones, show better-than-random performance. For ObjectNet assignment, only BigBiGAN (as well as supervised networks) is significantly better than assigning all the instances to a single class. Moreover, ResNet-50 shows better results than larger networks among different self-supervised networks. We advise that, as for now, AMI should be used as a metric for tracking progress on this task.
Table 4 shows results for clustering trained directly on ObjectNet. For pre-trained models, the performance on classes that are part of ImageNet is much better: for example, IG-ResNeXt-101 3248d, has accuracy as compared to for classes not in ImageNet. For self-supervised, the difference is much smaller: for InfoMin, performance on classes not included in ImageNet is the same ().
| Method | ACC-tr | ACC-val | ARI | AMI | NMI |
|---|---|---|---|---|---|
| MoCo v2 (ResNet-50) | |||||
| InfoMin (ResNet-50) | |||||
| SwAV (ResNet-50) | |||||
| SimCLRv2 (ResNet-50) | |||||
| BigBiGAN (RevNet-50 4) | |||||
| InfoMin (ResNeXt-152) | |||||
| SimCLRv2 (ResNet-152, SK) | |||||
| SimCLRv2 (ResNet-152 3, SK) | |||||
| SimCLRv2 (ResNet-152, SK, 1.5 over.) | |||||
| ResNet-152 (super.) | |||||
| IG-ResNeXt-101 3248d (super.) | |||||
| EfficientNet-L2 (super.) |
| Method | ACC | ARI | AMI | NMI |
|---|---|---|---|---|
| MoCo v2 (ResNet-50) | ||||
| InfoMin (ResNet-50) | ||||
| SwAV (ResNet-50) | ||||
| SimCLRv2 (ResNet-50) | ||||
| BigBiGAN (RevNet-50 4) | ||||
| InfoMin (ResNeXt-152) | ||||
| SimCLRv2 (ResNet-152, SK) | ||||
| SimCLRv2 (ResNet-152 3, SK) | ||||
| SimCLRv2 (ResNet-152, SK, 1.5 over.) | ||||
| ResNet-152 (super.) | ||||
| IG-ResNeXt-101 3248d (super.) | ||||
| EfficientNet-L2 (super.) |
3.1 Ablation study
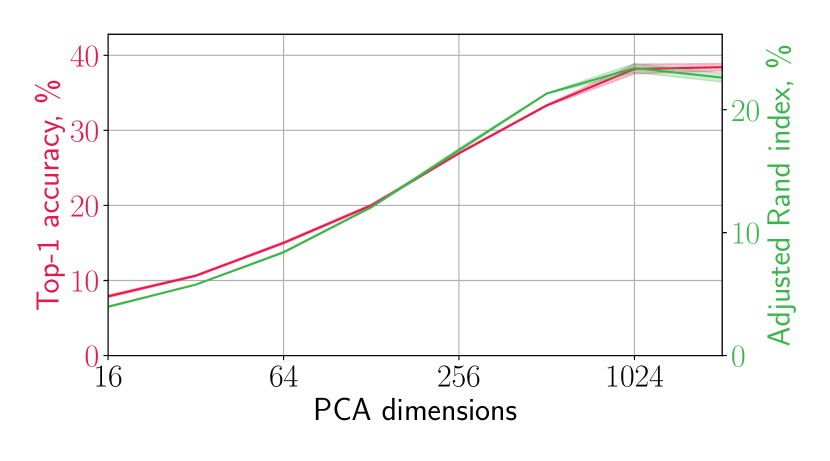
Dimensionality reduction
Fig. 2(a) shows the effect of the number of dimensions used for clustering. As expected, an increasing number of dimensions provide diminishing returns and might harm the results for more than 1024 dimensions.
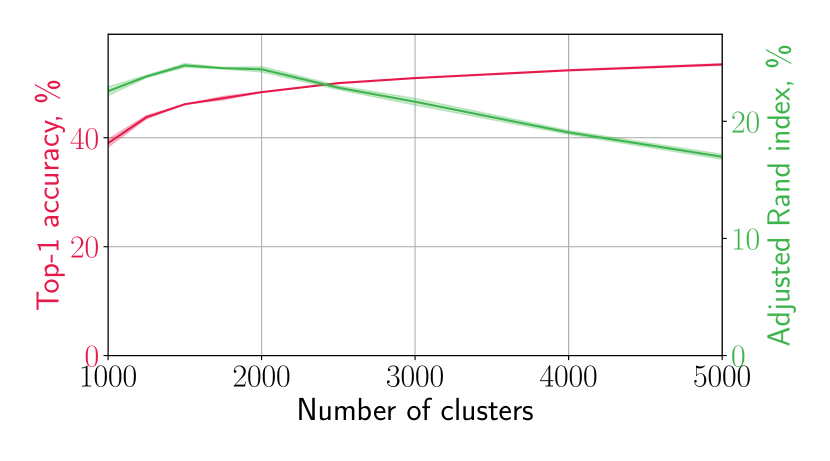
Overclustering
Since some classes in ImageNet may contain fairly different images, increasing the number of clusters beyond 1000 improves not only accuracy (since this metric uses real labels, its calculation inevitably involves passing information), but also ARI, as shown in Fig. 2(b). For that reason, we add overclustering version of the best-performing model to comparison.
4 Conclusion
In this paper, we study the applications of self-supervised learning for unsupervised classification. We establish competitive baselines by just applying PCA dimensional reduction and k-means clustering to features extracted by existing self-supervised methods. Thanks to a practice of publishing both code and pre-trained models, we were able to evaluate multiple state-of-the-art approaches and achieve as high as accuracy on ImageNet in an unsupervised manner and with overclustering.
Also, we propose an unsupervised clustering of extracted features as an additional way to evaluate self-supervised training approaches, along with linear evaluation and transfer learning.
Finally, we raise several issues and possible directions for future work. First, the question of whether severe underperformance of models with higher-dimensional feature space, such as ResNet , remains open. Is it the weakness of the proposed clustering method or rather a property of the model? Can the reduction of the dimension of the embeddings improve performance on other tasks?
Second, the models’ poor performance transferred to ObjectNet, even among supervised models, with a prominent exception of BigBiGAN, is of great interest. Is it possible to achieve high performance on ObjectNet and ImageNet simultaneously, at least at the linear classification level? What is the reason BigBiGAN is the only model showing better-than-random results on ObjectNet? What is performance on other ImageNet-related datasets such as ReaL labels Beyer et al. (2020), ImageNetV2 Recht et al. (2019), ImageNet-R Hendrycks et al. (2020), etc.?
Last, can the approach itself be improved? Can we take into account the method during the self-supervised training without significant performance degradation in other tasks? What is the better approach for dimensional reduction and clustering itself? What is the effect of augmentation in the clustering training phase?
We hope this paper will raise an interest in self-supervised approach to large-scale image clustering.
References
- Asano et al. (2019) Yuki Markus Asano, Christian Rupprecht, and Andrea Vedaldi. Self-labelling via simultaneous clustering and representation learning. arXiv preprint arXiv:1911.05371, 2019. URL https://arxiv.org/abs/1911.05371.
- Bachman et al. (2019) Philip Bachman, R Devon Hjelm, and William Buchwalter. Learning representations by maximizing mutual information across views. arXiv preprint arXiv:1906.00910, 2019. URL https://arxiv.org/abs/1906.00910.
- Barbu et al. (2019) Andrei Barbu, David Mayo, Julian Alverio, William Luo, Christopher Wang, Dan Gutfreund, Josh Tenenbaum, and Boris Katz. ObjectNet: A large-scale bias-controlled dataset for pushing the limits of object recognition models. In H. Wallach, H. Larochelle, A. Beygelzimer, F. d'Alché-Buc, E. Fox, and R. Garnett, editors, Advances in Neural Information Processing Systems 32, pages 9453–9463. Curran Associates, Inc., 2019. URL http://papers.nips.cc/paper/9142-objectnet-a-large-scale-bias-controlled-dataset-for-pushing-the-limits-of-object-recognition-models.
- Beyer et al. (2020) Lucas Beyer, Olivier J Hénaff, Alexander Kolesnikov, Xiaohua Zhai, and Aäron van den Oord. Are we done with ImageNet? arXiv preprint arXiv:2006.07159, 2020. URL https://arxiv.org/abs/2006.07159.
- Caron et al. (2018a) Mathilde Caron, Piotr Bojanowski, Armand Joulin, and Matthijs Douze. Deep clustering for unsupervised learning of visual features. In The European Conference on Computer Vision (ECCV), September 2018a.
- Caron et al. (2018b) Mathilde Caron, Piotr Bojanowski, Armand Joulin, and Matthijs Douze. Deep clustering for unsupervised learning of visual features. In Proceedings of the European Conference on Computer Vision (ECCV), September 2018b. URL https://openaccess.thecvf.com/content_ECCV_2018/html/Mathilde_Caron_Deep_Clustering_for_ECCV_2018_paper.html.
- Caron et al. (2020) Mathilde Caron, Ishan Misra, Julien Mairal, Priya Goyal, Piotr Bojanowski, and Armand Joulin. Unsupervised learning of visual features by contrasting cluster assignments. arXiv preprint arXiv:2006.09882, 2020. URL https://arxiv.org/abs/2006.09882.
- Chen et al. (2020a) Mark Chen, Alec Radford, Rewon Child, Jeffrey Wu, Heewoo Jun, David Luan, and Ilya Sutskever. Generative pretraining from pixels. In Proceedings of Machine Learning and Systems 2020, pages 10466–10478. 2020a. URL https://openai.com/blog/image-gpt/.
- Chen et al. (2020b) Ting Chen, Simon Kornblith, Mohammad Norouzi, and Geoffrey Hinton. A simple framework for contrastive learning of visual representations. arXiv preprint arXiv:2002.05709, 2020b. URL https://arxiv.org/abs/2002.05709.
- Chen et al. (2020c) Ting Chen, Simon Kornblith, Kevin Swersky, Mohammad Norouzi, and Geoffrey Hinton. Big self-supervised models are strong semi-supervised learners. arXiv preprint arXiv:2006.10029, 2020c. URL https://arxiv.org/abs/2006.10029.
- Chen et al. (2020d) Xinlei Chen, Haoqi Fan, Ross Girshick, and Kaiming He. Improved baselines with momentum contrastive learning. arXiv preprint arXiv:2003.04297, 2020d. URL https://arxiv.org/abs/2003.04297.
- Crouse (2016) David F. Crouse. On implementing 2D rectangular assignment algorithms. IEEE Transactions on Aerospace and Electronic Systems, 52(4):1679–1696, 2016. URL https://ieeexplore.ieee.org/document/7738348.
- Doersch et al. (2015) Carl Doersch, Abhinav Gupta, and Alexei A. Efros. Unsupervised visual representation learning by context prediction. In Proceedings of the IEEE International Conference on Computer Vision (ICCV), December 2015. URL https://openaccess.thecvf.com/content_iccv_2015/html/Doersch_Unsupervised_Visual_Representation_ICCV_2015_paper.html.
- Donahue and Simonyan (2019) Jeff Donahue and Karen Simonyan. Large scale adversarial representation learning. In H. Wallach, H. Larochelle, A. Beygelzimer, F. d'Alché-Buc, E. Fox, and R. Garnett, editors, Advances in Neural Information Processing Systems 32, pages 10542–10552. Curran Associates, Inc., 2019. URL http://papers.nips.cc/paper/9240-large-scale-adversarial-representation-learning.
- Donahue et al. (2016) Jeff Donahue, Philipp Krähenbühl, and Trevor Darrell. Adversarial feature learning. arXiv preprint arXiv:1605.09782, 2016. URL https://arxiv.org/abs/1605.09782.
- Ermolov et al. (2020) Aleksandr Ermolov, Aliaksandr Siarohin, Enver Sangineto, and Nicu Sebe. Whitening for self-supervised representation learning. arXiv preprint arXiv:2007.06346, 2020. URL https://arxiv.org/abs/2007.06346.
- Gidaris et al. (2018) Spyros Gidaris, Praveer Singh, and Nikos Komodakis. Unsupervised representation learning by predicting image rotations. arXiv preprint arXiv:1803.07728, 2018. URL https://arxiv.org/abs/1803.07728.
- Grill et al. (2020) Jean-Bastien Grill, Florian Strub, Florent Altché, Corentin Tallec, Pierre H Richemond, Elena Buchatskaya, Carl Doersch, Bernardo Avila Pires, Zhaohan Daniel Guo, Mohammad Gheshlaghi Azar, Bilal Piot, Koray Kavukcuoglu, Rémi Munos, and Michal Valko. Bootstrap your own latent: A new approach to self-supervised learning. arXiv preprint arXiv:2006.07733, 2020. URL https://arxiv.org/abs/2006.07733.
- He et al. (2019) Kaiming He, Haoqi Fan, Yuxin Wu, Saining Xie, and Ross Girshick. Momentum contrast for unsupervised visual representation learning, 2019. URL https://arxiv.org/abs/1911.05722.
- Hénaff et al. (2019) Olivier J. Hénaff, Aravind Srinivas, Jeffrey De Fauw, Ali Razavi, Carl Doersch, SM Eslami, and Aäron van den Oord. Data-efficient image recognition with contrastive predictive coding. arXiv preprint arXiv:1905.09272, 2019. URL https://arxiv.org/abs/1905.09272.
- Hendrycks et al. (2020) Dan Hendrycks, Steven Basart, Norman Mu, Saurav Kadavath, Frank Wang, Evan Dorundo, Rahul Desai, Tyler Zhu, Samyak Parajuli, Mike Guo, Dawn Song, Jacob Steinhardt, and Justin Gilmer. The many faces of robustness: A critical analysis of out-of-distribution generalization. arXiv preprint arXiv:2006.16241, 2020. URL https://arxiv.org/abs/2006.16241.
- Hubert and Arabie (1985) Lawrence Hubert and Phipps Arabie. Comparing partitions. Journal of classification, 2(1):193–218, 1985. URL https://link.springer.com/article/10.1007%2FBF01908075.
- Jiang et al. (2016) Zhuxi Jiang, Yin Zheng, Huachun Tan, Bangsheng Tang, and Hanning Zhou. Variational deep embedding: An unsupervised and generative approach to clustering. arXiv preprint arXiv:1611.05148, 2016. URL https://arxiv.org/abs/1611.05148.
- Kim et al. (2018) Dahun Kim, Donghyeon Cho, Donggeun Yoo, and In So Kweon. Learning image representations by completing damaged jigsaw puzzles. In 2018 IEEE Winter Conference on Applications of Computer Vision (WACV), pages 793–802. IEEE, 2018. URL https://ieeexplore.ieee.org/abstract/document/8354196.
- Kolesnikov et al. (2019) Alexander Kolesnikov, Xiaohua Zhai, and Lucas Beyer. Revisiting self-supervised visual representation learning. In Proceedings of the IEEE/CVF Conference on Computer Vision and Pattern Recognition (CVPR), June 2019. URL https://openaccess.thecvf.com/content_CVPR_2019/html/Kolesnikov_Revisiting_Self-Supervised_Visual_Representation_Learning_CVPR_2019_paper.html.
- Kuhn (1955) Harold W Kuhn. The hungarian method for the assignment problem. Naval research logistics quarterly, 2(1-2):83–97, 1955.
- Kvalseth (1987) Tarald O Kvalseth. Entropy and correlation: Some comments. IEEE Transactions on Systems, Man, and Cybernetics, 17(3):517–519, 1987. URL https://ieeexplore.ieee.org/document/4309069.
- Lee et al. (2009) Honglak Lee, Roger Grosse, Rajesh Ranganath, and Andrew Y. Ng. Convolutional deep belief networks for scalable unsupervised learning of hierarchical representations. In Proceedings of the 26th annual international conference on machine learning, pages 609–616, 2009. URL https://dl.acm.org/doi/abs/10.1145/1553374.1553453.
- Mahajan et al. (2018) Dhruv Mahajan, Ross Girshick, Vignesh Ramanathan, Kaiming He, Manohar Paluri, Yixuan Li, Ashwin Bharambe, and Laurens van der Maaten. Exploring the limits of weakly supervised pretraining. In Proceedings of the European Conference on Computer Vision (ECCV), September 2018. URL https://openaccess.thecvf.com/content_ECCV_2018/html/Dhruv_Mahajan_Exploring_the_Limits_ECCV_2018_paper.html.
- Rand (1971) William M. Rand. Objective criteria for the evaluation of clustering methods. Journal of the American Statistical association, 66(336):846–850, 1971. URL https://www.tandfonline.com/doi/abs/10.1080/01621459.1971.10482356.
- Recht et al. (2019) Benjamin Recht, Rebecca Roelofs, Ludwig Schmidt, and Vaishaal Shankar. Do ImageNet classifiers generalize to ImageNet? In Kamalika Chaudhuri and Ruslan Salakhutdinov, editors, Proceedings of the 36th International Conference on Machine Learning, volume 97 of Proceedings of Machine Learning Research, pages 5389–5400, Long Beach, California, USA, 09–15 Jun 2019. PMLR. URL http://proceedings.mlr.press/v97/recht19a.html.
- Resnick et al. (2019) Cinjon Resnick, Zeping Zhan, and Joan Bruna. Probing the state of the art: A critical look at visual representation evaluation. arXiv preprint arXiv:1912.00215, 2019. URL https://arxiv.org/abs/1912.00215.
- Tian et al. (2019) Yonglong Tian, Dilip Krishnan, and Phillip Isola. Contrastive multiview coding. arXiv preprint arXiv:1906.05849, 2019. URL https://arxiv.org/abs/1906.05849.
- Tian et al. (2020) Yonglong Tian, Chen Sun, Ben Poole, Dilip Krishnan, Cordelia Schmid, and Phillip Isola. What makes for good views for contrastive learning. arXiv preprint arXiv:2005.10243, 2020. URL https://arxiv.org/abs/2005.10243.
- van den Oord et al. (2018) Aäron van den Oord, Yazhe Li, and Oriol Vinyals. Representation learning with contrastive predictive coding. arXiv preprint arXiv:1807.03748, 2018. URL https://arxiv.org/abs/1807.03748.
- Van Gansbeke et al. (2020) Wouter Van Gansbeke, Simon Vandenhende, Stamatios Georgoulis, Marc Proesmans, and Luc Van Gool. SCAN: Learning to classify images without labels. arXiv preprint arXiv:2005.12320, 2020. URL https://arxiv.org/abs/2005.12320.
- Vinh et al. (2010) Nguyen Xuan Vinh, Julien Epps, and James Bailey. Information theoretic measures for clusterings comparison: Variants, properties, normalization and correction for chance. Journal of Machine Learning Research, 11(95):2837–2854, 2010. URL http://jmlr.org/papers/v11/vinh10a.html.
- Wightman (2020) Ross Wightman. PyTorch Image Models, 2020. URL https://github.com/rwightman/pytorch-image-models.
- Xie et al. (2015) Junyuan Xie, Ross Girshick, and Ali Farhadi. Unsupervised deep embedding for clustering analysis. arXiv preprint arXiv:1511.06335, 2015. URL https://arxiv.org/abs/1511.06335.
- Xie et al. (2019) Qizhe Xie, Minh-Thang Luong, Eduard Hovy, and Quoc V. Le. Self-training with noisy student improves ImageNet classification. arXiv preprint arXiv:1911.04252, 2019. URL https://arxiv.org/abs/1911.04252.
- Ye et al. (2019) Mang Ye, Xu Zhang, Pong C. Yuen, and Shih-Fu Chang. Unsupervised embedding learning via invariant and spreading instance feature. In The IEEE Conference on Computer Vision and Pattern Recognition (CVPR), June 2019. URL https://openaccess.thecvf.com/content_CVPR_2019/html/Ye_Unsupervised_Embedding_Learning_via_Invariant_and_Spreading_Instance_Feature_CVPR_2019_paper.html.
- Zhang et al. (2016) Richard Zhang, Phillip Isola, and Alexei A. Efros. Colorful image colorization. In European Conference on Computer Vision, pages 649–666. Springer, 2016. URL https://link.springer.com/chapter/10.1007/978-3-319-46487-9_40.