Precision measurement of the and quadrupole moments in Lu+
Abstract
Precision measurements of the Lu+ and quadrupole moments have been carried out giving and , respectively. The measurements utilize the differential shift between ions in a multi-ion crystal so that effects of external field gradients do not contribute leaving only the well defined Coulomb interaction. At this level of precision, hyperfine-mediated corrections will likely be important.
I Introduction
The atomic electric quadrupole (EQ) moment is a consequence of an atomic state’s non-spherical charge distribution, and results in an interaction between the atom and externally applied electric field gradients. The resulting shift of the atomic energy level has been an important factor in the development of optical atomic clocks, both in terms of accurate assessment of the shift and methods to suppress it. Measurement of the quadrupole moment entails the application of a well defined gradient field, and measuring the shift of the atomic level. However this can be difficult: the shift itself is typically at the Hertz level, which can make it difficult to measure against other effects, such as magnetic field noise, and there is an orientation dependence that can be influenced by stray fields and trap imperfections.
Measurements of the EQ moment have been achieved in a number of different ways. Frequency shifts of optical clock transitions has been used in Hg+ oskay2005measurement , Sr+ barwood2004measurement , and Yb+ schneider2005sub with inaccuracies in the 4-12% range. Another approach has been to measure differential shifts between neighbouring Zeeman states, which eliminates many of the systematics that can influence optical measurements. This approach has achieved inaccuracies of using either dynamic decoupling shaniv2016atomic or decoherence-free entangled states roos2006designer to mitigate problems with magnetic field noise. In all cases, the quadrupole shift is induced by the dc confinement fields including stray fields, which can have a non-negligible contribution dube2013evaluation . To avoid the influence of stray fields, another approach utilized the resonant coupling induced by the oscillating quadrupole field when the Zeeman splitting is half the frequency of the rf trap drive arnold2019oscillating . Although this method eliminated the dependence on stray fields, it was limited by decoherence from magnetic field noise.
Recently, an alternative strategy made use of the differential frequency shift between ions in a multi-ion crystal tan2019suppressing . In this case the shift is almost completely determined from the electric field gradient arising from neighbouring ions: confinement and stray fields appear common mode and magnetic field gradients are small and can be easily compensated. The proof of principle demonstration in tan2019suppressing was primarily limited by magnetic field alignment with respect to the crystal axis. Here we provide an order of magnitude improvement over the previous measurements and also apply the technique to . We obtain a measurement precision that is statistically limited to the level.
The measurements provide a high-precision benchmark test of the theoretical predictions of the quadrupole moments for Lu+ porsev2018clock , as well as the method to evaluate theoretical uncertainty. Previous such tests have been carried out for monovalent systems, such as Ca+ roos2006designer and Sr+ shaniv2016atomic . Theoretical calculations in Lu+ are carried out by a different method that combines configuration interactions and coupled-cluster approaches (CI+all-order method) SafKozJoh09 . This method is used to predict atomic properties for a large variety of systems, including new clock proposals with highly-charged ions KozSafCre18 . To the best of our knowledge, only two high-precision benchmarks exists for any of the properties involving quadrupole matrix elements for systems with more than one valence electron PorSafKoz12 ; MasHoeWan19 , neither of which involve quadrupole moment measurements. Present measurements directly demonstrate the validity of the theory and the corresponding evaluation of uncertainties in the calculated quadrupole moments, essential for guiding future experiments with highly charged ions and other systems PorSafSaf20 .
II Experimental System
Experiments are carried out in a linear Paul trap with axial end caps as used in previous worktan2019suppressing ; kaewuam2020hyperfine . The trap drive voltage of frequency is applied to diagonally opposing electrodes via a quarter wave resonator. Relative to earlier work, the trap drive voltage is lowered and the dc end cap potentials raised, which reduces the amount of axial micromotion on the outer ions and increases the quadrupole shift between ions. The resulting confinement frequencies for a single lutetium ion (176Lu+) are approximately and in the radial direction and in the axial direction. A magnetic field of is used to lift the Zeeman degeneracy. Fluorescence at 646 nm is imaged onto an EMCCD camera with sufficient resolution to provide detection efficiencies of better than 99% for each ion in a three-ion crystal.
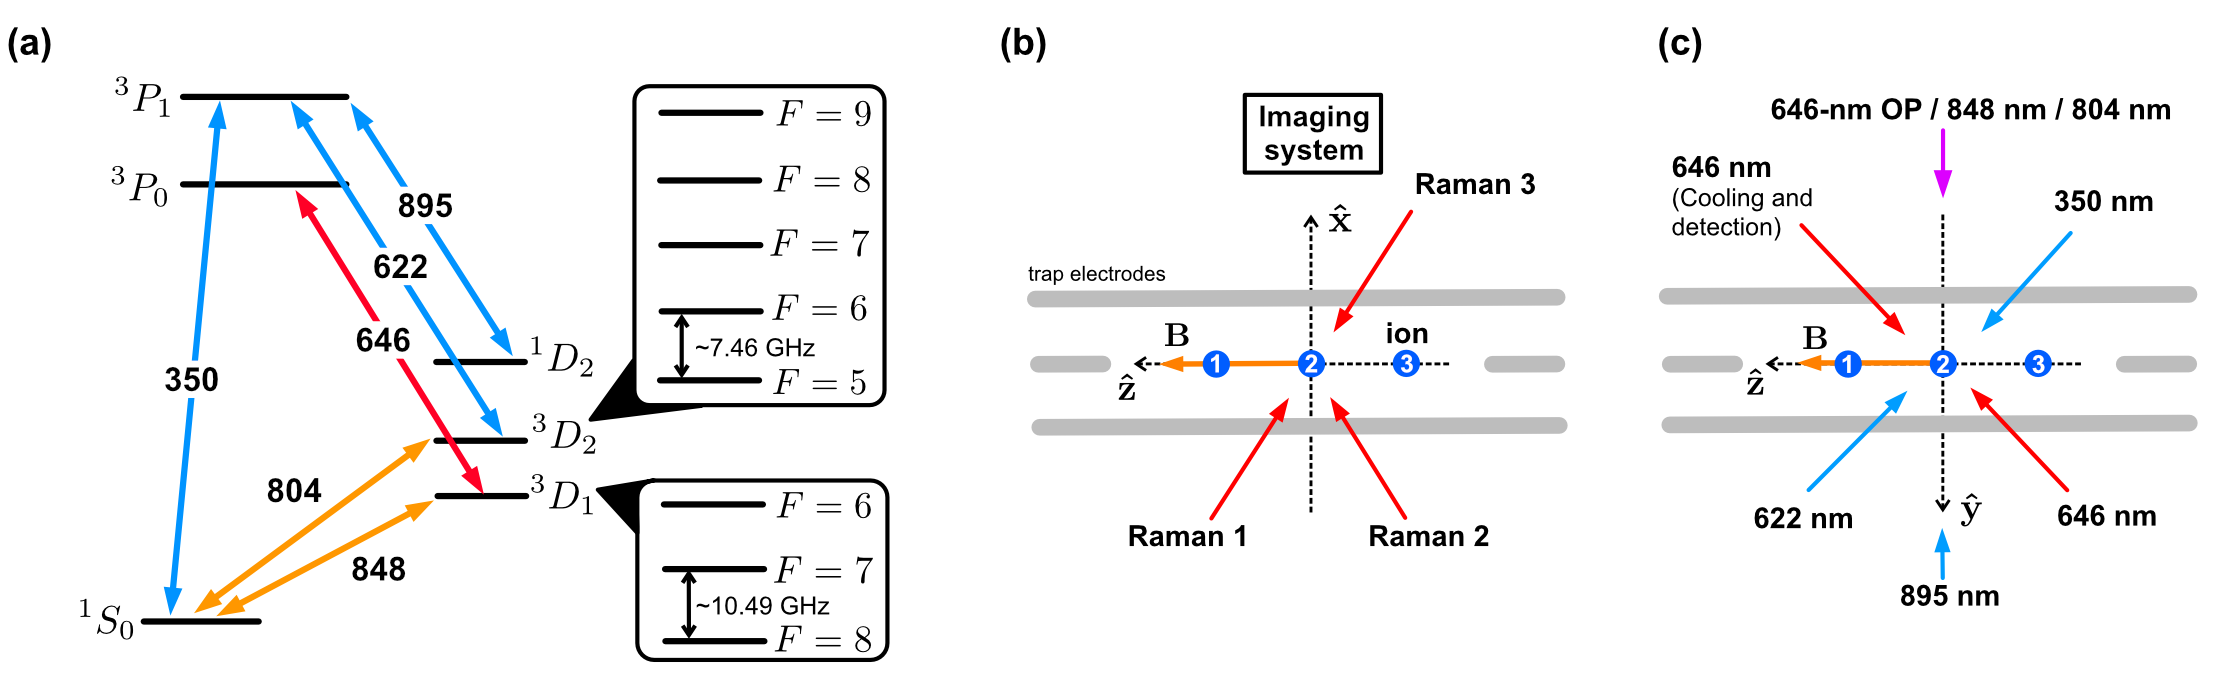
Singly ionized lutetium has two valence electrons with a ground state and low lying states, which provide three optical clock transitions. The and levels are the focus of this work and the relevant level structure is shown in Fig. 1(a). Optical pumping with laser beams at 350, 622, and 895 nm initializes population in the level. Doppler cooling and fluorescence measurements are accomplished with laser beams at 646 nm addressing the transition. An additional -polarized 646-nm beam addressing to facilitates state preparation into . Raman beams at 646 nm provide sideband spectroscopy of the transition for the assessment of micromotion and measurement of trap frequencies. The two lasers at 848 and 804 nm drive the and clock transitions, respectively. All laser beams are switched with acousto-optic modulators (AOM). Laser configurations relative to the trap are as shown in Fig. 1. Microwave transitions between hyperfine levels are driven by an antenna located outside the vacuum chamber.
The clock lasers at 848 and 804 nm are extended-cavity-diode lasers (ECDL), which are phase locked via an optical frequency comb (OFC). The short term (s) stability of the OFC is derived from the linewidth laser at 848 nm, which is referenced to a 10 cm long ultra-low expansion (ULE) cavity with finesse of . For longer times (), the OFC is steered to an active hydrogen maser (HM) reference. Both clock lasers are -polarized allowing transitions to be driven on their respective clock transitions. In addition, the phase lock between the two lasers enables a direct, two-photon transition from to . For this transfer, the clock lasers are detuned by several MHz from their respective clock transitions so they do not influence the transfer.
III Theory
In a linear ion crystal, the EQ shift of induced on the ion due to all other ions is given by Itano2000 ; tan2019suppressing
| (1) |
where is the elementary charge, is the mass of the ion, axial confinement, is the angle between the applied dc magnetic field and the trap axis, and is a scale factor dependent on the position of the position. For a three-ion crystal, . The EQ moment can be written where
| (2) |
and is the quadrupole moment for the fine-structure level defined by
| (3) |
A magnetic field gradient and excess micromotion (EMM) can also provide a small contribution to the differential shift between ions. In a three ion crystal, a magnetic field gradient provides an equal and opposite shift on the two outer ions relative to the inner ion. Although the gradient can be measured accurately in our system, the effects maybe cancelled by averaging over the two outer ions. This leaves only the contribution from EMM.
The only contribution from EMM relevant to a microwave transition is that from the tensor component of the ac Stark shift. The shift on each level, , may be written Berkeland1998
| (4) |
where , is Planck’s constant, is the speed of light, is the elementary charge, the mass of the ion, is the frequency of the applied trap drive, is the angle between the applied magnetic field and the direction of the oscillating field at the ion, and is the static tensor polarizability for the finestructure level. The final term is the fractional second order Doppler (SD) shift due to the velocity, , of the ion.
IV Measurements
The EQ moments are inferred from measurements on the two hyperfine transitions and . In both cases, the differential shift between ions is measured using a servo that treats the inner and outer ions much like a Zeeman pair. A Ramsey sequence consisting of -pulses separated by 1 s is used for interrogation. Measurements alternate either side of the central Ramsey fringe for the outer and inner ions, giving four measurements in total, and frequencies for the inner and outer pair are updated after iterations. Since frequency differences between the outer ions are at the mHz level, their signals are combined so that the servo tracks the mean frequency of both. This cancels small differential shifts between the two outer ions that arise from micromotion and a small magnetic field gradient. Differences in signal contrast between the two outer ions can degrade this cancellation but, since the differences from EMM and field gradients are small, the resulting error is negligible.
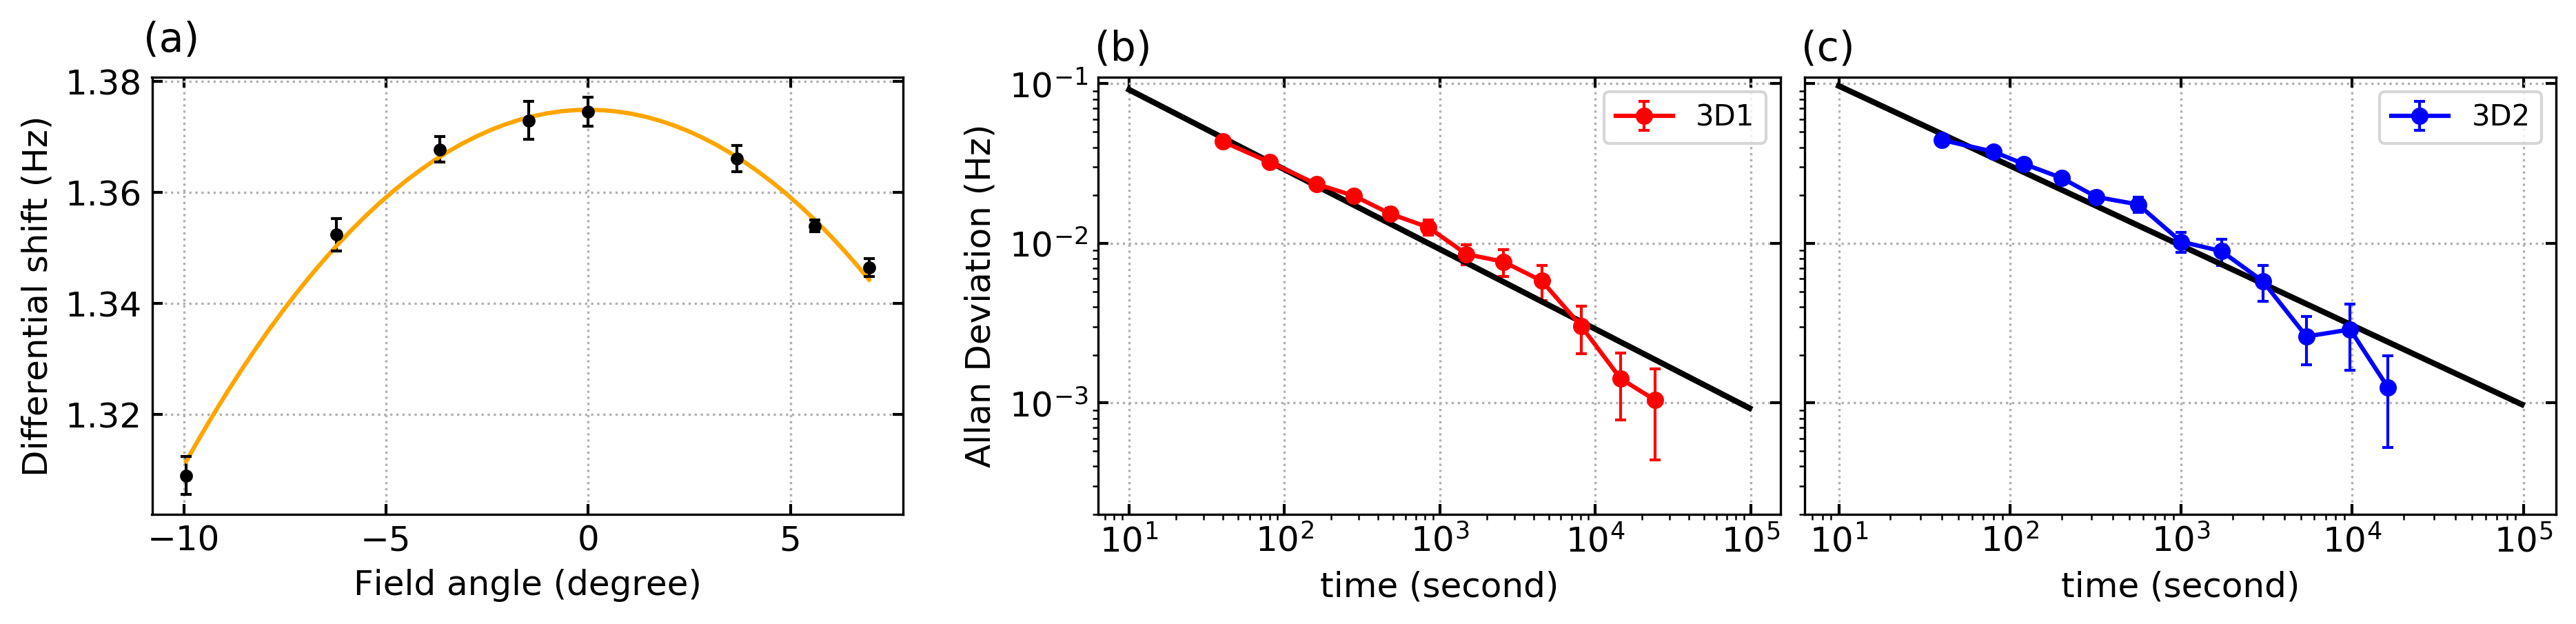
The magnetic field is aligned to the crystal axis by rotating the magnetic field in the horizontal plane and measuring the differential frequency of the microwave transition between the outer and inner ions. At each setting, the optical pumping beam is realigned to the field to optimize state preparation. The experimental sequence begins with ms of Doppler cooling followed by optically pumping to . After the transition to is interrogated, population remaining in is double shelved to allowing detection of population transferred to . Results are plotted in Fig. 2(a), and an Allan deviation for a typical run given in Fig. 2(b). Each point is determined by several hours of averaging and the error bars are determined by the expected projection noise for the measurement duration. The solid curve is a fit to a quadratic, which has a reduced of and an estimated maximum shift of Hz.
By virtue of the optical pumping beam alignment, the magnetic field is well aligned to the horizontal plane, but this need not be the same as the crystal axis. This angle is measured in the same way but at the expense of optical pumping, which limits the range of angles over which measurements can be made. From such measurements we infer an angular misalignment of degrees relative to the field setting that optimizes optical pumping as used for the measurements in Fig. 2.
For , only a single measurement of the microwave transition was carried out, with the magnetic field set to the optimum value inferred from the measurements (horizontal) and optical pumping (vertical). The measurement sequence differs only in the state preparation and detection steps. Specifically, after optical pumping to , the ions are transferred to , and the transition interrogated. Remaining population in is then transferred back to for detection. A total of 15 hours of data collection gives an estimated differential shift of Hz and the Allan deviation is given in Fig. 2(c).
V Systematics
| Contribution | Unc.() | Unc.() | ||
|---|---|---|---|---|
| Meas. shift | 0.63791 | 0.65 | 0.85936 | 1.33 |
| Trap freq. | - | 0.32 | - | 0.43 |
| Angle () | - | 0.06 | - | 0.09 |
| Micromotion | -0.00047 | 0.04 | -0.00050 | 0.05 |
| Anharmonicity | -0.00024 | 0.12 | -0.00033 | 0.16 |
| Corrected | 0.63862 | 0.74 | 0.86019 | 1.41 |
| Axis | ion 1 | ion 2 | ion 3 |
|---|---|---|---|
| -0.73(2) | -0.01(1) | -0.56(2) | |
| -0.27(2) | -0.23(2) | -0.22(2) | |
| -1.43(3) | -0.04(1) | -2.79(6) |
The quadrupole shifts inferred from the measurements presented in the previous section are tabulated in Table 1 along with the leading systematics and their uncertainties. As indicated, the uncertainty budget is dominated by the statistical error and otherwise limited by the determination of the trap frequency and possible anharmonicity of the confinement. The trap frequency was inferred from sideband spectroscopy of the transition and taking the difference between the upper and lower vibrational sidebands to eliminate common mode effects such as ac Stark shifts from the Raman beams. The uncertainty in the frequency reflects the drift of the trap frequency observed over the duration of the measurements.
Trap anharmonicity results in a varying electric field gradient over the spatial extent of the ion crystal, and hence contributes to the differential frequency measurement. This was investigated by numerical simulations of the trapping field, which indicated a fractional increase in the electric field gradient of for the outer ions relative to the center. We have conservatively taken a uncertainty to account for possible imperfections in trap geometry or from stray field contributions, noting that variations in the axial end cap separation by changed the estimate by .
The angle accounts for the angular misalignment of the magnetic field with respect to the crystal axis. For the case, this is partially accounted for as the shift is determined from the fitted curve in Fig. 2(a). Thus the uncertainty in the angle is determined from the vertical direction alone. As the measurement was made by setting the field at the estimated optimum field settings, the uncertainty accounts for both vertical and horizontal directions.
For the measurements described in the previous section, EMM was minimized for a single ion as described in tan2019suppressing . Additionally, it was measured for all three ions along the , , and axes as labeled in Fig. 1, using the sideband-ratio method Berkeland1998 . As in tan2019suppressing , EMM in the plane is detected using stimulated-Raman transitions between and with the two sets of 646-nm beams shown in Fig. 1(a). Along the direction, EMM was measured using the 804-nm clock transition, in which the ion is first transferred from to by the 848-nm laser. The 804-nm transition to is then driven on the rf-sideband, and any remaining population in transferred back to for detection. To make full use of the resolution provided by the clock transition, the 804-nm laser power was increased by a factor of when driving the sideband.
The fractional SD shifts inferred from the sideband ratio measurements are tabulated in Table 2. In each case, the EMM-induced modulation index is inferred from measured Rabi frequencies when flopping on the sideband and carrier transitions and shifts are then inferred from (Berkeland1998, , Eq. 49). Along the axial direction, the difference between the two outer ions is consistent with a small () displacement of the center ion and its corresponding non-zero SD shift. Along the direction, the larger value for the outer ions is consistent with a rotation of the dc confinement field relative to the principle axes determined by the rf field, which might arise from stray fields for example. The larger value along for the middle ion arises from the fact that it was minimized using the less sensitive 646 nm scattering on the rf sideband. This could be improved using the 804-nm measurements, but it is unnecessary for these experiments. Indeed the contribution arising from EMM is on the order of the statistical error from the measurement itself. The uncertainty in the contribution is primarily due to the uncertainty in the tensor polarizability of each transition.
Another possible systematic frequency shift arises from oscillating currents in the electrodes driven by the trap drive at the frequency gan2018oscillating . The resulting ac Zeeman shift depends on the magnitude and orientation of the ac field relative to the applied dc field and could potentially have a spatial variation along the ion crystal. This was investigated using the method in arnold2020precision . Measurements were carried out on three 138Ba+ ions, under three orthogonal orientations of the applied dc field. These measurements confirmed that the ac magnetic field at each ion was approximately orthogonal to the crystal axis, with very little spatial variation along the axis. Field components at each ion are given in Table 3. The most sensitive of the two transitions to the oscillating fields is the transition, for which the inferred differential ac Zeeman shift between outer and inner ions is . This is well below the statistical precision of the quadrupole determination and hence this systematic has been omitted from table 1.
| ion 1 | ion 2 | ion 3 | |
|---|---|---|---|
| 0.8153(9) | 0.8182(8) | 0.8148(10) | |
| 0.079(11) | 0.036(23) | 0.083(11) |
VI Discussion
In summary, we have provided measurements of the and quadrupole moments in 176Lu+. Our measurement scheme utilized the differential shifts between ions in a multi-ion crystal for which external electric field gradients largely appear common mode leaving only the well defined Coulomb interaction. The measurements provided are statistically limited to a precision at the level. In principle this could be improved by increasing the number of ions, which increases the differential shift between ions. However, this would require better control of micromotion over a larger distance and likely increase the importance of anharmonic terms in the potential.
It should be noted that a quadrupole moment attributed to a fine-structure level is only an approximation, as the hyperfine interaction leads to corrections to Eq. 1, which modifies by . This has been explored for the special case of a level in Al+ and In+ for which the hyperfine interaction leads to a nonzero quadrupole moment beloy2017hyperfine . In lutetium, the leading order correction is given by
| (5) |
where
| (6) |
with the magnetic dipole moment of the nucleus, the nuclear magneton, and the rank 1 electronic tensor from the hyperfine interaction beloy2008hyperfine .
From matrix elements given in paez2016atomic ; kaewuam2019spectroscopy , hyperfine-mediated corrections to the EQ moment of states are dominated by contributions from , for which . The corresponding fractional contribution to the estimate of is approximately , which is comparable to the uncertainty given in table 1. Hence improved accuracy in determining would have to account for these terms. Moreover, the corrections to the EQ moment of a given state can be as large as of . Similar considerations also apply to , but currently available matrix elements are insufficient to make more quantitative statements. Consequently we tentatively give
| (7) | ||||
| (8) |
as the quadrupole moments of and , respectively, with the reservation that hyperfine-mediated terms have not been accounted for.
CI+all-order calculations porsev2018clock yielded 0.653 and 0.885 for the quadrupole moments of the and states, respectively, taking into account the factor of 2 difference in the definition of the quadrupole moment in porsev2018clock and Itano2000 , which is used here. The estimated accuracy of these values is 1.5% and 3.1%, respectively. These uncertainties are obtained as the differences of the CI+all-order and another calculation, where CI is combined with the many-body perturbation theory. Such a method is commonly used in the evaluation of the uncertainties of the CI+all-order values for various properties MasHoeWan19 . The theory values agree with the experimental results to within 2.2% and 2.9%, for the and states, respectively, which is supportive of the method used to estimate the theoretical uncertainties. Consideration of the much smaller hyperfine-mediated terms does not affect this conclusion.
In principle, could be determined by comparing measurements over multiple microwave transitions. However, there is currently insufficient accuracy for this to provide a meaningful estimate of . An alternative possibility, is to note that uncertainty in the theoretical value is primarily due to the matrix element . This same matrix element appears in the hyperfine-mediated corrections to the electronic -factors. Thus, accurate -factor measurements may provide an experimental determination of . A more detailed analysis of hyperfine-mediated effects and -factor measurements is currently in progress.
Acknowledgements.
This work is supported by the National Research Foundation, Prime Ministers Office, Singapore and the Ministry of Education, Singapore under the Research Centres of Excellence programme. It is also supported by the National Research Foundation, Singapore, hosted by National University of Singapore under the Quantum Engineering Programme (Grant Award QEP-P5). M.S.S. acknowledges the sponsorship of ONR Grants No. N00014-17-1-2252 and N00014-20-1-2513.References
- (1) WH Oskay, Wayne M Itano, and James C Bergquist. Measurement of the 199Hg+ electric quadrupole moment and a constraint on the quadrupole shift. Physical review letters, 94(16):163001, 2005.
- (2) GP Barwood, HS Margolis, G Huang, P Gill, and HA Klein. Measurement of the electric quadrupole moment of the level in 88Sr+. Physical review letters, 93(13):133001, 2004.
- (3) T Schneider, E Peik, and Chr Tamm. Sub-hertz optical frequency comparisons between two trapped 171Yb+ ions. Physical review letters, 94(23):230801, 2005.
- (4) Ravid Shaniv, Nitzan Akerman, and Roee Ozeri. Atomic quadrupole moment measurement using dynamic decoupling. Physical review letters, 116(14):140801, 2016.
- (5) Christian F Roos, M Chwalla, K Kim, M Riebe, and Rainer Blatt. ‘designer atoms’ for quantum metrology. Nature, 443(7109):316–319, 2006.
- (6) Pierre Dubé, Alan A Madej, Zichao Zhou, and John E Bernard. Evaluation of systematic shifts of the 88Sr+ single-ion optical frequency standard at the level. Physical Review A, 87(2):023806, 2013.
- (7) Kyle J Arnold, R Kaewuan, TR Tan, and MD Barrett. Oscillating quadrupole effects in high-precision metrology. Physical Review A, 99(2):022515, 2019.
- (8) Ting Rei Tan, Rattakorn Kaewuam, Kyle J Arnold, Sapam R Chanu, Zhiqiang Zhang, Marianna Safronova, and Murray D Barrett. Suppressing inhomogeneous broadening in a lutetium multi-ion optical clock. Phys. Rev. Lett., 123:063201, 2019.
- (9) SG Porsev, UI Safronova, and MS Safronova. Clock-related properties of Lu+. Physical Review A, 98(2):022509, 2018.
- (10) M. S. Safronova, M. G. Kozlov, W. R. Johnson, and Dansha Jiang. Development of a configuration-interaction plus all-order method for atomic calculations. Phys. Rev. A, 80(1):012516, July 2009.
- (11) M. G. Kozlov, M. S. Safronova, J. R. Crespo López-Urrutia, and P. O. Schmidt. Highly charged ions: Optical clocks and applications in fundamental physics. Reviews of Modern Physics, 90(4):045005, October 2018.
- (12) S. G. Porsev, M. S. Safronova, and M. G. Kozlov. Calculation of quadrupole polarizabilities with combined configuration interaction and coupled-cluster method. Phys. Rev. A, 85(6):062517, June 2012.
- (13) Daniel L. Maser, Eli Hoenig, B. Y. Wang, P. M. Rupasinghe, S. G. Porsev, M. S. Safronova, and P. K. Majumder. High-precision measurement and ab initio calculation of the (6 s26 p2) 3pp2 electric-quadrupole-transition amplitude in 208pb. Phys. Rev. A, 100(5):052506, November 2019.
- (14) S. G. Porsev, U. I. Safronova, M. S. Safronova, P. O. Schmidt, A. I. Bondarev, M. G. Kozlov, and I. I. Tupitsyn. Optical clocks based on the cf15+ and cf17+ ions. Phys. Rev. A, 102:012802, 2020.
- (15) R Kaewuam, TR Tan, KJ Arnold, SR Chanu, Zhiqiang Zhang, and MD Barrett. Hyperfine averaging by dynamic decoupling in a multi-ion lutetium clock. Physical Review Letters, 124(8):083202, 2020.
- (16) Wayne M Itano. External-field shifts of the 199Hg+ optical frequency standard. Jour. Res. of the Nat. Inst. of Stan. and Tech., 105(6):829, 2000.
- (17) DJ Berkeland, JD Miller, James C Bergquist, Wayne M Itano, and David J Wineland. Minimization of ion micromotion in a paul trap. Journal of applied physics, 83(10):5025–5033, 1998.
- (18) HCJ Gan, G Maslennikov, K-W Tseng, TR Tan, R Kaewuam, KJ Arnold, D Matsukevich, and MD Barrett. Oscillating-magnetic-field effects in high-precision metrology. Physical Review A, 98(3):032514, 2018.
- (19) KJ Arnold, R Kaewuam, SR Chanu, TR Tan, Zhiqiang Zhang, and MD Barrett. Precision measurements of the 138Ba+ clock transition. Physical Review Letters, 124(19):193001, 2020.
- (20) K Beloy, David R Leibrandt, and Wayne M Itano. Hyperfine-mediated electric quadrupole shifts in Al+ and In+ ion clocks. Physical Review A, 95(4):043405, 2017.
- (21) Kyle Beloy, Andrei Derevianko, and WR Johnson. Hyperfine structure of the metastable state of alkaline-earth-metal atoms as an accurate probe of nuclear magnetic octupole moments. Physical Review A, 77(1):012512, 2008.
- (22) Eduardo Paez, KJ Arnold, Elnur Hajiyev, SG Porsev, VA Dzuba, UI Safronova, MS Safronova, and MD Barrett. Atomic properties of Lu+. Physical Review A, 93(4):042112, 2016.
- (23) R Kaewuam, TR Tan, KJ Arnold, and MD Barrett. Spectroscopy of the clock transition in 176Lu+. Physical Review A, 99(2):022514, 2019.