Changes of Fermi Surface Topology due to the Rhombohedral Distortion in SnTe
Abstract
Stoichiometric SnTe is theoretically a small gap semiconductor that undergoes a ferroelectric distortion on cooling. In reality however, crystals are always non-stoichiometric and metallic; the ferroelectric transition is therefore more accurately described as a polar structural transition. Here we study the Fermi surface using quantum oscillations as a function of pressure. We find the oscillation spectrum changes at high pressure, due to the suppression of the polar transition and less than 10 kbar is sufficient to stabilize the undistorted cubic lattice. This is accompanied by a large decrease in the Hall and electrical resistivity. Combined with our density functional theory (DFT) calculations and angle resolved photoemission spectroscopy (ARPES) measurements this suggests the Fermi surface -pockets have lower mobility than the tubular Fermi surfaces that connect them. Also captured in our DFT calculations is a small widening of the band gap and shift in density of states for the polar phase. Additionally we find the unusual phenomenon of a linear magnetoresistance that exists irrespective of the distortion that we attribute to regions of the Fermi surface with high curvature.
On first appearance SnTe looks like a simple semiconductor with a small bandgap that is formed by the ionic transfer between Sn and Te. Despite its simplicity SnTe is known to host several interesting phenomena including ferroelectricity Pawley et al. (1966); O’Neill et al. (2017) and is a topological crystalline insulator with potential surface states Hsieh et al. (2012); Tanaka et al. (2012). Grown samples are however always non-stoichiometric and Te rich, with the Sn deficiency accommodated in the lattice as vacancies Brebrick (1963). As a consequence the Fermi level is shifted into the valence band, leading to metallic behaviour with a free carrier concentration of holes, . The polar state transition temperature, , is below 100 K and dependent Kobayashi et al. (1976). Increasing reduces and eventually stabilizes the undistorted lattice. While avoiding the polar distortion is advantageous for studying topological states which are protected by crystalline symmetry, the large makes any investigation of surface states by transport extremely difficult. So far there are no reports on how varies under pressure. Here we use hydrostatic pressure to suppress and measure the associated changes in Fermi surface topology and transport properties.
At 300 K SnTe has a rocksalt structure shown in Figure 1(a) with space group . The polar distortion is driven by a soft transverse optic phonon Pawley et al. (1966); O’Neill et al. (2017), that distorts the lattice along the (111) direction of the cubic structure to a rhombohedral phase with shear angle Muldawer (1973) ( for ) and relative shift of the two sublattices of ( pm) Iizumi et al. (1975). Previous band structure calculations of the cubic phase show a valence band made up of filled Te orbitals and a conduction band of empty Sn orbitals, except at the narrowest gap (1,1,1) -point of the Brillouin zone, where a spin-orbit driven band inversion occurs Tung and Cohen (1969); Littlewood et al. (2010). For small the cubic Fermi surface is made up of disconnected pockets at the -points. On increasing the pockets elongate and above cm-3, are joined by tubes Littlewood et al. (2010); Allgaier and Houston (1972). Quantum oscillation measurements on bulk crystals resolved 3-4 frequencies belonging to the -pockets for low values of Savage et al. (1972); Burke et al. (1965). These merged to a single frequency at increased doping levels where the undistorted lattice is anticipated to be stable at 0 K. The distortion therefore clearly has consequences for the Fermi surface topology, that have yet to be fully determined.
Angle resolved photoemission spectroscopy (ARPES) measurements could not resolve any changes in Fermi surface topology with temperature below , however they did see a shift in much of the density of states and a widening of the bandgap Littlewood et al. (2010). While the bandgap is a result of ionic transfer between Sn and Te, its widening below suggests the polar transition has an electronic component resembling a Peierls instability. Such a mechanism would indeed lead to changes in Fermi-surface topology. Recent measurements on thin films Okazaki et al. (2018) also suggest the possibility that the different quantum oscillation frequencies in the rhombohedral phase may be a result of spin splitting by a spin-orbit Rashba mechanism Zhang et al. (2014).
Avoiding using pressure on a sample with fixed doping provides a unique route to investigate any changes in Fermi surface associated with the distortion. Here we report that a pressure of 10 kbar is adequate to suppress the distortion in a sample with K at 6 kbar pressure.
Single crystals of SnTe were grown by the same method described elsewhere O’Neill et al. (2017) with high purity elements Sn (99.9999 ) and Te (99.9999 ) in a ratio 51:49 to minimize . Crystals had natural facet faces along cubic axes and were orientated by Laue X-ray diffraction. The and of the crystals was determined from their electrical resistivity and Hall effect respectively. A list of the samples studied along with their and is given in Table I (S3 was used in pressure studies). The values of are in close agreement with previous reports for samples with similar at ambient pressure in Kobayashi et al. (1976).
| Sample (pressure) | (K) | cm-3) |
|---|---|---|
| S1 (ambient) | 79 | |
| S2 (ambient) | 75 | |
| S3 (6 kbar) | 89 |
Table I : Values of polar transition temperature, , and corresponding carrier concentration, , for 3 single crystal samples studied here.
ARPES measurements were performed on sample S1 at the CASSIOPEE beamline of Synchrotron SOLEIL using a Scienta R4000 hemispherical analyser with a vertical entrance slit and light incident in the horizontal plane. The sample was cleaved in-situ and measured at temperatures below 15 K. Measurements were taken with p-polarised light at photon energies of 110 and 135 eV. The approximate positions in of - Fermi surface contours and band dispersions were determined from the experimentally observed periodicity of band features as a function of photon energy in conjunction with reference density-functional theory calculations.
Samples S2 and S3 were cut by spark erosion into blocks with [001] cubic axes along the length, width and height and had dimensions mm and m respectively. Gold electrical contacts were attached by spot welding and resistivity (), Hall effect and magnetoresistance (MR) measurements made with a current of 100 A at 37 Hz. Experiments were carried out in a 4He cryostat with 9 T Cryogenic Ltd magnet and a dilution refrigerator with 15 T Oxford Instruments magnet. Sample S2 was used to study quantum oscillations as a function of applied field angle with a rotating sample stage. Sample S3 was studied under pressure. Pressure was applied in a diamond anvil pressure cell that had diamond culets of m diameter. Daphne oil 7373 was used as the pressure transmitting medium. A pre-indented steel gasket with a 300 m hole, insulated with a Al2O3 and Stycast 1266 epoxy mixture, contained the sample under pressure. The pressure was determined via fluorescence lines of a small ruby chip at 300 K.
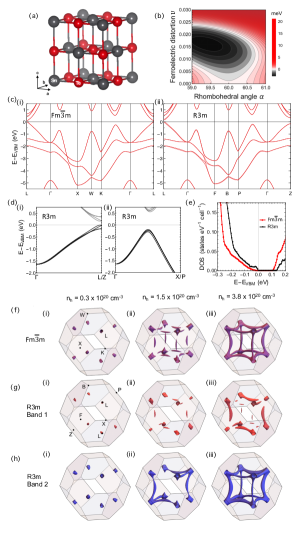
Fully relativistic density functional theory calculations were carried out for stoichiometric SnTe with the VASP package Kresse and Furthmüller (1996); Kresse and Joubert (1999); John P. Perdew and Ernzerhof (1996) for a plane-wave basis with cutoff energy eV and -point sampling with a linear density of 60/Å-1 (30/Å-1 for mapping the potential energy surface). Constant-pressure structure optimisations were performed until remaining force components were less than 1 meV/Å. We found the ground state energy for the rhombohedral structure to be meV/unit lower than the cubic structure, with a rhombohedral angle distortion of and polar displacement of , somewhat larger than found in previous scalar relativistic calculations O’Neill et al. (2017). The potential energy surface for the distortion is shown in Figure 1(b). These values closely resemble those seen by X-ray and neutron scattering ( and for and cm-3 respectively) Muldawer (1973); Iizumi et al. (1975). The calculated band structure in the cubic phase is shown in Figure 1(c)(i) where the smallest band gap is seen at the -point, as expected. The evolution of the Fermi surface with hole doping, within the frozen band approximation for this structure, is shown in Figure 1(f) with the Fermi energy () at (i) -0.165 eV ( cm-3), (ii) -0.282 eV ( cm-3) and (iii) -0.332 eV ( cm-3) with respect to the top of the valence band. Below eV (above cm-3) the band along - crosses and ultimately leads to tubes connecting the -pockets.
The electronic band structure for the rhombohedral structure is shown in Figure 1(c)(ii). Here, the band gap at widens from 0.10 eV to 0.14 eV along with a shift in the density of states shown in Figure 1(e). Additionally, the breaking of cubic symmetry lifts degeneracies throughout the Brillouin zone. The paths relevant to the Fermi surface topology are - and - (- and - in cubic notation), shown in Figure 1(d)(i) and (ii) respectively. The resulting Fermi surface now consists of hole pockets from two, non-degenerate bands in Figure 1(g)-(h). The single eight-fold degenerate -pockets from the cubic phase is split into four unique pockets, two per band. This is a consequence of both rhombohedral symmetry breaking, and spin-orbit splitting to lift the band degeneracy. The total carrier concentration (Fermi surface volume) must remain constant between the two phases. Hence, the phase sees an upward shift of to (i) -0.128 eV (ii) -0.232 eV and (iii) -0.290 eV for the equivalent carrier concentrations in Figure 1(f).
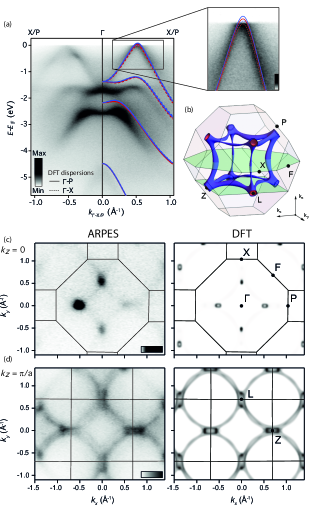
ARPES measurements, performed with photon energies of and eV, chosen to approximately probe planes which pass through the centre and the -points of the Brillouin zone respectively, are shown in Figure 2. The measured band dispersions along -- directions (Figure 2(a)) show the three Te -derived bands found from DFT. Although the measurements were performed at 15 K, in the rhombohedral phase, it is not possible to identify signatures of the band splittings which result from the breaking of cubic symmetry or the small differences between the dispersions along the - and - directions. This is likely predominantly due to large broadening in our measurements, which is a result of the surface sensitivity of photoemission.
Nonetheless, comparison with the calculations is instructive. In particular, we find that the valence bands just cut the Fermi level along the - direction. This indicates a doping level such that the -points are connected by tubular Fermi surfaces (Figure 2(b)). Consistent with this, we show in Fig. 2(c) and (d) ARPES Fermi surface measurements corresponding to the planes shown in Figure 2(b). These are compared with simulated spectra from our DFT calculations, performed for a Fermi level eV below the valence band maximum (corresponding to a calculated hole density cm-3, close to the value from Hall effect measurements in Table I). The bands forming the tube-like regions are directly visible in a plane encompassing the -points of the Brillouin zone (Fig. 2(d)), while the cross-sections of these tubular sections is apparent in the Fermi surface measured in the plane (Fig. 2(c)).
Resistivity for sample S2 normalised to the value at 300 K is shown in Figure 3(a). An anomaly due to the increased electron-soft phonon scattering exists at Katayama and Mills (1980), made clearer by differentiation ( and are listed in Table I). The magnetoresistance, MR = (, up to T at 40 mK for a series of applied field angles, , is shown in Figure 3(b). Here corresponds to [001]. Rotation was in increments of to [011] at through to the [010] axis at . Shubnikov-de Haas quantum oscillations (SdH) exist above 8 T and were extracted by subtracting a smoothly varying polynomial background. Examples of the SdH against for and are shown in Figure 3(c) and contain a beating pattern characteristic of several neighbouring frequencies. Fast Fourier transforms (FFT) resolved 3-4 distinct oscillation frequencies that are labelled -, in Figure 3(d). The angular dependence of the oscillation frequencies, , is shown in Figure 3(e). The lowest frequency, , follows
| (1) |
expected for an ellipsoid with eccentricity, , shown as the black dashed line. Here is the angle with respect to the principal axis of the ellipsoid ((1,1,1) direction). Frequencies - clearly contain more structure than can be explained by a simple ellipsoid.
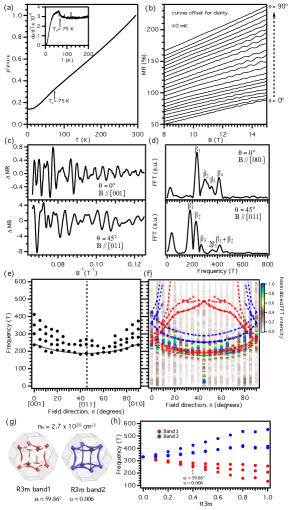
A contour plot of the FFT spectra normalised to the largest peak amplitude as a function of frequency and angle is shown in Figure 3(f). Also included are the calculated frequencies for the -pockets of both Fermi surface bands with cm-3 and a distortion of and . These values of , and give excellent agreement between experimental results and calculation in Figure 3(f). The Fermi surfaces are shown in Figure 3(g). The and values were determined by how the oscillation frequencies vary as a function of the rhombohedral distortion. For this we constructed a set of linearly interpolated crystal structures between the cubic and optimized structures ( and ). The change in frequencies for the pockets with as a function of distortion is in Figure 3(h). This illustrates the substantial effect of the rhombohedral distortion on Fermi surface topology.
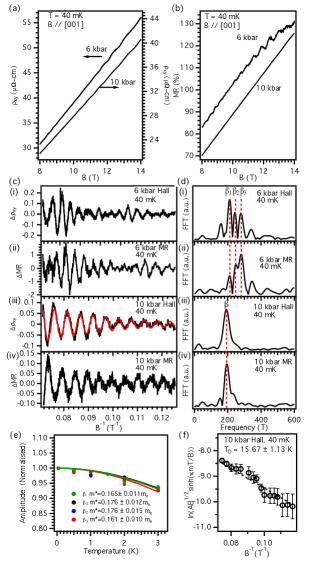
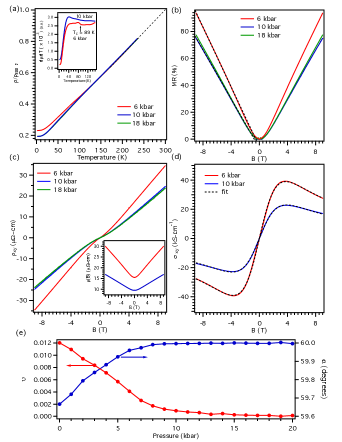
Resistivity curves normalised to for sample S3 studied under pressure are in Figure 4(a) with inset. Here was determined by extrapolation (black dashed line) to avoid a high temperature anomaly where the Daphne oil freezes. At 6 kbar gives K. On increasing pressure to 10 kbar no anomaly in can be identified. There is also a sharp drop in by a factor of 1.58 at 2 K. No further changes were observed at 18 kbar and the curve is almost indistinguishable from that at 10 kbar. The magnetoresistance and Hall resistivity, , at 2 K are shown in Figure 4(b) and (c) respectively. The Hall conductivity, , is given by
| (2) |
and is shown in Figure 4(d).
The Hall resistivity and magnetoresistance measured on sample S3 up to 14 T at 40 mK are shown in Figure 5(a) and (b). Both quantities contain Shubnikov-de Haas oscillations (SdH) above 8 T. Here, only measurements with could be taken. Figure 5(c) shows the SdH against for 6 kbar in (i) the Hall effect and (ii) the MR and for 10 kbar in (iii) the Hall effect and (iv) the MR. The FFT in Figure 5(d) shows three frequencies exist in both the Hall and MR at 6 kbar; T, T and T. Only a single frequency in the FFT at T exists at 10 kbar in Figure 5(d) for both the Hall and MR.
The temperature dependence of the quantum oscillation amplitude is governed by the temperature reduction term, , in the Lifshitz-Kosevich formula given by
| (3) |
where and is the effective mass. The SdH amplitude normalised to the value at 40 mK with corresponding fits to are shown in Figure 5(e). Measurements were limited to 3 K, the maximum temperature of the dilution refrigerator, where only a slight decrease in amplitude could be realised. Derived effective masses for - are the same within error with an average value of . At 10 kbar no change in was seen within error with and .
The quantum oscillation amplitude dependence on field is determined by the Dingle term, , in the Lifshitz-Kosevich formula given by
| (4) |
where the Dingle temperature can be used to calculate the scattering time . Beating patterns at 6 kbar make any estimate of highly uncertain. At 10 kbar a graph of against is shown in Figure 5(f), where is the oscillation amplitude. A straight line fit gives K and consequently s. The solid red line in Figure 5 (c) is a calculation with K for a single oscillation frequency of T, showing excellent agreement with the measurements.
Having presented our theoretical and experimental findings we now discuss the significance of the results. DFT bandstructure calculations highlight the large changes in Fermi surface topology as a consequence of the polar distortion. They also reproduce a small widening of the bandgap and shifts in the density of states, seen previously with ARPES Littlewood et al. (2010). The qualitative agreement with our ARPES measurements reported here provides a validation in the accuracy of our DFT calculations close to the Fermi surface and confirms that the off-stoichiometry leads to a degenerate doping i.e. the Fermi level shifts into the valence bands.
Quantum oscillations below contain 3-4 neighbouring frequencies. The DFT calculation identifies the detected oscillations to be from the -pockets that have a similar angular dispersion, even when these pockets are connected by tube like Fermi surfaces. The expected oscillation frequencies for the connecting tubes are all less than 80 T for the Fermi surface in Figure 3(g) and were not resolved in experiment. Although peaks exist at T in the FFT spectra, they may also be a result of subtracting the polynomial background. As there are four unique -pockets that vary in size in the rhombohedral phase the presence of several neighbouring oscillation frequencies for [001] is expected in the structure (Figure 3(h)). In the cubic phase the single eight-fold degenerate -pockets are expected to give only a single oscillation frequency for [001]. With pressure we find 10 kbar is adequate to merge the neighbouring frequencies into a single frequency. Additionally at 10 kbar no anomaly in resistivity due to can be identified. Therefore the rhombohedral transition has been suppressed by a pressure of 10 kbar. This is also accurately captured in DFT calculation, shown in Figure 4(e) for and as a function of pressure.
The suppression of the rhombohedral transition leads to large changes in Hall signal. shows non-linear behaviour for all pressures. Our measurements for at all pressures are well described by a single band model,
| (5) |
where , is the carrier mobility, the zero field conductivity and the cyclotron frequency. EQ(5) highlights that for sufficiently mobile carriers with non-linearity may still exist for a single band. Using a two-band model did not improve the fit despite adding two extra fitting parameters. Values of and extracted from the fits are given in Table II. Upon entering the cubic phase the carrier concentration increases significantly by a factor of 1.64, while the mobility stays approximately constant within error, consistent with the drop in resistivity by a factor of 1.58.
| (6 kbar) | (10 kbar) | |
|---|---|---|
| ( cm-3) | ||
| (cm2 V-1s-1) |
Table II : The values of carrier concentration, , and mobility, , in sample S3 according to the fits of in Figure 4(d).
On increasing pressure in the cubic structure (to 18 kbar) no further changes are observed in any measured quantity. The changes in and are therefore a direct consequence of the modification in Fermi surface associated with the distortion. Expected quantum oscillation frequencies from calculations show the distortion acts to increase the volume of some -pockets while decreasing others (Figure 3(h)). This is not seen in experiment. Figure 5(d) shows - at 6 kbar are all larger in magnitude than at 10 kbar. A full angular dependence is required to say definitively how the pockets change. However these results point towards the -pockets being smaller in the cubic phase with potentially more carriers in the connecting tubes to maintain a fixed total number of carriers.
Quantum oscillations at 10 kbar give cm2V-1s-1, significantly less than the mobility from the Hall effect in Table II. This suggests that the Hall conductivity is dominated by the connecting tubes that have a significantly higher mobility than the -pockets. Therefore for the cubic phase more carriers in the connecting tubes in turn leads to more carriers becoming visible to the Hall effect, providing a simple explanation for the changes seen here. Since the Dirac points are not close to the role of surface contributions can be discounted.
The MR in Figure 4 (b) follows a similar behaviour in both structures. It begins quadratically for low before becoming linear above 1 T to the highest fields, demonstrated by the straight line fits. Linear MR is an unusual phenomenon and both quantum and classical explanations have been proposed. Abrikosov’s well known quantum model gives a linear MR when all carriers occupy the lowest Landau level for a linear electron energy dispersion Abrikosov (1998, 2000). The linear MR reported in some topological insulators is expected to be associated with similar quantum effects Wang et al. (2012). Previous reports on SnTe thin films with a larger than our samples, saw a linear magnetoresistance and attributed it to Dirac surface states dominating the transport as a result of band bending at the substrate/film interface that brings closer to the Dirac points Wei et al. (2019). In our bulk crystals such band bending is unlikely.
Classically linear MR from irregular current paths as a result of disorder was described by Parish and Littlewood Parish and Littlewood (2003). Here our samples have high mobility carriers and quantum oscillations that reflects relatively little disorder, making a Parish Littlewood mechanism unlikely. Instead we suggest a straightforward origin first discussed by Pippard based on a Fermi surface containing sharp corners Pippard (1989).
Pippard demonstrated that for sufficiently small values of Fermi surfaces with sharp corners lead to a MR varying as rather than Pippard (1989). While the occurrence of infinitely sharp corners is difficult to imagine in reality, Pippard points out regions with suitably sharp curvature and minimal rounding lead to an initial quadratic form at low field followed by linear behaviour with increasing field, analogous to the measurements reported here. At 9 T in the cubic phase , satisfying the requirement . We therefore attribute the linear MR in SnTe to regions of high curvature present in the Fermi surface for both the cubic and rhombohedral structure, most likely at the necks where -pockets and connecting tubes meet making an almost right angle. Curvature driven linear MR has previously been reported in materials with partially gapped Fermi surfaces due to density wave order Kikugawa et al. (2010); Feng et al. (2019), proving it as a potential explanation for many other systems.
In conclusion we have shown the polar distortion in SnTe is accompanied by a reconstruction of the Fermi surface. Under ambient pressure both our quantum oscillation and ARPES measurements are well described with DFT calculations. Also captured by DFT is a small widening of the band gap and shift in density of states at the Fermi level for the polar phase, previously seen with ARPES. We found that a pressure of just under 10 kbar stablizes the cubic structure in good agreement with the required pressure calculated with DFT. This consequently allows the contribution to the Hall effect for each feature of the Fermi surface to be determined. Linear magnetoresistance has been observed in both structures and attributed to the presence of regions with high curvature in the Fermi surface.
Acknowledgements; We wish to gratefully thank support from the UK EPSRC grants EP/P013686/1 and EP/R013004/1 (CDON and ADH) and the Royal Society (PDCK) and the Leverhulme Trust (PDCK and FM). We also acknowledge PhD studentship support from ESPRC EP/L015110/1 (HDJK) and EP/K503162/1 (OJC) and via the International Max-Planck Research School for Chemistry and Physics of Quantum Materials (IM). Computational resources provided by the UK’s National Supercomputer Service through the UK Car-Parrinello consortium (No. EP/P022561/1) and by the UK Materials and Molecular Modelling Hub (No. EP/P020194) are gratefully acknowledged. Access to the CASSIOPEE beamline (proposal number 20170362) at SOLEIL is also gratefully acknowledged.
References
- Pawley et al. (1966) G. S. Pawley, W. Cochran, R. A. Cowley, and G. Dolling, Phys. Rev. Lett. 17, 753 (1966).
- O’Neill et al. (2017) C. D. O’Neill, D. A. Sokolov, A. Hermann, A. Bossak, C. Stock, and A. D. Huxley, Phys. Rev. B 95, 144101 (2017).
- Hsieh et al. (2012) T. Hsieh, H. Lin, J. Liu, W. Duan, A. Bansil, and L. Fu, Nat Comm 3, 982 (2012).
- Tanaka et al. (2012) Y. Tanaka, Z. Ren, et al., Nat Phys 8, 800 (2012).
- Brebrick (1963) R. F. Brebrick, J. Phys. Chem. Solids 24, 27 (1963).
- Kobayashi et al. (1976) K. L. I. Kobayashi, Y. Kato, Y. Katayama, and K. F. Komatsubara, Phys. Rev. Lett. 37, 772 (1976).
- Muldawer (1973) L. Muldawer, J. Nonmetals 1, 177 (1973).
- Iizumi et al. (1975) M. Iizumi, Y. Hamaguchi, K. F. Komatsubara, and Y. Kato, J. Phys. Soc. Jpn 38, 443 (1975).
- Tung and Cohen (1969) Y. W. Tung and M. L. Cohen, Physical Review 180, 823 (1969).
- Littlewood et al. (2010) P. B. Littlewood, B. Mihaila, et al., Phys. Rev. Lett. 105, 086404 (2010).
- Allgaier and Houston (1972) R. S. Allgaier and B. Houston, Phys. Rev. B 5, 2186 (1972).
- Savage et al. (1972) H. T. Savage, B. Houston, and J. R. Burke, Phys. Rev. B 6, 2292 (1972).
- Burke et al. (1965) J. R. Burke, R. S. Allgaier, B. B. Houston, J. Babiskin, and P. G. Siebenmann, Physical Review Letters 14, 360 (1965).
- Okazaki et al. (2018) A. K. Okazaki, S. Wiedmann, S. Pezzini, M. L. Peres, P. H. O. Rappl, and E. Abramof, Phys. Rev. B 98, 195136 (2018).
- Zhang et al. (2014) X. Zhang, Q. Liu, J.-W. Luo, A. J. Freeman, and A. Zunger, Nature Physics 10, 387 (2014).
- Kresse and Furthmüller (1996) G. Kresse and J. Furthmüller, Phys. Rev. B 54, 11169 (1996).
- Kresse and Joubert (1999) G. Kresse and D. Joubert, Phys. Rev. B 59, 1758 (1999).
- John P. Perdew and Ernzerhof (1996) J. P. Perdew, K. Burke, and M. Ernzerhof, Phys. Rev. Lett. 77, 3865 (1996).
- Katayama and Mills (1980) S. Katayama and D. L. Mills, Phys. Rev. B 22, 336 (1980).
- Abrikosov (1998) A. A. Abrikosov, Phys. Rev. B 58, 2788 (1998).
- Abrikosov (2000) A. A. Abrikosov, Europhysics Letters (EPL) 49, 789 (2000).
- Wang et al. (2012) X. Wang, Y. Du, S. Dou, and C. Zhang, Phys. Rev. Lett. 108, 266806 (2012).
- Wei et al. (2019) F. Wei, X. P. A. Gao, S. Ma, and Z. Zhang, Phys. Status Solidi B 256, 1900139 (2019).
- Parish and Littlewood (2003) M. M. Parish and P. B. Littlewood, Nature 426, 162 (2003).
- Pippard (1989) A. B. Pippard, Magnetoresistance in Metals (Cambridge University Press, 1989).
- Kikugawa et al. (2010) N. Kikugawa, A. W. Rost, C. W. Hicks, A. J. Schofield, and A. P. Mackenzie, J. Phys. Soc. Jpn 79, 024704 (2010).
- Feng et al. (2019) Y. Feng, Y. Wang, D. M. Silevitch, J.-Q. Yan, R. Kobayashi, M. Hedo, T. Nakama, Y. Onuki, A. V. Suslov, B. Mihaila, et al., Proceedings of the National Academy of Sciences 116, 11201 (2019), ISSN 0027-8424.