Anatomy of cage formation in a 2D glass-forming liquid
Abstract
The solidity of glassy materials is believed to be due to the cage formed around each particle by its neighbors, but in reality the details of cage-formation remain elusive 2011Glassy_Binder ; 2002_Weeks ; Sastry_2009 ; Pastore_2017 . This cage starts to be formed at the onset temperature/density at which the normal liquid begins to show the first signs of glassy dynamics. To study cage-formation we use here focused lasers to produce a local perturbation of the structure on the particle level in 2D colloidal suspensions and monitor by means of video microscopy the system’s non-linear dynamic response. All observables we probed show a response which is non-monotonic as a function of the packing fraction, peaking at the onset density. Video microscopic images reveal that this maximum response is due to the buildup of domains with cooperative dynamics that become increasingly rigid and start to dominate the particle dynamics. This proof-of-concept from microrheological deformation demonstrates that in this glass-forming liquid cage formation is directly related to the merging of these domains, thus elucidating the first step in glass-formation 2011Glassy_Binder ; 2009_Cavagna .
Corresponding authors email:
⋆ walter.kob@umontpellier.fr
Despite broad agreement that glasses are important intellectually and technologically, we have at present little insight about the nature of the particle dynamics at the onset point, i.e. where the dynamics crosses over from normal liquid dynamics to a glassy one, i.e. time correlation functions are stretched, the dynamics starts to become heterogeneous, etc. 2011Glassy_Binder . Usually this point is detected from the appearance of a plateau in time correlation functions such as the mean squared displacement (MSD) or the intermediate scattering function, i.e. the dynamics starts to show a two-step relaxation 2011Glassy_Binder ; 1993_vanmegen ; 1990_barrat ; 1995PRE_Kob . However, being ensemble-averaged, these quantities do not give access to information about local particle dynamics and hence very little is known about cage-formation on the level of the particles. Direct imaging experiments do allow to access the local particle dynamics 1996ARPC_Murray ; 2000Science_Weeks ; 2000Science_Kegel ; 2018CP_Li but were previously not coupled to methods capable of studying the inelastic response of the structure to local perturbation, i.e. to probe the local dynamics in a precise manner (see Ref. 2013JCP_Anderson for experiments on the local elastic response). For theory the onset point is a challenging state since it corresponds to the boundary at which the fast liquid dynamics of a normal fluid meets the phonon dynamics relevant in the short time regime of the glassy relaxation. The competition between these two kinds of dynamics makes an analytical calculation most difficult because of the presence of both, fast and slow, processes. These considerations may explain why, to the best of our knowledge, the study of this dynamic regime on the level of individual particles was not previously presented. In the present work we thus use focused laser beams to probe the relaxation dynamics by imaging the response to local deformations of individual particles and hence elucidate the surprisingly complex formation of the cage on the level of the particles.
Colloidal systems display many properties of atomic glass-formers with the advantage that optical imaging can track directly the trajectories of individual particles 1996ARPC_Murray ; 2012RPP_Hunter . Focused laser beams allow to manipulate the colloidal system on the level of the particles 2015NP_Nagamanasa and hence to measure local responses. This has been exploited to probe the elastic behavior of colloidal glasses 2013JCP_Anderson and crystals 2017PNAS_Buttinoni ; 2018PRL_Cash ; 2018PNAS_Lavergne ; 2019_Lozano and here we extend their use to study the micro-rheological properties of the system with deformations beyond the linear regime. We consider a two-dimensional binary colloidal system of spherical particles (PMMA, polymethylmethacrylate, in water) that are confined between two glass plates separated by a distance of 3.37 m. The concentration and size ratio between the small (s) and large (l) particles are 0.55:0.45 and 2.08 m:2.91 m, respectively, making the system a good glass-former that is not prone to crystallisation, see Extended Data Fig. 2a). We study the behavior of the liquid as a function of the area packing fraction , where [] and [] are the size and number density of the small [large] partices, respectively. Experimental details are described in Methods where we also show that the onset packing fraction is around 0.60 and the critical density of mode-coupling theory 2008_Gotze , , is above 0.75 (Extended Data Fig. 2). We determine the reponse of the system in the range thus well below the glass transition which occurs around 0.90 (see Methods). From previous work it is known that 2D systems such as ours capture the essence of the glass problem because the mechanism leading to caging does not depend strongly on the dimensionality of the system 2011Glassy_Binder ; 2012RPP_Hunter ; 2017PNAS_Vivek ; 2019PNAS_Flenner .
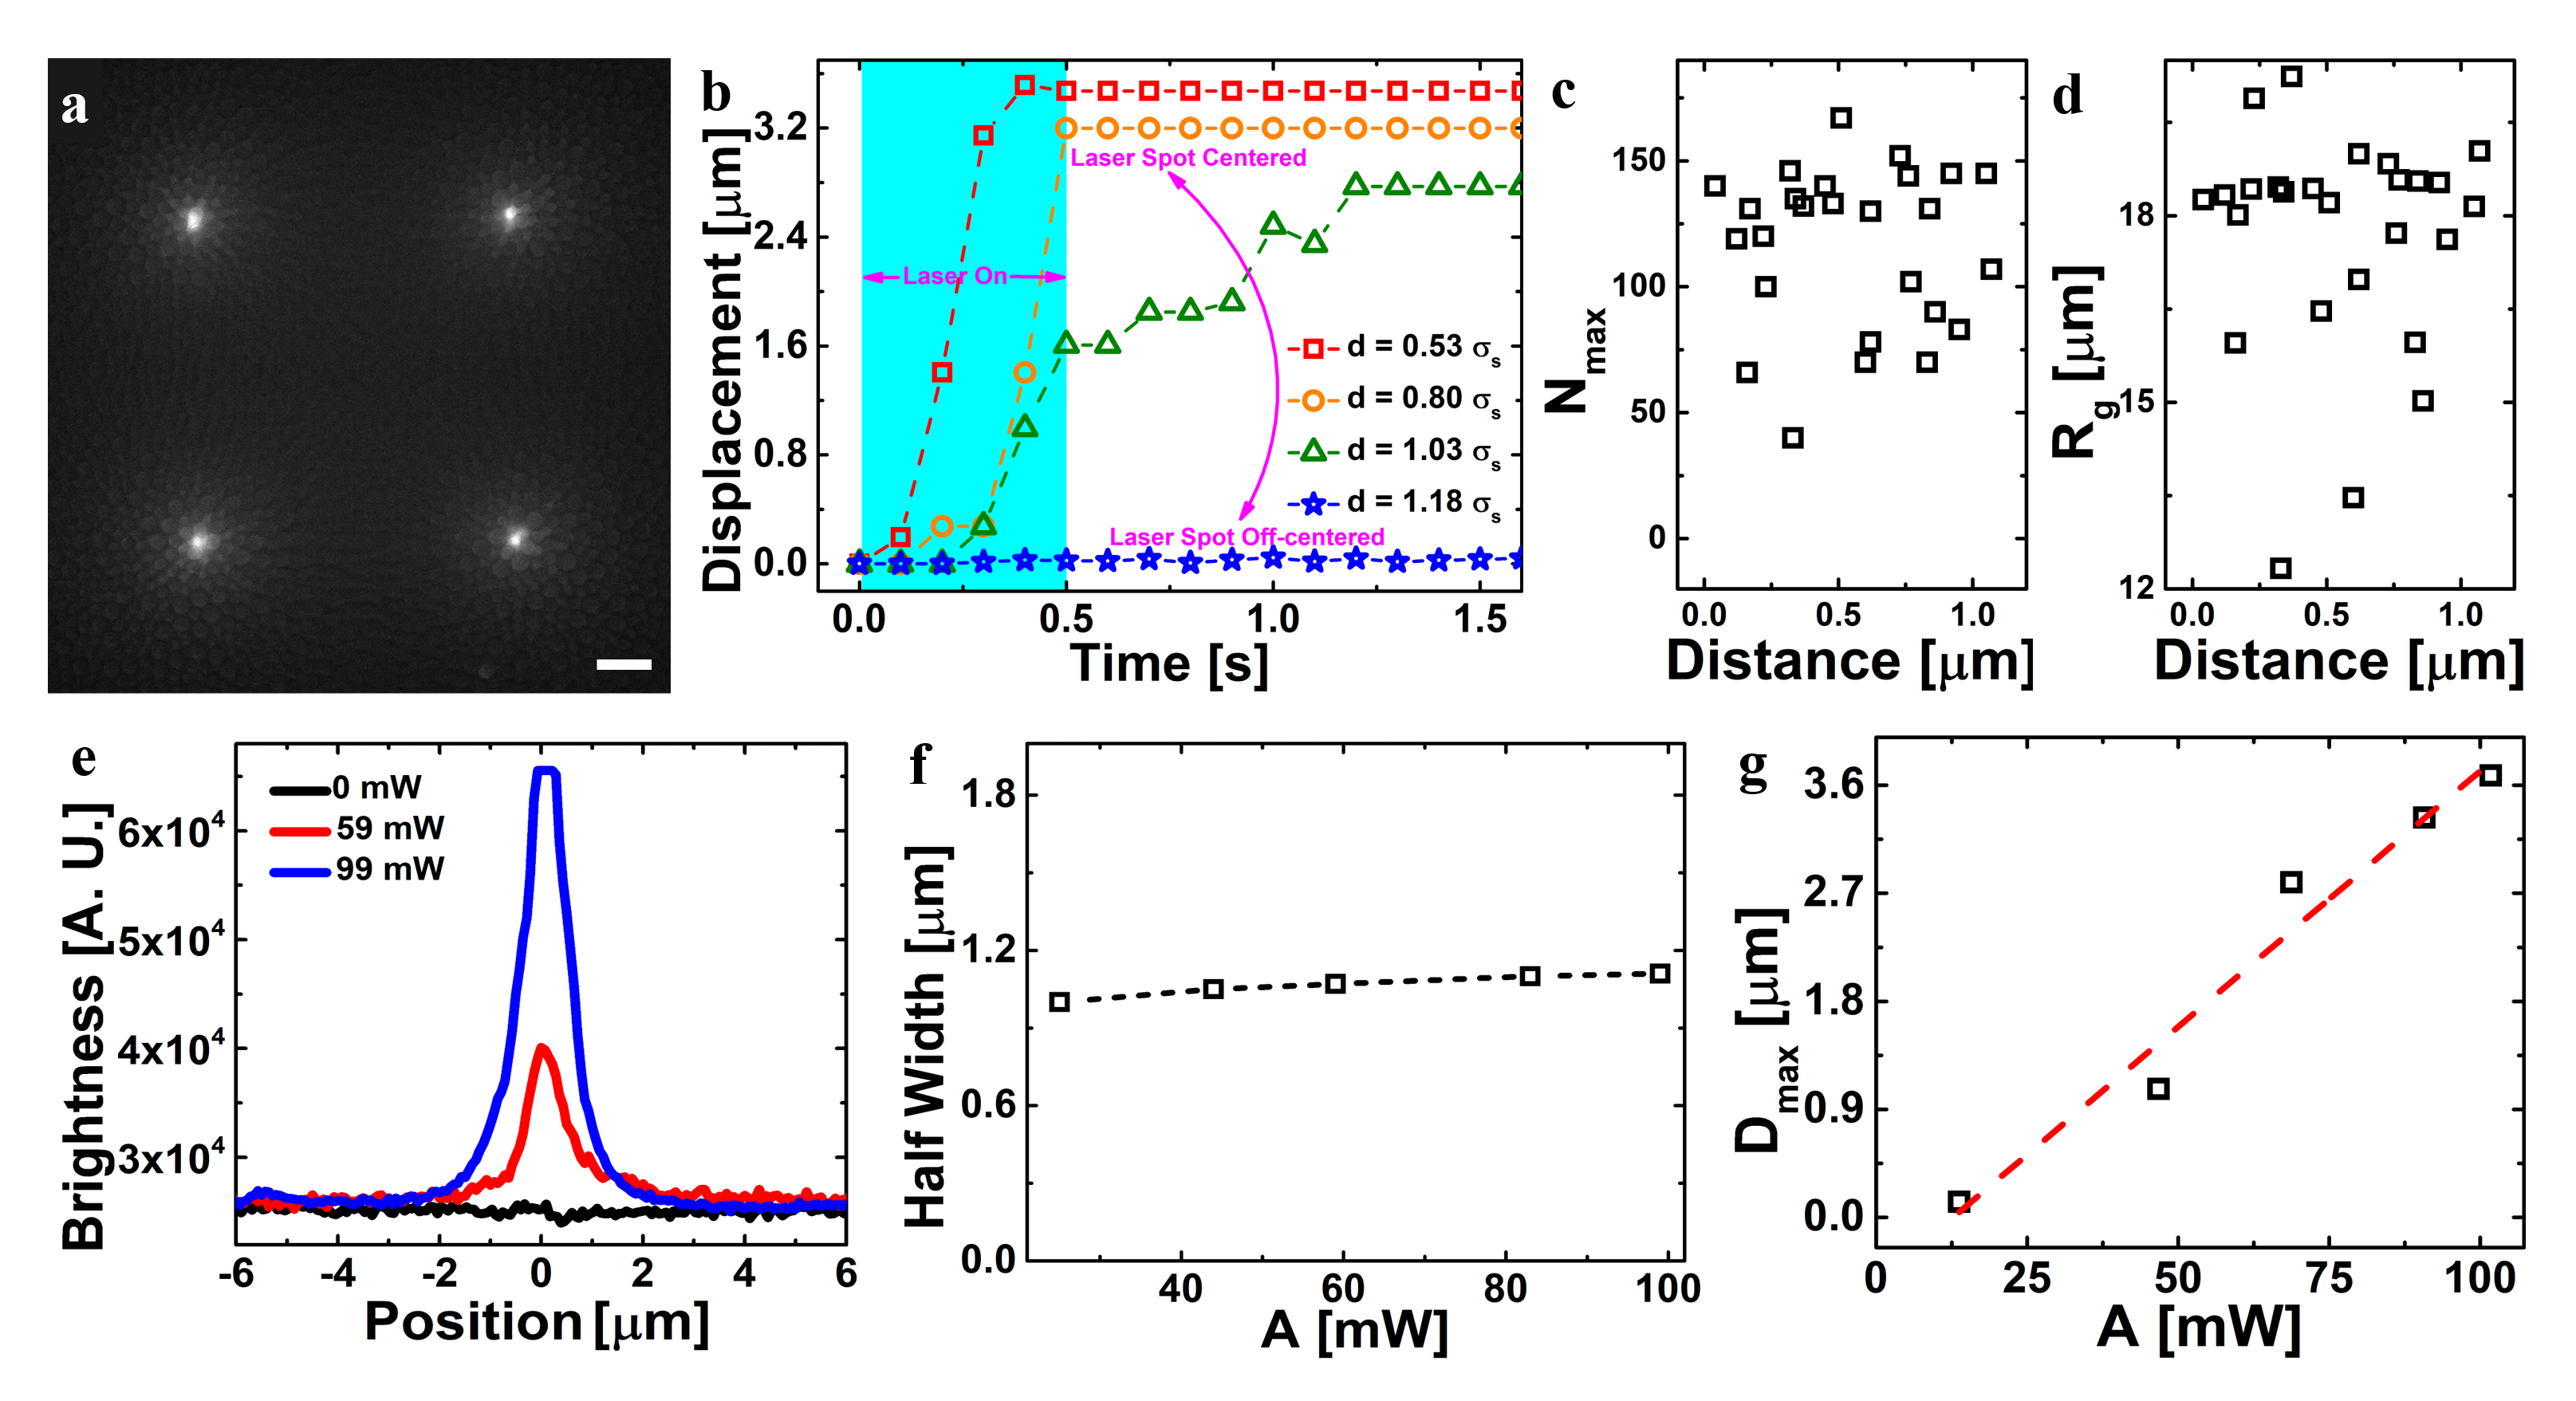
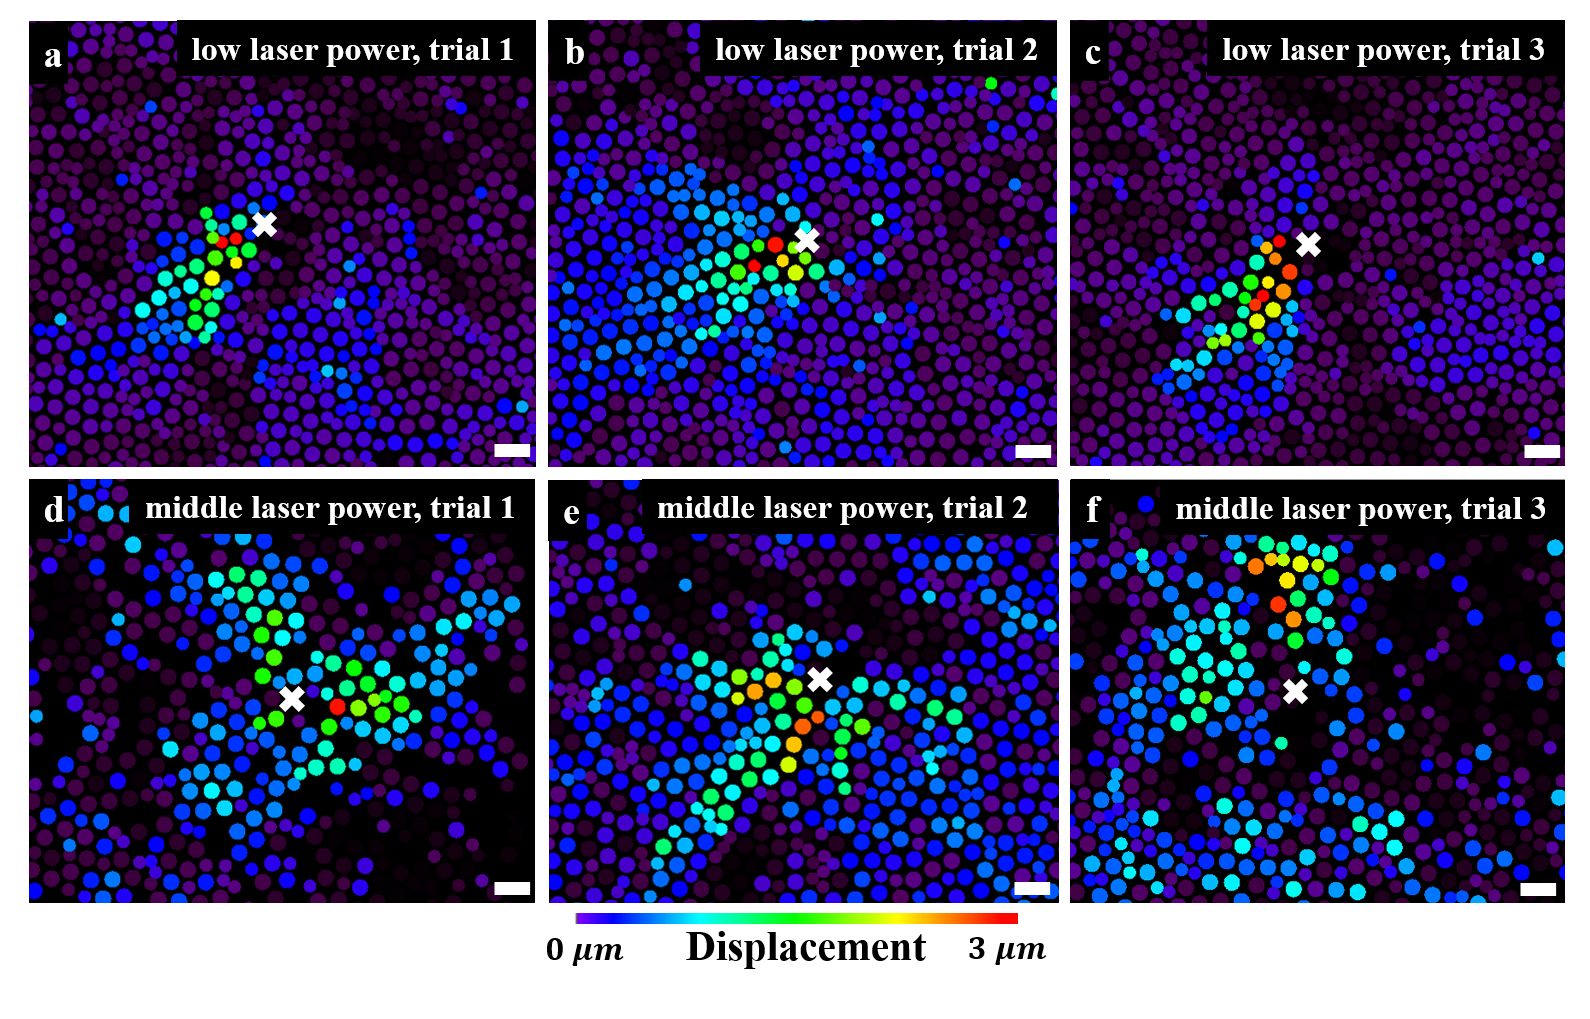
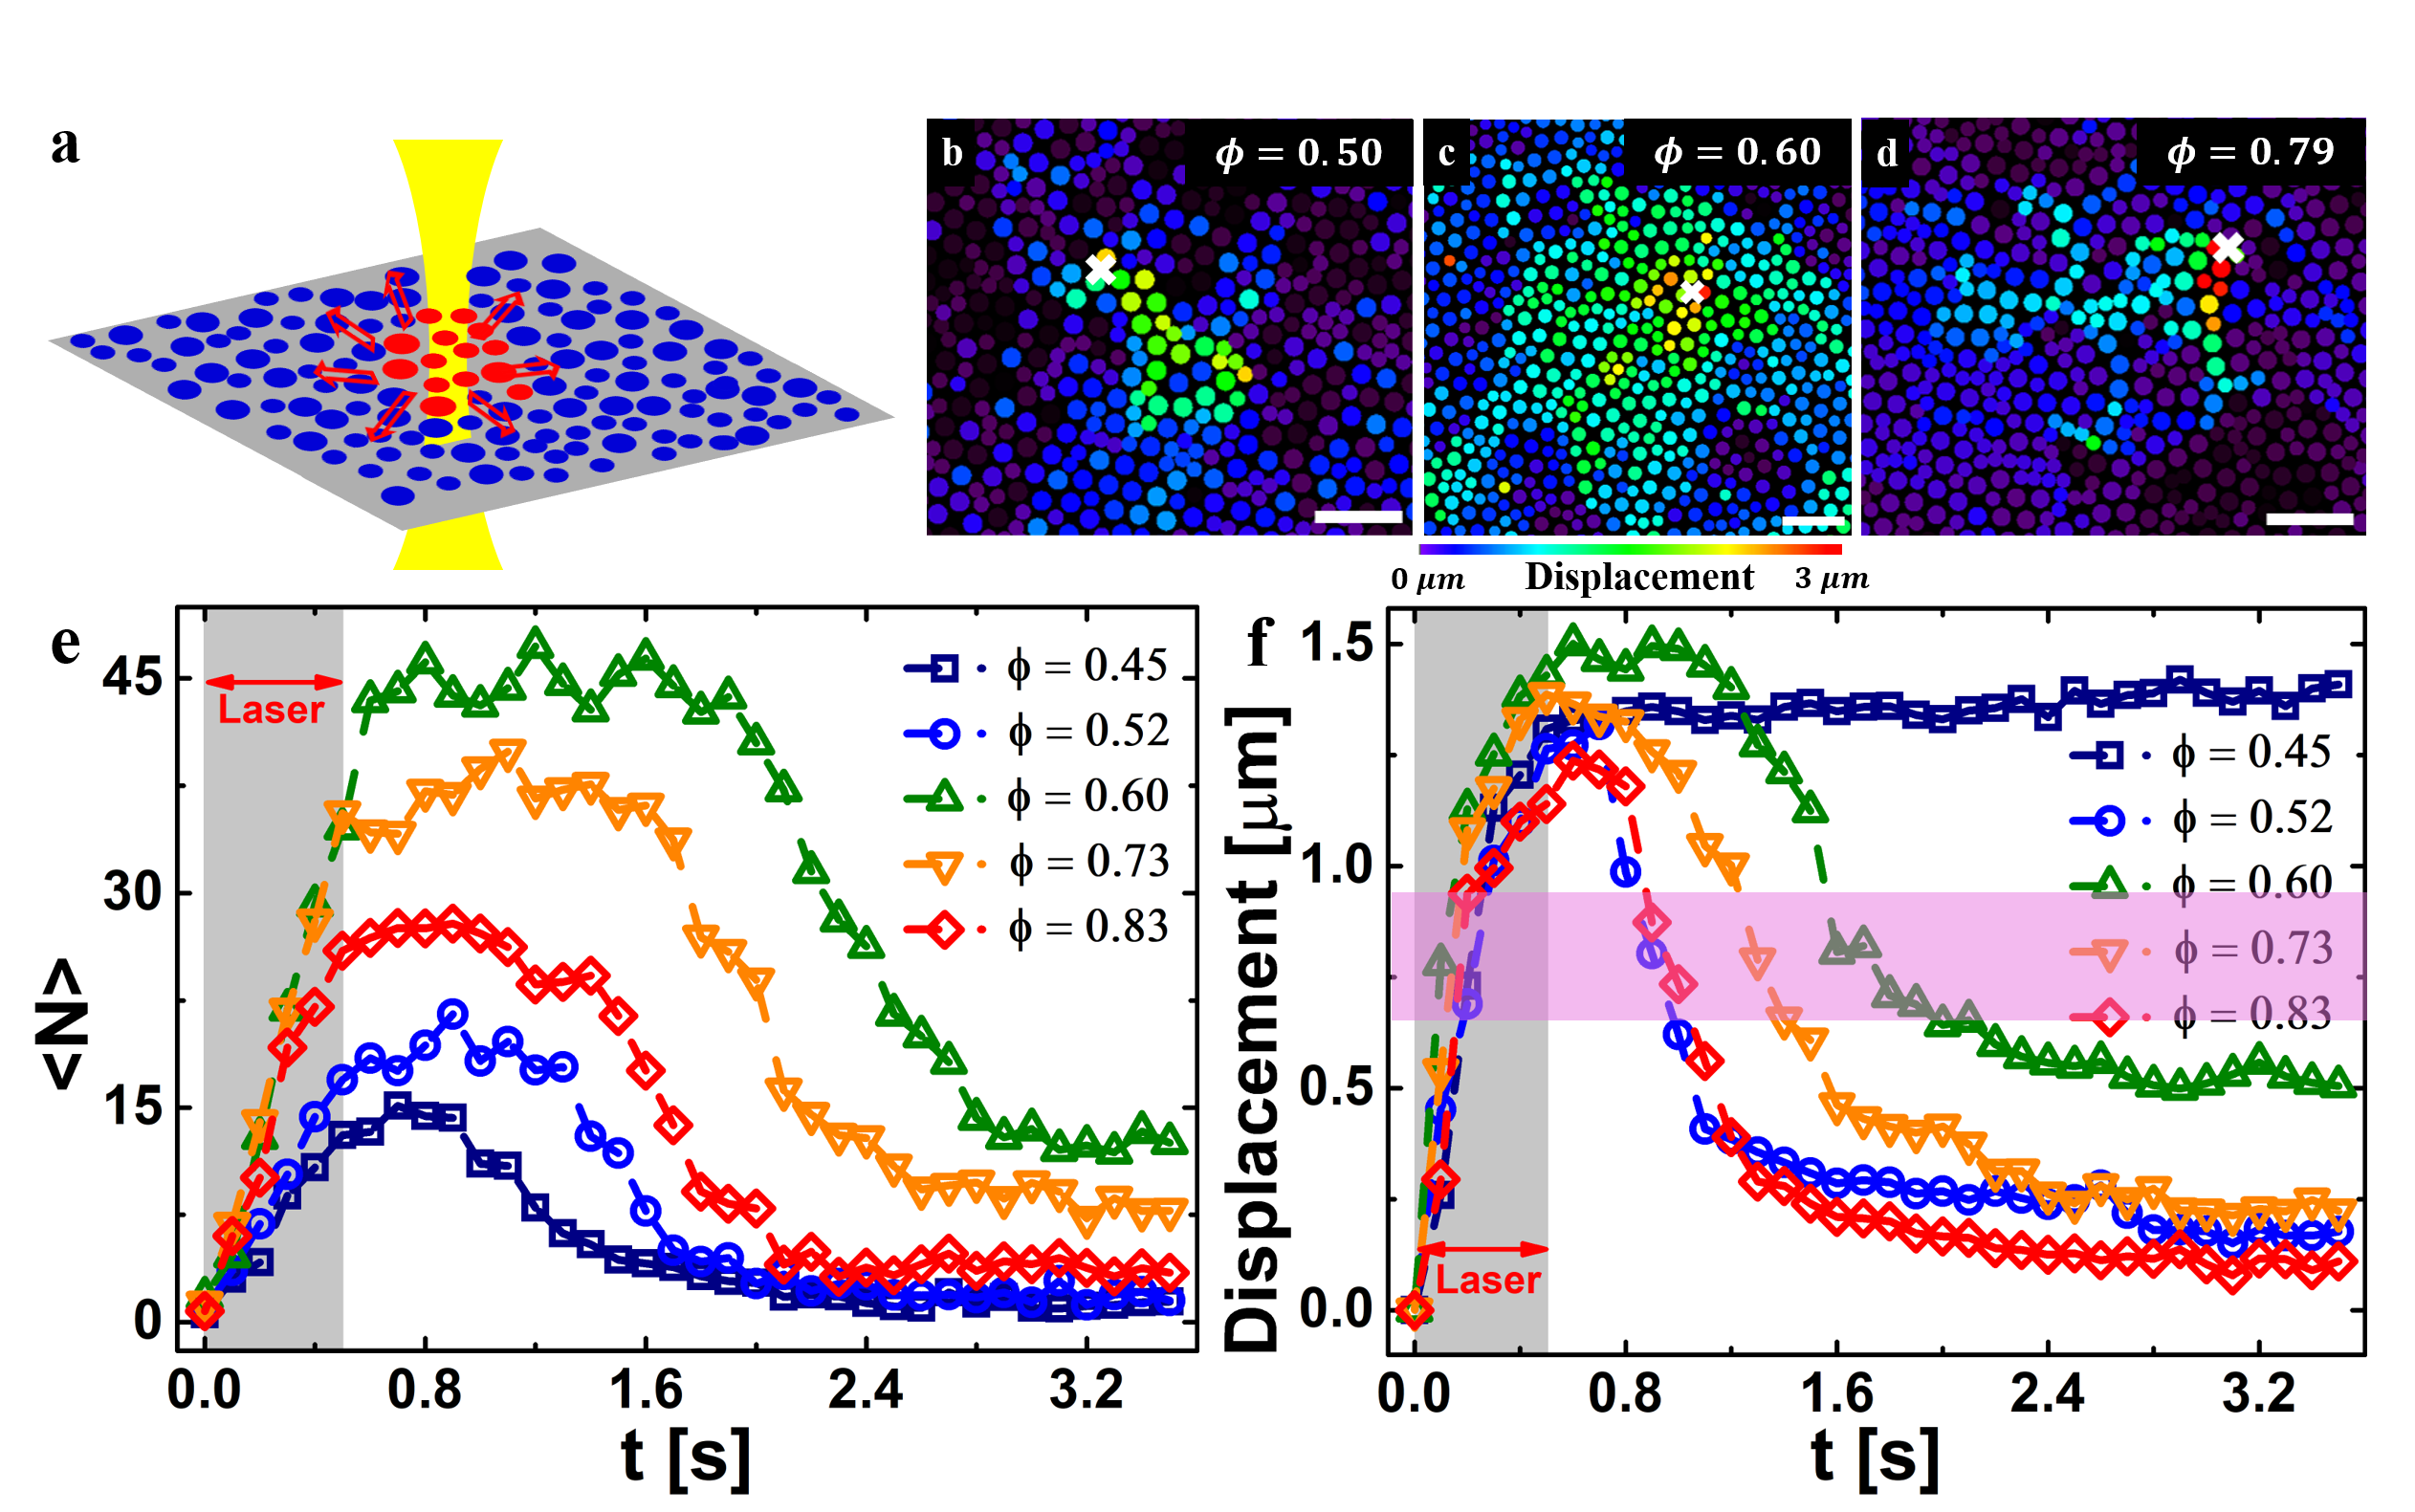
Figure 1a) summarises the experiment schematically. To create local perturbations, we use pulsed laser beams (repetition rate 80 MHz) of duration 0.5 s focused to a spot of size 2.0 m, i.e. comparable to the size of the individual colloids. The strong electric field gradient generates a dielectrophoresis force, whose magnitude is proportional to the laser intensity , acting on the particle in the direction of the gradient and thus induces a rapid motion of the colloids hit by the beam (see Ref. 2017PNAS_Buttinoni , Methods and Video 1 for details) which in turn collide with their neighbors, hence setting up a local motion that in the following will be called “excitation”. In the Methods section we demonstrate that the zone influenced directly by the dielectrophoresis force is small () and independent of and that the pulse duration and exact position the beam hits the particle does not alter the qualitative properties of the excitation pattern. Figures 1b)-d) show the displacement of the particles 5 s after the laser pulse, i.e. when the excitation has stopped. (Excitations last less than 3.5 s, Fig. 1e), i.e. one order of magnitude shorter than the typical -relaxation time of the system in the density regime we probe, see Methods.) At low packing fraction, panel b), only few particles are displaced and most relax back to their initial position (see Video 2). If is increased to 0.60, the number of displaced particles has increased significantly, panel c) and Video 3, while this number decreases again if is 0.70, Video 4. In the Methods we show that an excitation is not a random structure, since repeated perturbations at the same spot give rise to excitations with similar structures if the laser intensity is less than 44 mW (Extended Data Figs. 5a)-c)), although even below this threshold the perturbation is non-linear. These results show that the formation of the cage is a surprisingly non-local process involving particles that are not only in the first nearest neighbor shell.
To probe the properties of the excitations, we analyse for each value of dozens of displacements within circular zones of radius 7 - the precise size is arbitrary, but was selected to be larger than the particle diameter itself, yet small enough to avoid a significant contribution from particles unaffected by the excitation. The impact of the perturbation is quantified by means of two quantities, the number of mobile particles (those particles that move more than 0.3 after the laser pulse was turned on) and , the average displacement of these particles. For small , remains small and quickly reaches a high value and then remains large, showing the viscous response to the perturbation, Fig. 1e) and f). (Here is the average over the excitations.) At = 0.52 one finds that both quantities grow but then return to lesser values - there is some elasticity. At = 0.60, the peaks are even higher and broader with reaching 45 particles, before the signals decay to a finite plateau. At even higher , the peak height in and the displacement, as well as their values at long times are smaller than the ones for . This non-monotonic behavior of the two observables is striking since sample-averaged quantities such as the viscosity or the relaxation time increase monotonically for all packing fractions. Also included in the graph is the size of the cage as obtained from the height of the plateau of the MSD at , see Extended Data Fig. 2c). One recognizes that at long times the average displacement of the particles is somewhat smaller than the size of this cage, in agreement with the results presented below on the van Hove function.
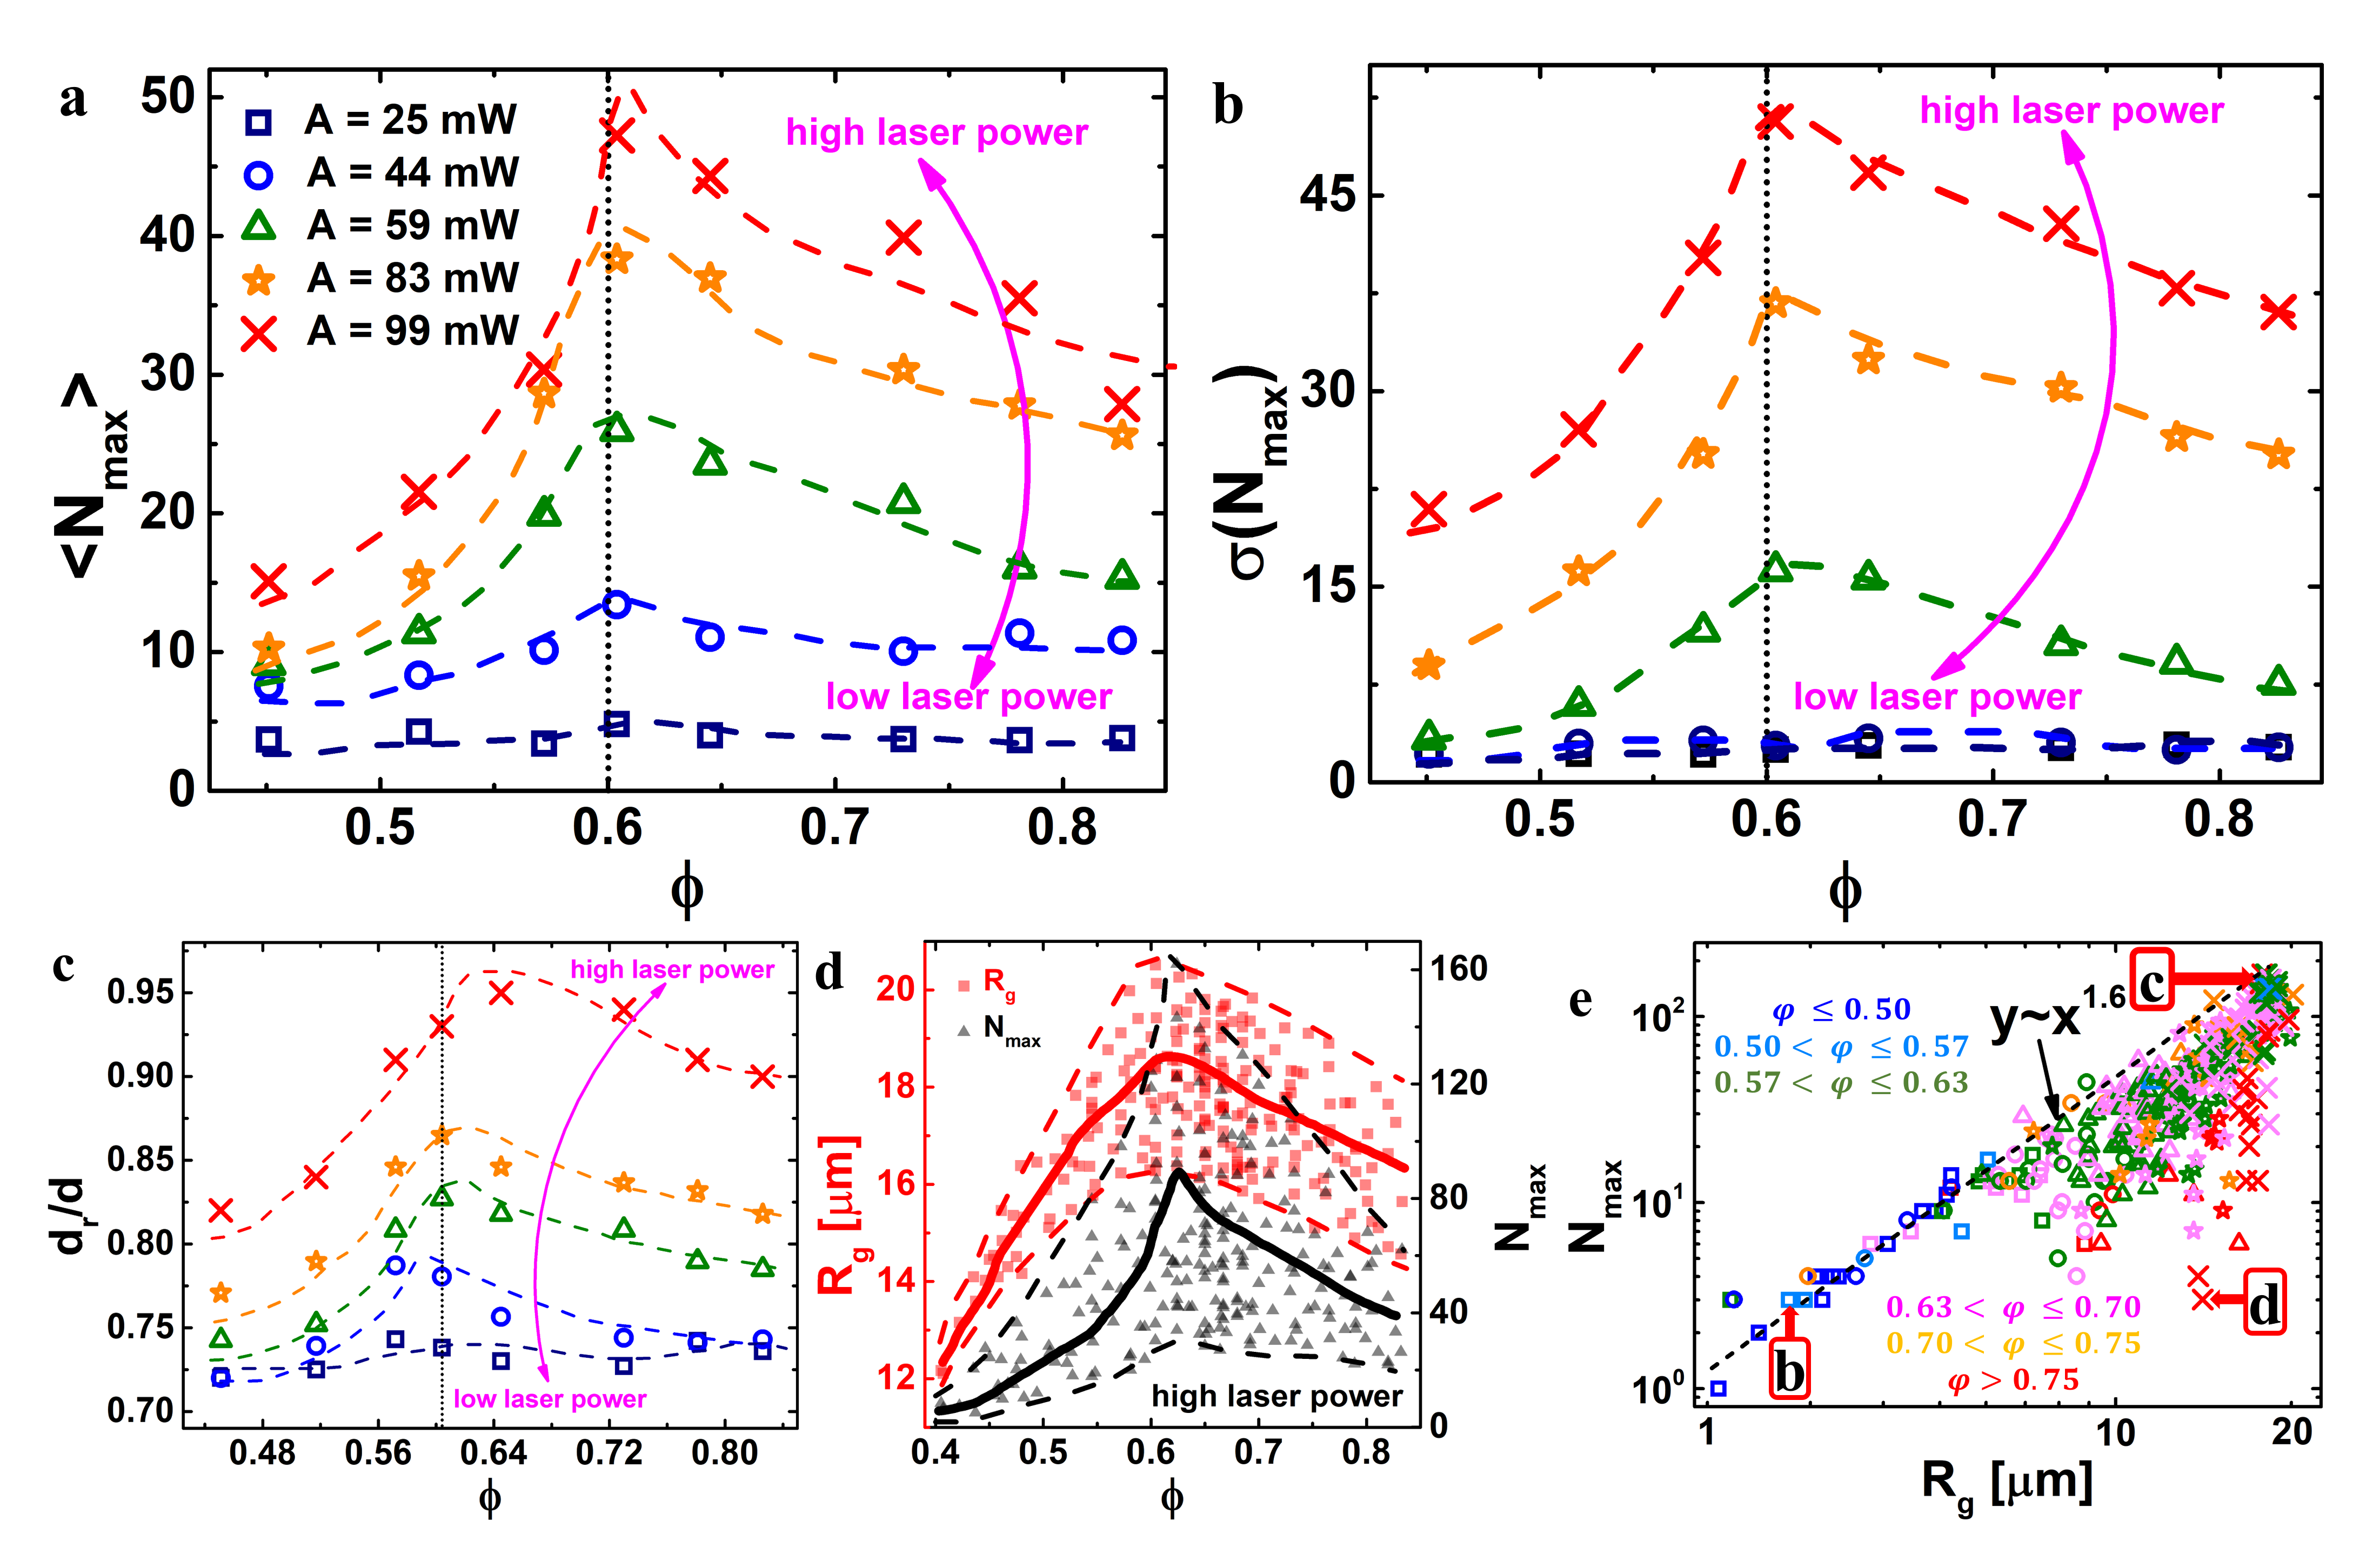
To characterise this unexpected response in more detail, we determined the following quantities: the average of , where is the maximum of , the standard deviation of , the maximum displacement observed in each micro-experiment, , the radial component of , , and the maximum radius of gyration , where and are the position of particle and of the center of mass of the excitation, respectively. In Fig. 2, these quantities are plotted against packing fraction. Panel a) demonstrates that is indeed a non-monotonic function of and that this quantity peaks at around . Remarkably, the location of the peak is independent of the laser power and the duration of laser (Extended Data Figs. 3b), c), Extended Data Fig. 4), suggesting that this feature represents an inherent property of the liquid and is not related to the way it is probed. Note that is indistinguishable from the onset packing density , i.e. we have strong evidence that the non-monotonic behavior of the response occurs at , the point at which the cage is formed. At this packing fraction also shows maximum scatter, panel b), indicating that at the properties of the excitations depend sensitively on the local structure of the liquid. At the same packing fraction the mobile particles move in the most radial manner, panel c), which, in conjunction with Fig. 1f), demonstrates that at the particle dynamics undergoes a transition from a viscous response with pronounced radial movement to a solid-like response with a complex local rearrangement of the particles (see below). Due to this strong radial component of the motion, the size of the excitation attains a maximum at , reaching 5-7 particle diameters and involving the maximum number of particles with both quantities having a large variance, panel d). A plot of vs. shows, panel e), that at small the excitations have a fractal geometry with a fractal exponent around 1.6 and that this power-law is an upper bound for even for large values of . Note that this behavior is independent of the laser intensity (symbols with different shape) and hence of the details of the perturbation. For packing fractions around the data points are close but slightly below this power-law, showing that at the excitation have a fractal shape and are also very heterogeneous. For larger the data points scatter strongly, i.e. the excitations no longer are fractal but are just complicated disordered objects.
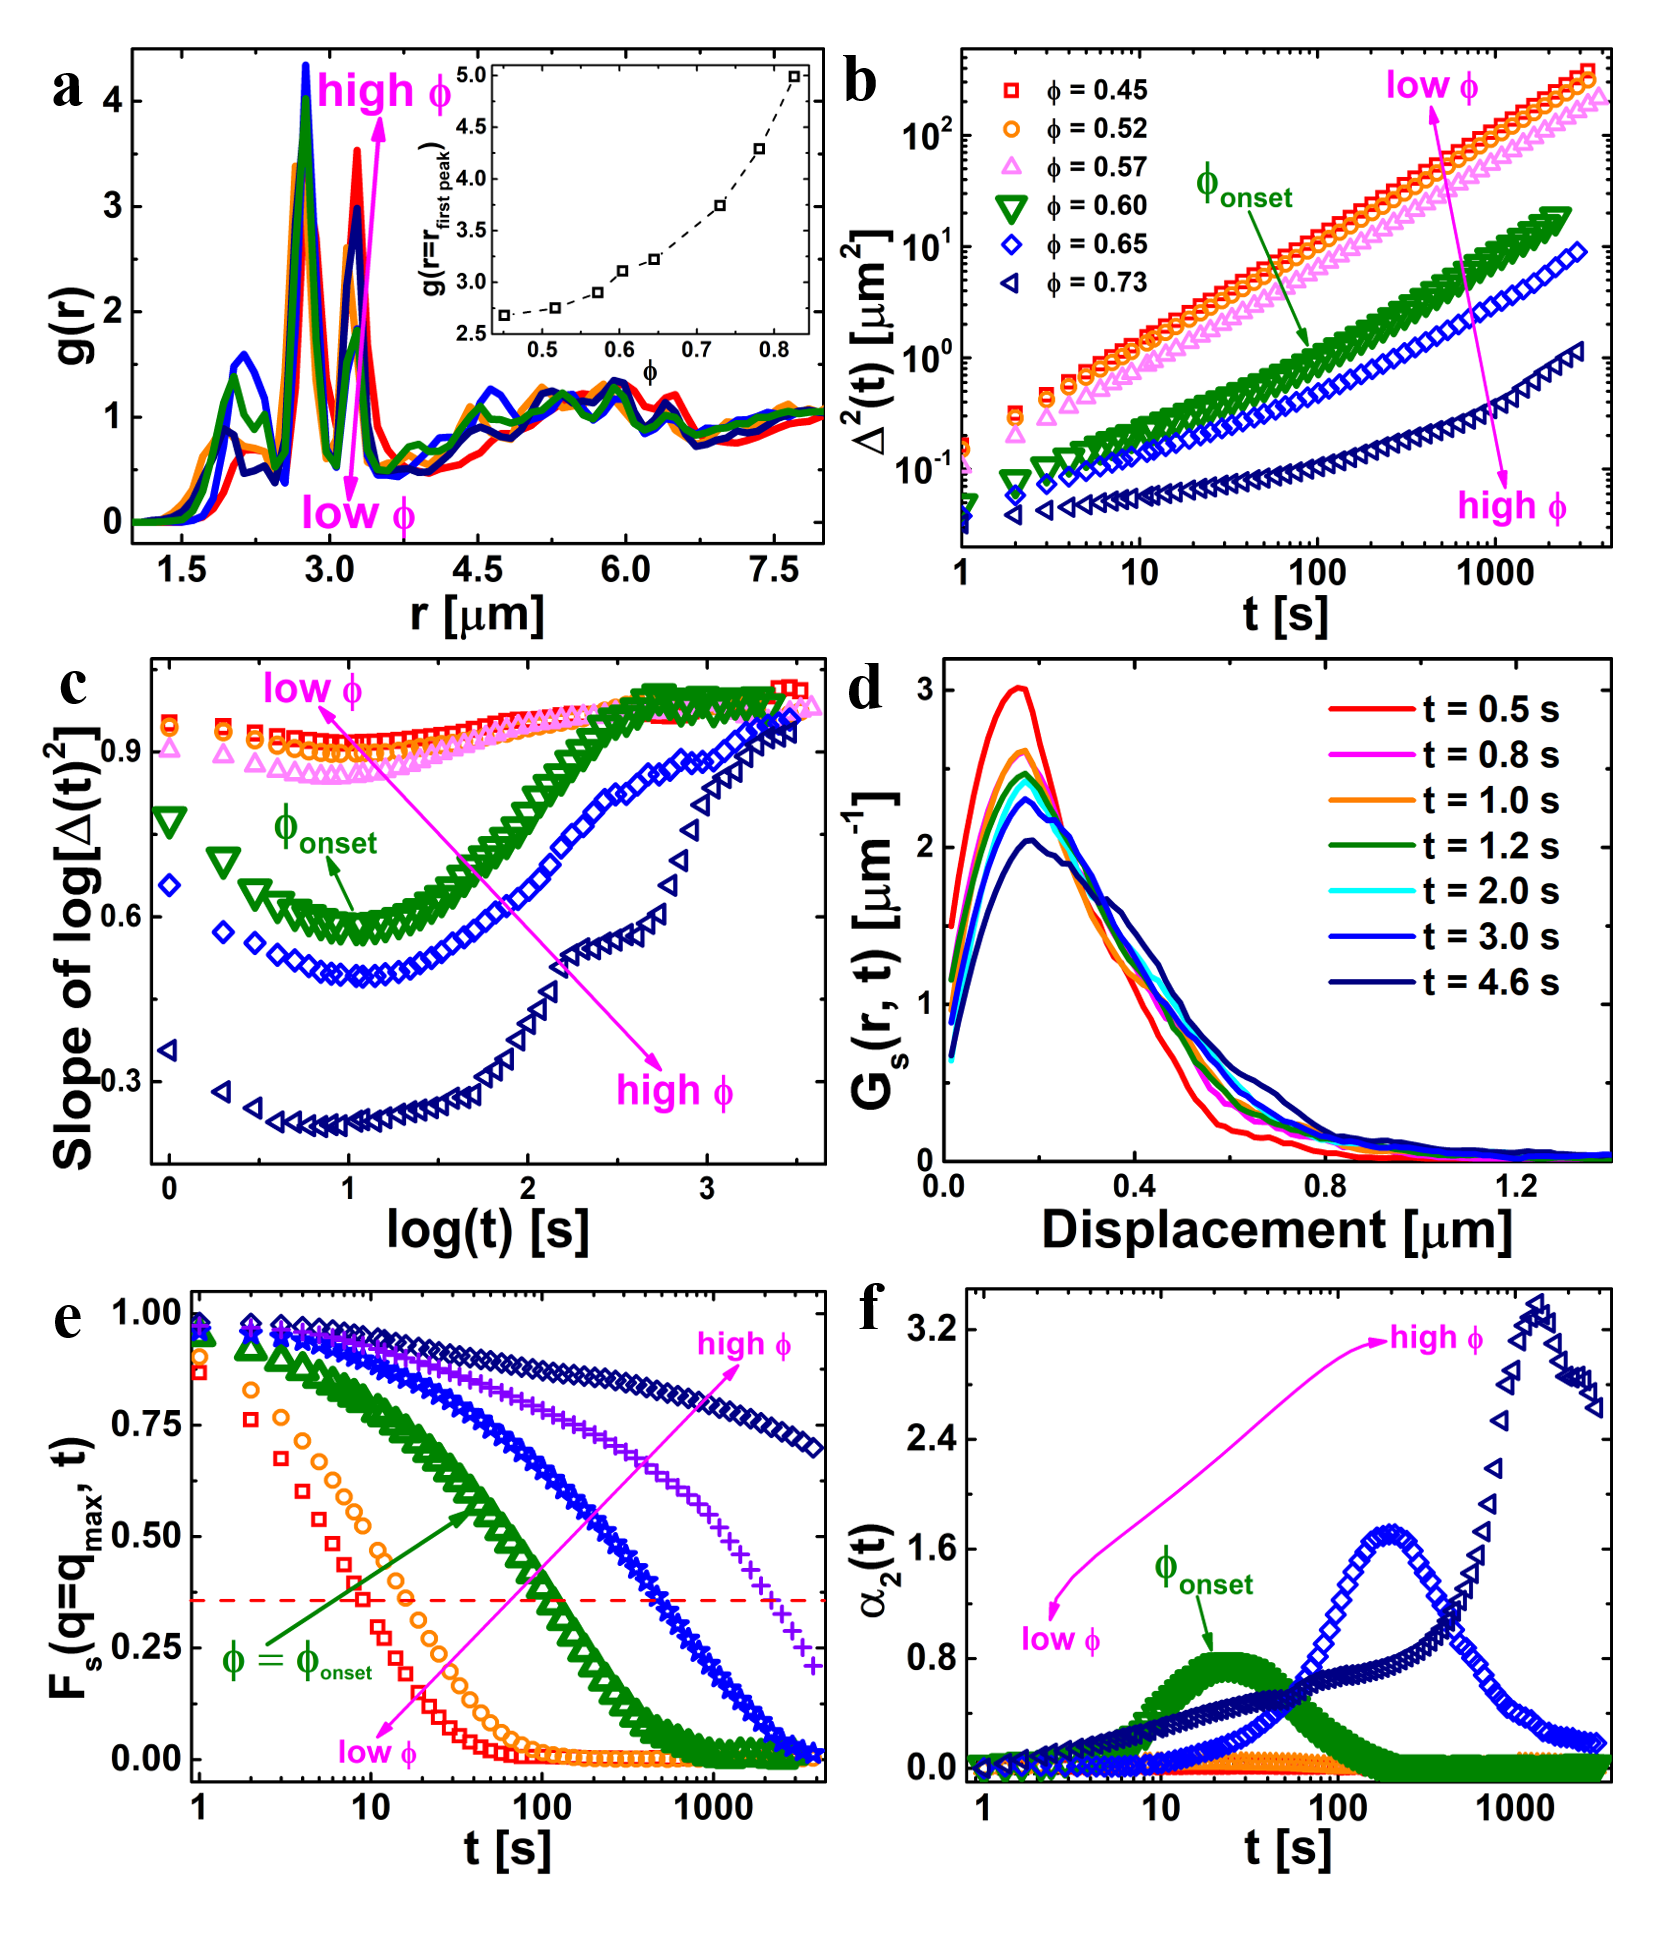
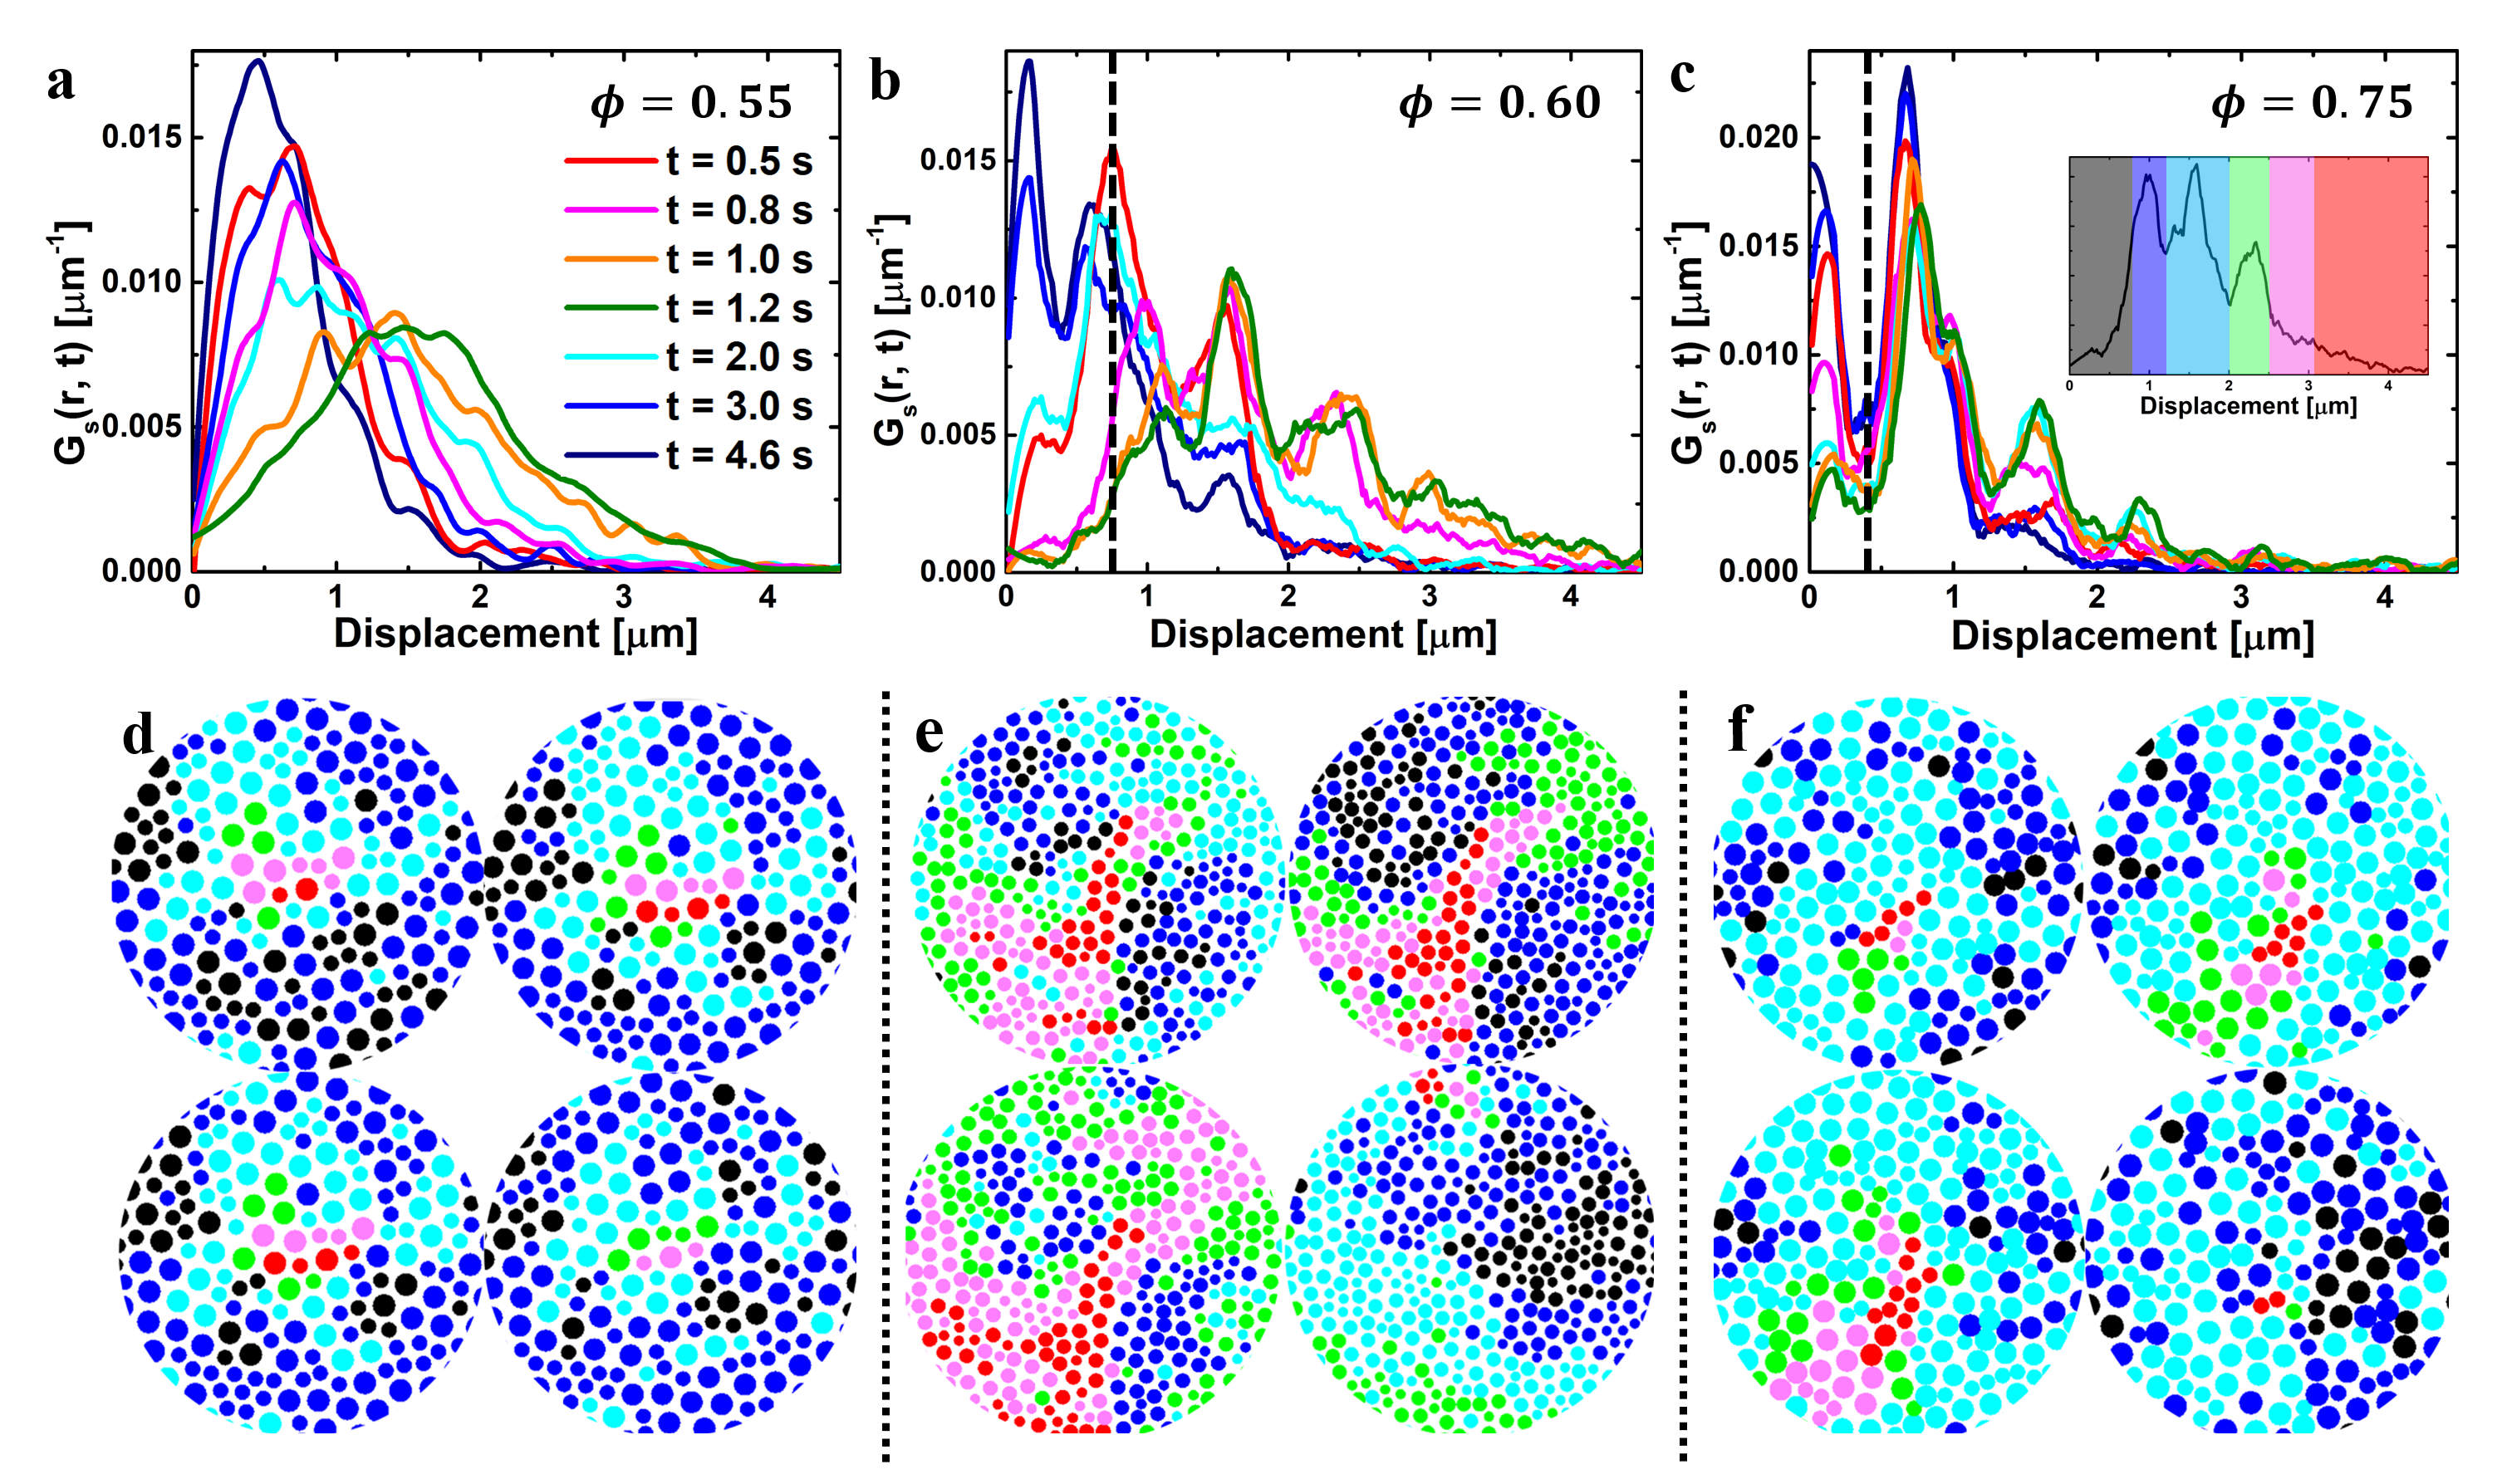
To quantify the displacement of the mobile particles we use the self part of the van Hove function hansen86 , , where is the function, is the number of particles having a distance less that 7 from the laser spot, and s corresponds to the time the laser is turned on, Fig. 3. For , panel a), the particles get displaced significantly, see curve for s, but then return close to their initial position at later times, thus showing the presence of elastic behavior. We find surprising that the distributions for , panel b), show a multitude of regularly spaced peaks indicating that the particles move only by multiples of a distance m. Peaks in have been observed previously in the relaxation regime of deeply supercooled liquids and have been interpreted as the hopping motion of individual particles, which is the relevant transport mechanism in the deep glassy state 2011Glassy_Binder ; 2007_Schweizer . In these cases, however, the spacing of the peaks corresponds to the size of a particle while here it is only about 30 %, i.e. the motion occurs on a significantly smaller scale. Most remarkably, the distributions for long times, s, but still much shorter than the relaxation time, are concentrated at distances that are smaller than the ones for shorter times, s, showing that the particles recoil even after having made large excursions. If is increased to 0.75, panel c), the peaks at small become more pronounced while the ones at large distances decrease, i.e. the response of the system signals that the cage has becomes more solid.
To see the cooperative nature of the particle dynamics we show in panels d)-f) snapshots of individual excitations at four different times. Different colors correspond to the location of the different peaks, see color bar in the inset of panel c). One recognises that the particles with similar displacements, i.e. same color, form clusters demonstrating that the motion of the particles is cooperative and heterogeneous in space. For these clusters become very extended at intermediate times, indicating the presence of zones that are mechanically solid, and hence move as a block, and coupled only weakly to surrounding zones, thus rationalising the presence of the many narrowly spaced peaks in . Although earlier studies have identified heterogeneous and cooperative motion in the relaxation regime at around the packing fraction which corresponds to the mode-coupling point, i.e. much higher than 1997PRL_Kob ; 2000Science_Weeks ; 2000Science_Kegel , that dynamics was irreversible while the motion we document here occurs at lower packing fraction and is to a large extent reversible, i.e. the height of the peak in at small is non-monotonic in time. This difference reflects the fact that at the system is already elastic but still has appreciable local mobility while at higher this mobility is strongly suppressed. These data suggest that phenomena identified earlier with the -relaxation show an interesting counterpart already at .
Our micro-rheological experiments show the complexity of cage formation close to the onset packing fraction. The data suggest that mechanically stiff regions join to build the dynamical wall surrounding each particle. In this view the onset packing is the point at which these (odd shaped) bricks are already quite solid but have not yet merged, giving rise to large fluctuations in the mechanical response. This complex mechanism agrees with the theoretical view that cage-formation is a highly non-linear process involving a feedback mechanism of many particles 2008_Gotze . We expect the observed non-monotonic behavior in the micro-mechanical response to be general since it is directly related to the change of the transport mechanism, from a normal fluid-like behavior for which one has mainly viscous or viscoelastic relaxation to a dynamics that is more glassy, i.e. shows a two step relaxation and has a noticeable elastic component. Although previous studies showed that glass-forming systems can have a non-monotonic dependence of quantities like the relaxation time or the size of mobile regions 1993PRL_Megen ; 2012NP_Kob , these effects occurred around , i.e. at densities that are significantly higher than the onset density at which we find a peak in the non-linear response. Hence these two behaviors should not be confused with each other. Obtaining a theoretical description of the system’s response around the onset point will be challenging because the local heterogeneities preclude the luxury of taking a mean-field approach 2009_Gazuz ; 2020_Gruber . One possibility to advance on this is to connect the local properties of the potential energy landscape with the relaxation dynamics of the system 2018JCP_Lerner or to use computer simulations to study the non-linear local response. To link the current micro-experiments with macroscopic responses, for which so far no non-monotonic behavior of the observables have been found, will be important since it will allow to understand what distinguishes a normal liquid from its glassy counterpart and ultimately why glasses are solid.
References
- (1) K. Binder and W. Kob, Glassy materials and disordered solids: An introduction to their statistical mechanics, World Scientific, 2011.
- (2) E. Weeks and D. Weitz, Subdiffusion and the cage effect studied near the colloidal glass transition, Chem. Phys. 284, 361 (2002).
- (3) S. Sastry, T. M. Truskett, P. G. Debenedetti, T. Salvatore, and F. H. Stillinger, Free volume in the hard sphere liquid, Mol. Phys. 95, 289 (2009).
- (4) R. Pastore, P. Giuseppe, S. Antonio, and M. Pica Ciamarra, Cage Size and Jump Precursors in Glass-Forming Liquids: Experiment and Simulations, J. Phys. Chem. Lett. 8, 1562 (2017).
- (5) A. Cavagna, Supercooled liquids for pedestrians, Phys. Rep. 476, 51 (2009).
- (6) W. van Megen and S. M. Underwood, Glass transition in colloidal hard spheres: Mode-coupling theory analysis, Phys. Rev. Lett. 70, 2766 (1993).
- (7) J.-L. Barrat, J.-N. Roux, and J.-P. Hansen, Diffusion, viscosity and structural slowing down in soft sphere alloys near the kinetic glass transition, Chem. Phys. 149, 197 (1990).
- (8) W. Kob and H. C. Andersen, Testing mode-coupling theory for a supercooled binary Lennard-Jones mixture I: The van Hove correlation function, Phys. Rev. E 51, 4626 (1995).
- (9) C. A. Murray and D. G. Grier, Video microscopy of monodisperse colloidal systems, Annu. Rev. Phys. Chem. 47, 421–462 (1996).
- (10) E. Weeks, J. Crocker, A. Levitt, A. Schofield, and D. Weitz, Three-dimensional direct imaging of structural relaxation near the colloidal glass transition, Science 287, 627 (2000).
- (11) W. K. Kegel and A. van Blaaderen, Direct Observation of Dynamical Heterogeneities in Colloidal Hard-Sphere Suspensions, Science 287, 290 (2000).
- (12) B. Li, X. Xiao, K. Lou, S. Wang, W. Wen, and Z. Wang, Breakdown of diffusivity–entropy scaling in colloidal glass-forming liquids, Comm. Phys. 1, 79 (2018).
- (13) D. Anderson, D. Schaar, H. Hentschel, J. Hay, P. Habdas, and E. R. Weeks, Local elastic response measured near the colloidal glass transition, J. Chem. Phys. 138, 12A520 (2013).
- (14) G. L. Hunter and E. R. Weeks, The physics of the colloidal glass transition, Rep. Prog. Phys. 75, 066501 (2012).
- (15) K. H. Nagamanasa, S. Gokhale, A. Sood, and R. Ganapathy, Direct measurements of growing amorphous order and non-monotonic dynamic correlations in a colloidal glass-former, Nat. Phys. 11, 403–408 (2015).
- (16) I. Buttinoni, J. Cha, W.-H. Lin, S. Job, C. Daraio, and L. Isa, Direct observation of impact propagation and absorption in dense colloidal monolayers, Proc. Nat. Acad. Sci. U.S.A. 114, 12150–12155 (2017).
- (17) C. E. Cash, J. Wang, M. M. Martirossyan, B. K. Ludlow, A. E. Baptista, N. M. Brown, E. J. Weissler, J. Abacousnac, and S. J. Gerbode, Local melting attracts grain boundaries in colloidal polycrystals, Phys. Rev. Lett. 120, 018002 (2018).
- (18) F. A. Lavergne, A. Curran, D. G. Aarts, and R. P. Dullens, Dislocation-controlled formation and kinetics of grain boundary loops in two-dimensional crystals, Proc. Nat. Acad. Sci. U.S.A. 115, 6922 (2018).
- (19) C. Lozano, J. R. Gomez-Solano, and C. Bechinger, Active particles sense micromechanical properties of glasses, Nat. Mat. 18, 1118 (2019).
- (20) W. Götze, Complex dynamics of glass-forming liquids: A mode-coupling theory, Oxford University Press, 2008.
- (21) S. Vivek, C. P. Kelleher, P. M. Chaikin, and E. R. Weeks, Long-wavelength fluctuations and the glass transition in two dimensions and three dimensions, Proc. Nat. Acad. Sci. U.S.A. 114, 1850–1855 (2017).
- (22) E. Flenner and G. Szamel, Viscoelastic shear stress relaxation in two-dimensional glass-forming liquids, Proc. Nat. Acad. Sci. U.S.A. 116, 2015 (2019).
- (23) J.-P. Hansen and I. R. McDonald, Theory of Simple Liquids, Academic Press, 1986.
- (24) K. Schweizer, Dynamical fluctuation effects in glassy colloidal suspensions, Curr. Op. Coll. Int. Sci. 12, 297 (2007).
- (25) W. Kob, C. Donati, S. J. Plimpton, P. H. Poole, and S. C. Glotzer, Dynamical heterogeneities in a supercooled Lennard-Jones liquid, Phys. Rev. Lett. 79, 2827 (1997).
- (26) W. Van Megen and S. Underwood, Glass transition in colloidal hard spheres: Mode-coupling theory analysis, Phys. Rev. Lett. 70, 2766 (1993).
- (27) W. Kob, S. Roldán-Vargas, and L. Berthier, Non-monotonic temperature evolution of dynamic correlations in glass-forming liquids, Nat. Phys. 8(2), 164 (2012).
- (28) I. Gazuz, A. Puertas, T. Voigtmann, and M. Fuchs, Active and Nonlinear Microrheology in Dense Colloidal Suspensions, Phys. Rev. Lett. 102, 248302 (2009).
- (29) M. Gruber, A. Puertas, and M. Fuchs, Critical force in active microrheology, Phys. Rev. E 101, 012612 (2020).
- (30) E. Lerner and E. Bouchbinder, A characteristic energy scale in glasses, J. Chem. Phys. 148, 214502 (2018).
Figures with legends:
Acknowledgements: We thank L. Cipelletti and M. D. Ediger for discussions. This study was supported by the Korean Institute for Basic Science (project code IBS-R020-D1) and grant ANR-15-CE30-0003-02. W. K. is senior member of the Institut Universitaire de France.
Author contributions: BL, WK, and SG designed the research. BL and KL did the measurements. BL analyzed the data. BL, WK, and SG wrote the paper.
Competing interests: The authors declare no competing interests.
Materials & Correspondence: Correspondence and requests for materials should be addressed to B.L. (libotc@gmail.com), W.K. (walter.kob@umontpellier.fr) or S.G. (sgranick@gmail.com).
Methods
Experimental system
Our glass-former is a binary mixture of anionic PMMA colloidal particles (Microparticle GmbH) with size m and m and number ratio of . This same system was studied using other approaches in Ref. 2018CP_Li . The particles are slightly negatively charged and the anionic surface charge comes from sulfate groups brought in by the initiator in the polymerization reaction. The zeta potential is around -20 mV. The interaction is hard-sphere like 2019PRX_Li (31), which can be recognized by measuring the radial distribution function of a semi-dilute sample. The Debye length of this system is smaller than 20 nm as can be estimated from the position of the first peak of and the zeta potential 2019PRX_Li (31, 32). Suspended in water these particles are confined between two glass plates separated by 3.37 m. This spacing is fixed by adding to the suspension a small amount (0.1 in number) of 3.37m gold particles (Microparticle GmbH). It can be expected that the confinement by the two glass walls will not induce any additional heterogeneity to the particle dynamics 2012PRE_Edmond (33) because the distance between the two glass walls is uniform. Since the spacing is larger than the size of the colloidal particles the latter get stuck between the plates only rarely (on average less than one in a field of view that contains 1000-3000 particles) and hence the dynamics of the system is not influenced in a significant manner. As the separation is small, most of the hydrodynamic forces between the particles are screened and hence we are left with just the steric hindrance interaction 2013PRL_Ma (34). The roughness of the glass substrate on the length-scale of microns is on the scale of nanometer while on the scale of a few hundred m is at most a small fraction of the size of the gold particles. To avoid enthalpic interactions between the particles and the walls we have treated the substrate in the same way as documented by Refs. 2018CP_Li ; 2013PRL_Ma (34). Finally we note that this binary system is a good glass-former and we did not observe any signs of crystallisation 2018CP_Li .
We probe the static and dynamic properties of the system at eight
area fractions with
and the number density of small
and large particles, respectively, with value 0.45, 0.52, 0.57,
0.60, 0.65, 0.73, 0.78, and 0.83 (error bars are 0.01). We use
video microscopy (10 frames/s) to obtain the position of the particles
as a function of time (spatial resolution = 0.1 m), using a CMOS
Hamamatsu camera (C11440-42U30). During the 2-to 6-hours measurements
at each , no drift, flow, or density change was observed. The
centre-of-mass positions of the colloidal particles is tracked using an
image-processing algorithm 1996ARPC_Murray .
Probing the response
To probe the response of the system we use focused, pulsed laser beams (repetition rate 80 MHz) of duration 0.5 s to generate a local excitation. In practice a spatial light modulator is used to split one beam into four and we shine these sub-beams simultaneously to different positions of the sample (avoiding the gold particles). The distance between these spots is sufficiently large (more than 20 ) that excitations do not interact, Extended Data Fig. 1a) and Video 1. The time separation between two excitations is much larger than the relaxation time of the glass-former at the corresponding , i.e. these events can be considered to be independent. This setup allows to collect rapidly the necessary large, statistically-meaningful amounts of data for the subsequent analysis. For each pair (), more than 20 individual excitation events were evaluated to ensure reliable statistics.
The laser beams impinging on the sample will scatter from the colloidal particles and will exert a dielectrophoretic force to the particles near the edge of the laser waist, due to the gradient of the electromagnetic field, pushing them away from the beam center 1999CSAPEA_Peter (35). As a result, the particles very close to the beam start to collide with their neighboring particles, setting up an excitation.
Previous studies have shown that with this setup of the laser beam the scattering force is localized to a range that is smaller than two particle diameters 2015OE_Villadsen (36) and to have a magnitude which is proportional to the laser power 2015OE_Villadsen (36, 37). To get a better understanding on how the laser influences the motion of a particle we show in Extended Data Fig. 1b) the time dependence of the displacement of a particle that at time zero is hit by the laser beam. The packing fraction is and the different curves correspond to particles that at had different distances from the beam center. (Here the laser power is mW.) If the initial distance of the particle is about the half width of the beam the force is very large, since the gradient in the intensity is at its maximum and the particle gets displaced by around 3.6 m. If the initial distance is increased to 0.8 , the final displacement is reduced somewhat. In contrast to this we see that for an initial displacement of 1.18 the particle does not move at all, which shows that the influence of the laser beam is restricted to a range that is smaller than 1.2 .
Having demonstrated that the laser influences the motion of a particle only at small distances one can wonder whether the properties of an excitation depend on the distance between the beam center and the hit particle. In Extended Data Figs. 1c) and d) we thus show the maximum number of mobile particles, , and the radius of gyration, , as a function of this distance. One recognizes that there is no obvious trend in the data, which is evidence that the mentioned distance does not influence the properties of the resulting excitation.
Extended Data Fig. 1e) demonstrates that the maximum intensity of the laser increases quickly with . However, panel f) shows that the half width of the beam waist remains constant and therefore we conclude that the region directly influenced by the laser is independent of its intensity .
Extended Data Fig. 1g) presents the long time displacement of
a particle, , as a function of the laser power used to
hit the particle. The packing fraction is low, , and so
one expects that only the time-dependent dielectrophoresis force from
the laser and the viscous (Stokes) forces act on the particles. (The
former only while the laser is on, i.e. 0.5 s, blue area in Extended Data
Fig. 1b). We recognize that is a linear function in
the laser intensity , a linear fit gives [m] =
0.036 [mW], showing that is directly related to the
velocity of the particle at the end of the laser pulse. To estimate
this velocity we use Extended Data Fig. 1b) to obtain from
the short time displacement for (red curve)
that , where s is the
duration of the pulse, i.e. m/s. Combining this
with the mentioned linear dependence of on we thus
find which gives for,
say, 100 mW a velocity of 7.2 m/s. Using the fact that the work
done by the dielectrophoresis force is the same as the one done by the
viscous force, we estimate the magnitude of the dielectrophoresis force,
averaged over 0.5 s, to be in the pN range.
Static and dynamic properties of the quiescent system
In this section we present the static and dynamic properties of our liquid under quiescent conditions and demonstrate that our system has the usual characteristic of a standard glass-former.
In Extended Data Fig. 2a) we show the radial distribution function for the packing fractions considered hansen86 . As for all good glass-formers, the dependence of is mild in that an increasing packing fraction mainly results in an increase of the various peaks 2011Glassy_Binder . This is demonstrated in the inset of the figure which shows the height of the main peak as a function of the packing fraction. One recognises that this height is a smooth function of , indicating that the system is indeed a good glass-former that shows no sign of crystallisation.
The simplest way to characterise the relaxation dynamics of a liquid is via the mean squared displacement (MSD) of the particles
| (1) |
In Extended Data Fig. 2b) we show the time dependence of the MSD for different packing fractions. One recognises that for the MSD shows no sign of the presence of a plateau in that it is diffusive at all times, i.e. the MSD follows a power-law with exponent 1.0. For one finds that at intermediate times (2-100 seconds) the MSD is almost flat, i.e. the particles are trapped within their cage, while at longer times they start to become diffusive. The packing fraction at which the MSD shows the first significant deviation from a purely diffusive behavior is around , which is thus a first estimate for the value of the onset density.
To identify the onset point in a more quantitative manner we take the first derivative of the MSD. If a particle is caged it will show in the MSD a sub-diffusive time dependence, i.e. the local slope will be smaller than 1.0. In Extended Data Fig. 2c) we show this slope and one sees that for packing fractions up to 0.57 this slope is close to unity for all times, i.e. the system is always diffusive. For a clear dip occurs and hence we can conclude that this is close to the onset packing fraction. For higher the dip becomes more pronounced and extends to longer times, showing that the cage is getting stronger, as expected for a system that approaches its glass transition.
In the main text we have shown that during an excitation event the van Hove function of the system shows several peaks that becomes most pronounced at and that these peaks are related to a highly cooperative motion which involves 20 to 50 particles (Fig. 3). Extended Data Fig. 2d) demonstrates that in the quiescent system no such peaks are observed, in agreement with many previous studies of the relaxation dynamics of colloidal systems and computer simulations of moderately glassy fluids 2012RPP_Hunter ; 1995PRE_Kob , which is evidence that our system has no unusual dynamical features.
Another useful observable to probe the dynamics is the self intermediate scattering function hansen86 ,
| (2) |
where is the wave-vector. Since a liquid is isotropic, the right hand depends only on the norm . Extended Data Fig. 2e) shows the time dependence of for a wave-vector that corresponds to the maximum in the static structure factor, i.e. m-1. We see that for small the time correlation function decays quickly to zero while with increasing packing fraction the relaxation dynamics quickly slows down, as expected. For intermediate one notes that the shape of the time correlation function changes in that it shows at intermediate times the formation of a shoulder. This feature becomes more pronounced if is increased more and demonstrates the formation of the cage that temporarily traps the particles on intermediate time scales 2011Glassy_Binder ; 1995PRE_Kob . The packing fraction at which this shoulder starts to become visible is around 0.60, indicating that this value corresponds roughly to the packing fraction at the onset point, a result that is compatible with earlier studies of two-dimensional glass-forming systems 2010PRE_Kurita (38, ). From that graph it is also evident that , the critical packing fraction of mode-coupling theory 2008_Gotze , is significantly higher than 0.6. Although we have not made a detailed study to determine , previous computer simulations and experiments suggest that for a two dimensional system is around 0.79 2011PRE_Weysser (39, ), a value that is compatible with the dynamic data we have. Below we use the self intermediate scattering function to obtain the -relaxation time . Fitting a Vogel-Fulcher-Tammann-like expression to , we obtain a , the packing fraction at the glass transition, that is around .
A further property that characterises glass-forming systems is that the relaxation dynamics becomes heterogeneous upon entering the glassy regime 2000_Ediger (40). This heterogeneity can be seen, e.g., by probing the non-Gaussian parameter which for a two-dimensional system is given by
| (3) |
Extended Data Fig. 2f) shows the time dependence of for the different packing fractions. In agreement with previous studies one finds that at low the function is basically zero, i.e. the system shows no heterogeneity by this definition 2000_Ediger (40, , ). At intermediate and large one sees a peak in , the position of which moves to larger times with increasing packing fraction and also its height becomes larger, indicating the increasing presence of dynamical heterogeneities. This peak starts to become noticeable at around , indicating that this is indeed close to the onset packing fraction.
Finally we note that our MSD, , and look
qualitatively similar to the ones found in previous studies of colloidal
systems 1998_vanmegen (41, , , 42)
which is strong evidence that our system shows the typical slowing
down of the relaxation dynamics of a glass-forming system, i.e. it
can be considered as generic. The dynamic observables indicate that
the onset packing fraction is around 0.60 and also this result
is compatible with previous studies of two dimensional colloidal
systems 2015PRX_Klix (43).
Influence of the perturbation on the response of the system
In this section we will discuss how the duration and intensity of the laser beam influences the response of the system.
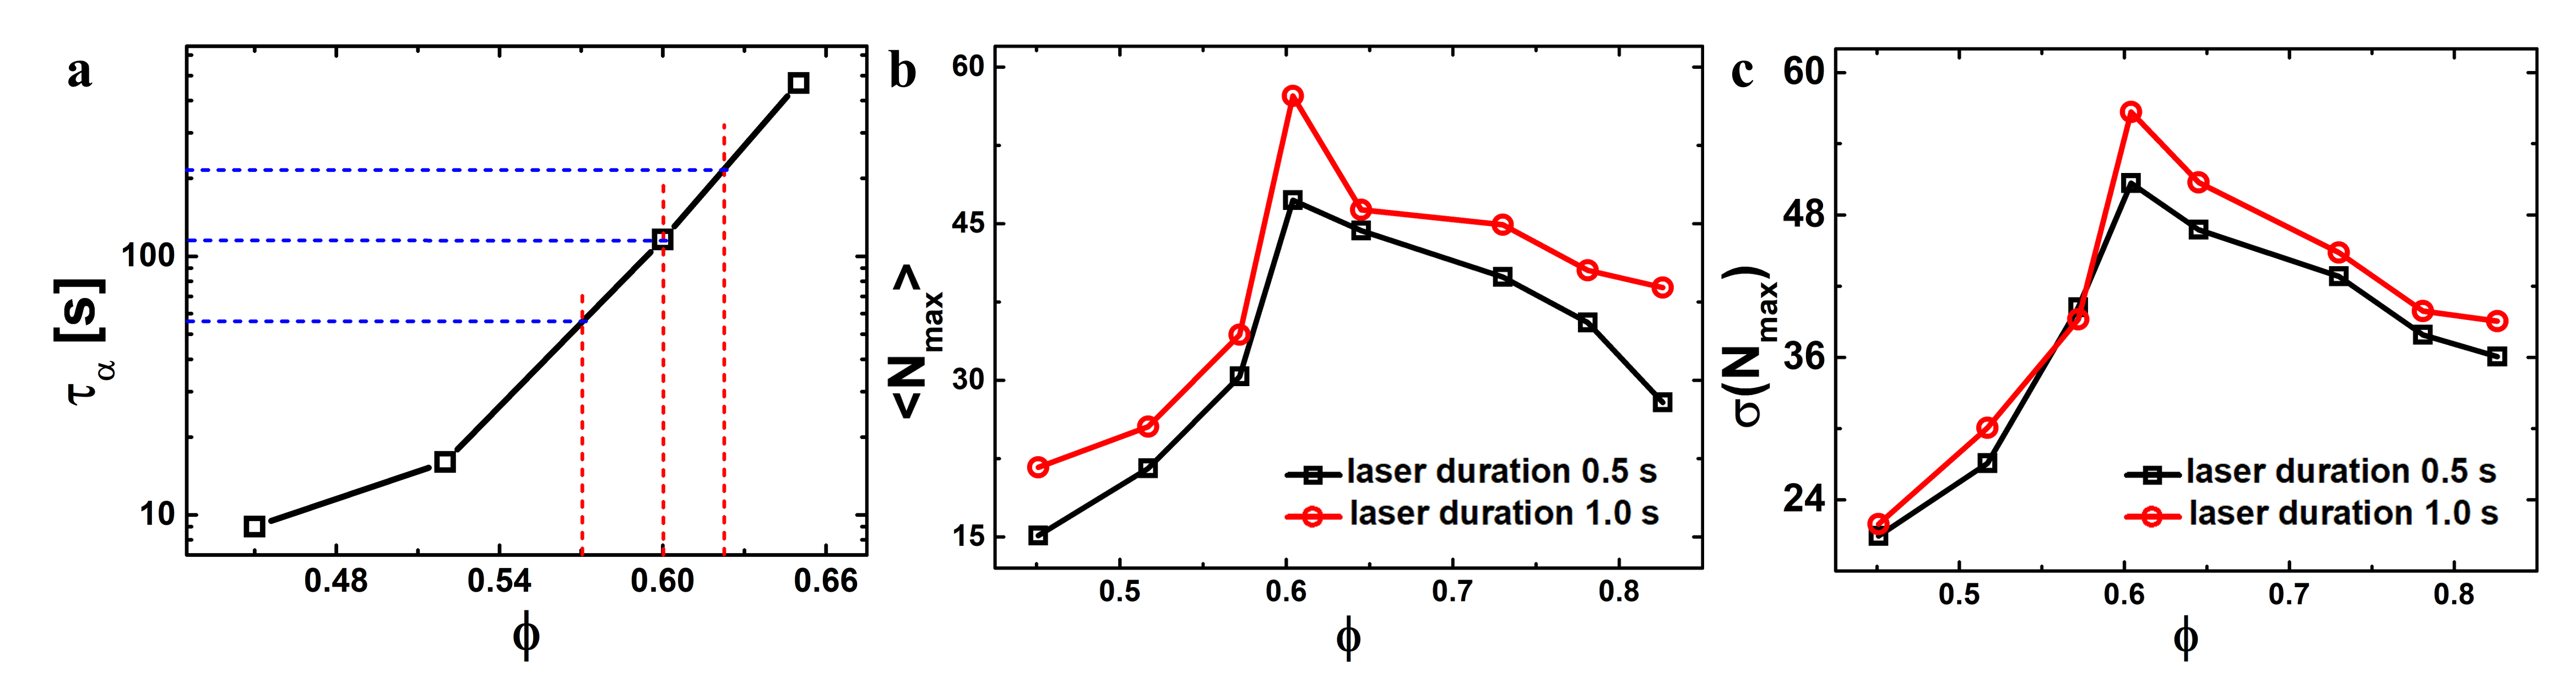
In the main text we have shown that the response of the system, as given by the number of particles that make a significant displacement, shows a non-monotonic dependence as a function of the packing fraction. These results were obtained by shining the laser for a period of 0.5 s onto the sample. Since in complex systems a response can show a maximum because of the crossing of two time scales (e.g. the time scale for the driving and an internal time scale of the system, giving rise to a resonance phenomenon) it is important to check whether in our case the observed maximum in the response is indeed an intrinsic property at the packing fraction and not just a crossing of time scales. To elucidate this point we have repeated some of the experiments by using a time scale for the laser pulse of 1 s, i.e. twice the normal time. In Extended Data Fig. 3a) we show the relaxation time of the system as a function of . (Here we use the usual definition for given by .) From this figure we see that a change in relaxation time by a factor of two corresponds to a change in the packing fraction by about 0.03, taking as a reference packing fraction. In Extended Data Fig. 3b) we plot the average number of particles participating in an excitation, , as a function of . (Here the laser intensity is mW and the definition of is the same as in the main text.) One recognises that the curves corresponding to the laser pulse duration 0.5 s are slightly lower than the one for the duration 1.0 s, a result that makes sense since one injects less power into the system. More important is, however, the observation that the two curves show a peak at the same packing fraction and this with a precision that is definitely better than 0.03. The same conclusion is reached by monitoring the standard deviation of , shown in panel c). Hence we can conclude that the packing fraction at which one finds a maximum response is not influenced in a significant manner by the duration of the laser pulse, i.e. is a property of the system and not of the manner by which it is determined. From panels b) and c) one also recognizes that the increase of and its variance is faster than linear for . This is thus evidence that the growth of these quantities reflects a response of the system related to an increasing collective behavior of the particles if is increased and is not just due to the fact that at higher the laser beam hits on average more particles.
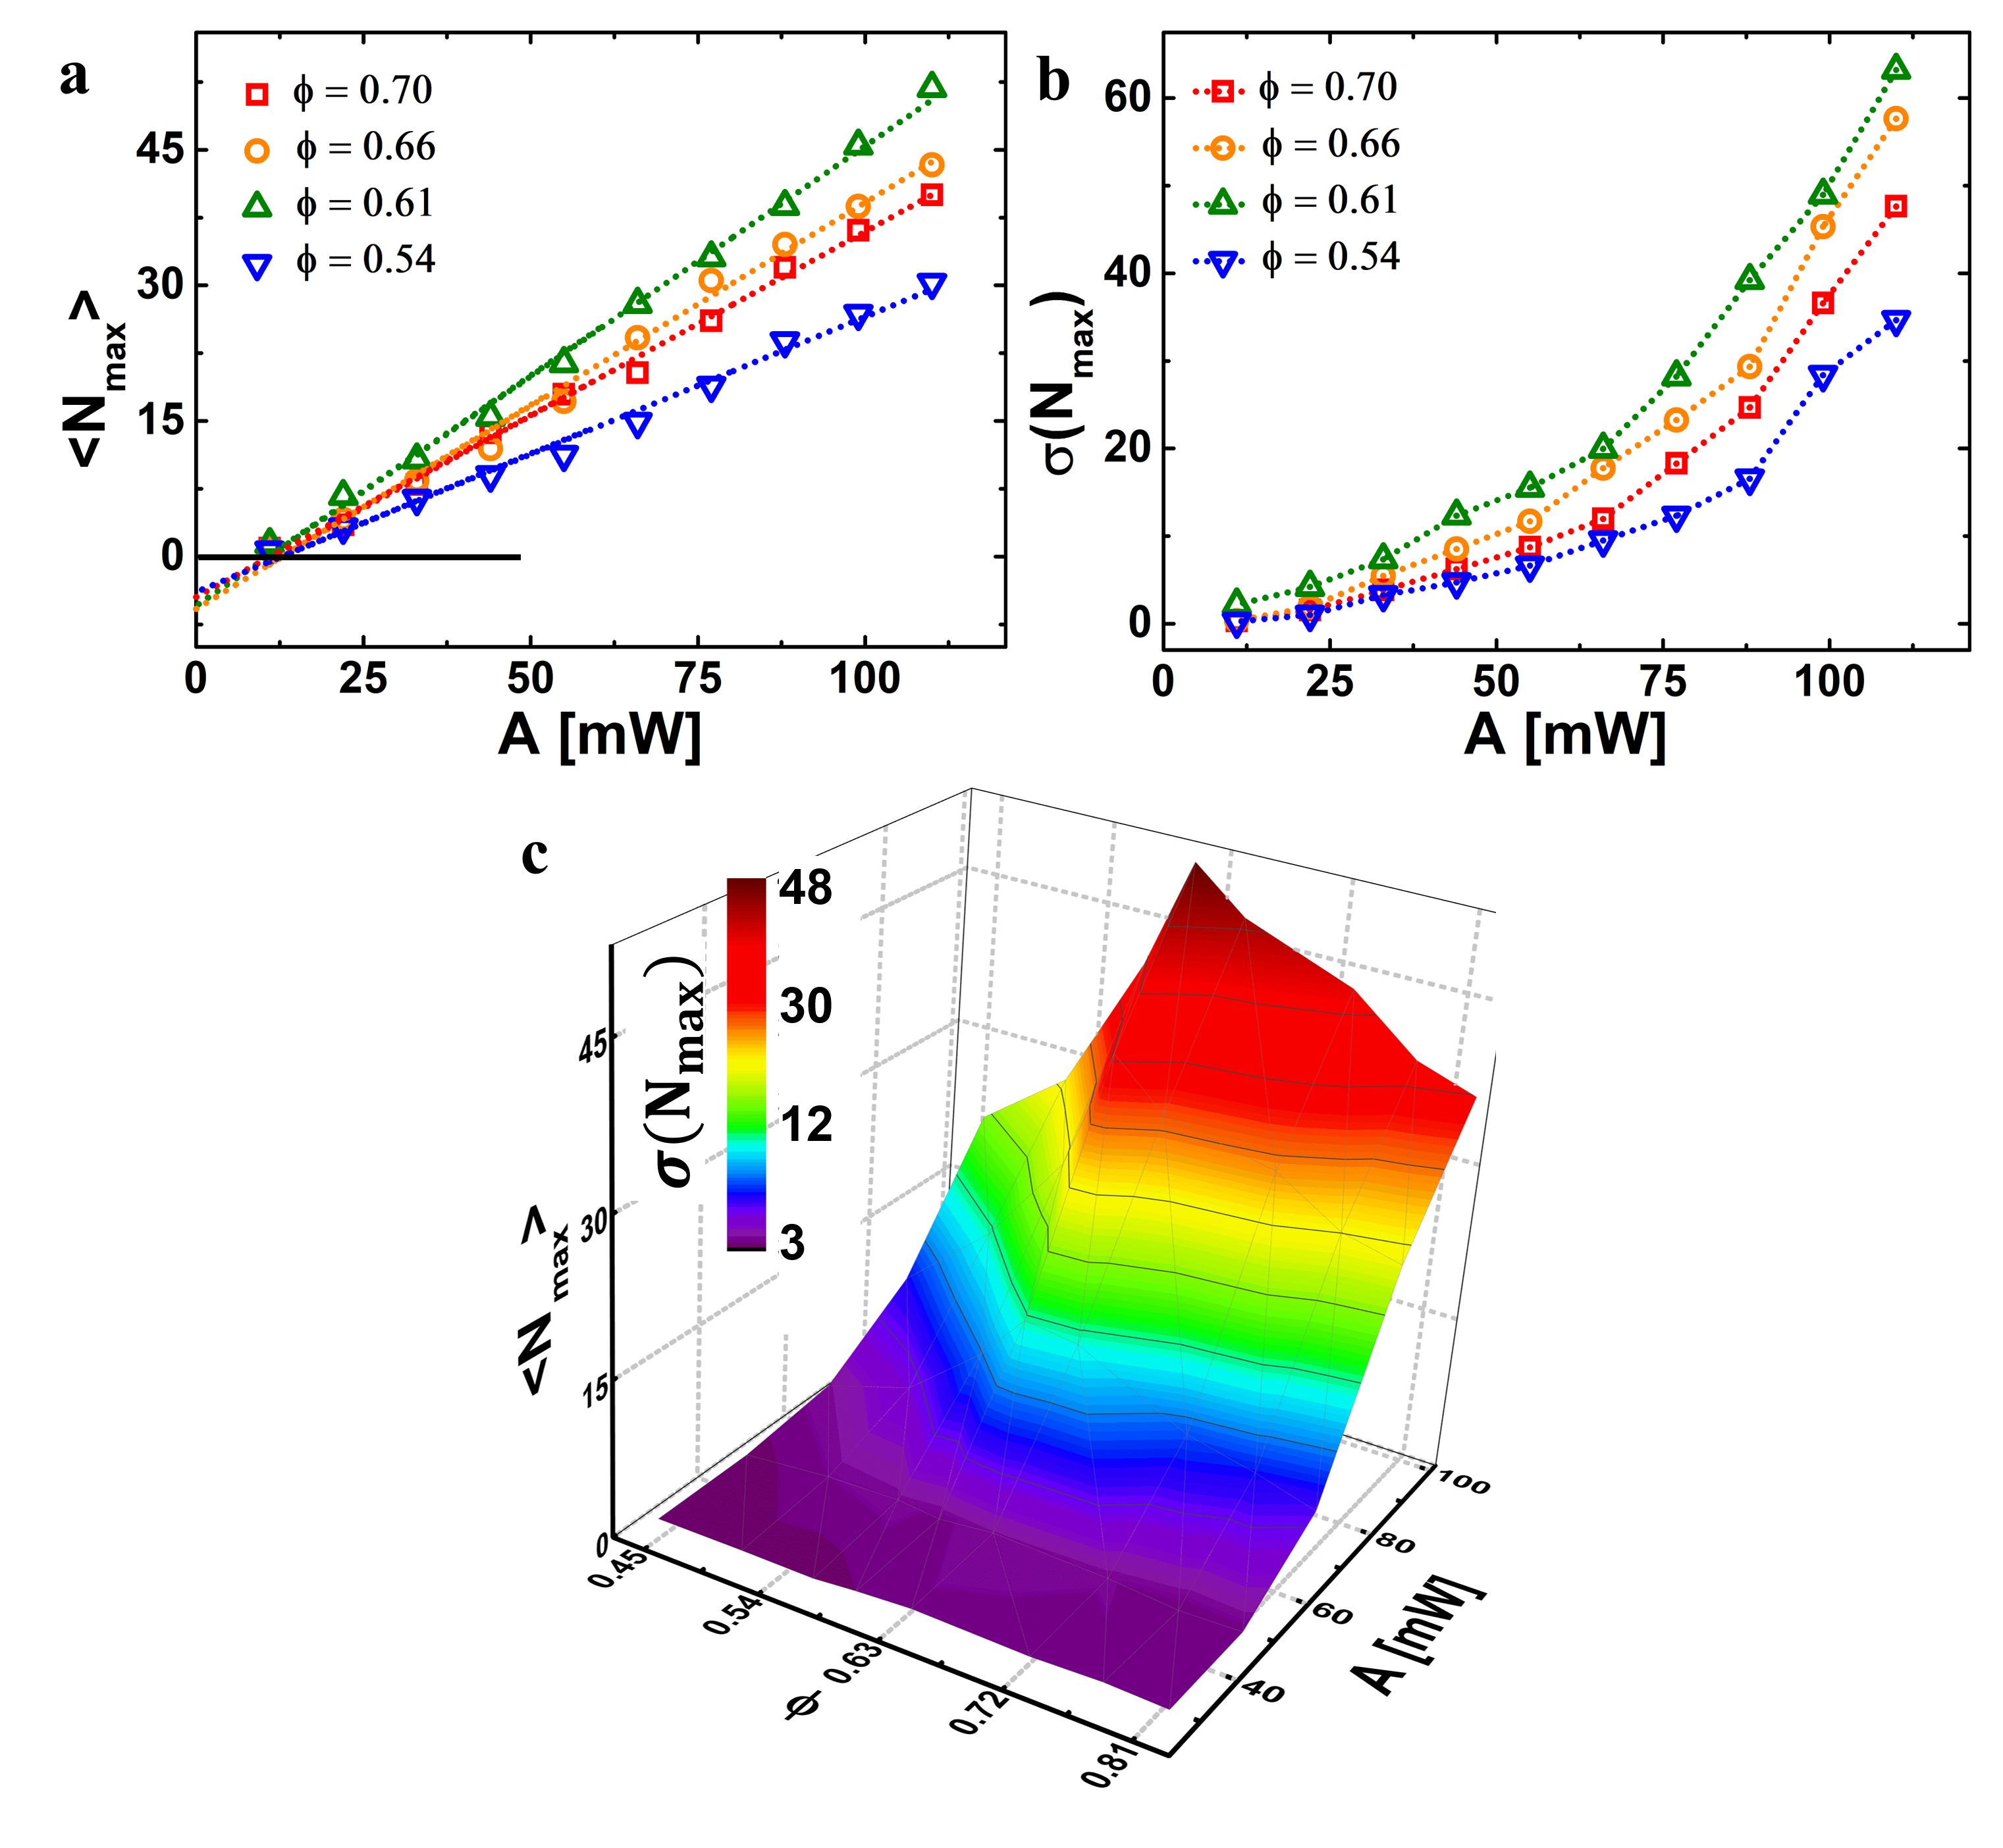
A second important parameter for the local perturbation is the intensity of the laser beam. Extended Data Fig. 4a) shows, for different packing fraction, the average size of the excitation, , as a function of the laser pulse intensity . We see that for all values considered, shows a maximum at around . This demonstrates that the packing fraction at which the system has a maximum response is independent of the laser intensity. The same conclusion is reached by looking at the dependence of the variance of , Extended Data Fig. 4b). Thus we conclude that the maximum response of the system to an external perturbation does not depend in a significant manner on the details of the perturbation. Note that the dependence of is linear. However, a linear fit to the data point intercepts at the ordinate at a negative value of . Since the fits cross the abscissa at around 10 mW, a value that is smaller than the ones we use in our experiments, we have evidence that we are not probing the linear response of the system, but are in the non-linear regime, in agreement with the observation that for all values of we use we do see plastic events. From this graph it can be concluded that for laser intensities less than 10 mW the reaction of the system is elastic, i.e. no excitation will be generated.
In Extended Data Fig. 4c) we present a three-dimensional plot that collects the information on how the size of the excitation depends on the laser intensity and the packing fraction. In agreement with the data shown in panel b) we find that if is kept constant shows a maximum at a packing fraction that is around 0.60, i.e. it is independent of . Also included in the graph is the information regarding the variance of (coded via the color). One sees that a constant implies the same color, i.e. the variance is constant as well. So one concludes that the size of the excitation determines its variance, i.e. the latter depends on and only via .
Finally we show in Extended Data Fig. 5a) a snapshot of an excitation produced with a beam of low intensity, mW, in a sample with intermediate density, . After a waiting time of around 20 s, i.e. a time after which the excitation has completely died away, a second pulse is fired at the same spot in the sample. One finds, panel b), that the pattern of the excitation is very similar to the one of the first excitation, which shows that the overall shape of the excitation is encoded in the local structure of the liquid. Panel c) shows the result of a third laser pulse at the same spot and one finds again that the shape of the excitation does not change, thus confirming that the local structure of the liquid determines the displacement of the particles after the pulse.
If the intensity of the pulse is increased to mW, the first pulse
gives rise to an excitation that is larger than the one obtained with
the weaker intensity (panel d), a result that makes sense since the
injected energy is larger and is coherent with Extended Data Fig. 4a). In this case the pulse perturbs the local structure so strongly
that a second laser pulse hitting 19 s later the same spot will generate
an excitation pattern which is very different from the first one, panel
e), and the same is true if one fires a third laser pulse, panel
f). Since Extended Data Fig. 4 demonstrates that the qualitative
response of the system is independent of one thus can conclude that
the presence of the irreversible motion induced by a high laser intensity
does not perturb the local equilibrium of the system, or at least not
in a significant manner, i.e. the laser pulse can indeed be used as
a micro-rheological perturbation that allows to probe the equilibrium
properties of the system.
Videos
Video 1: Main idea of the experiment. A femtosecond laser is focused
to the spot marked by a red cross for an interval of 0.5 s starting at
s into the video. This causes the particle near the focal point
to shift position abruptly and we analyze the resulting deformations of
the nearby particles. In this example, the area fraction is 0.35 and
laser intensity at the focus is 99 mW. At this low area fraction, the
particle displacement is rapid and permanent, and neighbors experience
little perturbation.
Video 2: Data and analysis illustrated below the onset density. In
this example the area fraction is 0.50 and the laser power 99 mW. The
beam of the femtosecond laser is split into 4 focus spots, marked here
by red crosses, for an interval of 0.5 s starting at s into the
video. The focus spots are separated by a distance sufficiently large so
that responses to the perturbation are independent. Right panel: video
showing raw data. Left panel: associated displacements of neighboring
particles using the color code defined in Fig. 1.
Video 3: Data and analysis illustrated at the onset density. In this
example the area fraction is 0.60 and the laser power 99 mW. The beam
of the femtosecond laser is split into 4 focus spots, marked here
by red crosses, for an interval of 0.5 s starting at s into the
video. The focus spots are separated by a distance sufficiently large so
that responses to the perturbation are independent. Right panel: video
showing raw data. Left panel: associated displacements of neighboring
particles using the color code defined in Fig. 1.
Video 4: Data and analysis illustrated above the onset density. In
this example the area fraction is 0.70 and the laser power 99 mW. The
beam of the femtosecond laser is split into 4 focus spots, marked here
by red crosses, for an interval of 0.5 s starting at s into the
video. The focus spots are separated by a distance sufficiently large so
that responses to the perturbation are independent. Right panel: video
showing raw data. Left panel: associated displacements of neighboring
particles using the color code defined in Fig. 1.
Data availability statement:
The figures and videos that support the findings of this
study are available in zenodo with the identifier
https://zenodo.org/record/3989982#.Xzv_cxFS8nQ,
doi:10.5281/zenodo.3989982.
Code availability statement:
The code used in this study is available from B.L.
References
- (1) B. Li, X. Xiao, S. Wang, W. Wen, and Z. Wang, Real-Space Mapping of the Two-Dimensional Phase Diagrams in Attractive Colloidal Systems, Phys. Rev. X 9, 031032 (2019).
- (2) F. Yang, W. Wu, S. Chen, and W. Gan, The ionic strength dependent zeta potential at the surface of hexadecane droplets in water and the corresponding interfacial adsorption of surfactants, Soft matter 13, 638–646 (2017).
- (3) K. V. Edmond, C. R. Nugent, and E. R. Weeks, Influence of confinement on dynamical heterogeneities in dense colloidal samples, Phys. Rev. E 85, 041401 (2012).
- (4) X. Ma, W. Chen, Z. Wang, Y. Peng, Y. Han, and P. Tong, Test of the universal scaling law of diffusion in colloidal monolayers, Phys. Rev. Lett. 110, 078302 (2013).
- (5) P. Eppmann, B. Prüger, and J. Gimsa, Particle characterization by AC electrokinetic phenomena: 2. Dielectrophoresis of Latex particles measured by dielectrophoretic phase analysis light scattering (DPALS), Col. Sur. A: Phys. and Eng. Asp. 149, 443–449 (1999).
- (6) N. Villadsen, D. Ø. Andreasen, J. Hagelskjær, J. Thøgersen, A. Imparato, and S. R. Keiding, Pushing the limit: investigation of hydrodynamic forces on a trapped particle kicked by a laser pulse, Opt. Exp. 23, 13141–13152 (2015).
- (7) C. Zensen, N. Villadsen, F. Winterer, S. Keiding, and T. Lohmüller, Pushing nanoparticles with light - A femtonewton resolved measurement of optical scattering forces, APL Phot. 1, 026102 (2016).
- (8) R. Kurita and E. R. Weeks, Glass transition of two-dimensional binary soft-disk mixtures with large size ratios, Phys. Rev. E 82, 041402 (2010).
- (9) F. Weysser and D. Hajnal, Tests of mode-coupling theory in two dimensions, Physical Review E 83, 041503 (2011).
- (10) M. Ediger, Spatially Heterogeneous Dynamics in Supercooled Liquids, Annu. Rev. Phys. Chem. 51, 99 (2000).
- (11) W. van Megen, T. C. Mortensen, S. R. Williams, and J. Müller, Measurement of the self-intermediate scattering function of suspensions of hard spherical particles near the glass transition, Phys. Rev. E 58, 6073 (1998).
- (12) G. Brambilla, D. El Masri, M. Pierno, L. Berthier, L. Cipelletti, G. Petekidis, and A. Schofield, Probing the equilibrium dynamics of colloidal hard spheres above the mode-coupling glass transition, Phys. Rev. Lett. 102, 085703 (2009).
- (13) C. L. Klix, G. Maret, and P. Keim, Discontinuous shear modulus determines the glass transition temperature, Phys. Rev. X 5, 041033 (2015).