Effects of drug resistance in the tumour-immune system with chemotherapy
treatment
José Trobia1,2,*, Enrique C
Gabrick1, Evandro G Seifert3, Fernando S
Borges4, Paulo R Protachevicz5, José D
Szezech Jr1,2, Kelly C Iarosz5,6,7, Moises S
Santos5, Iberê L Caldas5, Kun
Tian8, Hai-Peng Ren8,9, Celso
Grebogi8,10, Antonio M Batista1,2,5
1Graduate Program in Science - Physics, State University of Ponta Grossa, 84030-900, Ponta Grossa, PR, Brazil.
2Department of Mathematics and Statistics, State University of Ponta Grossa, 84030-900, Ponta Grossa, PR, Brazil.
3Department of Physics, State University of Ponta Grossa, 84030-900, Ponta Grossa, PR, Brazil.
4Center for Mathematics, Computation, and Cognition, Federal University of ABC, 09606-045, São Bernardo do Campo, SP,
Brazil. 5Institute of Physics, University of São Paulo, 05508-900, São Paulo, SP, Brazil.
6Faculty of Telêmaco Borba, FATEB, 84266-010, Telêmaco Borba, PR, Brazil.
7Graduate Program in Chemical Engineering Federal Technological University of Paraná, Ponta Grossa, 84016-210, Paraná,
Brazil. 8Shaanxi Key Lab of Complex System Control and Intelligent Information Processing, Xi’an University of Technology, Xi’an
710048, PR China. 9Xi’an Technological University, Xi’an, 710021, PR China. 10Institute for Complex Systems and Mathematical
Biology, University of Aberdeen, AB24 3UE, Aberdeen, Scotland, United Kingdom.
Corresponding author: jtrobia@gmail.com
Abstract
Cancer is a term used to refer to a large set of diseases. The cancerous cells grow and divide and, as a result, they form tumours that grow in size. The immune system recognise the cancerous cells and attack them, though, it can be weakened by the cancer. One type of cancer treatment is chemotherapy, which uses drugs to kill cancer cells. Clinical, experimental, and theoretical research has been developed to understand the dynamics of cancerous cells with chemotherapy treatment, as well as the interaction between tumour growth and immune system. We study a mathematical model that describes the cancer growth, immune system response, and chemotherapeutic agents. The immune system is composed of resting cells that are converted to hunting cells to combat the cancer. In this work, we consider drug sensitive and resistant cancer cells. We show that the tumour growth can be controlled not only by means of different chemotherapy protocols, but also by the immune system that attacks both sensitive and resistant cancer cells. Furthermore, for all considered protocols, we demonstrate that the time delay from resting to hunting cells plays a crucial role in the combat against cancer cells.
Keywords: tumour-immune, chemotherapy, drug resistance
1 Introduction
An abnormal growth of cells can cause a malignant or cancerous tumour to invade nearby tissues and possibly to spread to other organs [1]. Cancer is a group of diseases, being a public health problem in all countries of the world [2]. Many types of treatment have been developed to eliminate cancer cells, such as surgery [3], chemotherapy [4], and radiation [5]. One of the chemotherapeutic treatments is the immunotherapy [6].
Mathematical models have been used to study different types of cancer and stages of tumour progression [7, 8]. In 1972, Greenspan [9] constructed a mathematical model of tumour growth to analyse the evolution of carcinoma. A model of tumour induced capillary growth was proposed by Balding and McElwain [10] in 1985. In the 1990s, Tracqui et al. [11] and Panetta [12] added chemotherapy to study the effects of chemotherapeutic agents on spatio-temporal growth and tumour recurrence, respectively. Recently, López et al. [13, 14] formulated a model of tumour growth with cytotoxic chemotherapeutic agents to analyse the role of dose-dense protocols.
The immune system has as its main function to protect the body against infection and illness. It can recognise the cancerous cells and eliminate them, though, the cancer can weaken the immunity [15]. The cancer treatment that takes advantage of the immune system is known as immunotherapy [16]. Some therapies based on the immune system consists of monoclonal antibodies, vaccines, and T-cell transfer [17]. Mathematical and computational studies of cancer immunotherapy have been performed to understand the interactions between immunity and tumour growth [18, 19]. Borges et al. [20] presented a tumour-immune model with chemotherapy treatment. They considered a time-delay between the conversion from resting to hunting cells, the main immune system reaction. Ren et al. [21] demonstrated analytical result for impulse chemotherapy parameter to eliminate the cancer cells.
Cancers can develop resistance to chemotherapeutic agents [22]. Drug resistance is a phenomenon that occurs when cancer cells are unaffected by chemotherapy. Experiments have yielded information about the mechanisms of cancer drug resistance [23]. Sun et al. [24] modelled drug sensitive and resistant cancer cells in response to chemotherapeutic treatment. Trobia et al. [25] created a model of brain tumour growth with drug resistance. They demonstrated that the time interval of the drug application plays an important role in the treatment to eliminate the cancerous cells.
In this work, we include drug resistance in the tumour-immune model proposed by Borges et al. [20] and analyse its effect on the system. In our mathematical model, the immune system is composed of resting and hunting cells, while the cancer is separated into drug sensitive and drug resistant cells. We consider chemotherapy to combat the tumour growth. However, the chemotherapeutic agents also attack the immune system. We show that the tumour growth can be controlled by means of different chemotherapy protocols.
The paper is organised as follows. In Section , we introduce the tumour-immune system with drug resistance. Section presents our results about the effects of the drug resistance. In the last Section, we draw our conclusions.
2 Mathematical model
Cancer drug resistance has been a difficulty in chemotherapy cancer treatment [26], and the challenge is how to identify and avoid the resistance [27]. Many researchers have carried out tests to find new strategies in the treatment of tumours associated with drug resistance [28].
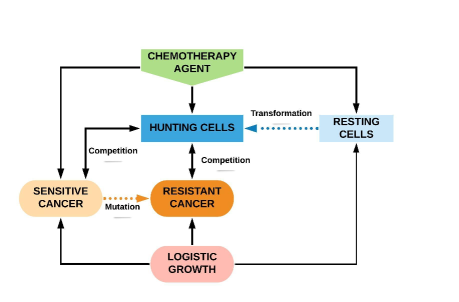
In this work, we proposed a mathematical model that describes cancerous cell growth, where we include cancer drug resistance. The cancer cells are separated into sensitive and resistant cells, as they are attacked by the immune system. In the immune system, the resting cells are converted to hunting cells. We consider that the cancerous and resting cells have a logistic growth, while the hunting cells have a form of programmed cell death, known as apoptosis. The chemotherapeutic agent is applied to kill the cancer, it affects all cells, except the drug resistant cancer cells, as shown in Fig. 1.
The model is given by
| (1) | |||||
| (2) | |||||
| (3) | |||||
| (4) | |||||
| (5) |
where and are the concentration of drug sensitive and resistant cells (kg.m-3), respectively, is the concentration of hunting cells (kg.m-3), is the concentration of resting cells (kg.m-3), is the concentration of the chemotherapeutic agent (mg.m-2), is the time (day), is the delay time from resting to hunting cells, and is a function defined as
| (6) |
Besides that, represents the predation coefficient of the chemotherapeutic agent, corresponds to the rate at which the cells achieve the carrying capacity when there is no competition and predation, and represents the combination rates of the chemotherapeutic agent with the cells [29]. The parameters and are related with the strength of the Holling type 2 interaction functions. Holling [30] proposed types of functional responses to different types of interactions. The type 2 function describes the response of many interacting predators and has the characteristics of decelerating the intake rate. The parameter values that we use in our simulations are given in Table 1.
| Parameter | Values | Description |
|---|---|---|
| day-1 | Proliferation | |
| day-1 | rate [31, 32] | |
| day-1 | ||
| day-1 | Death rate [33] | |
| (cells day)-1 | Conversion rate [33] | |
| mg(m2.day)-1 | Chemotherapy [34, 35] | |
| day-1 | Absorption rate [20] | |
| day-1 | Mutation rate [25] | |
| (cells day)-1 | Competition | |
| (cells day)-1 | coefficients [33] | |
| cells | Carrying | |
| cells | capacity [31, 32] | |
| days | Time delay [32] |
We introduce the following dimensionless variables , , , , and , where and . We consider , , day, day, day, day, day, day, day, day, day, and (). Redefining the variables and removing the stars, we obtain
| (7) | |||||
| (8) | |||||
| (9) | |||||
| (10) | |||||
| (11) |
The dimensionless parameter values are given in Table 2.
| Parameter | Values |
|---|---|
| , , | |
3 Tumour drug resistance
Many different powerful chemicals and clinical protocols have been used to eliminate a wide variety of cancers. In this work, we consider both continuous and pulsed chemotherapy treatments. In our simulations, the initial conditions are given by , , , , and .
3.1 Continuous chemotherapy treatment
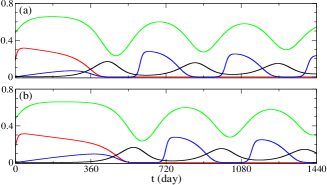
Figure 2 displays the behaviour of the time evolution of (red line), (blue line), (black line), and (green line) when there is no cancer drug resistance () for a continuous chemotherapy treatment. Increasing the value of chemotherapy dose from (Fig. 2(a)) to (Fig. 2(b)), we observe that the cancer (red line) is killed while the cells of the immune system (black and green lines) remain alive.
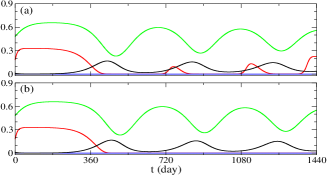
Drug resistance is one of the many problems in the cancer therapy. This phenomenon is considered in our model when the mutation rate . In Fig. 3, we see the appearance of drug resistant cancer cells (blue line) due to . Increasing from (Fig. 3(a)) to (Fig. 3(b)), we verify a temporary cancer remission ( and ) for equal to and days, respectively. The sensitive cancer cells are suppressed by the chemotherapy and the immune system. However, the immune system by itself is not sufficient to suppress the resistant cancer cells.
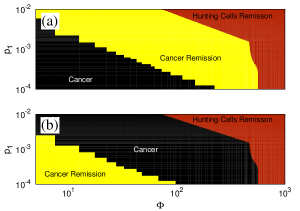
We compute the parameter space to identify the regions in which the cancer remission occurs. Figure 4(a) displays the situation without drug resistance, namely for . We separate into three regions: cancer growth (), cancer remission (), and hunting cells remission (). The cancer grows for small values of and (black region), but it is suppressed for larger values (yellow region). Higher values of these parameters not only lead to the killing cancerous cells, but also weaken the immune system with the remission of the hunting cells (red region). When there is drug resistance, the temporary cancer remission for days () is observed for small values of and for , as shown in Fig. 4(b) (yellow region).
3.2 Pulsed chemotherapy treatment
Pulsed administration of chemotherapeutic drugs, also known as intermittent therapy, is a clinical protocol in which the drug is administered and followed by a rest period. In our simulations, we use periodically pulsed chemotherapy and analyse different rest periods to find cancer remission.
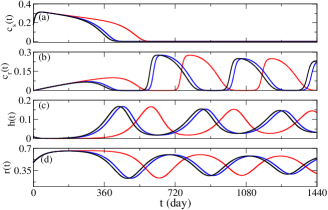
Figures 5(a), 5(b), 5(c), and 5(d), exhibit the time evolution of (a) , (b) , (c) , and (d) , respectively, for , , and different protocols (days of administration time interval). We do not observe a significant difference between the protocols (blue line) and (black line). However, both are better than the protocol (red line), due to the fact that the times for suppression and remission of and , respectively, are shorter than . The suppression of occurs for approximately equal to for , and about for and . The temporary remission () starts approximately days after the chemotherapy treatment according to the protocol , and about days for the protocols and .
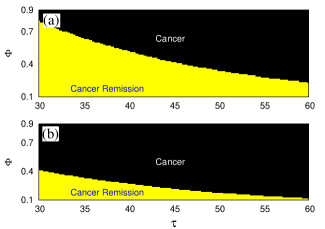
The immune system plays an important role in the combat against the cancer. Thereby, to analyse the influence of the hunting cells on the resistant cancer, we vary the competition coefficient between the hunting and drug resistant cancer cells (), and the delay time from resting to hunting cells (). Figure 6 exhibits the parameter space for the protocol , where we consider cancer remission when and (yellow region) for at least days, and cancer for and (black region). We verify that increasing from (Fig. 6(a)) to (Fig. 6(b)) the cancer remission region decreases. Therefore, for larger value, the cancer remission is obtained for smaller value.

We also compute the parameter space for the protocols and , as shown in Figs. 7(a) and 7(b), respectively. Comparing Fig. 7(a) and Fig. 7(b), we see that not only and are important, but also the type of protocol is relevant to increase the cancer remission region. The cancer remission region is smaller for than .
4 Conclusions
Drug resistance is responsible for a vast majority of cancer deaths and it is one of the major challenges in chemotherapy treatment. Initially some cancers are susceptible to chemotherapeutic agents, however over time they can become resistant. Due to this fact, strategies have been used to eliminate resistant cancer cells.
In this work, we study the effects of the drug resistance in the tumour-immune system with chemotherapy treatment. The immune system is composed of resting cells that can transform into hunting cells. We separate the cancer into drug sensitive and drug resistant cells. In our simulations, we consider continuous and pulsed chemotherapy treatment.
In the continuous chemotherapy treatment, we verify that cancer remission is possible for smaller values of the chemotherapy intensity and the coefficient of chemotherapeutic agent on the sensitive cancer cells. The sensitive cells are eliminated, while the resistant cells are responsible for the remission. With regard to the pulsed chemotherapy, we analyse three types of protocols (days of administration time interval): , , and . The protocols and exhibit almost the same results. In both protocols, the time for the elimination of sensitive cancer cells and the beginning of the temporary remission are less than the protocol . Furthermore, for all protocols, we show that the time delay from resting to hunting cells plays a crucial role in the combat against cancer cells.
Our results are in agreement with recent experimental findings related to chemo-immunotherapy. In 2020, Roemeling et al. [36] carried out treatments to induce immune response against a type of brain tumour. They reported a therapeutic modulation that is able to generate potent hunting cells. In our model, the hunting cell efficiency is increased by means of the competition coefficient between hunting cells and cancer in which the hunting cells kill the cancerous cells. Maletzki et al. [37] in 2019 demonstrated that the combination of immune-stimulating vaccination and cytotoxic therapy can improve long-term survival. Depending on the protocol, they observed tumour free in mice from to weeks. In our simulations, the tumour free occurs about weeks. Nevertheless, for small time delay from resting to hunting cells in our model, it is possible to use different protocols aiming to maximise the tumour free time.
Acknowledgement
This study was possible by partial financial support from the following Brazilian government agencies: Fundação Araucária, National Council for Scientific and Technological Development, Coordination for the Improvement of Higher Education Personnel, and São Paulo Research Foundation (2015/07311-7, 2017/18977-1, 2018/03211-6, 2020/04624-2).
References
- [1] M Höckel and U. Behn, Frontiers in Oncology 9 416 (2019)
- [2] R L Siegel, K D Miller and A Jemal, CA: A Cancer Journal for Cinicians 65 5 (2015)
- [3] M F Brennan, Gastric Cancer 8 64 (2005)
- [4] V T DeVita Jr and E Chu, Cancer Research 68 8643 (2008)
- [5] C M Ronckers, C A Erdmann and C E Land, Breast Cancer Research 7 21 (2004)
- [6] J Couzin-Frankel, Science 342 1432 (2013)
- [7] K C Iarosz, F S Borges, A M Batista, M S Baptista, R A N Siqueira, R L Viana and S R Lopes, Journal of Theoretical Biology 368 113 (2015)
- [8] H N Weerasinghe, P M Burrage, K Burrage and D V Nicolau Jr, Journal of Oncology 2019 1 (2019)
- [9] H P Greenspan, Studies in Applied Mathematcis 52 317 (1972)
- [10] D Balding and D L S McElwain, Journal of Theoretical Biology 114 53 (1985)
- [11] P Tracqui, G C Cruywagen, D E Woodward, G T Bartoo, J D Murray and E C Alvord Jr, Cell Proliferation 28 17 (1995)
- [12] J C Panetta, Bulletin of Mathematical Biology 58 425 (1996)
- [13] A G López, K C Iarosz, A M Batista, J M Seoane, R L Viana and M A F Sanjuán, Communications in Nonlinear Science and Numerical Simulations 79 104918 (2019)
- [14] A G López, K C Iarosz, A M Batista, J M Seoane, R L Viana and M A F Sanjuán, Communications in Nonlinear Science and Numerical Simulations 70 307 (2019)
- [15] H Gonzalez, C Hagerling and Z Werb, Genes & Development 32 1267 (2018)
- [16] S Farkona, E P Diamandis and I M Blasutig, BMC Medicine 14 73 (2016)
- [17] S J Oiseth and M S Aziz, Journal of Cancer Metastasis and Treatment 3 250 (2017)
- [18] F Nani and H I Freedman, Mathematical Biosciences 163 159 (2000)
- [19] A Konstorum, A T Vella, A J Adler and R C Laubenbacher, Journal of the Royal Society Interface 14 20170150 (2017)
- [20] F S Borges, K C Iarosz, H P Ren, A M Batista, M S Baptista, R L Viana, S R Lopes and C Grebogi, Biosystems 116 43 (2014)
- [21] H P Ren, Y Yang, M S Baptista and C Grebogi, Phylosophical Transactions A 375 20160221 (2017)
- [22] G Housman, S Byler, S Heerboth, K Lapinska, M Longacre, N Snyder and S Sarkar, Cancers 6 1769 (2014)
- [23] M M Gottesman, Annual Review of Medicine 53 615 (2002)
- [24] X Sun, J Bao and Y Shao, Scientific Reports 6 22498 (2016)
- [25] J Trobia, T Kun, A M Batista, C Grebogi, H-P Ren, M S Santos, P R Protachevicz, F S Borges, J D Szezech Jr, R L Viana, I L Caldas and K C Iarosz, submitted
- [26] N Vasan, J Baselga and D M Hyman, Nature 575 299 (2019)
- [27] J P Godefridus, Cancer Drug Resistance 1 1 (2018)
- [28] J Rodriguez-Pascual, A Ayuso-Sacido and C Belda-Iniesta, Cancer Drug Resistance 2 980 (2019)
- [29] S T R Pinho, H I Freedman and F Nani, Mathematical and Computer Modelling 36 773 (2002)
- [30] C S Holling, Memoirs of the Entomological Society of Canada 45 1 (1965)
- [31] H Siu, E S Vitetta, R D May and J W Uhr, The Journal of Immunology 137 1376 (1986)
- [32] S Banerjee and R R Sarkar, BioSystems 91 268 (2008)
- [33] V A Kuznetsov, I A Makalkin, M A Taylor and A S Perelson, Bulletin Mathematical Biology 56 (2) 295 (1994)
- [34] R Stupp, W P Mason, M J Van den Bent, M Weller, B Fisher, M J B Taphoorn, K Belanger, A A Brandes, C Marosi, U Bogdahn, J Curschmann, R C Janzer, S K Ludwin, T Gorlia, A Allgeier, D Lacombe, J G Cairncross, E Eisenhauer and R O Mirimanoff, The New England Journal of Medicine 352 987 (2005)
- [35] H M Strik, C Marosi, B Kaina and B Neyns, Current Neurology and Neuroscience Reports 12 286 (2012)
- [36] C A von Roemeling, Y Wang,Y Qie, H Yuan, H Zhao, X Liu, Z Yang, M Yang, W Deng, K A Bruno, C K Chan, A S Lee, S S Rosenfeld, K Yun, A J Johnson, D A Mitche, W Jiang and B Y S Kim, Nature Communications 11 1508 (2020)
- [37] C Maletzki, L Wiegele, I Nassar, J Stenzel and C Junghanss, Journal for ImmunoTherapy of Cancer 7 8 (2019)