Explainable Machine Learning for Materials Discovery: Predicting the Potentially Formable Nd-Fe-B Crystal Structures and Extracting Structure-Stability Relationship
Abstract
New Nd-Fe-B crystal structures can be formed via the elemental substitution of LA-T-X host structures, including lanthanides (LA), transition metals (T), and light elements X = B, C, N, and O. The 5967 samples of ternary LA-T-X materials that are collected are then used as the host structures. For each host crystal structure, a substituted crystal structure is created by substituting all lanthanide sites with Nd, all transition metal sites with Fe, and all light element sites with B. High-throughput first-principles calculations are applied to evaluate the phase stability of the newly created crystal structures, and 20 of them are found to be potentially formable. A data-driven approach based on supervised and unsupervised learning techniques is applied to estimate the stability and analyze the structure–stability relationship of the newly created Nd-Fe-B crystal structures. For predicting the stability for the newly created Nd-Fe-B structures, three supervised learning models, kernel ridge regression, logistic classification, and decision tree model, are learned from the LA-T-X host crystal structures; the models achieve the maximum accuracy and recall scores of and , respectively. On the other hand, our proposed unsupervised learning model based on the integration of descriptor-relevance analysis and a Gaussian mixture model (GMM) achieves an accuracy and recall score of and , respectively, which are significantly better than those of the supervised models. While capturing and interpreting the structure–stability relationship of the Nd-Fe-B crystal structures, the unsupervised learning model indicates that the average atomic coordination number and coordination number of the Fe sites are the most important factors in determining the phase stability of the new substituted Nd-Fe-B crystal structures.
pacs:
I 1. Introduction
The major challenge in finding new stable material structures in nature requires high-throughput screening of an enormous number of candidate structures, which are generated from different atomic arrangements in three-dimensional space. In fact, only a handful number of structures among these candidates are likely to exist. Therefore, for the non-serendipitous discovery of new materials, candidate structures must be generated strategically so that the screening space is reduced without overlooking potential materials.
A number of strategies have been proposed for the high-throughput screening processes Butler et al. (2018); Curtarolo et al. (2013); Saal et al. (2013a) for finding various new materials. Almost all well-known screening methods consider first-principles calculations as the basis for the estimation of physical properties. Screening processes have been successfully developed for theoretically understanding rare-earth-lean intermetallic magnetic compounds Korner et al. (2016, 2018), Heusler compounds Ma et al. (2017); He et al. (2018); Balluff et al. (2017), topological insulators Yang et al. (2012); Li et al. (2018), perovskite materials Emery et al. (2016); Michalsky and Steinfeld (2017), cathode coatings for Li-ion batteries Aykol et al. (2016), and compounds Ashton et al. (2016). In recent years, various screening processes have been used to replace canonical approaches by machine learning (ML) methods. A few notable works based on ML models involve searching for hard-magnetic phases Moller et al. (2018), Heusler compounds Kim et al. (2018), bimetallic facets catalysts Ulissi et al. (2017), BaTiO3-based piezoelectrics Xue et al. (2016a), polymer dielectrics Mannodi-Kanakkithodi et al. (2016), perovskite halides Pilania et al. (2016), and low-thermal-hysteresis NiTi-based shape memory alloys Xue et al. (2016b).
ML is expected to play three different roles in performing screening processes. The first role is to replace the density functional theory (DFT) calculation and reduce the calculation cost of physical property estimation, e.g., convex-hull distance Kim et al. (2018) and adsorption energy Ulissi et al. (2017). The reported models have achieved reasonable results in statistical evaluation tests, such as cross validation. However, ensuring the reliability of extrapolating the physical properties of new materials is a major problem because the new screening materials do not always possess the same distribution as the training materials.
The second role of ML is to increase the success rate in screening processes. Given a list of hypothetical structures, ML methods are utilized for recommending the most likely new potential materials using probabilistic models (e.g., Bayesian optimization techniques Yamashita et al. (2018); Xue et al. (2016a)). This approach requires a list of potential candidates to be prepared as an input, which is primarily based on human intuition. The bottleneck of the current recommendation methods is that a large number of known property materials are required as references for the system to start an effective recommendation process. This number increases dramatically with the material description dimension. Furthermore, the computational cost of the recommended process increases significantly with the number of reference materials.
The third role of ML is to effectively generate new structure candidates. The notable algorithms for this purpose are random search-based algorithms Pickard and Needs (2011, 2006, 2007); Wang et al. (2010); Zhang et al. (2017), evolutionary-algorithm-based algorithms as USPEX Glass et al. (2006); Oganov et al. (2011); usp (2013), XtalOpt Lonie and Zurek (2011), and recent deep-learning-based models Noh et al. (2019); Ryan et al. (2018). In practice, it is possible to generate random structures by forcibly combining different crystal structures . The successful discovery of novel material structures under high pressure demonstrates the effectiveness of this approach when certain constraints can be set. However, it is not easy to rationally combine different crystal structures with different compositions and symmetry in a plausible manner. Therefore, oversight in the search for a small number of potential materials cannot be controlled. The combination of first-principles calculations and ML is required for creating effective methods for exploring materials.
One of the most common strategies for generating possible crystal structure candidates is to appropriately combine or apply the atomic substitution method to previously known structures. Beginning with a dataset of host crystal structures with known physical properties and predefined substitution operators, we can employ the atomic substitution method to create new hypothetical crystal structures with the same skeleton as that of the host crystal structures. Widely used substitution operators, such as single-site, multisite, or element substitution operators, are selected depending on the host dataset and experts’ suggestions. Typically, these suggestions are based on domain knowledge about the physicochemical similarity between elements, atom–atom interactions, structural stability mechanisms, and target physical property mechanisms. Consequently, the substitution method can work well with knowledge about material synthesis and directly lead to material synthesis ideas. Finally, an of the structure–stability relationship can be directly obtained from screening results, which can help in systematically correcting researchers’ suggestions.
Our contribution
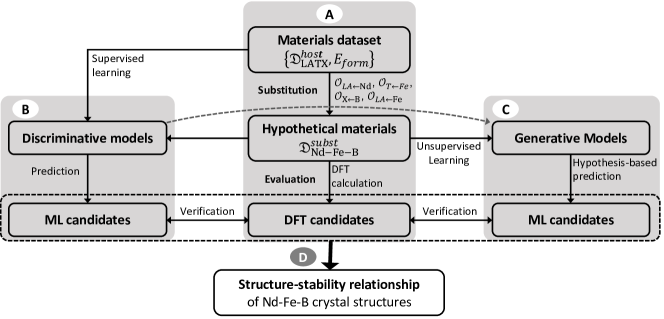
In this study, we propose a protocol for exploring new crystal structures under a given combination of constituent elements and the use of data mining to elucidate the structure–stability relationship (Figure 1). As a demonstration example, we search for the new crystal structures of Nd-Fe-B materials by applying the atomic substitution method to a dataset containing host crystal structures composed of lanthanides, transition metals, and light elements. We apply high-throughput first-principles calculations (Fig. 1, block A) to estimate formation energy. Based on this, we evaluate the phase stability (hereinafter referred to as stability) of all generated Nd-Fe-B crystal structures (section II.22.2). The new Nd-Fe-B structures discovered after the screening steps are presented in section II.32.3. Supervised models are trained to mimic the first-principles calculations from the host and substitution crystal structures and their calculated formation energy. Based on results from supervised learning models, relevance analysis is performed to extract the hidden structural descriptors that determine the formation energy of the generated Nd-Fe-B crystal structures (Fig. 1, block B). Finally, we train an unsupervised learning model (Fig. 1, block C) that use the obtained relevant descriptors to appropriately group newly generated crystal structures. We compare the obtained group labels and potentially formable states of all crystal structures to determine the relationship between the structure and stability of the Nd-Fe-B crystal structures.
II 2. Screening for potential formable Nd-Fe-B crystal structures
II.1 2.1 Creation of new crystal structure candidates
In this study, we focus on crystalline magnetic materials comprising lanthanide (LA), transition metal (T), and light (X) atoms. We select the LA atoms from Y, La, Ce, Pr, Nd, Pm, Sm, Eu, Gd, Tb, Dy, Ho, Er, Tm, Yb, and Lu; T from Ti, V, Cr, Mn, Fe, Co, Ni, Cu, Zn, Y, Zr, Nb, Mo, Tc, Ru, Rh, Pd, Ag, Cd, Hf, Ta, W, Re, Os, Ir, Pt, Au, and Hg; and X from H, B, C, N, and O. We collect the details of 5967 well-known crystal structures with formation energies from the Open Quantum Materials Database (OQMD) Saal et al. (2013b) (version 1.1) to form the host material dataset, which is denoted as . Each host crystal structure consists of one or two rare-earth metals, one or two transition metals, and one light element. Additionally, from , we select a subset of all crystal structures comprising Nd, Fe, and B, which is denoted as .
We create new candidates for crystal structures consisting of Nd, Fe, and B with the same skeleton as the host crystal structures in using a substitution method. For each host crystal structure, a substituted crystal structure is created by substituting all lanthanide sites with Nd, all transition metal sites with Fe, and all light element sites with B. The new structures are compared with each other and with the crystal structures in the dataset to remove duplication. We follow the comparison procedure proposed by qmpy (the python application programming interface of OQMD) Saal et al. (2013b). The structures of the materials are transformed into reduced primitive cells to compare two lattices; all lattice parameters are compared. The internal coordinates of the structures are compared by examining all rotations allowed by each lattice and searching for rotations and translations to map the atoms of the same species into one another within a given level of tolerance. Here, any two structures in which the percent deviation in lattice parameters and angles smaller than 0.1 are considered identical. Further, we apply our designed orbital field matrix (OFM) (section III.13.1) to eliminate duplication. Two structures are considered to be the same if the norm of the difference in the OFM is less than . Note that two structures that have the same shape but are slightly different in size are considered identical. Finally, we obtain a dataset of the substituted crystal structures, which is denoted as , with 149 new nonoptimized Nd-Fe-B crystal structures. These structures are then performed structural optimization through first-principles calculations for obtaining the optimal structures.
| Formula | M | Host materials | OQMD id of host materials | |||
|---|---|---|---|---|---|---|
| (eV/atom) | ( eV/atom) | ( ()) | (Å) | |||
| Nd2FeB10 | -0.522 | -0.011 | 13.11 (0.050) | 0.038 | Ce2NiB10 | 2025052 Jeitschko (2000) |
| NdFe2B6 | -0.473 | 0.008 | 3.30 (0.040) | 0.150 | CeCr2B6 | 94775 Kuzma (1972) |
| Nd4FeB14 | -0.506 | 0.030 | 26.30 (0.063) | 0.069 | Ho4NiB14 | 2107958 Geupel et al. (2001) |
| NdFe2B2 | -0.343 | 0.046 | 4.41 (0.067) | 0.085 | DyCo2B2 | 1852452 Niihara et al. (1987) |
| NdFeB4 | -0.462 | 0.052 | 17.42 (0.073) | 0.041 | CeNiB4 | 2023354 Akselrud et al. (1984) |
| NdFeB4 | -0.455 | 0.060 | 18.73 (0.072) | 0.050 | CeCrB4 | 2023373 Kuzma et al. (1973) |
| Nd2Fe3B5 | -0.374 | 0.066 | 6.85 (0.055) | 0.143 | Eu2Os3B5 | 180411 Jung and Schweitzer (1986) |
| Nd2Fe5B4 | -0.284 | 0.069 | 10.31 (0.077) | 0.206 | Eu2Rh5B4 | 183842 Jung (1990a) |
| NdFe4B | -0.092 | 0.070 | 21.64 (0.134) | 1.769 | CeCo4B | 185365 Kuzma and Bilonizhko (1973a) |
| NdFe12B6 | -0.231 | 0.072 | 45.56 (0.117) | 1.012 | CeNi12B6 | 2077072 Akselrud et al. (1985) |
| Nd5Fe21B4 | -0.052 | 0.077 | 57.73 (0.140) | 2.342 | Nd5Co21B4 | 126928 Liang et al. (2001) |
| Nd5Fe19B6 | -0.115 | 0.080 | 50.02 (0.128) | 1.820 | Nd5Co19B6 | 125302 Liang et al. (2000) |
| NdFe4B | -0.081 | 0.081 | 65.19 (0.135) | 0.241 | NdNi4B | 2069928 Noel et al. (2003) |
| Nd3Fe13B2 | -0.027 | 0.081 | 36.12 (0.144) | 2.961 | Ce3Ni13B2 | 1778822 Kuzma (1981) |
| Nd3Fe11B4 | -0.131 | 0.085 | 28.22 (0.122) | 0.150 | Ce3Co11B4 | 1852403 Kuzma and Bilonizhko (1973b) |
| Nd2Fe3B6 | -0.375 | 0.088 | 16.02 (0.066) | 0.132 | Ce2Re3B6 | 1966804 Kuzma et al. (1989) |
| NdFe4B4 | -0.342 | 0.090 | 17.30 (0.048) | 0.140 | CeRu4B4 | 2074891 Poettgen et al. (2010) |
| NdFe2B2 | -0.297 | 0.092 | 7.25 (0.057) | 0.142 | CeIr2B2 | 180315 Jung (1991) |
| Nd3Fe8B6 | -0.249 | 0.094 | 16.06 (0.079) | 0.543 | Eu3Rh8B6 | 1771853 Jung (1990b) |
| Nd2Fe7B3 | -0.147 | 0.096 | 35.04 (0.116) | 0.209 | Ce2Co7B3 | 2016489 Kuzma and Bilonizhko (1974) |
II.2 2.2 Assessment of phase stability
First-principles calculations based on DFT Kohn and Sham (1965); Hohenberg and Kohn (1964) are one of the most effective calculation methods used in materials science. DFT calculations can accurately estimate the formation energy of materials, which is used to build phase diagrams for systems of interest. Hence, the phase stability of a material—in other words, the decomposition energy of a material (CH-distance)—is obtained via the convex-hull analysis of phase diagrams and the decomposition of the material into other phases. We use the formation energy obtained from OQMD Saal et al. (2013b); Kirklin et al. (2015) of to build phase diagrams and calculate the CH-distance. The CH-distance of a material is defined as follows:
| (1) |
where is the formation energy and is determined by projecting from the chemical composition position to an end point appearing on the convex hull facets. Details of the algorithm for finding these convex hull facets from hull points (see Barber et al. (1996); Saal et al. (2013b) for more information). Hereafter, we consider the CH distance as the degree of the phase stability of a material. A material that lies below or on the CH surface, , is a potentially formable material in nature, and a material associated with is unstable. A material associated with slightly above the CH surface is considered to be in a metastable phase.
Metastable phases are synthesized in numerous cases, for which we consider a reasonable range of the CH distance Balachandran et al. (2018). Referring to the prediction accuracy of formation energy ( 0.1 eV/atom by OQMD Saal et al. (2013b)), we define all materials with eV/atom as potentially formable structures and as unstable materials otherwise. Following this definition, can be divided into subsets and for potentially formable crystal structures and unstable crystal structures, respectively.
includes 35 Nd-Fe-B crystal structures, which can be used as references to construct the Nd-Fe-B phase diagram. Seven materials were found for ternary materials, which comprised Nd, Fe, and B. To verify the reliability of the dataset that used to construct phase diagram as well as the stability definition, we remove each tenary materials and use the remaining materials in to estimate its corresponding convex hull distance. Under this test, among the seven ternary crystal structures, there are two formable ternary materials, NdFe4B4 and Nd5Fe2B6, which lie on the surface of the CH of the phase diagram with . Additionally, one material, NdFe12B6, is potentially formable (metastable) with a stability of less than eV/atom, as shown in Table 6 in the Supplemental Materials. It should be noted that the important magnetic material, Nd2Fe14B, did not exist in the OQMD database at the time when we conducted this study. Based on the Nd-Fe-B phase diagram and the formation energy of -0.057 eV/atom calculated using DFT, the corresponding is eV/atom. This result implies that Nd2Fe14B is in the stable phase. To conclude, we confirm that the experimentally synthesized structures are all satisfy with the stability definition shown in this section.
We follow the computational settings of OQMD Saal et al. (2013b); Kirklin et al. (2015) for estimating the formation energy of the newly created Nd-Fe-B crystal structures in . The calculations were performed using the Vienna ab initio simulation package (VASP) Kresse and Hafner (1993, 1994); Kresse and Furthmuller (1996a, b) by utilizing projector-augmented wave method potentials (PAW) Blöchl (1994); Kresse and Joubert (1999) and the Perdew–Burke–Ernzerhof (PBE)Perdew et al. (1996) exchange-correlation functional.
We employ DFT+U for Fe, and all calculations are spin-polarized with the ferromagnetic alignment of the spins and with initial magnetic moments of 5, 0, and 0 for Fe, Nd, and B, respectively. For each newly created structure, we perform coarse optimization, fine optimization, and a single point calculation, following the ”coarse relax,” ”fine relax,” and ”standard” procedures of the OQMD. The k-grid for these calculation series is selected by the k-points per reciprocal atom (KPRA): 4000, 6000, and 8000 for ”coarse relax,” ”fine relax,” and ”standard,” respectively. We use a cutoff energy of 520 eV for all calculations. The total energies of the ”standard” calculations are used for the formation energy calculations, . The CH distance of a newly created structure can be estimated from .
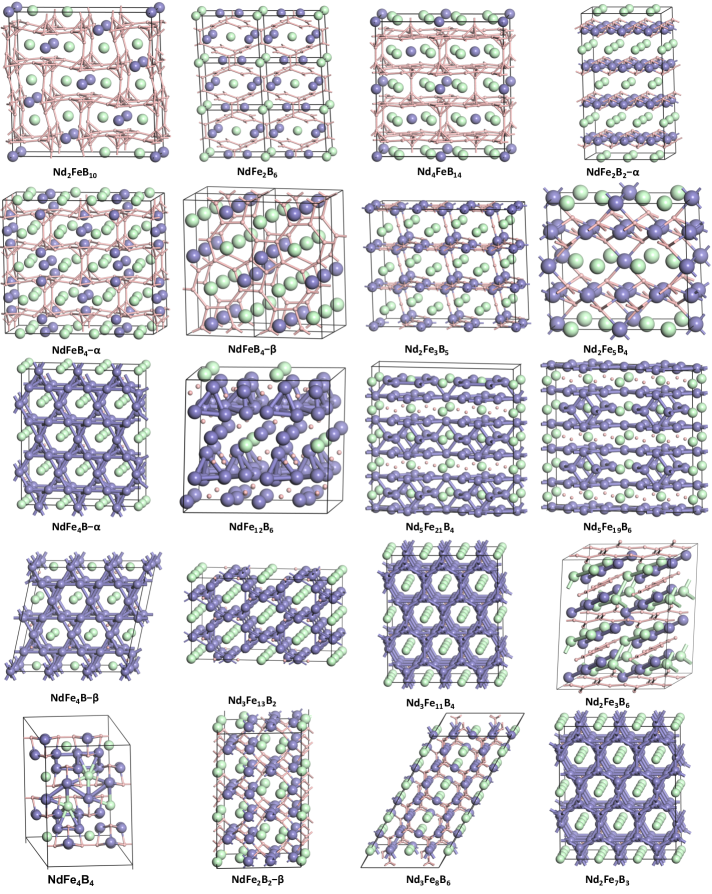
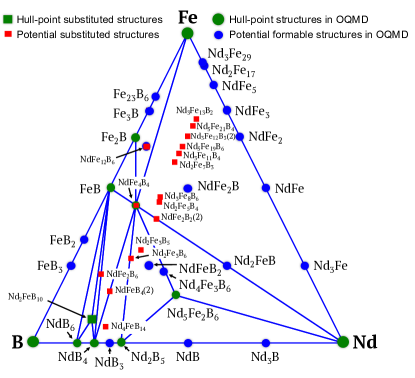
After calculating the formation energy, we finally found 20 new Nd-Fe-B crystal structures that are not in , in which the CH distance of the corresponding optimized structure is less than 0.1 eV. These structures originate from different host structures with different skeletons. Note that we found one structure, Nd2FeB10, with a stability of less than eV/atom. Thus, this structure is also used as a reference to construct the Nd-Fe-B phase diagram. Among the 20 new Nd-Fe-B structures, there are three pairs of discriminated structures sharing the same chemical compositions (NdFe2B2, NdFeB4 and NdFe4B). Details about these structures are described in Table 1. The phase diagram of the Nd-Fe-B materials, including the 20 new substituted structures, is shown in Figure 2.
We also calculate the magnetization of these materials. We use open-core approximation to treat the 4f electrons of Nd. The contribution of 4f electrons to the magnetization is . The magnetization is normalized to the volume of a unit cell:
| (2) |
where is the magnetization given by DFT and is the number of Nd atoms in the unit cell. All calculation results are summarized in Table 1.
II.3 2.3 Newly discovered Nd-Fe-B crystal structures
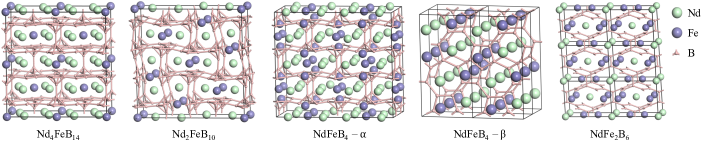
Figure 3 shows five specific crystal structures of the predicted formable crystal structures. A common characteristic of these crystal structures is that boron atoms form a network structure and Nd and Fe atoms are surrounded by the cages formed by the boron atom network. In the Nd4FeB14 crystal structure, these boron cages are arranged in parallel and Fe atoms are sandwiched between two halves of the boron atom octahedron. In the crystal structure of Nd2FeB10, which is confirmed by DFT calculations and selected as the hull point in the phase diagram, Nd and Fe atoms are trapped in the boron atom cages; however, these cages are arranged in herringbone patterns. Interestingly, two stable crystal structures of NdFeB4 were found as the proportion of Fe increased. One (NdFeB4 structure) was obtained by the elemental substitution of the original CeNiB4 (id 2023354 Akselrud et al. (1984)) crystal structure. This crystal structure is similar to the Nd4FeB14 crystal structure, with cages formed by boron networks that trap Nd and Fe atoms and are arranged in parallel. In contrast, in the other predicted crystal structure for NdFeB4 (NdFeB4 structure obtained by the elemental substitution of the CeCrB4 (id 2023373 Kuzma et al. (1973)) crystal structure), the boron atoms form a planar network structure that comprises heptagon–pentagon ring pairs. Another form of boron cage is found in NdFe2B6 crystal structure. All potentially formable crystal structures are shown in detail in the Supplemental Materials.
III 3. Mining structure–stability relationship of Nd-Fe-B crystal structures
III.1 3.1 Materials representation
We must convert the information regarding the materials into descriptor vectors. We employ the OFM Lam Pham et al. (2017); Pham et al. (2018) descriptor with a minor modification. The OFM descriptors are constructed using the weighted product of the one-hot vector representations, , of atoms. Each vector is filled with zeros, except those representing the electronic configuration of the valence electrons of the corresponding atom. The OFM of a local structure, named , is defined as follows:
| (3) |
where is the solid angle determined by the face of the Voronoi polyhedra between the central atom and the index neighboring atom; and is the maximum solid angle between the central atom and neighboring atoms. By removing the distance dependence in the original OFM formulation Lam Pham et al. (2017); Pham et al. (2018), we focus exclusively on the coordination of valence orbitals and the shape of the crystal structures. The mean over the local structure descriptors is used as the descriptor of the entire structure:
| (4) |
where is the structure index, and and are the local structure indices and the number of atoms in the unit cell of the structure , respectively.
Note that owing to the designed cross product between the atomic representation vectors of each atom, each element in the matrix represents the average number of atomic coordinates for a certain type of atom. For example, an element of a descriptor obtained by considering the product of the element of the center atom representation and the element of the environment atom representation, denoted as , shows an average coordination number of (Nd) sites surrounding all (Fe) sites. As the term appears at all descriptors for Fe, Nd, and B sites, the element represent the average coordination number of a given structure. All of these OFM elements provide a foundation for the intuitively interpretable investigation of the structure-stability relationship.
III.2 3.2 Mining of formation energy data of LA-T-X crystal structures with supervised learning method
We trained the ML models that can predict the formation energy of the crystal structures, , from , which is represented using the OFM descriptor and the corresponding known formation energy data. We applied kernel ridge regression (KRR)Murphy (2012), which is demonstrated to be useful for predicting material properties. In the KRR algorithm, the target variable, , is represented by a weighted kernel function as follows:
| (5) |
where is the predicted formation energy of crystal structure ; and are the representation vectors of crystal structures and based on the OFM descriptor, respectively; runs over all crystal structures in the training set; is Laplacian kernel function. Coefficients are estimated by minimizing the total square error regularized by the norm as follows: , with and as observed and predicted target values of the structure , respectively. We perform a ten-times ten-fold cross-validation process to determine parameters and in the KRR models. These parameters are selected by minimizing the mean absolute error (MAE) of the validation set.
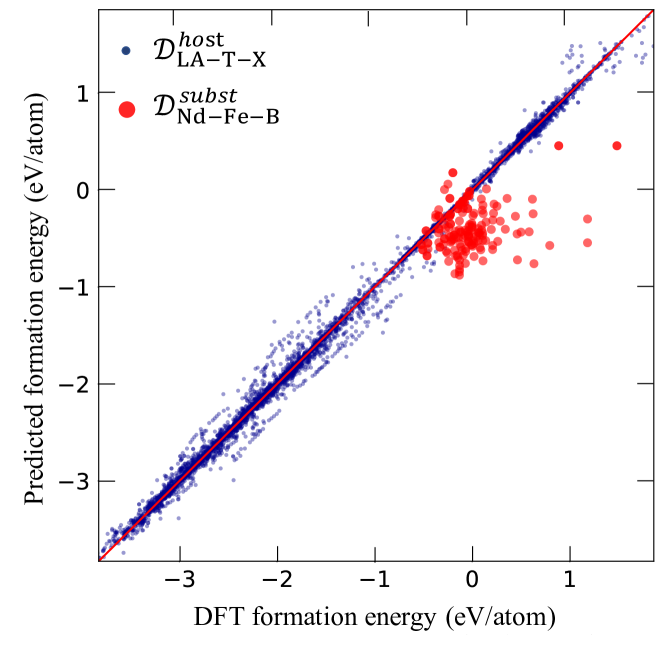
Figure 4 shows the ten-times ten-fold cross-validated comparison of the formation energies calculated using DFT and those predicted by the KRR model for the crystal structures in (blue circles). Figure 4 also shows a comparison of the formation energies calculated using DFT and those predicted using the KRR model (trained using all crystal structures in ) for the crystal structures in (red circles). In the cross-validated comparison of materials in , the formation energies predicted via KRR show good agreement with those calculated using DFT, with Kvalseth (1985) value of 0.990(1), table 2.
| Model | MAE (eV/atom) | RMSE (eV/atom) | |
|---|---|---|---|
| Kernel ridge | 0.990(1) | 0.094(2) | 0.137(1) |
It should be noted that this predictive model is learned from the data () containing only the optimized crystal structures. Thus, when applied to a newly generated nonoptimized crystal structure (in ), it is clear that the possibility of correctly predicting the formation energy is low. The MAE of the KRR-predicted formation energy of the crystal structures in after structure optimization is approximately 0.3 (eV/atom), which is three times larger than the cross-validated MAE result. The results of applying the KRR prediction model to estimate the stability of these hypothetical materials are shown in detail in section III.53.5.
III.3 3.3 Descriptor relevant analysis
Further, we focus on and evaluate the relevance Nguyen et al. (2019); Yu and Liu (2004); Visalakshi and Radha (2014) of each element in the OFM descriptor with respect to the formation energy of the crystal structure. We utilize the change in prediction accuracy when removing or adding a descriptor (from the full set of descriptors Nguyen et al. (2018) in the OFM) to search for the descriptors that are strongly relevant Nguyen et al. (2019); Dam et al. (2018) to the formation energy (i.e., CH distance and phase stability) of the Nd-Fe-B crystal structures.
In detail, for a given set of descriptors, we define the prediction capacity of by the maximum prediction accuracy that the KRR model can achieve by using the variables in a subset of as follows:
| (6) |
where is the value of the coefficient of determination Kvalseth (1985) achieved by the KRR using a set as the independent variables. is the subset of that yields the prediction model having the maximum prediction accuracy.
Let denote as set of descriptors after removing a descriptor from the full descriptor set ; }. A descriptor is strongly relevant if and only if:
| (7) |
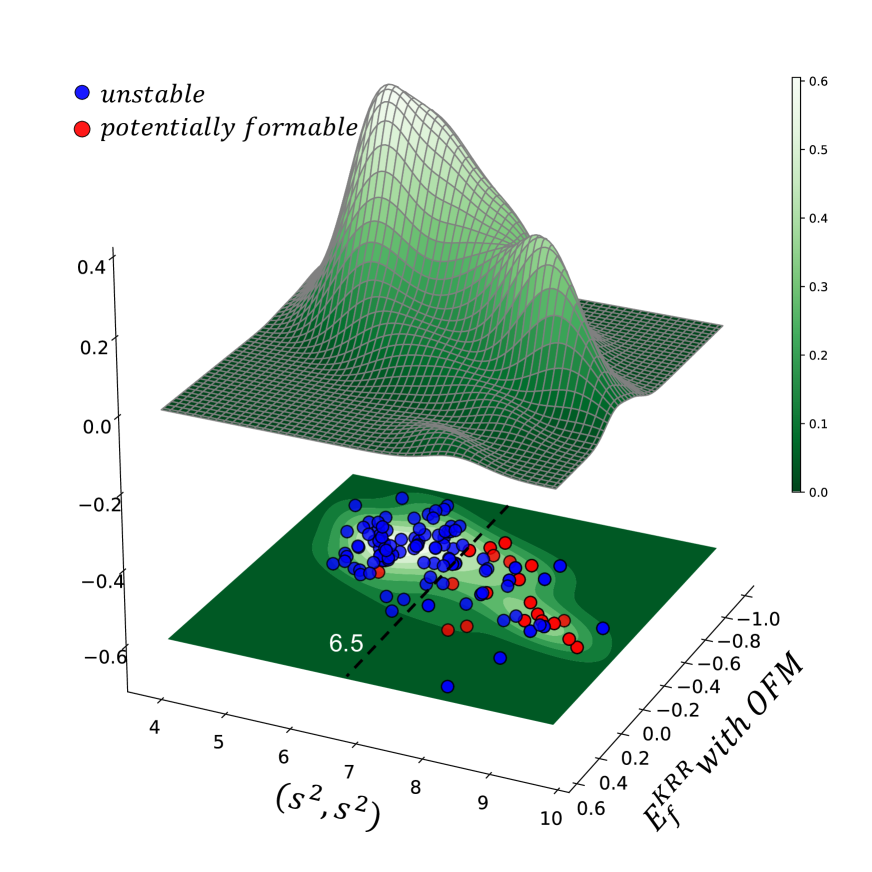
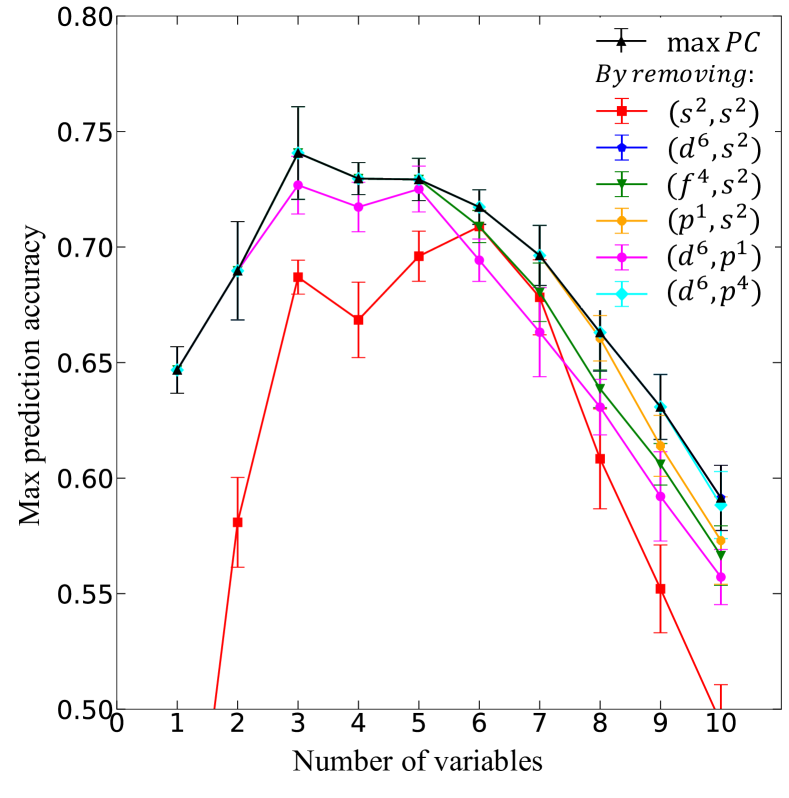
Figure 5 summarizes the results obtained from the descriptor relevance analysis. The black–triangled curve shows the dependence of the max prediction capacity (max , in score) on the number of variables–OFM descriptors that used in regression models. Other curves show the dependence of the max prediction capacity on the number of OFM that used in regression models when specific OFM is removed from whole set of OFM descriptors. For example, the orange–dot curve illustrates the max of the OFM descriptor set without appearance of descriptor. It is evident that the descriptor (red–square curve) is highly relevant to the prediction of the formation energy of the crystal structures in . For further investigation, we project all substituted crystal structures in into the space of the KRR-predicted formation energy, , and , as shown in Figure 6. One can easily deduce that the distribution of is a mixture of two distribution components. The larger distribution component is located in the region , whereas the other is located in the region . We infer the existence of two distinct groups of substituted crystal structures. The first group contains structures with average atomic coordination numbers lower than 6.5, and the second group contains structures with average atomic coordination numbers higher than 6.5. Further, most newly discovered potentially formable crystal structures belong to the second group.
III.4 3.4 Mining of substituted Nd-Fe-B crystal structure data with unsupervised learning method
In this section, we demonstrate the use of the proposed generative model, which applies the relevance analysis results and unsupervised learning, in contrast to the conventional supervised learning approach. As a result, this model performs detailed investigations at particular sites whose coordination numbers are highly correlated to the structure–stability relationship.
The underlying hypothesis of this approach is that there are various correlation patterns between crystal structure properties and their formation energies. Naturally, most of these patterns are for unstable crystal structures and only a few of these pertain to potentially formable crystal structures. These patterns might not be exposed directly through feature relevance analysis method due to the multivariate correlation between the target and predicting variables. The strong relevant descriptor can appear as an extracted pattern to indicate the correlation between the structure–stability relationship. As the term appears at all descriptors for Fe, Nd, and B sites, indicates only the average atomic coordination numbers, which do not precisely represent the coordination number of any particular site. On the contrary, other OFM descriptors are designed to explicitly represent the coordination number of all pairwise elements. As the two terms and appears at only descriptors for Fe or Nd, respectively. Therefore, to investigate the average coordination number of the Fe, Nd, and B sites, in addition to , we focus on the values of the descriptors , . These descriptors represent the average atomic coordination numbers of Fe sites and Nd sites. Further, we also focus on the values of the OFM descriptors , , , and . These descriptors represent the average number of Fe sites surrounding the Fe sites, Nd sites surrounding the Fe sites, Fe sites surrounding the Nd sites, and Nd sites surrounding the Nd sites. These OFM descriptors are useful in discussing not only the structure–stability relationship but also the strength of magnetic exchange couplings between the 3 orbitals of Fe and the 4 orbitals of Nd.
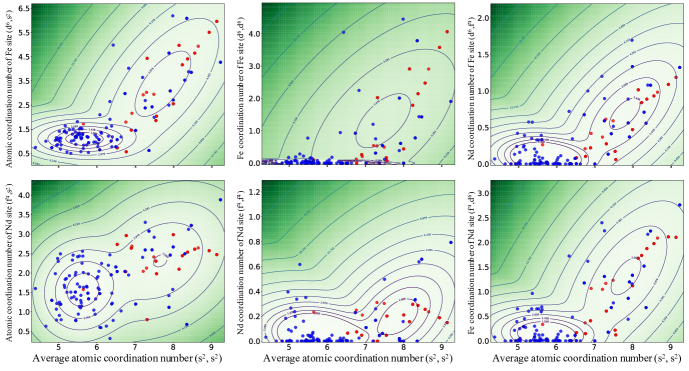
Figure 7 shows the density distribution of the newly created crystal structures, , in two-dimensional space using the selected descriptors. For all pairs of descriptor, the density distribution is similar to the distribution of and shown in Figure 6 with two clear peaks, one large and one small, with slight overlap. This result again confirms that is highly relevant for expressing the nature of distribution of the newly created crystal structures. In addition, and are important for identifying the characteristics of the distribution. It should be noted that, these features could not be exposed by using feature relevance analysis since the prediction model can utilize the information from other highly correlated feature instead e.g. . In contrast, the average coordination number of the Nd sites and the average coordination number of the Nd sites around the Nd sites have a weak relationship with the characteristics related to the distribution of these crystal structures. These results indicate that the average coordination number of the Fe sites and the average coordination number of the Fe sites around the Fe sites are extremely important for characterizing the newly created Nd-Fe-B crystal structures.
We employ a GMM Murphy (2012) for learning the patterns of crystal structures by clustering into groups. The GMM model is based on the assumptions that the data consist of different groups and the data in each group follow their own Gaussian distribution. In other words, in the GMM, the distribution of data is fitted to a combination of a certain number, , of Gaussian functions Murphy (2012) with represents for the number of data groups. The probability distribution of a crystal structure with index , represented using selected descriptors, and , can be approximated as follows:
| (8) |
where
| (9) |
is a multivariate Gaussian distribution with mean and covariance matrix and is the dimension of representation vector . Coefficients are the weights that satisfy the following constraint:
| (10) |
The probability that belongs to group can be represented as follows:
| (11) |
The model parameters, , are determined using an expectation-maximization algorithm Pedregosa et al. (2011). The number of data groups, , is fixed at two in this study. It is interesting to note that the GMM provides a ”probabilistic image” of the pattern of the crystal structures, wherein it provides the probability of a crystal structure remaining in a group instead of assigning the crystal structures to a specific group. The sum of the probabilities of crystal structures remaining in either of the groups is 1. Therefore, the GMM is expected to discover distinctive patterns of crystal structures from the data and calculate the probability that a crystal structure belongs to a group.
We can label the newly generated crystal structures by fitting the data to the GMM with two Gaussian distributions and calculating the probabilities of the crystal structures belonging to each group. Given that it is not easy to find a new potential formable crystal structure, we suppose that most newly generated structures are unstable and only a few are potential formable. Therefore, we infer that the large Gauss component corresponds to the distribution of unstable crystal structures and the small Gauss component corresponds to the distribution of potential formable crystal structures. This hypothesis can be verified through comparison with the results of the DFT calculations, and it can be seen that most of the potential formable crystal structures confirmed by the DFT calculation actually belong to the small Gauss component. This implies that the phase stabilities of the Nd-Fe-B crystals are not significantly related to the coordination number of the Nd sites but are largely determined by the coordination number of the Fe sites. This suggests that if the Nd sites can be replaced partly by Fe, the crystal structure characteristics of Nd-Fe-B that are directly related to its phase stability can be controlled. Further application of this discovery in the design of Nd-Fe-B crystal materials is promising.
| Model | |||
|---|---|---|---|
| KRR model | 0.533 | 0.534 | 0.376 |
| LG-model | 0.629 | 0.687 | 0.599 |
| DT-model | 0.704 | 0.676 | 0.687 |
| GMM | 0.729 | 0.821 | 0.735 |
. KRR LG DT GMM KRRGMM LGGMM DTGMM KRR GMM LG GMM DT GMM Precision 0.24 0.35 0.56 0.49 0.24 0.36 0.48 0.58 0.53 0.58 Recall 0.82 0.79 0.45 0.91 0.97 1.0 0.91 0.76 0.7 0.45 0.37 0.49 0.5 0.64 0.39 0.53 0.63 0.66 0.61 0.51
| KRR | LG | DT | GMM | KRRGMM | LGGMM | DTGMM | KRR GMM | LG GMM | DT GMM | |
| Precision | 0.83 | 0.91 | 0.85 | 0.97 | 0.94 | 1.0 | 0.97 | 0.92 | 0.91 | 0.85 |
| Recall | 0.25 | 0.59 | 0.90 | 0.73 | 0.14 | 0.49 | 0.72 | 0.84 | 0.83 | 0.91 |
| 0.38 | 0.71 | 0.87 | 0.83 | 0.24 | 0.66 | 0.83 | 0.88 | 0.86 | 0.88 |
III.5 3.5 Learning prediction models for phase stability of crystal structures
A large number of ML applications reported until now (in materials science research) state the effectiveness and applicability of ML methods using statistical tests (such as cross validation). However, statistical tests are methods for assessing the risk in predicting the physical properties of the most optimized structure materials, and are they not appropriate for predicting and discovering novel materials. Therefore, in this study, to verify whether ML techniques are effective in searching for new potentially formable Nd-Fe-B crystal structures, we train three supervised ML models from and one unsupervised model from . Additionally, we test if the models can predict the stability of the newly created crystal structures in . The three supervised ML models are trained by considering 5967 materials in with the OFM descriptor and the stability target values described in sections 3.1 and 2.2. Then, all models are applied to predict the 149 newly hypothetical structures in while considering the stability calculated by the DFT as references in prediction accuracy evaluation.
In the first model (KRR model), the CH-distance is calculated using the formation energy predicted by the KRR model described in section 3.2. Then, we apply a threshold of 0.1 eV/atom to the obtained CH-distance to determine whether the crystal structure is potentially formable. It is worth noting again that the bottleneck of this method is that the formation energy prediction model is learned from data containing only the optimal crystal structures. Therefore, formation energy is not predicted correctly when the method is applied to a newly created nonoptimal crystal structure.
The second model is a logistic regression model (LG-model). From the two subsets of , including the potentially formable () and unstable () crystal structures, we model the probability of observing potentially formable () and unstable () class labels directly using classification models. We hypothesize the probability of observing potentially formable materials, , as follows:
| (12) |
where is the description vector of structure (obtained by flattening the OFM), is the index of vector elements in , and is the coefficient of the corresponding element, . In our experiments, all coefficients, , are obtained via maximum a posteriori estimation using as the regularization term Ng (2004); Lee et al. (2006). The third model is the decision tree model (DT-model) Murphy (2012), which uses information gain Breiman et al. (1984); Hastie et al. (2009) as the criterion to measure the quality of tree splitting.
The unsupervised model is based on the observations of the mixture distribution of the newly created crystal structures, . We build the fourth model (GMM) by assuming that the obtained major and minor Gauss components correspond to the ”unstable” and ”potentially formable” class labels of the crystal structures, respectively.
The evaluation results of the four models are summarized in Table 3. We use three evaluation scores: , , and . The score (also referred to as positive predictive value) with respect to the unstable structure class is the fraction of the unstable crystal structures that are predicted correctly among the number of crystal structures that are predicted to be unstablePerry et al. (1955). The score (also known as sensitivity) with respect to the unstable structure class is the fraction of the unstable crystal structures that are predicted correctly among all crystal structures that are actually unstablePerry et al. (1955). The and scores are combined in the score (or f-measure) to provide a single measurementDerczynski (2016). To compare the classification ability of ML models, we summarize the evaluation scores of all classes (i.e., ”unstable” and ”potentially formable”) by utilizing a macro averaging methodSu et al. (2015), which is implemented in Pedregosa et al. (2011) version 0.21.3.
The KRR model shows the lowest values of all evaluation scores among the three supervised learning models with , and are 0.533, 0.534 and 0.376, respectively. In contrast, the DT-model provides the most accurate prediction. This model accurately predicts the potentially formable-unstable label of all substituted Nd-Fe-B crystal structures with 0.704 macro score and obtains macro and scores of 0.676 and 0.687, respectively. The LG-model shows the highest macro score, 0.687, compared with the other two supervised learning models.
The final but most surprising result is that the unsupervised GMM is superior to the other three supervised learning models in all three evaluation scores. The average and scores of the GMM are 0.729 and 0.821, respectively, which are significantly higher than those of the three supervised learning models. This result shows that the integration of descriptor relevance analysis and unsupervised learning with the GMM is superior to conventional ML models, such as KRR, LG, and DT, for obtaining information about the phase stability of the substituted Nd-Fe-B crystal structures. We also investigate the usefulness of ensembling models. As the prediction problem under consideration is a binary classification, we implement two well-known operators, ”AND” and ”OR,” for combining classification results. The details of the results are shown in Tables 5 and 5. These results again suggest that the structure–stability relationship obtained using data mining is highly promising for the design of Nd-Fe-B materials.
IV 4. Conclusion
We focus on discovering new Nd-Fe-B materials using the elemental substitution method with LA-T-X compounds—lanthanide, transition metal, and light element (X = B, C, N, O)—as host materials. For each host crystal structure, a substituted crystal structure is created by substituting all lanthanide sites with Nd, all transition metal sites with Fe, and all light element sites with B. High-throughput first-principles calculations are applied to evaluate the phase stability of the newly created crystal structures, and twenty of them are found to be potential formable. We implemented an approach by incorporating supervised and unsupervised learning techniques to estimate the stability and analyze the relationship between the structure and stability of the newly created Nd-Fe-B crystal structures. Three supervised learning models (KRR, LG, and DT models) learned from LA-T-X host crystal structures achieve the maximum accuracy and recall scores of and , respectively, in predicting the stability state of the new substituted Nd-Fe-B crystals. The proposed unsupervised learning model resulting from the integration of descriptor-relevance analysis and the GMM provides accuracy and recall scores of and , respectively, which are significantly better than those of the supervised models. Moreover, the unsupervised learning model can capture and interpret the structure–stability relationship of the Nd-Fe-B crystal structures. The average atomic coordination number and the coordination number of the Fe sites are quantitatively shown to be the most important factors in determining the phase stability of the new substituted Nd-Fe-B crystal structures.
acknowledgments
Acknowledgements.
This work is supported by the Precursory Research for Embryonic Science and Technology from the Japan Science and Technology Agency (JST), ESICMM Grant Number 12016013 (ESICMM is funded by Ministry of Education, Culture, Sports, Science and Technology (MEXT)), JSPS KAKENHI Grants Number 20K05301 and Number JP19H05815 (Grant-in-Aid for Scientific Research on Innovative Areas “Interface Ionics”), Materials Research by Information Integration Initiative (MI2I) project of the Support Program for Starting Up Innovation Hub from JST, and MEXT as a social and scientific priority issue employing the post-K computer (creation of new functional devices and high-performance materials to support next-generation industries; CDMSI).References
- Butler et al. (2018) K. T. Butler, D. W. Davies, H. Cartwright, O. Isayev, and A. Walsh, Nature 559, 547 (2018).
- Curtarolo et al. (2013) S. Curtarolo, G. L. W. Hart, M. B. Nardelli, N. Mingo, S. Sanvito, and O. Levy, Nature Materials 12, 191 EP (2013).
- Saal et al. (2013a) J. E. Saal, S. Kirklin, M. Aykol, B. Meredig, and C. Wolverton, JOM 65, 1501 (2013a).
- Korner et al. (2016) W. Korner, G. Krugel, and C. Elsasser, Scientific Reports 6 (2016), doi:10.1038/srep24686.
- Korner et al. (2018) W. Korner, G. Krugel, D. F. Urban, and C. Elsasser, Scripta Materialia 154, 295 (2018).
- Ma et al. (2017) J. Ma, V. I. Hegde, K. Munira, Y. Xie, S. Keshavarz, D. T. Mildebrath, C. Wolverton, A. W. Ghosh, and W. H. Butler, Phys. Rev. B 95, 024411 (2017).
- He et al. (2018) J. He, S. S. Naghavi, V. I. Hegde, M. Amsler, and C. Wolverton, Chemistry of Materials 30, 4978 (2018), https://doi.org/10.1021/acs.chemmater.8b01096 .
- Balluff et al. (2017) J. Balluff, K. Diekmann, G. Reiss, and M. Meinert, Phys. Rev. Materials 1, 034404 (2017).
- Yang et al. (2012) K. Yang, W. Setyawan, S. Wang, M. Buongiorno Nardelli, and S. Curtarolo, Nature Materials 11, 614 (2012).
- Li et al. (2018) X. Li, Z. Zhang, Y. Yao, and H. Zhang, 2D Materials 5, 045023 (2018).
- Emery et al. (2016) A. A. Emery, J. E. Saal, S. Kirklin, V. I. Hegde, and C. Wolverton, Chemistry of Materials 28, 5621 (2016), https://doi.org/10.1021/acs.chemmater.6b01182 .
- Michalsky and Steinfeld (2017) R. Michalsky and A. Steinfeld, Catalysis Today 286, 124 (2017), nitrogen Activation.
- Aykol et al. (2016) M. Aykol, S. Kim, V. I. Hegde, D. Snydacker, Z. Lu, S. Hao, S. Kirklin, D. Morgan, and C. Wolverton, Nature Communications 7, 13779 (2016).
- Ashton et al. (2016) M. Ashton, R. G. Hennig, S. R. Broderick, K. Rajan, and S. B. Sinnott, Phys. Rev. B 94, 054116 (2016).
- Moller et al. (2018) J. J. Moller, W. Korner, G. Krugel, D. F. Urban, and C. Elsasser, Acta Materialia 153, 53 (2018).
- Kim et al. (2018) K. Kim, L. Ward, J. He, A. Krishna, A. Agrawal, and C. Wolverton, Phys. Rev. Materials 2, 123801 (2018).
- Ulissi et al. (2017) Z. W. Ulissi, M. T. Tang, J. Xiao, X. Liu, D. A. Torelli, M. Karamad, K. Cummins, C. Hahn, N. S. Lewis, T. F. Jaramillo, K. Chan, and J. K. Nørskov, ACS Catalysis 7, 6600 (2017).
- Xue et al. (2016a) D. Xue, P. V. Balachandran, R. Yuan, T. Hu, X. Qian, E. R. Dougherty, and T. Lookman, Proceedings of the National Academy of Sciences 113, 13301 (2016a), https://www.pnas.org/content/113/47/13301.full.pdf .
- Mannodi-Kanakkithodi et al. (2016) A. Mannodi-Kanakkithodi, G. Pilania, T. D. Huan, T. Lookman, and R. Ramprasad, Scientific Reports , 20952 EP (2016).
- Pilania et al. (2016) G. Pilania, P. V. Balachandran, C. Kim, and T. Lookman, Frontiers in Materials 3, 19 (2016).
- Xue et al. (2016b) D. Xue, P. V. Balachandran, J. Hogden, J. Theiler, D. Xue, and T. Lookman, Nature Communications 7, 11241 (2016b).
- Yamashita et al. (2018) T. Yamashita, N. Sato, H. Kino, T. Miyake, K. Tsuda, and T. Oguchi, Phys. Rev. Materials 2, 013803 (2018).
- Pickard and Needs (2011) C. J. Pickard and R. J. Needs, Journal of Physics: Condensed Matter 23, 053201 (2011).
- Pickard and Needs (2006) C. J. Pickard and R. J. Needs, Phys. Rev. Lett. 97, 045504 (2006).
- Pickard and Needs (2007) C. J. Pickard and R. J. Needs, Nature Physics 3 (2007).
- Wang et al. (2010) Y. Wang, J. Lv, L. Zhu, and Y. Ma, Phys. Rev. B 82, 094116 (2010).
- Zhang et al. (2017) Y. Zhang, H. Wang, Y. Wang, L. Zhang, and Y. Ma, Phys. Rev. X 7, 011017 (2017).
- Glass et al. (2006) C. W. Glass, A. R. Oganov, and N. Hansen, Computer Physics Communications 175, 713 (2006).
- Oganov et al. (2011) A. R. Oganov, A. O. Lyakhov, and M. Valle, Accounts of Chemical Research 44, 227 (2011).
- usp (2013) Computer Physics Communications 184, 1172 (2013).
- Lonie and Zurek (2011) D. C. Lonie and E. Zurek, Computer Physics Communications 182, 372 (2011).
- Noh et al. (2019) J. Noh, J. Kim, H. S. Stein, B. Sanchez-Lengeling, J. M. Gregoire, A. Aspuru-Guzik, and Y. Jung, Matter (2019), https://doi.org/10.1016/j.matt.2019.08.017.
- Ryan et al. (2018) K. Ryan, J. Lengyel, and M. Shatruk, Journal of the American Chemical Society 140, 10158 (2018).
- Saal et al. (2013b) J. E. Saal, S. Kirklin, M. Aykol, B. Meredig, and C. Wolverton, JOM 65, 1501 (2013b).
- Jeitschko (2000) H. R. K. T. H. K. L. A. Jeitschko, W., Journal of Solid State Chemistry 154 (2000).
- Kuzma (1972) S. S. Kuzma, Yu.b., Kristallografiya 17 (1972).
- Geupel et al. (2001) S. Geupel, G. Zahn, P. Paufler, and G. Graw, Zeitschrift fuer Kristallographie - New Crystal Structures 216 (2001).
- Niihara et al. (1987) K. Niihara, S. Yajima, and T. Shishido, Journal of the Less-Common Metals 135 (1987).
- Akselrud et al. (1984) L. Akselrud, Y. Kuzma, V. Pecharskii, and N. Bilonizhko, Soviet Physics, Crystallography 29 (1984).
- Kuzma et al. (1973) Y. Kuzma, S. Svarichevskaya, and V. Fomenko, Inorganic Materials (USSR), see: Izv.Akad.Nauk, Neorg.Mater. 9 (1973).
- Jung and Schweitzer (1986) W. Jung and K. Schweitzer, Zeitschrift fuer Anorganische und Allgemeine Chemie 533 (1986).
- Jung (1990a) W. Jung, Journal of the Less-Common Metals 161 (1990a).
- Kuzma and Bilonizhko (1973a) Y. Kuzma and N. Bilonizhko, Kristallografiya 18 (1973a).
- Akselrud et al. (1985) L. Akselrud, Y. Kuzma, and V. Bruskov, Dopovidi Akademii Nauk Ukrainskoi RSR, Seriya B: Geologichni, Khimichni ta Biologichni Nauki (1985).
- Liang et al. (2001) J.-k. Liang, G.-h. Rao, W. Chu, and L. G.-y. Yang, H.f., Journal of Applied Physics 90 (2001).
- Liang et al. (2000) J.-k. Liang, X.-l. Chen, G.-h. Rao, Y. Chen, Q. Liu, B.-g. Shen, X. Li, L. Jin, and M. Wang, Chemistry of Materials 12 (2000).
- Noel et al. (2003) H. Noel, M. Potel, S. Godart, C., C. O.l., Mazumdar, E. Alleno, and P. Salamakha, Journal of Alloys Compd. 351 (2003).
- Kuzma (1981) B. N. Kuzma, Yu.b., Dopovidi Akademii Nauk Ukrainskoi RSR, Seriya A: Fiziko-Matematichni Ta Tekhnichni Nauki 43 (1981).
- Kuzma and Bilonizhko (1973b) Y. Kuzma and N. Bilonizhko, Soviet Physics, Crystallography 18 (1973b).
- Kuzma et al. (1989) Y. Kuzma, S. Mikhalenko, and N. Chaban, Soviet powder metallurgy and metal ceramics 28 (1989).
- Poettgen et al. (2010) R. Poettgen, E. Matar, S.f., and T. M., Mishra, Zeitschrift fuer Anorganische und Allgemeine Chemie 636 (2010).
- Jung (1991) W. Jung, Journal of the Less-Common Metals 171 (1991).
- Jung (1990b) W. Jung, Journal of the Less-Common Metals 161 (1990b).
- Kuzma and Bilonizhko (1974) Y. Kuzma and N. Bilonizhko, Izvestiya Akademii Nauk SSSR, Neorganicheskie Materialy 10 (1974).
- Kohn and Sham (1965) W. Kohn and L. J. Sham, Phys. Rev. 140, A1133 (1965).
- Hohenberg and Kohn (1964) P. Hohenberg and W. Kohn, Phys. Rev. 136, B864 (1964).
- Kirklin et al. (2015) S. Kirklin, J. E. Saal, B. Meredig, A. Thompson, J. W. Doak, M. Aykol, S. Rühl, and C. Wolverton, Npj Computational Materials 1, 15010 EP (2015).
- Barber et al. (1996) C. B. Barber, D. P. Dobkin, and H. Huhdanpaa, ACM Trans. Math. Softw. 22, 469–483 (1996).
- Balachandran et al. (2018) P. V. Balachandran, A. A. Emery, J. E. Gubernatis, T. Lookman, C. Wolverton, and A. Zunger, Phys. Rev. Materials 2, 043802 (2018).
- Kresse and Hafner (1993) G. Kresse and J. Hafner, Phys. Rev. B 47, 558 (1993).
- Kresse and Hafner (1994) G. Kresse and J. Hafner, Phys. Rev. B 49, 14251 (1994).
- Kresse and Furthmuller (1996a) G. Kresse and J. Furthmuller, Comput. Mat. Sci. 6, 15 (1996a).
- Kresse and Furthmuller (1996b) G. Kresse and J. Furthmuller, Phys. Rev. B 54, 11169 (1996b).
- Blöchl (1994) P. E. Blöchl, Phys. Rev. B 50, 17953 (1994).
- Kresse and Joubert (1999) G. Kresse and D. Joubert, Phys. Rev. B 59, 1758 (1999).
- Perdew et al. (1996) J. P. Perdew, K. Burke, and M. Ernzerhof, Phys. Rev. Lett 77, 3865 (1996).
- Lam Pham et al. (2017) T. Lam Pham, H. Kino, K. Terakura, T. Miyake, K. Tsuda, I. Takigawa, and H. Chi Dam, Sci Technol Adv Mater 18, 756 (2017).
- Pham et al. (2018) T.-L. Pham, N.-D. Nguyen, V.-D. Nguyen, H. Kino, T. Miyake, and H.-C. Dam, The Journal of Chemical Physics 148, 204106 (2018).
- Murphy (2012) K. P. Murphy, “Machine learning: A probabilistic perspective,” (MIT Press, 2012).
- Kvalseth (1985) T. O. Kvalseth, The American Statistician 39 (1985).
- Nguyen et al. (2019) D.-N. Nguyen, T.-L. Pham, V.-C. Nguyen, A.-T. Nguyen, H. Kino, T. Miyake, and H.-C. Dam, Journal of Physics: Conference Series 1290, 012009 (2019).
- Yu and Liu (2004) L. Yu and H. Liu, J. Mach. Learn. Res. 5, 1205 (2004).
- Visalakshi and Radha (2014) S. Visalakshi and V. Radha (2014) pp. 1–6.
- Nguyen et al. (2018) D.-N. Nguyen, T.-L. Pham, V.-C. Nguyen, T.-D. Ho, T. Tran, K. Takahashi, and H.-C. Dam, IUCrJ 5, 830 (2018).
- Dam et al. (2018) H. C. Dam, V. C. Nguyen, T. L. Pham, A. T. Nguyen, K. Terakura, T. Miyake, and H. Kino, Journal of the Physical Society of Japan 87, 113801 (2018), https://doi.org/10.7566/JPSJ.87.113801 .
- Pedregosa et al. (2011) F. Pedregosa, G. Varoquaux, A. Gramfort, V. Michel, B. Thirion, O. Grisel, M. Blondel, P. Prettenhofer, R. Weiss, V. Dubourg, J. Vanderplas, A. Passos, D. Cournapeau, M. Brucher, M. Perrot, and E. Duchesnay, J Mach Learn Res 12, 2825 (2011).
- Ng (2004) A. Y. Ng, International Conference on Machine Learning (2004).
- Lee et al. (2006) S.-I. Lee, H. Lee, P. Abbeel, and A. Y. Ng, Proceedings of the 21st National Conference on Artificial Intelligence (AAAI-06) 21 (2006).
- Breiman et al. (1984) L. Breiman, J. Friedman, C. Stone, and R. Olshen, Wadsworth, Belmont (1984).
- Hastie et al. (2009) T. Hastie, R. Tibshirani, and J. H. Friedman, Springer series in statistics (2009).
- Perry et al. (1955) J. W. Perry, A. Kent, and M. M. Berry, American Documentation 6, 242 (1955), https://onlinelibrary.wiley.com/doi/pdf/10.1002/asi.5090060411 .
- Derczynski (2016) L. Derczynski, Proceedings of the International Conference on Language Resources and Evaluation (2016).
- Su et al. (2015) W. Su, Y. Yuan, and M. Zhu, Proceedings of the 2015 International Conference on The Theory of Information Retrieval ICTIR ’15, 349 (2015).
V Supplemental Materials
| Compound | (eV/atom) | (eV/atom) | Stability state |
|---|---|---|---|
| NdFe4B4 | -0.432 | 0.000 | Potentially formable |
| Nd5Fe2B6 | -0.390 | 0.000 | Potentially formable |
| NdFe12B6 | -0.281 | 0.022 | Potentially formable |
| Nd4Fe3B6 | -0.286 | 0.118 | Unstable |
| Nd2FeB | 0.446 | 0.689 | Unstable |
| NdFe2B | 0.775 | 1.018 | Unstable |
| NdFeB2 | 0.714 | 1.145 | Unstable |