Boron cage effects on Nd-Fe-B crystal structure’s stability
Abstract
In this study, we investigate the structure-stability relationship of hypothetical Nd-Fe-B crystal structures using descriptor-relevance analysis and the t-SNE dimensionality reduction method. 149 hypothetical Nd-Fe-B crystal structures are generated from 5967 LA-T-X host structures in Open Quantum Materials Database by using elemental substitution method, with LA denoting lanthanides, T denoting transition metals, and X denoting light elements such as B, C, N and O. By borrowing the skeletal structure of each of the host materials, a hypothetical crystal structure is created by substituting all lanthanide sites with Nd, all transition metal sites with Fe, and all light element sites with B. High-throughput first-principle calculations are applied to evaluate the phase stability of these structures. Twenty of them are found to be potentially formable. As the first investigative result, the descriptor-relevance analysis on the orbital field matrix (OFM) materials’ descriptor reveals the average atomic coordination number as the essential factor in determining the structure stability of these substituted Nd-Fe-B crystal structures. 19 among 20 hypothetical structures that are found potentially formable have an average coordination number larger than 6.5. By applying the t-SNE dimensionality reduction method, all the local structures represented by the OFM descriptors are integrated into a visible space to study the detailed correlation between their characteristics and the stability of the crystal structure to which they belong. We discover that unstable substituted structures frequently carry Nd and Fe local structures with two prominent points: low average coordination numbers and fully occupied B neighboring atoms. Moreover, there are only three popular forms of B local structures appearing on all potentially formable substituted structures: cage networks, planar networks, and interstitial sites. The discovered relationships are promising to speed up the screening process for the new formable crystal structures.
I 1. Introduction
There is a recurring and crucial demand for naturally-sourced and formable materials. The discovery of these stable structures attracts significant attention from various fields. The field of material screening is widely spread from Heusler structures Ma et al. (2017) and rare-earth magnetic structures Korner et al. (2016, 2018); He et al. (2018); Balluff et al. (2017) to the perovskite structure family Emery et al. (2016); Michalsky and Steinfeld (2017) or topological insulator structures Yang et al. (2012); Li et al. (2018). The major challenge in the discovery of these materials stems from the countless number of hypothetical structures, with only a few likely to be formable. A common hypothesis is that there is a hidden feature or features that cause the instability in the structures. By obtaining these stability-driven features, researchers may inexpensively predict Oganov et al. (2019) the stability of newly hypothetical structures and narrow down the area of research thereafter. There are several essential steps for mining these hidden features: (1) generating hypothetical structures along with a reliable stability estimation, (2) modeling the geometrical information of these hypothetical structures using interpretable representation, and (3) building an objective function to analyze the correlations between the geometrical information and the stability.
As a real example, we consider the geometry of permanent magnets. The current strongest permanent magnet is Nd-Fe-B based magnet, whose the main phase is Nd2Fe14B. Before the Nd-Fe-B magnet was invented by Sagawa et al. in the early 1980s Sagawa et al. (1984); Hirosawa et al. (1986), the strongest magnet was the Sm2Co17 magnet. Due to the need to use iron instead of cobalt, extensive research was conducted in the late 1970s to develop iron-based strong magnets. A potential candidate material was Sm2Fe17, or more generally R2Fe17 with R denoting the earth element. However, the Curie temperature of R2Fe17 is too low to be utilized as a strong magnet at room temperature. The idea of Sagawa et al. was to add a light element to R2Fe17 to enhance ferromagnetism by the magneto-volume effect. Boron was chosen as the light element, which leads to the successful development of a strong magnet. Contrary to Sagawa’s expectation, however, the main phase of the newly developed strong magnet was not Nd2Fe17Bx, but the famous Nd2Fe14B with a completely different crystal structure. This is a good example of the importance of understanding structure for developing novel materials Tatetsu et al. (2018).
In this research, we investigate the structure–stability relationship hidden in the screening results of Nd-Fe-B hypothetical structures. Firstly, we collect all possible LA-T-X crystal structures with lanthanides (LA), transition metals (T), and light elements X = B, C, N, and O from Open Quantum Materials Database Saal et al. (2013). By sharing the same elemental type with Nd-Fe-B structure family, we assume that a number of geometrical skeletons of the LA-T-X crystal structures can be shareable through Nd-Fe-B structures. Therefore, a hypothetical crystal structure of is created by applying the atomic substitution method to the LA-T-X crystal structures. We replace all lanthanide sites with Nd, all transition metal sites with Fe, and all light element sites with B to create new hypothetical crystal structures (section 2.1). By performing first-principle calculation, we estimate the phase stability (hereinafter referred to as stability) of all these hypothetical structures (section II.22.2). In investigating the role of Machine Learning, new hypothetical structures are first represented using the orbital field matrix (OFM) representation vector. (section 3.1) Relevance analysis is performed to extract the hidden structural descriptors that are essential for determining the stability of the generated Nd-Fe-B crystal structures (section 3.2). Finally, we perform t-SNE dimensionality reduction method over Nd-based, Fe-based, and B-based local structures to extract correlations between local structure distribution and the structures’ stability (section 3.3).
II 2. Screening for potentially formable Nd-Fe-B crystal structures
II.1 2.1 Creation of new crystal structures
We collected 5967 crystal structures from the Open Quantum Materials Database (OQMD) Saal et al. (2013)(version 1.1) with details calculated formation energies to build the host materials’ dataset denoting by . At the time of conducting this research, the Open Quantum Materials Database contains more than 637,000 materials with DFT calculated thermodynamic and structural properties. In this database, roughly 30% of structures in the OQMD are stable, and this portion is reducing yearly by the appearance of more calculated results of hypothetical structures Saal et al. (2013). All the structures in comprise lanthanide (LA), transition metal (T), and light (X) elements. The LA elements are Y, La, Ce, Pr, Nd, Pm, Sm, Eu, Gd, Tb, Dy, Ho, Er, Tm, Yb, and Lu. The T elements are Ti, V, Cr, Mn, Fe, Co, Ni, Cu, Zn, Y, Zr, Nb, Mo, Tc, Ru, Rh, Pd, Ag, Cd, Hf, Ta, W, Re, Os, Ir, Pt, Au, and Hg. The X elements are H, B, C, N, and O. Any crystal structure in included one or two rare-earth metals, one or two transition-metals, and one light element. From , we denoted a subset of all crystal structures comprising Nd, Fe, and B as .
In this research, elemental substitution method was applied on the crystal structures in to generate new hypothetical structures consisting of Nd, Fe, and B. We substituted all lanthanide sites of a given host crystal structure with Nd, all transition metal sites with Fe, and all light element sites of with B to generate a new hypothetical Nd-Fe-B structures. The newly substituted structures were compared to each other and to the crystals in the dataset to avoid duplication. In the first step, we remove all possible structural duplications using the comparison procedure proposed by qmpy (python application programming interface of OQMD) Saal et al. (2013). In the first step of the qmpy procedure, lattice parameters of all hypothetical structure pairwises in the reduced primitive cells are compared. Secondly, the structural comparison proposed by qmpy compared the internal coordinates of the structures by examining all the possible structure rotations and translations to map atoms of the same species into one another within a given deviation. In this step, any two structures that have the same deviation amount of lattice parameters and angles smaller than 0.1 percent were consided identical. In the last step, we used our developed OFM descriptor (section III.13.1) for removing duplications. Two structures were set identical if the norm of the difference in the OFM descriptor was less than . It is worth noticing that two structures that have the same shape yet are slightly different in size are considered identical. Finally, we obtained a dataset containing 149 new nonoptimized Nd-Fe-B crystal structures.
II.2 2.2 Assessment of phase stability
First-principle calculations based on density functional theory (DFT) Kohn and Sham (1965); Hohenberg and Kohn (1964) are broadly accepted in computational materials science. DFT calculations accurately determine the formation energy of materials, which is used to build phase diagrams for systems of interest. Consequently, the phase stability of a material —in other words, the decomposition energy of a given material or CH-distance is obtained through the convex-hull analysis of phase diagrams and the decomposition of the material into other phases. We used the formation energy obtained from OQMD Saal et al. (2013); Kirklin et al. (2015) of to build phase diagrams and calculate the CH-distance. The CH-distance of a material is determined as follows:
| (1) |
where is the formation energy, and is determined by projecting from the chemical composition position to an endpoint appearing on the convex hull facets. Details of the algorithm for determining these convex hull facets from hull points and are given in Barber et al. (1996); Saal et al. (2013). Hence, we consider the CH distance to measure the phase stability of a material. A material that lies below or on the CH surface, , is potentially formable. In contrast, a material associated with is unstable. A material associated with lightly above the CH surface is considered a metastable phase. Referring to the prediction accuracy of formation energy ( 0.1 eV/atom by OQMD Saal et al. (2013)), we defined all the materials with eV/atom as potentially formable materials and as unstable materials otherwise. Following this definition, could be divided into subsets and for potentially formable crystal structures and unstable crystal structures, respectively.
holds 35 Nd-Fe-B crystal structures that are used as references to build the Nd-Fe-B phase diagram. Among them, there are seven ternary crystal structures. To verify the reliability of the dataset in constructing the phase diagram and the definition of structure stability, we removed each ternary crystal then used the remaining crystals in to determine its corresponding stability value. As a result, among the seven ternary materials, NdFe4B4 and Nd5Fe2B6 are two formable ternary crystals with . Moreover, one material, NdFe12B6, is potentially formable (metastable) with its stability less than eV/atom. Table I in the Supplementary Materials shows details about the stability of all these crystal. It should be noted that the important magnetic material, Nd2Fe14B, did not exist in the OQMD database when we conducted this study. Using the DFT calculated formation energy of -0.057 (eV/atom), the of is Nd2Fe14B eV/atom. This result indicates that Nd2Fe14B is in the stable phase. To conclude, we evaluated the stability definition by determining the stability of these experimentally manufactured structures.
We followed the computational settings of OQMD Saal et al. (2013); Kirklin et al. (2015) to determine the formation energy of the hypothetical Nd-Fe-B crystal structures in . The calculations were performed using the Vienna ab initio simulation package (VASP) Kresse and Hafner (1993, 1994); Kresse and Furthmuller (1996a, b) by utilizing projector-augmented wave (PAW) method potentials Blöchl (1994); Kresse and Joubert (1999) and the Perdew–Burke–Ernzerhof (PBE)Perdew et al. (1996) exchange-correlation functional.
We employed DFT+U for Fe, and all calculations were spin-polarized with the ferromagnetic alignment of the spins. Initial values of the magnetic moment were set at 5, 0, and 0 for Fe, Nd, and B respectively. For any new structure, we followed three optimization steps: ’coarse relax’, ’fine relax’, and ’standard’ procedures of the OQMD for coarse optimization, fine optimization, and a single point calculation, respectively. The number of k-points per reciprocal atom (KPRA) was set as 4000, 6000, and 8000 for the ’coarse relax’, ’fine relax’, and ’standard’ optimization steps respectively. We used a cutoff-energy value at 520 eV for all calculations. The total energy obtained from the ”standard” calculation step was used to estimate the formation energy, . In the last step, the CH distance of a new structure is estimated from equation 1.
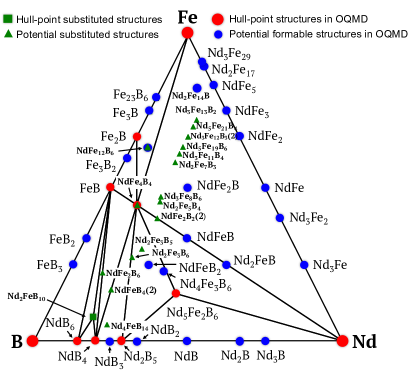
Finally, we obtained 20 new Nd-Fe-B crystal structures that are not in , in which the CH distance of the corresponding optimized crystal structure was less than 0.1 eV. Figure 2 in the Supplementary Materials shows details of their geometrical shapes. These crystals originate from different host crystal structures with different skeletons. Note that we found one structure, Nd2FeB10, with stability less than eV/atom. Accordingly, this structure is also used as a reference to construct the Nd-Fe-B phase diagram. Among the 20 new Nd-Fe-B structures, there are three pairs of discriminated structures sharing the same chemical compositions (NdFe2B2, NdFeB4 and NdFe4B). Table II in the Supplementary Materials shows details about the DFT calculated formation energy and the stability of all these crystals. Figure 1 shows the phase diagram of the Nd-Fe-B crystals, including the 20 new substituted crystal structures.
III 3. Mining structure–stability relationship of Nd-Fe-B crystal structures
III.1 3.1 Materials representation
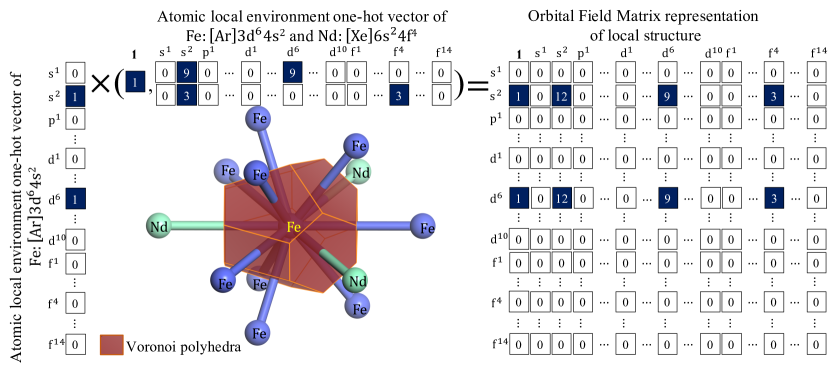
In this study, we employed the OFM Lam Pham et al. (2017); Pham et al. (2018) to convert the information of materials to the description vector. The OFM descriptors were constructed using the weighted product of the one-hot vector representations, , of atoms. Each vector is filled with zeros, except those representing the electronic configuration of the valence electrons of the corresponding atom. The OFM of a local structure, named , is defined as follows:
| (2) |
where is the solid angle determined using the face of the Voronoi polyhedra between the central atom and the index neighboring atom; is the maximum solid angle between the central atom and neighboring atoms. By removing the distance dependence in the original OFM formulation Lam Pham et al. (2017); Pham et al. (2018), we focused exclusively on the coordination of valence orbitals and the shape of the crystal structures. The mean over the local structure descriptors is used as the descriptor of the entire structure:
| (3) |
where is the structure index, and and are the local structure indices and the number of atoms in the unit cell of the structure , respectively. A complete representation of the OFM matrix has 1056 dimensions. However, under a given investigation system, a large number of zero terms appearing in all structures’ representation due to the absence of other elements. In this investigation, Nd-Fe-B structures with three atomic types require 19 non-zero OFM variables. Details illustration of OFM descriptor are shown in Figure 2
Note that, owing to the designed cross product between the atomic representation vectors of each atom, each element in the matrix represents the average number of atomic coordinates for a certain type of atom. For example, an element of a descriptor obtained by considering the product of the element of the center atom representation and the element of the environment atom representation, denoted as , shows an average coordination number of (Nd) sites surrounding all (Fe) sites. As the term appears at all descriptors for Fe, Nd, and B sites, the element represent the average coordination number of a given structure. All these OFM elements make it possible to investigate the structure–stability relationship.
III.2 3.2 Descriptor relevant analysis
In this section, we focused on and evaluated the relevance Nguyen et al. (2019); Yu and Liu (2004); Visalakshi and Radha (2014) of each element in the OFM descriptor regarding the formation energy of the crystal structure. We utilized the change in prediction accuracy when removing or adding an element (from the full set of elements in the OFM) to search for the elements that were strongly relevant Nguyen et al. (2019); Dam et al. (2018) to the formation energy (i.e., CH distance and phase stability) of the Nd-Fe-B crystal structures.
In detail, for a given set of descriptor elements, we defined the prediction capacity of by the maximum prediction accuracy that a prediction model could achieve by using the variables in a subset of as follows:
| (4) |
where is the value of the coefficient of determination Kvalseth (1985) achieved by the prediction model using a set as the independent variables. is the subset of that yields the prediction model having the maximum prediction accuracy. In this study, we used kernel ridge regression (KRR)Murphy (2012) as the prediction model.
is denoted as set of descriptor elements after removing an element from the full descriptor element set ; }. A descriptor element is strongly relevant if and only if:
| (5) |
By applying the descriptor relevant analysis in predicting the formation energy of the crystal structures in it can be claimed that the descriptor is a strong relevant descriptor. Details of the result are shown in Supplementary materials.
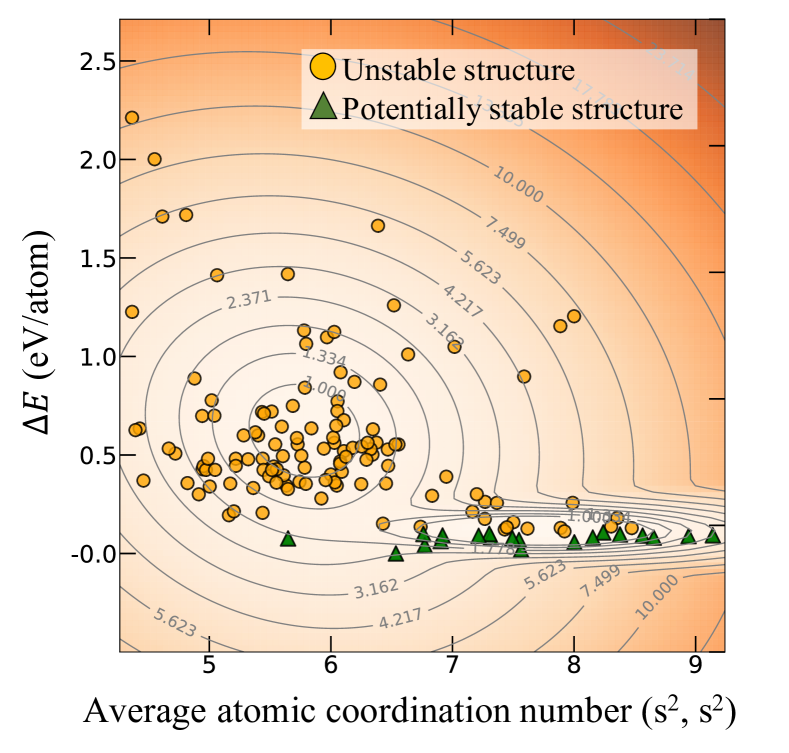
In Figure 3, we show the dependence of the CH-distance, on the average atomic coordination number of crystal structures in with Gaussian kernel density estimation implemented in sklearn.mixture.GaussianMixturePedregosa et al. (2011). The distribution of shown in this space is a mixture of two main components. The larger distribution component is located in the region with , whereas the other is located in the region with . Contour lines show surfaces of iso-density distribution. We inferred the existence of two distinct groups of substituted crystal structures. The first group contained structures with average atomic coordination numbers lower than 6.5. The second group contained structures with average atomic coordination numbers higher than 6.5. Interestingly, almost all the new, potentially formable crystal structures – 19 among 20 substituted structures belonged to the second group. As mentioned, it is evident that the stability mechanism of Nd-Fe-B substituted structures is closely related to the average atomic coordination number.
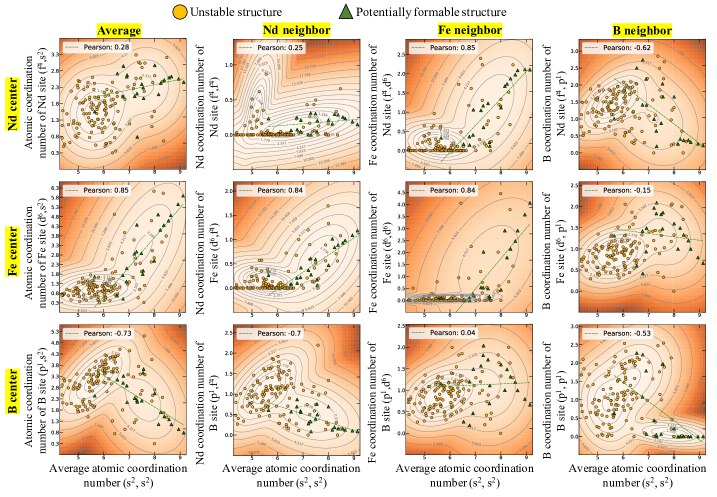
Next, we investigated the distributions of all the substituted structures in the space of and the remaining set of OFM descriptors. Based on the fact that each OFM descriptor shows a particular description of coordination number, we categorized the remaining OFM descriptors according to center-based and neighbor-based components. For instance, the OFM descriptor represents the coordination number of Nd (neighbor) surrounding Fe (center) sites. All distributions of substituted structures regarding the descriptor and the set of remaining descriptors are summarized in Fig. 5. In figure 5, one might notice that all the distributions were relatively similar to the distribution over and spaces, figure 3. There were two distinguishable groups with one located in the region of and the other located in the region of . As previously mentioned, almost all the potentially formable structures appear in the second group, with the average coordination number . However, in the group of these potentially formable structures, different elemental coordination numbers exhibit different correlations with . We used Pearson score Pearson (1895) to measure these linearity correlations qualitatively. The Pearson score has a value between [-1, +1] with -1 and +1 represent for total negative and positive linear correlation, respectively. In practical use, one might consider the absolute value of the Pearson score larger than 0.8 as an existence of linear correlation, otherwise as non-existence of linear correlation. The investigation results are summarized in table 1.
| Average | Nd neighbor | Fe neighbor | B neighbor | |
|---|---|---|---|---|
| Nd center | 0.28 | 0.25 | 0.85 | -0.62 |
| Fe center | 0.85 | 0.84 | 0.84 | -0.15 |
| B center | -0.73 | -0.70 | 0.04 | -0.53 |
In the group of substituted structures which are potentially formable, , by increasing , descriptors and show upward trends with Pearson coefficients of 0.84. The descriptor () represents the average of Nd (Fe) coordination numbers surrounding Fe-center sites. In addition, the average Fe coordination number surrounding Nd-center sites shows a positive correlation with for a Pearson coefficient of 0.85. In contrast, by increasing the value, Nd and B coordination numbers of B-center sites show apparent downward trends with Pearson coefficients of -0.7 and -0.53, respectively. To conclude, for potentially formable structures in , by increasing the average coordination number , the coordination numbers of Nd and Fe elements surrounding Fe sites and Fe elements surrounding Nd sites also increase. In contrast, Nd-Fe-B potentially formable structures with a larger average coordination number possess their B sites with a lower coordination number. All these correlations are summarized in table 1 and figure 3 .
III.3 3.3 Local structure distribution
In the previous section, we investigated the structure-stability relationship of substituted structures that are potentially formable. Correlations of different coordination numbers regarding the strong relevant feature, , are discussed. In this section, we investigate distributions of Nd, Fe, and B local structures emphasizing on the stabilty of corresponding substituted structures on t-SNE embedding spaces van der Maaten (2008).
The OFM description vector we used in this work (section 3.1) has 1056 dimensions. By omitting constant variables, in , there are 19 remaining variables that need to represent these local structures. To visualize the distributions of local structures, a dimensionality reduction method is necessary. Herein, we employed t-distributed stochastic neighbor embedding (t-SNE) van der Maaten (2008). This technique maps a set of high-dimensional data points to a lower-dimensional space (typically two), such that ideally, close neighbors remain close, and separate data points prevail distantly. Roughly speaking, the algorithm initially samples all local structures on a 2D space, at random positions and then moves these local structures gradually, aiming to minimize derivations between all pairwise distances in the 2D plane and pairwise distances in the original space. The most critical parameter of t-SNE, called perplexity, controls the width of the Gaussian kernel van der Maaten (2008). It also effectively governs similarities between local structures and how many of its nearest neighbors each point is attracted to. In other word, the optimal parameter perplexity balance attention between local and global aspects of our data Wattenberg et al. (2016). The second important parameter of t-SNE is the early exaggeration. This parameter controls the work of forming cluster at initial steps by forcing early clusters tightly knit together. Therefore, there is more empty space to help clusters moving around relative to others to archive an optimal global organization. Details explanation and practical effect in using these parameters are shown in the original paper van der Maaten (2008) and Wattenberg et al. (2016); Kobak (2019). To obtain distributions in the best match with the original distribution, we evaluate the embedding results taken from the t-SNE method with a designed score and then select the optimal one.
To quantify the quality of a given embedding, we use the two following metrics: trustworthiness () and continuity () Venna and Kaski (2006); Lee and Verleysen (2009). These two metrics were designed to evaluate the information loss of all dimensionality reduction method. In detail, the trustworthiness score and continuity score are defined as follows:
| (6) | |||
| (7) |
where with is the size of the neighborhood; is the total number of local structures. and are the rank of local structure in the ordering according to the distance from in the original and embedding space, respectively. is the set of local structures that are approximately size of the local structure in the embedding space but not in the original space. is the set of local structures that are approximately size of the local structure in the original space but not in the embedding space. In comparison, measures the degree of reliability exhibited when local structures with further entrances join together in the embedding space, whereas measures the degree of continuity exhibited when local structures with original locality are pushed farther away in the embedding space. and metrics are all in range from 0.0 to 1.0. The optimal value 1.0 indicates the most reliable for embedding methods as the distance metric on the embedding space totally matches the distance metric on the original space. On the other hand, the minimum value 0.0 indicates the least reliable results. Based on this interpretation, we performed grid-search parameters and then raised the optimal t-SNE’s parameters by maximizing the simple average of and . In the grid-search, perplexity and early exaggeration parameters vary from 1 to 1000.
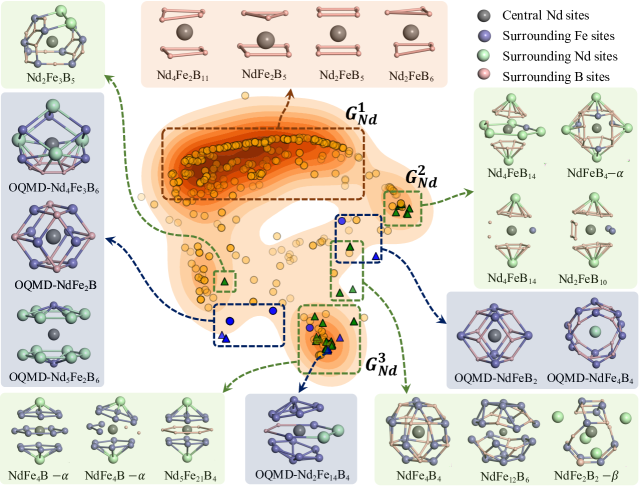
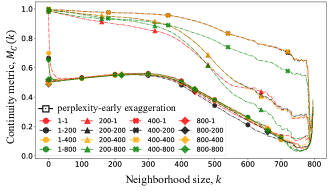
Figure 4 shows results of the continuity metric in searching for the optimal parameters of Nd local structure data. The metric generally starts at the maximum value of 1.0 with neighbor and then gradually decreases when evaluating larger neighbors. As shown in this figure, the embedding results using a group of parameters with a perplexity of 400 exhibit a maximum of values for all . Finally, we obtain the optimal perplexity (early exaggeration) parameter for Nd, Fe, and B local structures distribution as follows: 400 (400), 800 (200), and 200 (100), respectively.
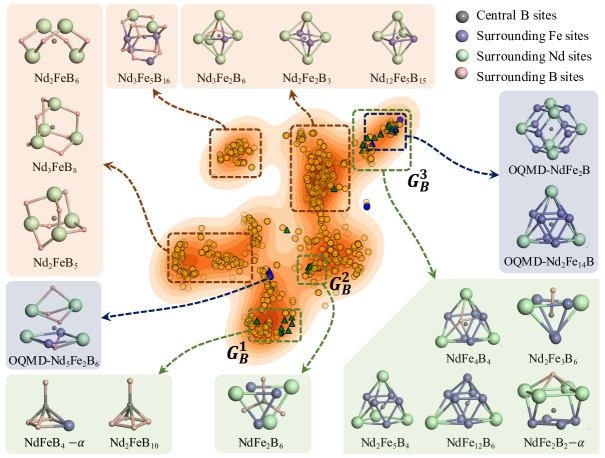
Figures 6, 7, and 8 show the distributions of Nd, Fe, and B local structures respectively by applying the t-SNE dimensionality reduction method with optimal parameters. Local structures gathered from potentially formable substituted structures are denoted by green triangles. In contrast, orange circles are used to denote local structures gathered from unstable substituted structures. We also project the local structures of all ternary materials obtained from OQMD as references. These ternary materials were estimated the structure stability shown in Sect. 2.2 and also used to construct the Nd-Fe-B phase diagram shown in Fig. 1. In figures 6, 7, and 8, local structures gathered from stable material structures in OQMD are denoted by blue triangles and local structures gathered from unstable material structures in OQMD are denoted by blue circles.
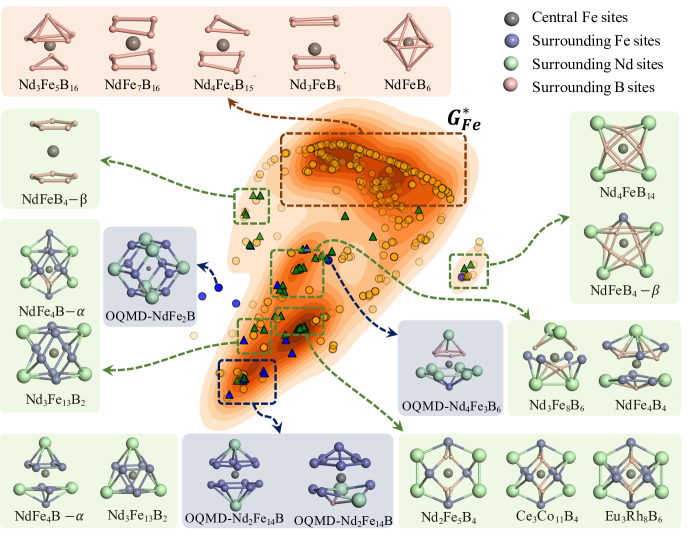
Figure 6 shows the correlation between Nd local structures and the structural stability in the t-SNE embedding space. In this map, we focus on three prominent groups denoted as , and . As the group with the highest number of local structures, holds local structures with fully occupied B neighbors. The number of B neighbor sites for local structures in this group is typically seven or eight. These B neighboring sites form several geometrical shapes surrounding the Nd center, as shown in the upper panel of Fig. 6. However, the most noticeable point is that there are no local structures in this group extracted from potentially formable structures (green or blue triangles). From this correlation, one may conclude that the potentially formable structures avoid Nd local structures containing fully occupied B neighboring sites as Nd local structures in this group.
In contrast, the groups and attract almost all Nd local structures gathered from potentially formable structures. By comparing the number of neighboring atoms, Nd local structures in these and groups generally have 12 to 20 neighboring atoms which is roughly twice times larger than Nd local structures in the group. In these groups, the dominant geometrical shape of local structures is a pair of hexagonal pyramids, with the next Nd neighbor atoms located on top of each pyramid. The main difference among the local structures in this group is from the bases of these pyramids. Since the pyramids’ bases of local structures in the group are only built from Fe atoms, the pyramids’ plates in the group are made entirely from B atoms. The middle of these hexagonal pyramids contains a hexagonal ring that comprises either Fe atoms, B atoms, or a combination of both atoms. From Fig. 6, the most well-known magnet, Nd2Fe14B, has Nd local structures similar to the Nd local structures in the Nd group. The main deviation is that the Nd local structure of Nd2Fe14B materials contain two hexagonal pyramids with Fe atoms locating on the two top.
Figure 7 shows the correlation between Fe local structures and the structural stability in the t-SNE embedding space. In this Fe local structure distribution, there is a prominent group of Fe local structures denoted by in this figure. Similar to the Nd map, the elemental component of neighboring sites is the first criterion to identify local structures in the group and the other. The group contains local structures with fully extended B neighbor sites. The geometrical shapes of these B neighbors are hexahedrons, octahedrons, cuboctahedrons, etc. From right to left in the group Fe∗’s distribution, the number of B neighbor atoms surrounding the Fe local structures increases from 6 to 10.
In contrast, local structures excluding the group exhibit various arrangements of Nd, Fe, and B local atoms surrounding the central Fe sites. Their geometrical shapes are mostly built from rectangular pyramids with Nd atoms at the apex, and B or Fe neighbor atoms are in the base. As shown in Fig. 7, from the bottom to the top of the region excluding the group , one might notice that the number of neighboring atoms in the local structures in this group increases from 9 to 12. In comparison, the number of neighboring atoms of the local structure in this region is significantly larger than local structures in the group .
The second difference between local structures in the group and the rest of the distribution is the stability of structures owing to these local structures. As shown in Fig. 7, local structures in the group are entirely extracted from unstable structures (orange points). On the other hand, local structures excluding the group contain a large number of local structure extracted from the potentially formable substituted structures (green points). This result is consistent with the correlation between the coordination number of Fe and the structure stability shown in Fig. 5 and Sect. 3.2. Figure 5 shows that there is a higher possibility to obtain stable structures if the atomic coordination number of the Fe site () is larger than 6.5. Furthermore, all local structures collected from OQMD materials (blue points) do not also appear in the group. Also from this Fig. 7, the distribution Fe local structures collected from stable OQMD materials (blue triangles) appears in much consistent with the distribution of Fe local structures collected from potentially substituted structures (green triangles). Finally, one might conclude that there is an undeniable correlation between the shape of Fe local structures and the stability of substituted Nd-Fe-B structures in our experiment. Potentially formable Nd-Fe-B substituted structures avoid possessing local Fe structures with entirely B atoms and low average coordination number.
Lastly, we investigated the distribution of B local structures as well as the correlation with structural stability through t-SNE embedding space in Fig. 8. Since the distribution of the Fe and Nd local structures contains a small number of groups, i.e., two and four, respectively, the map of the B local structure comprises seven large groups. Intensively mining this map shows us the difference between the geometrical shapes of the local structures among these groups. From this figure, potentially formable structures appear within three main geometrical shapes of the B local structure shown in groups , and , respectively. The group possesses B local structures that are all in square-based pyramid form. These B local structures appear in Nd2FeB10, Nd4FeB14 and NdFeB4- substituted structures, which possess B cage networks. B local structures in group appear in a B planar shape that extracts from NdFe2B6 or NdFeB4- structures. Rather than forming B cage networks as B locals in , B local structures in exhibit arrangements of mixing pentagonal and heptagonal planar rings. All noticeable forms of these B cage and planar network are visualized in Fig. 2 in the Supplementary section.
Lastly, local structures in appear with a limited number of neighboring B atoms. Fe atoms fully occupy almost all local structures in this group. In other words, structures possessing this type of local structure hold B atoms as interstitial sites rather than forming B networks as the others. Among B local structures extracted from Nd-Fe-B structures in existing database OQMD, B local structures of well-known Nd2Fe14B magnets appear in this interstitial type. To conclude, in this study, we unveiled correlations between structural stability and Nd, Fe, and B local structures of both substituted Nd-Fe-B crystal structures and existed Nd-Fe-B crystals from OQMD. These correlations provide a deep insight to structure-stability relationship of Nd-Fe-B crystal structures that could be useful to speed up the screening process for the new formable crystal structures.
IV 4. Conclusion
In this research, we examined the structure–stability relationship of substituted Nd-Fe-B crystal structures using descriptor-relevance analysis and the t-SNE dimensionality reduction method. Hypothetical substituted Nd-Fe-B crystal structures are found using the elemental substitution method from LA-T-X host crystal structures with LA as lanthanide, T as transition metal, and X as light element (X = B, C, N, O). For each host crystal structure, a hypothetical crystal structure is created by substituting all lanthanide sites with Nd, all transition metal sites with Fe, and all light element sites with B. High-throughput first-principles calculations are used to evaluate the phase stability of the hypothetical crystal structures. Twenty of them are potentially formable. By performing the descriptor-relevance analysis on the orbital field matrix (OFM) materials’ descriptor, the average atomic coordination number is shown as the most essential essential factor that effects to the structure stability of these substituted Nd-Fe-B crystal structures. 19 among 20 hypothetical structures that are found potentially formable have an average coordination number larger than 6.5. Under the use of the dimensionality reduction t-SNE method, concrete correlations between Nd, Fe and B local structures and the structural stability of these substituted crystals are revealed. Unstable substituted structures frequently contain Nd and Fe local structures with a low coordination number and fully occupied B neighboring atoms. On the other hand, potentially formable structures appear in three particular forms of B local structures: cage networks, planar networks, and interstitial. The extracted correlations between structural stability and different type of Nd, Fe and B local structures are validated with local structures of well known Nd-Fe-B crystals on OQMD. These structure-stability relationships are promising to accelerate the process of screening new formable Nd-Fe-B structures.
V Supplementary Materials
See separated supplementary materials the results from descriptor relevance analysis and details information of 20 substituted structures that are potentially formable in our study.
acknowledgments
Acknowledgements.
This work is supported by the Ministry of Education, Culture, Sports, Science and Technology of Japan (MEXT) ESICMM Grant Number 12016013 and “Program for Promoting Researches on the Supercomputer Fugaku” (DPMSD), JSPS KAKENHI Grants Number 20K05301 and Number JP19H05815 (Grant-in-Aid for Scientific Research on Innovative Areas “Interface Ionics”).Data availability
The LATX dataset that support the findings of this study are openly available in Open Quantum Materials Database (OQMD) Saal et al. (2013) (version 1.1) at http://oqmd.org/download/. Details of OQMD database are found in https://doi.org/10.1007/s11837-013-0755-4. Details of substituted NdFeB crystals that are potentially formable and the OQMD index of the corresponding host crystals could be found in Supplementary Materials. Three steps vasp calculations for Nd-Fe-B substituted structures are published at the NOMAD repository at https://dx.doi.org/10.17172/NOMAD/2020.07.30-1. Summary of substituted structures and local structures, including vasp calculations, OFM descriptor are published in Zenodo at https://doi.org/10.5281/zenodo.3966736.
References
- Ma et al. (2017) J. Ma, V. I. Hegde, K. Munira, Y. Xie, S. Keshavarz, D. T. Mildebrath, C. Wolverton, A. W. Ghosh, and W. H. Butler, Phys. Rev. B 95, 024411 (2017).
- Korner et al. (2016) W. Korner, G. Krugel, and C. Elsasser, Scientific Reports 6 (2016), doi:10.1038/srep24686.
- Korner et al. (2018) W. Korner, G. Krugel, D. F. Urban, and C. Elsasser, Scripta Materialia 154, 295–299 (2018).
- He et al. (2018) J. He, S. S. Naghavi, V. I. Hegde, M. Amsler, and C. Wolverton, Chemistry of Materials 30, 4978–4985 (2018), https://doi.org/10.1021/acs.chemmater.8b01096 .
- Balluff et al. (2017) J. Balluff, K. Diekmann, G. Reiss, and M. Meinert, Phys. Rev. Materials 1, 034404 (2017).
- Emery et al. (2016) A. A. Emery, J. E. Saal, S. Kirklin, V. I. Hegde, and C. Wolverton, Chemistry of Materials 28, 5621 (2016), https://doi.org/10.1021/acs.chemmater.6b01182 .
- Michalsky and Steinfeld (2017) R. Michalsky and A. Steinfeld, Catalysis Today 286, 124–130 (2017), nitrogen Activation.
- Yang et al. (2012) K. Yang, W. Setyawan, S. Wang, M. Buongiorno Nardelli, and S. Curtarolo, Nature Materials 11, 614–619 (2012).
- Li et al. (2018) X. Li, Z. Zhang, Y. Yao, and H. Zhang, 2D Materials 5, 045023 (2018).
- Oganov et al. (2019) A. R. Oganov, C. J. Pickard, Q. Zhu, and R. J. Needs, Nature Reviews Materials , 331–348 (2019).
- Sagawa et al. (1984) M. Sagawa, S. Fujimura, N. Togawa, H. Yamamoto, and Y. Matsuura, Journal of Applied Physics 55, 2083–2087 (1984), https://doi.org/10.1063/1.333572 .
- Hirosawa et al. (1986) S. Hirosawa, Y. Matsuura, H. Yamamoto, S. Fujimura, M. Sagawa, and H. Yamauchi, Journal of Applied Physics 59, 873–879 (1986), https://doi.org/10.1063/1.336611 .
- Tatetsu et al. (2018) Y. Tatetsu, Y. Harashima, T. Miyake, and Y. Gohda, Phys. Rev. Materials 2, 074410 (2018).
- Saal et al. (2013) J. E. Saal, S. Kirklin, M. Aykol, B. Meredig, and C. Wolverton, JOM 65, 1501–1509 (2013).
- Kohn and Sham (1965) W. Kohn and L. J. Sham, Phys. Rev. 140, A1133–A1138 (1965).
- Hohenberg and Kohn (1964) P. Hohenberg and W. Kohn, Phys. Rev. 136, B864–B871 (1964).
- Kirklin et al. (2015) S. Kirklin, J. E. Saal, B. Meredig, A. Thompson, J. W. Doak, M. Aykol, S. Rühl, and C. Wolverton, Npj Computational Materials 1, 15010 (2015).
- Barber et al. (1996) C. B. Barber, D. P. Dobkin, and H. Huhdanpaa, ACM Trans. Math. Softw. 22, 469–483 (1996).
- Kresse and Hafner (1993) G. Kresse and J. Hafner, Phys. Rev. B 47, 558–561 (1993).
- Kresse and Hafner (1994) G. Kresse and J. Hafner, Phys. Rev. B 49, 14251–14269 (1994).
- Kresse and Furthmuller (1996a) G. Kresse and J. Furthmuller, Comput. Mat. Sci. 6, 15–50 (1996a).
- Kresse and Furthmuller (1996b) G. Kresse and J. Furthmuller, Phys. Rev. B 54, 11169–11186 (1996b).
- Blöchl (1994) P. E. Blöchl, Phys. Rev. B 50, 17953–17979 (1994).
- Kresse and Joubert (1999) G. Kresse and D. Joubert, Phys. Rev. B 59, 1758–1775 (1999).
- Perdew et al. (1996) J. P. Perdew, K. Burke, and M. Ernzerhof, Phys. Rev. Lett 77, 3865–3868 (1996).
- Lam Pham et al. (2017) T. Lam Pham, H. Kino, K. Terakura, T. Miyake, K. Tsuda, I. Takigawa, and H. Chi Dam, Sci Technol Adv Mater 18, 756–765 (2017).
- Pham et al. (2018) T.-L. Pham, N.-D. Nguyen, V.-D. Nguyen, H. Kino, T. Miyake, and H.-C. Dam, The Journal of Chemical Physics 148, 204106 (2018).
- Nguyen et al. (2019) D.-N. Nguyen, T.-L. Pham, V.-C. Nguyen, A.-T. Nguyen, H. Kino, T. Miyake, and H.-C. Dam, Journal of Physics: Conference Series 1290, 012009 (2019).
- Yu and Liu (2004) L. Yu and H. Liu, J. Mach. Learn. Res. 5, 1205–1224 (2004).
- Visalakshi and Radha (2014) S. Visalakshi and V. Radha (2014) pp. 1–6.
- Dam et al. (2018) H. C. Dam, V. C. Nguyen, T. L. Pham, A. T. Nguyen, K. Terakura, T. Miyake, and H. Kino, Journal of the Physical Society of Japan 87, 113801 (2018), https://doi.org/10.7566/JPSJ.87.113801 .
- Kvalseth (1985) T. O. Kvalseth, The American Statistician 39, 279–285 (1985).
- Murphy (2012) K. P. Murphy, “Machine learning: A probabilistic perspective,” (MIT Press, 2012).
- Pedregosa et al. (2011) F. Pedregosa, G. Varoquaux, A. Gramfort, V. Michel, B. Thirion, O. Grisel, M. Blondel, P. Prettenhofer, R. Weiss, V. Dubourg, J. Vanderplas, A. Passos, D. Cournapeau, M. Brucher, M. Perrot, and E. Duchesnay, J Mach Learn Res 12, 2825–2830 (2011).
- Pearson (1895) K. Pearson, Proceedings of the Royal Society of London 58, 240–242 (1895).
- van der Maaten (2008) G. van der Maaten, L.J.P.; Hinton, Journal of Machine Learning Research 9, 2579–2605 (2008).
- Wattenberg et al. (2016) M. Wattenberg, F. Viégas, and I. Johnson, Distill (2016), 10.23915/distill.00002.
- Kobak (2019) B. P. Kobak, D., Nature Communication 10, 5416 (2019).
- Venna and Kaski (2006) J. Venna and S. Kaski, Neural Networks 19, 889–899 (2006), advances in Self Organising Maps - WSOM’05.
- Lee and Verleysen (2009) J. A. Lee and M. Verleysen, Neurocomputing 72, 1431–1443 (2009), advances in Machine Learning and Computational Intelligence.