Magneto-Optical Properties of InSb for Infrared Spectral Filtering
Abstract
We present measurements of the Faraday effect in n-type InSb. The Verdet coefficient was determined for a range of carrier concentrations near in the long-wave infrared regime. The absorption coefficient was measured and a figure of merit calculated for each sample. From these measurements, we calculated the carrier effective mass and illustrate the variation of the figure of merit with wavelength. A method for creating a tunable bandpass filter via the Faraday rotation is discussed along with preliminary results from a prototype device.
I Introduction
Faraday rotation of the polarization state of light is one of the most well-known non-reciprocal processes in physics. It is a result of circular birefringence induced in materials with strong magneto-optical coupling by an applied magnetic field. Materials exhibiting large Faraday rotation, in combination with polarization optics, are used to break time-reversal symmetry for light propagation, allowing the use of these materials as isolators in optical communications to protect light sources and detectors from back-reflections in the optical path. The Faraday effect has been demonstrated in all classical states of matter, but only solid-state materials find widespread application.
Crystalline semiconductors with high carrier mobility are ideal magneto-optical materials due to the high density of free carriers with low effective mass and long mean free time. Such materials have been used for decades to implement large Verdet coefficients () - the constant of proportionality between the change in polarization angle (), magnitude of the applied magnetic field (), and material thickness () Ukhanov (1974). In the long-wave infrared (LWIR) range of interest for thermal imaging ( ), the best-performing Faraday rotators are doped semiconductors where the magneto-optical coupling is dominated by the free carrier effect Boord et al. (1974); Hilico et al. (2011); Tomasetta et al. (1979); Smith et al. (1959). Taking the Drude model for a free-electron gas, it can be shown that the Verdet coefficient varies linearly with the doping concentration () and inversely with the square of the electron effective mass () as shown in Equation 1.
| (1) |
where is the vacuum permeability, is the carrier charge ( for electrons), is the refractive index, and is the speed of light.
The III-V semiconductor InSb has among the lowest electron effective masses of any known material ( for intrinsic InSb) as well as good transparency below the band edge absorption (), making it a promising material for magneto-optical devices at long wavelengths Böer and Pohl (2018); Smith et al. (1959). In addition to polarization rotation efficiency, low attenuation is equally important for infrared optical devices and is quantified by the absorption coefficient, . For InSb, this is again derived in the Drude free-electron gas limit where scattering events are temporally-separated by mean free time , resulting in Equation 2.
| (2) |
It is useful to define a figure of merit (FOM) that accounts for both rotation efficiency and optical loss
Materials with high free-carrier densities typically exhibit large Verdet coefficients across a spectral range defined by their transparency window with large dispersion. At shorter wavelengths approaching the electronic band gap, free-carrier rotation is reduced and interband absorption dominates. Since interband rotation opposes free carrier rotation and is independent of doping, there will exist a doping region where rotation is very low and a single doping where it is zero Tomasetta et al. (1979); Smith et al. (1959); Lax and Nishina (1961). Additionally, the Moss-Burstein effect will modify the optical band gap, altering the usable range of wavelengths. Because of this trade-off and the doping dependencies of the effective mass and scattering time, there exists an optimal doping that maximizes the FOM in the free carrier dominated range. Some of these dependencies can be easily modeled via the electronic band structure (e.g. Verdet coefficient versus doping), while others are more complicated (e.g. temperature dependencies or absorption versus doping) or may depend heavily on sample preparation and purity Boord et al. (1974); Jensen (1971); Tomasetta et al. (1979). Therefore, an experimental effort is warranted to determine the optimal doping for maximizing the FOM.
Our research demonstrates that the ideal carrier concentration in InSb at room temperature for applications in the LWIR past is , where all wavelengths in the range have roughly the same FOM. Moreover, we illustrate that the Drude model of absorption and the FOM are incorrect for InSb since additional absorption mechanisms, notably polar optical scattering, are present. We expect that a clear understanding of the Verdet and absorption coefficients in InSb with different carrier concentrations and temperatures will prove important for the future design of magneto-optical elements for hyperspectral imaging and other infrared photonics applications Gupta (2008); Rogalski and Chrzanowski (2014). As an example, we present preliminary results for a prototype magneto-optical device which utilizes the dispersion of the Verdet coefficient to implement a tunable bandpass filter.
II Materials and Methods
II.1 InSb Wafers and Two-Stage Filter
Custom Te-doped InSb crystals were grown by WaferTech LLC and cut so as to give a different carrier concentration and crystal orientation in each sample. Natural dopant gradients in the as-grown boules gave carrier concentrations ranging from to carriers per cubic centimeter in different wafers. 3-inch wafers were double-side polished to provide smooth optical quality surfaces with minimal scattering and diced into samples.
The two-stage filter was constructed as shown in Figure 8: A wire-grid polarizer was sandwiched between two InSb chips ( and thickness) with anti-reflection (AR) coatings. The three layers were bonded at the edges by UV-curing optical adhesive. Commercially-available proprietary AR coatings were used for constructing this prototype bandpass filter. The front and back polarizers were mounted on rotating mounts with angles adjusted relative to the wire-grid polarizer as described in Section IV.
II.2 Carrier Concentration and Mobility
Carrier concentration and mobility were measured via the Hall effect using the Van der Pauw method on a Model 8404 AC/DC Hall Effect Measurement System by Lake Shore Cryotronics, Inc. gold electrical contacts were deposited on the corners of each piece using an AJA electron beam evaporator. The carrier concentration was calculated via
| (4) |
where is the bulk carrier concentration, denotes the electric current flowing through the sample, represents applied magnetic induction, is the unit charge, is the sample thickness, and is the average Hall voltage.
The measurement of the Hall effect also yielded the carrier mobility, . Combined with the carrier effective mass, it is possible to calculate the Drude mean free time via the relation
| (5) |
where is the mean free time. The effective mass () for n-type InSb of similar doping levels is found in the literature to be around (intrinsic), but this value is dependent on the dopant concentration Spitzer and Fan (1957). Measurement of the Verdet coefficient across different samples allowed us to determine the variation of the effective mass with dopant concentration.
II.3 Verdet Coefficient
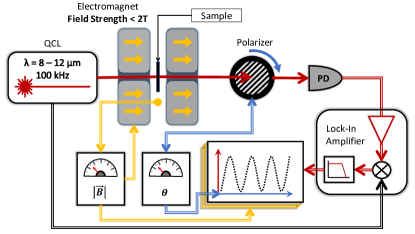
A schematic of the experimental setup is shown in Figure 1. Samples were mounted between the poles of a GMW Associates Model 5405 Electromagnet. A tunable, linearly-polarized Block Engineering LaserTune quantum-cascade laser (QCL) was aimed through an aperture in the magnet. Infrared radiation from the QCL propagated parallel to the magnet field lines, interacted with the material, and exited the magnet at the opposite end. The polarization state of the light after interaction was measured with a rotating polarizer and photodetector (Block Engineering External IR Detector Module); the intensity at the detector varied with the relative angle of the polarizer. A lock-in amplifier (Stanford Research Systems SR844) was used to demodulate the pulsed laser intensity at the detector using the QCL controller as an external trigger. Multiple shots of the QCL were measured for each polarizer angle to determine the average intensity; the polarizer was stepped by a ThorLabs PRM1Z8 precision rotation stage for a full rotation in increments of . The change in polarization angle due to the Faraday effect was observed by measuring the change in the absolute polarization of the escaping light as the strength of the magnetic field was varied in the material. The magnetic field strength was modulated by manipulating the current in the electromagnet and measured near the sample location using a Senis Hall I1A probe from GMW Associates; the maximum achievable field in the setup was approximately since the magnet poles could not be fully closed with the sample stage in place. The intrinsic background rotation of the experimental setup was determined by following the same procedure without a sample present in the chamber and measured to be less than for all wavelengths.
The transmission intensity data were analyzed by fitting a surface of the form where , , and are constants, is the magnetic field strength, and is the thickness of the material. Assuming that the Faraday rotation was linear with the magnetic field, the Verdet coefficient is obtained from . Measurements of the thickness were determined to better than precision for each sample using a micrometer. All data fitting was performed using orthogonal distance regression (ODR), accounting for the experimental uncertainty in both the dependent and independent variables. An example of the collected experimental data and accompanying fit of the model may be seen in the Supporting Information. The FOM was calculated from the Verdet coefficient and absorption coefficients extracted from FTIR measurements of each sample. Precision of Faraday rotation measurements were on the order of for each sample and wavelength, such that the uncertainty in the Verdet coefficient was dominated by precision of the sample thickness measurements ().
II.4 Absorption Coefficient
Infrared transmission spectra were measured using a Bruker Tensor II FTIR Spectrometer. Samples were placed in the focus of the broadband IR beam and apertures applied to ensure use of near-collimated light at normal incidence. Background spectra were acquired before each measurement and multiple scans performed to compute averaged spectra for each sample.
The transmission spectrum from each sample was used to estimate the absorption coefficient, , which, along with the Verdet coefficient, determined the FOM at each wavelength. is the imaginary part of the complex-valued refractive index. is defined such that incident intensity () is attenuated to , for each pass through the material. Accounting for multiple internal reflections via the Fresnel equations, the expression for is
| (6) |
where is the thickness of the material. Since and , the Fresnel coefficients for transmission and reflection on a single pass through the material, were determined from the real refractive index , it was important to verify that has small dispersion () at room temperature in the LWIR. Including the dispersion of produced only a small correction to the absorption results (see Supporting Information) and did not alter the conclusions of Section III.3 which assumed a constant Adachi (1989).
III Results
III.1 Electrical Properties
InSb has a remarkably high mobility on the order of . A high mobility () implies a combination of long mean free time and small effective mass which determine the free-carrier lifetime and plasma frequency. Therefore, materials with high mobility should provide the strongest polarization rotation with little attenuation. Our results for measurements of the mobility in InSb may be seen in Figure 3. The mobility decreases at higher doping concentrations due to stronger scattering effects and increased effective mass. No clear differences between mobilities in samples with different crystal orientations are discernible. This is unsurprising considering the spherical isoenergy surface of InSb, which implies that the effective mass should be isotropic in the crystal momentum vector since the curvature of the conduction band is identical in each direction of reciprocal space Jung et al. (1991); Kane (1957); Jensen (1973a); Böer and Pohl (2018); Basov (1976). Throughout this work, we observed no significant differences in optical, magneto-optical, or electrical properties of samples with different crystal orientations that could not be attributed to the non-identical carrier concentrations in those samples.
III.2 Verdet Coefficient
Our results for the dispersion of the Verdet coefficients in InSb with different crystal orientations and carrier concentrations are presented in Figure 3. The dispersion data show good agreement with the relation from Equation 1. The linear dependence of on is modified by a linear relationship between and , which approximately accounted for the dependence of the effective mass on the carrier concentration of our samples. This variance of the effective mass with carrier concentration prompted studies to optimize the carrier concentration to produce a maximal FOM Hilico et al. (2011); Boord et al. (1974). Accounting for the effective mass dependence on was the only necessary modification, otherwise the data are well-described within the Drude model.
Using the model from Equation 1, we extracted the effective mass as a function of the measured carrier concentration. The results of this calculation are shown in Figure 3. The values calculated here are in good agreement with previous measurements in highly-doped InSb Spitzer and Fan (1957); Kurnick and Powell (1959). The effective mass increases at higher carrier concentrations, indicating a reduced curvature of the conduction band. The increasing carrier concentration pushes the Fermi level further up into the conduction band, filling the lowest conduction band states and populating flatter regions of the non-parabolic conduction band Böer and Pohl (2018); Kittel (2005); Kane (1957); Jung et al. (1991). Optical transitions of the free-carriers are sensitive to this reduced curvature and result in a smaller Verdet coefficient at higher concentrations than would be expected in a pure free-electron gas. Although the effective mass is smallest at lower carrier concentrations, the magnitude of the Verdet coefficient is still dominated by the linear scaling of and increases as increases. However, the Verdet coefficient increases more slowly as the carrier effective mass increases. Since the Verdet coefficient does not depend on the mean free time and is insensitive to carrier scattering mechanisms, unlike the absorption coefficient, the Faraday rotation is well-described by the Drude free-electron gas model once the effective mass variation due to the non-parabolic band structure is taken into account Smith et al. (1959).
III.3 Absorption Coefficient
The Drude model predicts the absorption of light in a free-electron gas based on dissipation of energy via scattering mechanisms quantified by a mean free time Jung et al. (1991); Dresselhaus (2001); Böer and Pohl (2018). Derivations of the absorption coefficient () based on this model demonstrate a dispersion as shown in Equation 2 Hilico et al. (2011); Dresselhaus (2001). Despite the frequent application of this model to InSb, whose abundant free carriers approximate a free-electron gas, it has been shown that this model is not appropriate for the polar semiconductors Jensen (1971). A strong interaction between conduction and valence bands in narrow gap materials like InSb forms non-parabolic bands which is at odds with the parabolic energy-momentum relationship of a free-electron Kane (1957); Basov (1976). We discussed the effects of the non-parabolic band structure on the effective mass in the previous section. Additionally, the strong spin-orbit splitting in InSb and phonon scattering mechanisms must be included to form an accurate picture of the band structure and energy dissipation.
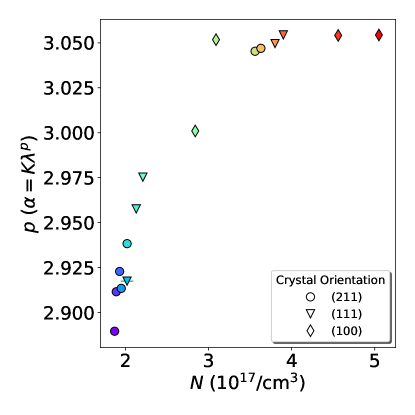
Experimental observations have shown, as in our results plotted in Figures 6 and 4, that the absorption dispersion for InSb actually follows a -dependence. This deviation from the Drude law has been attributed primarily to scattering of free-carriers from longitudinal optical phonon modes (polar optical scattering) Jensen (1971). Additionally, this suggests the dispersionless FOM in Equation 3, due to matching dispersion of the Verdet and absorption coefficients from the Drude free-electron treatment, requires modification or revision Hilico et al. (2011); Boord et al. (1974); Smith et al. (1959); Haga and Kimura (1963); Kurnick and Powell (1959).
Derivations of the free-carrier absorption in InSb based on second-order perturbation theory support the observed dispersion Haga and Kimura (1963). The derivation by Jensen provides a general theory of free-carrier absorption in the polar semiconductors, including InSb Jensen (1973a, 1971, b, 1979). Both discuss how the free-carrier absorption in InSb may deviate from and approaches a dispersion due to polar optical or impurity scattering, depending on the specific dopant concentration and crystal quality. If the carrier concentration is roughly equal to the impurity concentration, there exists a crossover where the dominant scattering process transitions from polar optical to ionized impurities around in InSb Jensen (1973a). Therefore, the smooth transition to sub- absorption below may be a lingering sign of impurity scattering at higher dopant concentrations, as seen in Figure 4 where we have plotted the absorption order for a presumed absorption law for each carrier concentration. A good test for the presence of impurity scattering would be to measure the absorption at low temperatures where phonons are more likely to be frozen out. Cryogenic cooling may be used in this way to increase the FOM by decreasing the total absorption.
III.4 Figure of Merit
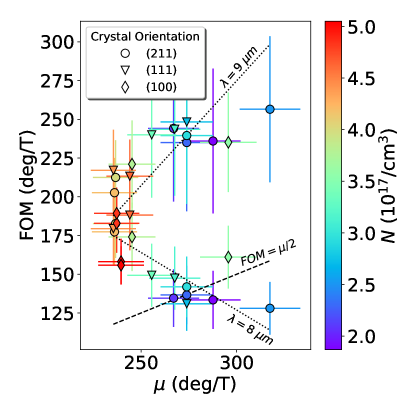
Our results in Figures 6 and 7 demonstrate that tuning InSb to the optimal FOM for Faraday rotation at a given wavelength, and especially across a range of wavelengths, in the LWIR is not quite as simple as choosing the material with the highest carrier mobility. At the highest mobilities, the FOM of the material was greatly enhanced at longer wavelengths but was even more sharply diminished at shorter wavelengths as a reduced Moss-Burstein shift caused the optical band gap to shrink Filipchenko et al. (1972); Spitzer and Fan (1957); Kurnick and Powell (1959). Moreover, the FOM continued to decrease as the wavelength increased away from the optical band edge since the dispersion of the free-carrier absorption coefficient is proportional to while that of the Verdet coefficient is proportional to , an effect that was ignored in previous studies which focused on producing isolators at a single wavelength Hilico et al. (2011); Boord et al. (1974). As can be seen in Figure 6, the best performance (i.e. maximum polarization rotation with low attenuation) was found at photon energies just below the optical band edge.
Higher values of the FOM are obtained at the expense of severe attenuation of the shortest wavelengths using carrier concentrations below . Although measurements of the carrier mobility imply that choosing the smallest carrier concentration delivers a large FOM (see Figure 3), Figure 6 indicates that the ideal carrier concentration must be carefully selected to maximize the FOM across the desired spectral range. For imaging applications across the LWIR spectral range, the data indicate that the ideal InSb should have a carrier concentration greater that where the FOM at becomes comparable to the FOM at other wavelengths.
Figure 7 shows that the Drude FOM (which Equation 3 equated to half the mobility as in Hilico et al. (2011)) is not applicable near the optical band edge energy where we see a negative trend of the FOM with mobility. Even at longer wavelengths, the Drude FOM underestimates the slope of the FOM against mobility. This underestimation is mitigated by the dependence of the true FOM in InSb as the wavelength increases such that a slope of should be expected for one wavelength above the optical band edge and very long wavelengths will have slope . The Drude FOM and measured FOM never match in absolute magnitude in this work; the measured FOM was always nearly double that of the Drude FOM and approximately greater than that measured by Hilico et al. in wafers of similar doping near Hilico et al. (2011).
IV Spectral Filtering via the Faraday Effect
Strong dispersion of the Verdet coefficient in highly-doped InSb may be undesirable for constructing a broadband optical isolator, but it can be utilized to assemble a tunable spectral filter Boord et al. (1974); Hilico et al. (2011). The basic unit stage of such a filter has two polarizers positioned at each end of an n-doped InSb. The first polarizer fixes all wavelengths of light from a target to be of a particular polarization; the n-doped InSb rotates the polarization of different wavelengths of light by different amounts; the second polarizer is oriented such that its polarization axis coincides with the rotation of the desired wavelength, thus allowing it to pass to a subsequent stage. The desired wavelength is fully isolated by repeating the basic unit stage and adding additional InSb-polarizer pairs along the optical axis. Figure 8 shows the schematic of a 2-stage filter; additional stages may be added as needed. Each additional stage will result in further elimination of undesired wavelengths; however, absorption by the InSb and polarizers will eventually limit the number of stages that can be used in practical systems. Spectral filters can be tuned by either varying the magnetic field applied to the doped InSb layers, or by rotating the polarizers while applying a constant or slowly-varying magnetic field to the doped InSb layers.
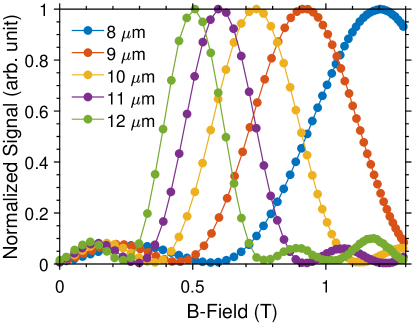
We experimentally demonstrated a 2-stage tunable bandpass filter as shown in Figure 8. Two Te-doped InSb layers with carrier concentration of and thicknesses of and , respectively, were stacked in between three wire-grid polarizers. The thicker second layer was meant to further narrow down the transmission peak. The three polarizer axes were orientated at relative angles of , , and . From the experimentally measured Verdet coefficients of the two InSb layers, the filter transmittance was calculated and is shown in Figure 8 as a function of magnetic field strength and wavelength. As the field strength is increased from to , the filter transmission maximum shifts from to .
We mounted the filter on the electromagnet and experimentally demonstrated tunable spectral filtering with the QCL. Figure 9 shows the experimental data of normalized laser transmittance versus magnetic field strength at different wavelengths. The filter tuning behavior agreed well with the theoretical calculation.
In addition to bandpass filters for hyperspectral imaging applications, it is also possible to design and construct tunable spectral filters using the Faraday effect that block specific wavelengths. Such notch filters may be used to protect detectors from laser jamming and cannot be implemented with tunable filters based on Fabry-Perot etalons Tuohiniemi et al. (2012, 2013). Additionally, the Faraday effect-based tunable spectral filters provides superior design flexibility and robustness. The lack of precision mechanical parts for tuning optical cavities combined with an ability to create wider pass bands are excellent advantages of our Faraday filter over Fabry-Perot filters.
V Conclusion
We have shown measurements of the absorption and Verdet coefficients in InSb with a range of carrier concentrations and three crystal orientations. These measurements are in agreement with claims in the literature regarding the variation of effective mass with carrier concentration and the nature of the free-carrier absorption in polar semiconductors Jensen (1973b, a); Boord et al. (1974); Smith et al. (1959); Stradling and Wood (1970). We calculated a FOM for the Faraday rotation performance and drew a general conclusion about its dispersion and correspondence to the electrical mobility, namely that a one-to-two relationship cannot generally be drawn between the mobility and the FOM as the Drude model predicts (Equation 3). The dispersion of the FOM, in particular, has gone unnoticed in previous literature. Development of materials for a prototype bandpass filter demonstrated that selection of ideal doping parameters for applications across the LWIR requires additional consideration of competing absorption mechanisms in InSb (optical phonons) and the Moss-Burstein shift of the optical band gap. Our device utilizes the dispersion of the Verdet coefficient to create tunability of the pass band via the magnetic field, laying the foundation for future photonic devices in the LWIR that require wavelength-selective imaging or optical isolation.
Acknowledgements.
NP and DC are indebted to Kevin Grossklaus of Tufts University for assistance with Hall effect and ellipsometry measurements as well as insightful discussions. Hall effect measurements and ellipsometry were carried out at the Tufts Epitaxial Core Facility on equipment supported by the United States Office of Naval Research (ONR DURIP N00014-17-1-2591). CAR and JH gratefully acknowledge funding from The Charles Stark Draper Laboratory, Inc.References
- Ukhanov (1974) Y. Ukhanov, Sov. Phys. Usp. 16, 236 (1974).
- Boord et al. (1974) W. Boord, Yoh-Han Pao, F. Phelps, and P. Claspy, IEEE Journal of Quantum Electronics 10, 273 (1974).
- Hilico et al. (2011) L. Hilico, A. Douillet, J.-P. Karr, and E. Tournié, Review of Scientific Instruments 82, 096106 (2011), https://doi.org/10.1063/1.3640004 .
- Tomasetta et al. (1979) L. Tomasetta, W. Bicknell, and D. Bates, IEEE Journal of Quantum Electronics 15, 266 (1979).
- Smith et al. (1959) S. Smith, T. Moss, and K. Taylor, Journal of Physics and Chemistry of Solids 11, 131–139 (1959).
- Böer and Pohl (2018) K. W. Böer and U. W. Pohl, Semiconductor Physics, Springer Reference (Springer, 2018).
- Lax and Nishina (1961) B. Lax and Y. Nishina, Physical Review Letters 6, 464–467 (1961).
- Jensen (1971) B. Jensen, Solid State Communications 9, 1587–1589 (1971).
- Gupta (2008) N. Gupta, Proc. of SPIE 6940 (2008), 10.1117/12.777110.
- Rogalski and Chrzanowski (2014) A. Rogalski and K. Chrzanowski, Metrology and Measurement Systems 21, 565–618 (2014).
- Spitzer and Fan (1957) W. G. Spitzer and H. Y. Fan, Physical Review 106, 882–890 (1957).
- Adachi (1989) S. Adachi, Journal of Applied Physics 66, 6030–6040 (1989).
- Jung et al. (1991) Y. J. Jung, M. K. Park, S. I. Tae, K. H. Lee, and H. J. Lee, Journal of Applied Physics 69, 3109–3114 (1991).
- Kane (1957) E. O. Kane, Journal of Physics and Chemistry of Solids 1, 249–261 (1957).
- Jensen (1973a) B. Jensen, Annals of Physics 80, 284–360 (1973a).
- Basov (1976) N. Basov, ed., Optical Properties of Semiconductors, The Lebedev Physics Institute Series, Vol. 75 (Plenum Publishing Company, 1976).
- Kurnick and Powell (1959) S. W. Kurnick and J. M. Powell, Physical Review 116, 597–604 (1959).
- Kittel (2005) C. Kittel, Introduction to solid state physics, 8th ed. (Wiley, 2005).
- Dresselhaus (2001) M. Dresselhaus, “Optical properties of solids,” in Solid-State Physics, Vol. 2 (2001) p. 253.
- Haga and Kimura (1963) E. Haga and H. Kimura, Journal of the Physical Society of Japan 18 (1963).
- Jensen (1973b) B. Jensen, Journal of Physics and Chemistry of Solids 34, 2235 (1973b).
- Jensen (1979) B. Jensen, Journal of Applied Physics 50, 5800–5804 (1979).
- Filipchenko et al. (1972) A. S. Filipchenko, D. N. Nasledov, L. N. Radaikina, and I. I. Ratner, Physica Status Solidi (a) 14, 71–75 (1972).
- Tuohiniemi et al. (2012) M. Tuohiniemi, M. Blomberg, A. Akujärvi, J. Antila, and H. Saari, Journal of Micromechanics and Microengineering 22, 115004 (2012).
- Tuohiniemi et al. (2013) M. Tuohiniemi, A. Näsilä, and J. Mäkynen, Journal of Micromechanics and Microengineering 23, 075011 (2013).
- Stradling and Wood (1970) R. A. Stradling and R. A. Wood, Journal of Physics C: Solid State Physics 3, L94–L99 (1970).
Magneto-Optical Properties of InSb for Infrared Spectral Filtering Nolan Peard Dennis Callahan Joy C. Perkinson Qingyang Du Neil S. Patel Takian Fakhrul John LeBlanc Caroline A. Ross Juejun Hu Christine Y. Wang
VI Supporting Information
VI.1 Data Analysis
Figure 10 shows an example of fitting detector intensity data via orthogonal distance regression to account for measurement uncertainties in polarizer angle and magnetic field strength.
VI.2 Effective Mass
Figure 11 shows the variation in the effective mass with the wavelength of the probe radiation used to measure the Verdet coefficient. Figure 11 was presented previously in the main text.
VI.3 Dispersion of the Refractive Index
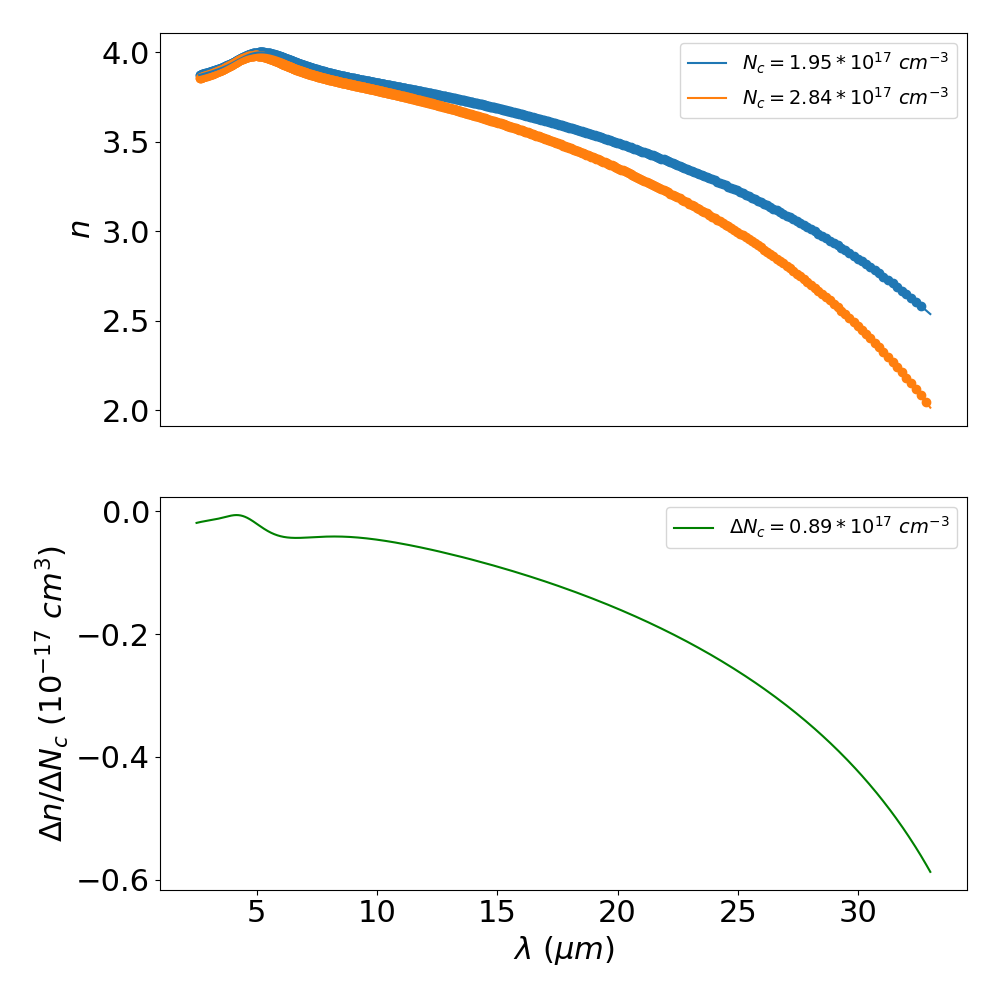
We used an IR-VASE ellipsometer to determine whether there is a significant dispersion of the real refractive index, , and to verify that our FTIR absorption measurements are realistic. One side of each sample was roughened to prevent back-reflection and was illuminated with an elliptically polarized light at an incident angle in the vicinity of Brewster angle. The reflected light intensity and phase were subsequently recorded and analyzed to extract the optical constants of the materials. Results are shown in Figures 12 and 13.
Although ellipsometry is commonly used to determine the absorption coefficient, we found that the imaginary refractive index of InSb is too small to be measured reliably even with the best ellipsometry methods. The measured signal for absorption falls below the noise floor of our instrument and so measurements of the absolute absorption in the transparent region of InSb between were not possible with this method. Since it has greater sensitivity, FTIR was used for the absorption measurements in a transmission geometry. However, to calculate the absorption coefficient (), knowledge of the real refractive index is required at all relevant wavelengths. InSb is a high index material () and ellipsometry proved to be a very effective method for measuring . The optical band edge can be determined from the absorption measurements in ellipsometry where the absorption rises above the noise floor of the instrument near the band edge.
Using the true in calculations of the absorption coefficient in Figure 13 resulted in very small changes in the absolute magnitude of and the order parameter in Figure 14 such that the assumption of a constant in the main text provided accurate results in the free-carrier regime, despite the use of many samples with different carrier concentrations (and dispersion of ).