33email: punithak@ualberta.ca
Fully automated deep learning based segmentation of normal, infarcted and edema regions from multiple cardiac MRI sequences
Abstract
Myocardial characterization is essential for patients with myocardial infarction and other myocardial diseases, and the assessment is often performed using cardiac magnetic resonance (CMR) sequences. In this study, we propose a fully automated approach using deep convolutional neural networks (CNN) for cardiac pathology segmentation, including left ventricular (LV) blood pool, right ventricular blood pool, LV normal myocardium, LV myocardial edema (ME) and LV myocardial scars (MS). The input to the network consists of three CMR sequences, namely, late gadolinium enhancement (LGE), T2 and balanced steady state free precession (bSSFP). The proposed approach utilized the data provided by the MyoPS challenge hosted by MICCAI 2020 in conjunction with STACOM. The training set for the CNN model consists of images acquired from 25 cases, and the gold standard labels are provided by trained raters and validated by radiologists. The proposed approach introduces a data augmentation module, linear encoder and decoder module and a network module to increase the number of training samples and improve the prediction accuracy for LV ME and MS. The proposed approach is evaluated by the challenge organizers with a test set including 20 cases and achieves a mean dice score of for LV MS and for LV ME+MS.
Keywords:
Cardiac magnetic resonance imaging Deep convolutional neural network Myocardial edema and scar Image segmentation.1 Introduction
The imaging-based assessment of the heart using modalities such as magnetic resonance imaging (MRI) plays a central role in the diagnosis of cardiac disease, a leading cause of death worldwide. Late gadolinium-enhanced (LGE) imaging is one of the commonly used cardiac magnetic resonance (CMR) sequences to diagnose myocardial infarction [2], a common cardiac disease that may lead to heart failure. Acute injury or inflammation related to other conditions can be detected using T2-weighted CMR. However, detecting ventricular boundaries using the LGE or T2-weighted images is challenging, while this function can more easily be performed using a balanced steady state free precession (bSSFP) sequences. Often many cardiac patients are scanned using multiple CMR sequences, and utilizing the combination of these sequences will allow for obtaining robust and accurate diagnostic information [15].
The target of this study is to combine the multi-sequence CMR data to produce an accurate segmentation of cardiac regions including left ventricular (LV) blood pool (BP), right ventricular BP, LV normal myocardium (NM), LV myocardial edema (ME) and LV myocardial scars (MS) and specifically focus on classifying myocardial pathology. Generally, the myocardium region could be divided into normal, infarcted and edematous regions. Generating accurate contour for these regions is arduous, time-consuming and thus automating the segmentation process is of great interest [10]. Zabihollahy et al. [11] proposed a semiautomatic tool for LV scar segmentation using CNNs. Li et al. [6] proposed a fully automatic tool for left atrial scar segmentation.
In this challenge, there are mainly two difficulties to produce an accurate prediction of the LV ME and MS. The first difficulty is the limited amount of training data which only consists of 25 cases. The second is the small size of the LV ME and MS regions with high intra and inter-subject variations. The inter-observer variation of manual scar segmentation is reported with a Dice score of [15].
In this study, we propose a fully automated approach by utilizing deep convolutional neural networks to delineate the LV BP, RV BP, LV NM, LV ME and LV MS regions from multi-sequence CMR data including bSSFP, LGE and T2. Our main contributions are the following: 1) we introduce a data augmentation module and increase the training size by 40 times using random warping and rotation; 2) we introduce a linear encoder and decoder to improve the network’s training performance and utilize three different architectures including a shallow version of the standard U-net [7], Mask-RCNN [3] and U-net++[12, 13] for the LV ME and LV MS block and average the predictions of the three networks followed by a binary activation with threshold 0.5. Our method is evaluated by the challenge organizers on a test set consisting of 20 cases, which contain images acquired from scanners that are not included in the training set.
2 Methodology
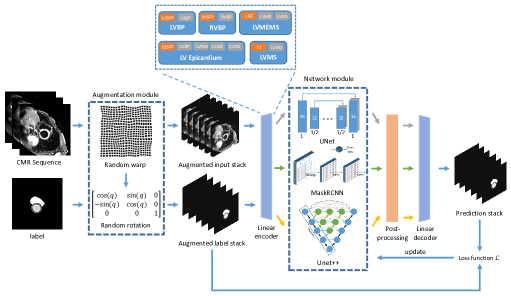
We introduce the pipeline shown in Fig. 1 for the LV, ME and MS segmentation. The proposed method is fully automatic and utilized no additional data other than the training set provided by the challenge organizers. The details of each module are introduced in the following sections.
2.1 Augmentation module
We first extract the input data in a slice-by-slice manner and perform center cropping to obtain images of size . To improve the number of samples, we perform two data augmentation schemes including random warping and random rotation. The random warping is performed by firstly generating a uniformly distributed random matrix, where the last dimension indicates 2D space, with each entry in range . We then resize the non-rigid warping matrix to the image size with dimension and apply the warping map using bilinear interpolation. The extracted input CMR slices and the labels are warped 20 times. After augmenting the data using random warping, we then utilize random rotation in , and with equal probability. The training set is then augmented with one time more data with random choice among the three options.
2.2 Preprocessing
All training and validation images are normalized using and percentile values, and , of the intensity distribution of the 2D data to obtain relatively uniform training sets. The normalized intensity value, , is computed using where denotes the original pixel intensity.
2.3 Linear encoder
We introduce a linear encoder and a corresponding decoder for the augmented input stack after preprocessing. Inspired by the clinical observation in [15], we encode the augmented input and label stacks and produce five input blocks as shown in Fig. 1 instead of blindly concatenating the CMR sequences, where each block represents the data used to train a target class. The five input blocks are LVBP block, which uses bSSFP as the input image and LV BP as the target; RVBP block, which uses bSSFP as the input and RV BP as the target; LV Epicardium block, which uses bSSFP as the input and the linear combination of LV BP, LV NM, LV ME and LV MS as the target; LVMEMS block, which uses LGE as the input and the combination of LV ME and LV MS as the target; and the LVMS block, which uses the T2 as the input and LV MS as the target. In the testing mode, the linear encoder will only perform on the input stack. The network module will infer on the encoded input and the decoder will extract the predictions after post-processing.
2.4 Network module
In order to improve the performance for the edema and scar prediction, we utilize three different architectures with different input blocks for each model. The results are averaged from the three networks for LV ME+MS and LV MS and followed by a binary activation with threshold 0.5. The details for each network are shown in the following.
2.4.1 U-net
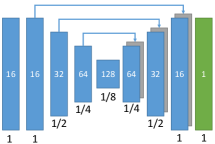
The U-net module utilizes a shallow version shown in Fig. 2 of the standard U-net [7] to prevent overfitting. The U-net is trained on all the five input blocks produced by the linear encoder. The loss function of the U-net is selected as the negative of dice coefficient with Adam optimizer (learning rate = ) and batch size = .
2.4.2 Mask-RCNN:
2.4.3 U-net++:
2.5 Post-processing
We applied post-processing to retain only the largest connected component for the predictions of LV BP and LV Epicardium by U-net. The operation is performed in 2D space with a slice-by-slice manner. In addition, we applied an operation to remove holes that appear inside the foreground masks. As shown in Fig. 1, the post-processing is performed on the encoded predictions before the linear decoder.
2.6 Linear decoder
The corresponding decoder performs the linear subtraction on the predicted masks of LV Epicardium and LVMEMS and is followed by a binary activation for all predicted masks in five target classes with threshold 0.5. The decoder also includes a binary constraint for the LV ME and MS predictions by calculating the myocardium mask using the predicted LV epicardium and LV BP and performing a pixelwise multiplication
| (1) |
where denotes the index for LVBP block, RVBP block, LV Epicardium block, LVMEMS block, LVMS block respectively. denotes the final prediction mask and denotes the raw prediction after post-processing for block . denotes the binary activation function with threshold 0.5. The notation denotes the pixelwise multiplication.
3 Experiments
3.1 Clinical data
The training set consists of 25 cases of multi-sequence CMR and each refers to a patient with three sequence CMR including bSSFP, LGE and T2. The training data is processed using the MvMM method [14, 15]. The training set labels include LV BP (labelled 500), RV BP (600), LV NM (200), LV ME (1220) and LV MS (2221). The manual segmentation is performed by trained examiners and corrected by experienced radiologists. The test set consists of another 20 cases of multi-squence CMR and the ground truth is not provided.
3.2 Implementation details
The networks are implemented using Python programming language with Keras and Tensorflow. All networks are trained with 500 epochs on NVIDIA Tesla–P100 graphical processing units with 12 GB memory. The trained neural network model with the highest validation accuracy is saved to the disk. The validation split is 0.8 for all networks with 3264 images for training and 816 images for validation after the data augmentation module. The original extracted 2D slices from the training data provided by challenge organizers contain 102 images.
3.3 Evaluation metrics
3.3.1 Dice coefficient
DC measures the overlap between two delineated regions [9]:
| (2) |
where set as the automatic prediction region and set as manual segmentation ground truth.
3.3.2 Jaccard index
Jaccard index measures the similarity and diversity between two delineated regions [5]:
| (3) |
4 Results
The proposed method is evaluated over images acquired from a total of 20 cases including CMR sequences consists of bSSFP, LGE and T2. The evaluation of the proposed method on test sets are performed by the challenge organizers with dice score on LV ME+MS and LV MS. The ground truth of the test sets are not shared with the participants.
4.1 Quantitative assessment
| Methods | Dice metric (%) | Jaccard index(%) | ||
|---|---|---|---|---|
| MS | ME+MS | MS | ME+MS | |
| UNet | ||||
| Proposed† | ||||
| Proposed | ||||
| † indicates without the linear encoder and decoder module. | ||||
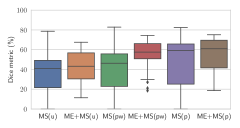
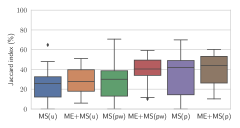
The agreement between the segmentation of the proposed approach with the manual ground truth is quantitatively evaluated using the dice metric and Jaccard index. To illustrate the effectiveness of the network module and the linear encoder and decoder, we report the performance of the UNet, proposed method without the linear encoder and decoder, and the proposed method in Table. 1. The best result for the test set achieves a mean dice score of for LV MS and for LV ME+MS. Our proposed network module improves the overall performance of MS and ME+MS by comparing our proposed method without the linear encoder and decoder with the UNet. Our proposed linear encoder and decoder module further improves the performance especially in the MS segmentation. Fig. 3 shows the performance of the three methods using box plots.
 |
 |
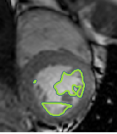
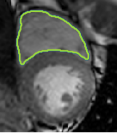
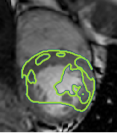
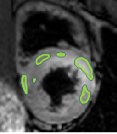
4.2 Visual assessment
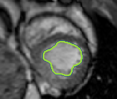
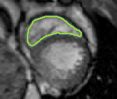
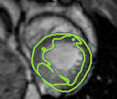
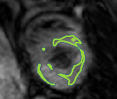
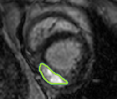
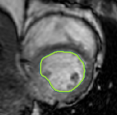
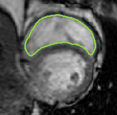
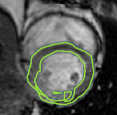
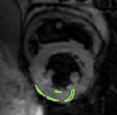
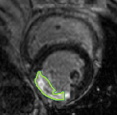
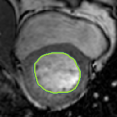
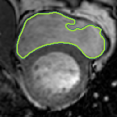
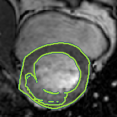
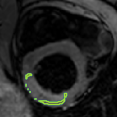
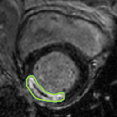
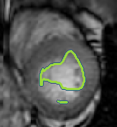
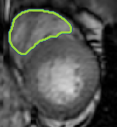
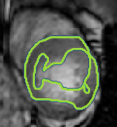
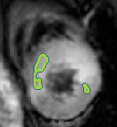
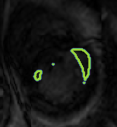
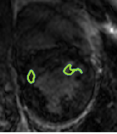
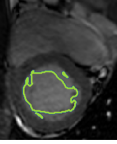
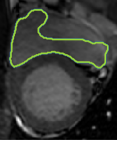
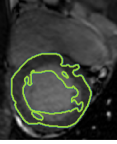
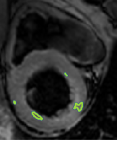
We select the case that achieves the highest and lowest dice score for visual assessment. Fig. 4 shows example segmentation results where the proposed method achieved the highest agreement with the ground truth delineations. Fig. 5 shows example segmentation results where the proposed method achieved the lowest agreement with the ground truth delineations.
 |
 |
 |
 |
 |
 |
 |
 |
 |
 |
 |
 |
 |
 |
 |
| (a) LV BG | (b) RV BG | (c) LV NM | (d) LV ME | (e) LV MS |
5 Conclusion
We proposed a fully automated approach to segment the LV ME and LV MS from multi-sequence CMR data. We introduce an augmentation module to enhance the training set and a linear encoder and decoder along with a network module to improve the segmentation performance. The algorithm is trained using the 25 cases provided by the challenge and the evaluation is performed by the challenge organizers on another 20 cases which are not included in the training set. The proposed method yielded a overall mean dice metric of , for LV ME and LV ME+MS delineations.
 |
 |
 |
 |
 |
 |
 |
 |
 |
 |
 |
 |
 |
 |
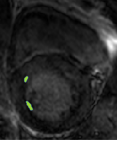 |
| (a) LV BG | (b) RV BG | (c) LV NM | (d) LV ME | (e) LV MS |
6 Acknowledgment
The authors wish to thank the challenge organizers for providing training and test datasets as well as performing the algorithm evaluation. The authors of this paper declare that the segmentation method they implemented for participation in the MyoPS 2020 challenge has not used additional MRI datasets other than those provided by the organizers. The authors would wish to acknowledge Compute Canada for providing the computation resource.
References
- [1] Abdulla, W.: Mask R-CNN for object detection and instance segmentation on keras and tensorflow. https://github.com/matterport/Mask_RCNN (2017)
- [2] Arai, A.E.: Magnetic resonance imaging for area at risk, myocardial infarction, and myocardial salvage. Journal of Cardiovascular Pharmacology and Therapeutics 16(3-4), 313–320 (2011)
- [3] He, K., Gkioxari, G., Dollár, P., Girshick, R.: Mask R-CNN. In: Proceedings of the IEEE International Conference on Computer Vision. pp. 2961–2969 (2017)
- [4] He, K., Zhang, X., Ren, S., Sun, J.: Deep residual learning for image recognition. In: Proceedings of the IEEE Conference on Computer Vision and Pattern Recognition. pp. 770–778 (2016)
- [5] Jaccard, P.: The distribution of the flora in the alpine zone. 1. New Phytologist 11(2), 37–50 (1912)
- [6] Li, L., Wu, F., Yang, G., Xu, L., Wong, T., Mohiaddin, R., Firmin, D., Keegan, J., Zhuang, X.: Atrial scar quantification via multi-scale cnn in the graph-cuts framework. Medical Image Analysis 60, 101595 (2020)
- [7] Ronneberger, O., Fischer, P., Brox, T.: U-net: Convolutional networks for biomedical image segmentation. In: International Conference on Medical Image Computing and Computer-Assisted Intervention. pp. 234–241. Springer (2015)
- [8] Simonyan, K., Zisserman, A.: Very deep convolutional networks for large-scale image recognition. arXiv preprint arXiv:1409.1556 (2014)
- [9] Sørensen, T.J.: A method of establishing groups of equal amplitude in plant sociology based on similarity of species content and its application to analyses of the vegetation on Danish commons. I kommission hos E. Munksgaard (1948)
- [10] Ukwatta, E., Arevalo, H., Li, K., Yuan, J., Qiu, W., Malamas, P., Wu, K.C., Trayanova, N.A., Vadakkumpadan, F.: Myocardial infarct segmentation from magnetic resonance images for personalized modeling of cardiac electrophysiology. IEEE Transactions on Medical Imaging 35(6), 1408–1419 (2016)
- [11] Zabihollahy, F., White, J.A., Ukwatta, E.: Convolutional neural network-based approach for segmentation of left ventricle myocardial scar from 3d late gadolinium enhancement mr images. Medical Physics 46(4), 1740–1751 (2019)
- [12] Zhou, Z., Siddiquee, M.M.R., Tajbakhsh, N., Liang, J.: UNet++: A nested U-Net architecture for medical image segmentation. In: Deep Learning in Medical Image Analysis and Multimodal Learning for Clinical Decision Support, pp. 3–11. Springer (2018)
- [13] Zhou, Z., Siddiquee, M.M.R., Tajbakhsh, N., Liang, J.: Unet++: Redesigning skip connections to exploit multiscale features in image segmentation. IEEE Transactions on Medical Imaging (2019)
- [14] Zhuang, X.: Multivariate mixture model for cardiac segmentation from multi-sequence MRI. In: International Conference on Medical Image Computing and Computer-Assisted Intervention. pp. 581–588. Springer (2016)
- [15] Zhuang, X.: Multivariate mixture model for myocardial segmentation combining multi-source images. IEEE Transactions on Pattern Analysis and Machine Intelligence 41(12), 2933–2946 (2018)