Hydrogen Supply Chain Planning with Flexible Transmission and Storage Scheduling: Supporting Information
1 Transportation Demand
1.1 Average Hydrogen Refuelling Demand
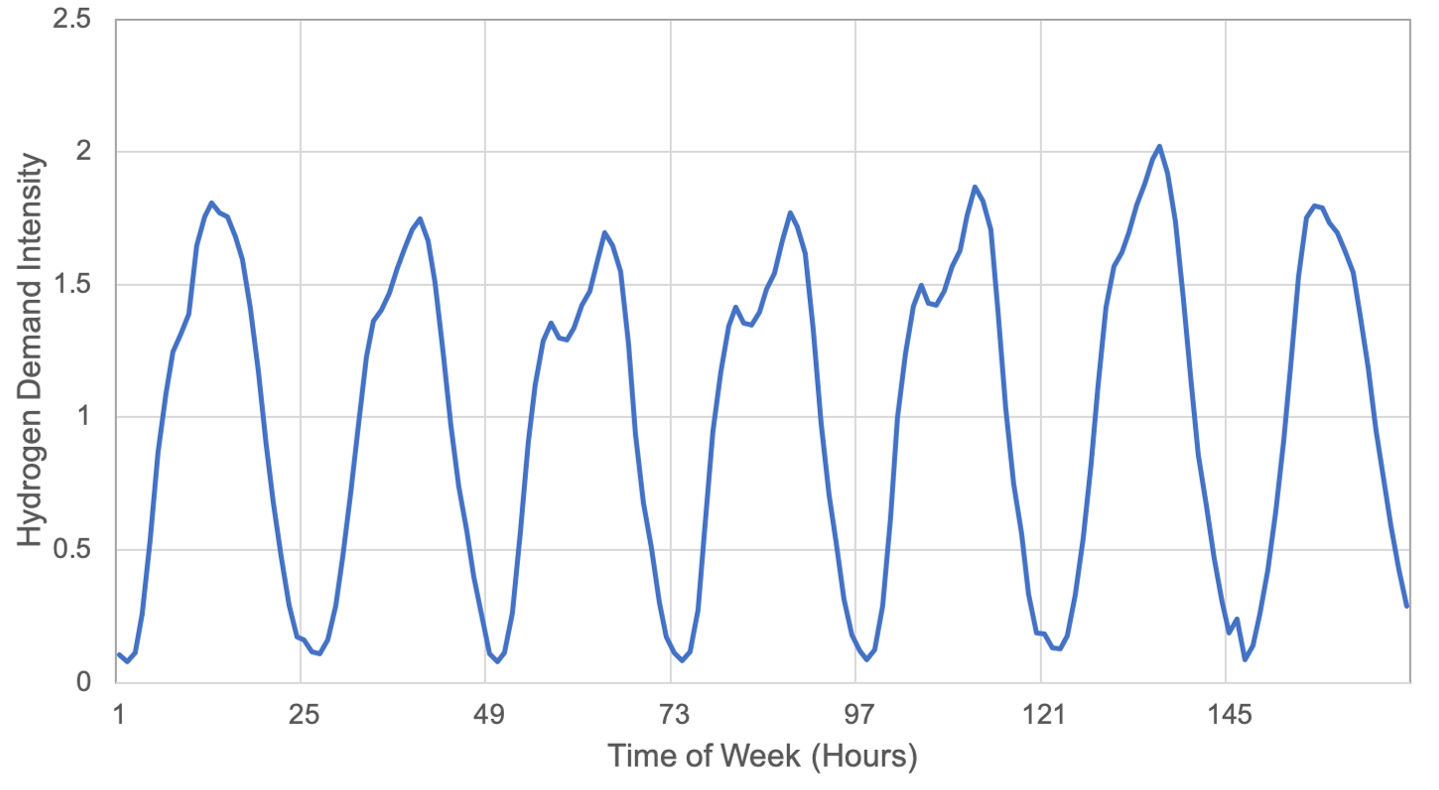
1.2 Hydrogen Refuelling Profile
1.3 Hydrogen Demand Profile Calculation
: the sum of LDV and HDV demands, as shown in Table. S1
: hydrogen refuelling profile, as shown in Fig. S1
| (1) |
2 Inter Zone Distances
| Zone | 1 | 2 | 3 | 4 | 5 | 6 |
|---|---|---|---|---|---|---|
| 1 | 0 | 317 | 504 | 602 | 487 | 608 |
| 2 | 317 | 0 | 199 | 297 | 179 | 340 |
| 3 | 504 | 199 | 0 | 99 | 158 | 333 |
| 4 | 602 | 297 | 99 | 0 | 216 | 358 |
| 5 | 487 | 179 | 158 | 216 | 0 | 186 |
| 6 | 608 | 340 | 333 | 358 | 186 | 0 |
3 Electricity Price Profiles
Description:
-
1.
Power system capacity expansion model used to generate prices for each zone and hour of the year (http://energy.mit.edu/eps/tools/genx/)
-
2.
Greenfield setup considered for capacity expansion. Existing capacity considered for hydro, pumped storage and transmission infrastructure
-
3.
20 representative weeks are modelled for annual operations, based on methods described in [3]
-
4.
Capacity expansion in transmission of electricity is not allowed in the base case model
Load Data:
2018 NREL electrification futures study (EFS) projected load for 2050 with assumed BAU technology advancement and reference electrification.
Reference: https://data.nrel.gov/files/126/EFSLoadProfile_Reference_Moderate.zip
Resource Characterization:
-
1.
Renewable Data Source: NREL Wind Toolkit (onshore and offshore wind) and National Solar Radiation database (solar)
-
2.
Offshore wind is included with no capacity limits and single resource profile for zone 2 and zone 4 based on sampling sites from the NREL Wind Toolkit that overlaps with the areas for which leases have been auctioned
-
3.
Three types of hydropower resources included in the model: Reservoir hydro (with flexible generation and constraints on weekly energy generation limits), run-of-river hydro (inflexible generation) and Canadian hydro imports (Zone 7, flexibile with weekly energy generation limits)
3.1 Power System Technology Cost and Performance Assumptions
| Technology | Capital Cost | Capital Cost | Lifetime | Fixed O&M Cost | Fixed O&M Cost | Variable O&M Cost |
| $/MW | $/MWh | year | $/(MW-year) | $/(MWh-year) | ($/MWh) | |
| Onshore Wind | 1,085,886 | - | 30 | 34,568 | - | 0 |
| Offshore Wind | 1,901,981 | - | 30 | 48,215 | - | 0 |
| Utility-Scale Solar | 724,723 | - | 30 | 11,153 | - | 0 |
| Li-ion Battery | 120,540 | 125870 | 15 | 2,452 | 3071 | 0.03 |
| Pumped Hydro | 1,966,151 | - | 50 | 41,000 | - | 0.02 |
| CCGT | 816,971 | - | 30 | 10,560 | - | 2.77 |
| OCGT | 815,863 | - | 30 | 12,230 | - | 7.14 |
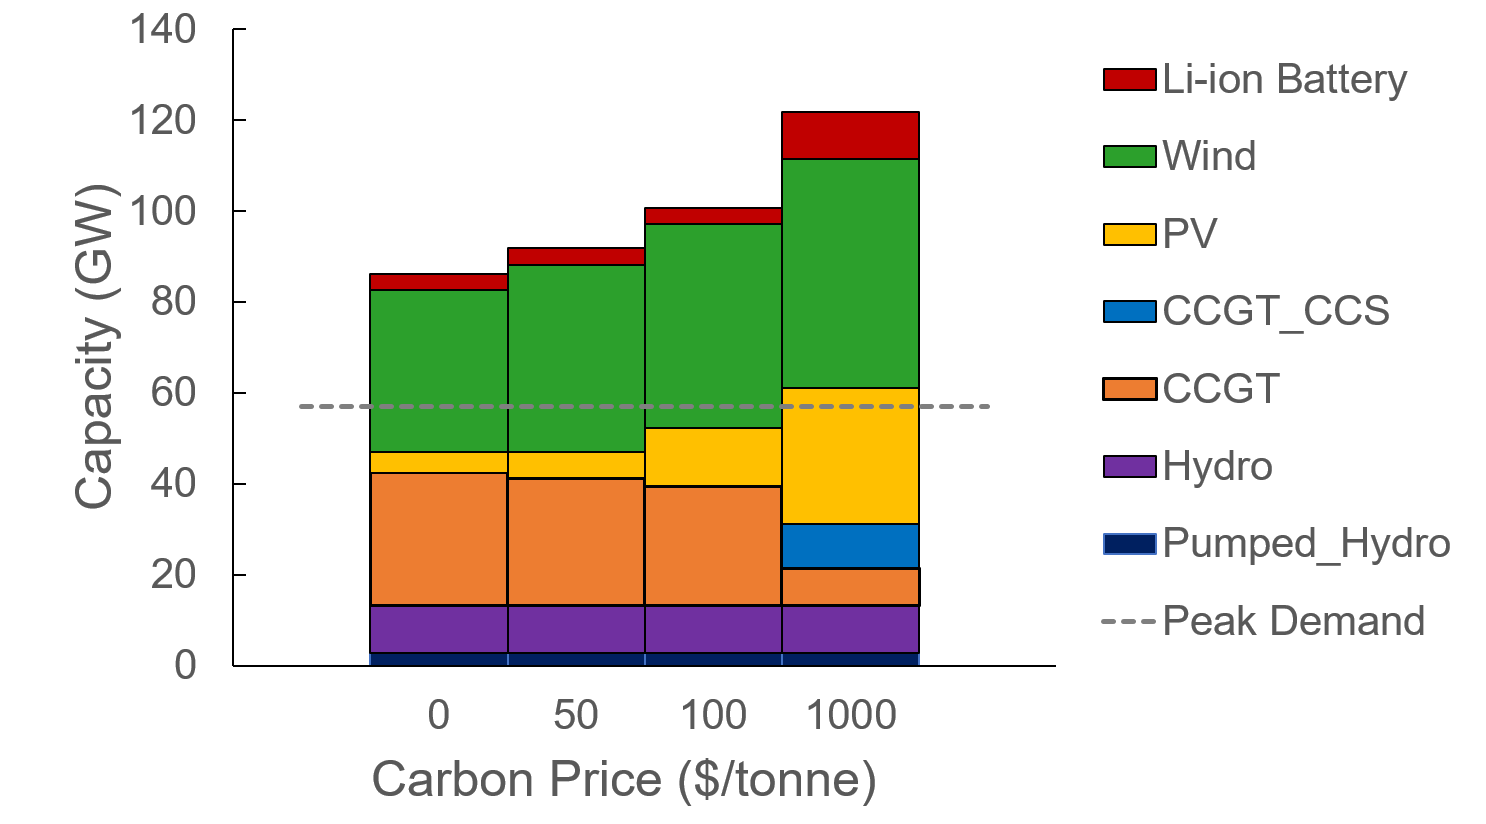
3.2 Power System Capacity Mix
4 Hydrogen Generation Cost and Performance Parameters
5 Hydrogen Transmission and Storage Parameters
| Pipeline | Gas Tank | ||
| (M$/mile) | 2.8 | (M$/tonne) | 0.58 |
| (tonne/mile) | 0.3 | Lifetime (year) | 12 |
| Lifetime (year) | 40 | ($/(tonne/hour)) | 0.5 |
| ($/mile-unit) | 700 | (MWh/tonne) | 2 |
| ($/unit) | 0.75 | ||
| (MWh/tonne-mile) | 1 | ||
| (MWh/tonne) | 1 | ||
| 0 | |||
| Liquid Truck | Gas Truck | ||
| (tonne) | 4 | (tonne) | 0.3 |
| (M$/mile) | 0.8 | (M$/mile) | 0.3 |
| ($/mile) | 1.5 | ($/mile) | 1.5 |
| 0 | 3% | ||
| Lifetime (year) | 12 | Lifetime (year) | 12 |
| ($/(tonne/hour)) | 32 | ($/(tonne/hour)) | 1.5 |
| (MWh/tonne) | 11 | (MWh/tonne) | 1 |
Supplemental References
- [1] “Freight analysis framework version 4,” Oak Ridge National Laboratory, Tech. Rep., 2019. [Online]. Available: https://faf.ornl.gov/fafweb/
- [2] U. EPA, United States: Heavy-Duty Vehicles: GHG Emissions & Fuel Economy, 2017. [Online]. Available: https://dieselnet.com/standards/us/fe_hd.php
- [3] D. S. Mallapragada, N. A. Sepulveda, and J. D. Jenkins, “Long-run system value of battery energy storage in future grids with increasing wind and solar generation,” Appl. Energy, vol. 275, p. 115390, 2020. [Online]. Available: http://www.sciencedirect.com/science/article/pii/S0306261920309028
- [4] IEA, “The future of hydrogen,” Tech. Rep., 2019. [Online]. Available: https://www.iea.org/reports/the-future-of-hydrogen
- [5] “Techno-economic evaluation of SMR based standalone(merchant) plant with CCS,” IEA-Greenhouse Gas Technology Collaboration Programme, Tech. Rep., 2017. [Online]. Available: https://ieaghg.org/exco_docs/2017-02.pdf
- [6] A. Mayyas and M. Mann, “Manufacturing competitiveness analysis for hydrogen refueling stations and electrolyzers,” Tech. Rep., 2018. [Online]. Available: https://www.hydrogen.energy.gov/pdfs/review18/mn017_mann_2018_p.pdf
- [7] NREL, “H2A: Hydrogen analysis production case studies,” 2018. [Online]. Available: https://www.nrel.gov/hydrogen/h2a-production-case-studies.html
- [8] J. Proost, “State-of-the art capex data for water electrolysers, and their impact on renewable hydrogen price settings,” Int. J. Hydrog. Energy, vol. 44, no. 9, pp. 4406 – 4413, 2019, european Fuel Cell Conference & Exhibition 2017.
- [9] C. Yang and J. Ogden, “Determining the lowest-cost hydrogen delivery mode,” Int. J. Hydrog. Energy, vol. 32, no. 2, pp. 268–286, 2007.
- [10] S. Schoenung, “Economic analysis of large-scale hydrogen storage for renewable utility applications,” Sandia National Laboratories, Report, 2011.
- [11] J. R. Fekete, J. W. Sowards, and R. L. Amaro, “Economic impact of applying high strength steels in hydrogen gas pipelines,” Int. J. Hydrog. Energy, vol. 40, no. 33, pp. 10 547 – 10 558, 2015.
- [12] “North american midstream infrastructure through 2035 - a secure energy future report,” The INGAA Foundation, Inc., Tech. Rep., 2014. [Online]. Available: https://www.ingaa.org/Foundation/Foundation-Reports/Studies/14904/14889.aspx
- [13] S. Samsatli and N. J. Samsatli, “A multi-objective MILP model for the design and operation of future integrated multi-vector energy networks capturing detailed spatio-temporal dependencies,” Appl. Energy, vol. 220, pp. 893–920, Jun. 2018.