Host immune response driving SARS-CoV-2 evolution
Abstract
The transmission and evolution of severe acute respiratory syndrome coronavirus 2 (SARS-CoV-2) are of paramount importance to the controlling and combating of coronavirus disease 2019 (COVID‑19) pandemic. Currently, near 15,000 SARS-CoV-2 single mutations have been recorded, having a great ramification to the development of diagnostics, vaccines, antibody therapies, and drugs. However, little is known about SARS-CoV-2 evolutionary characteristics and general trend. In this work, we present a comprehensive genotyping analysis of existing SARS-CoV-2 mutations. We reveal that host immune response via APOBEC and ADAR gene editing gives rise to near 65% of recorded mutations. Additionally, we show that children under age five and the elderly may be at high risk from COVID-19 because of their overreacting to the viral infection. Moreover, we uncover that populations of Oceania and Africa react significantly more intensively to SARS-CoV-2 infection than those of Europe and Asia, which may explain why African Americans were shown to be at increased risk of dying from COVID-19, in addition to their high risk of getting sick from COVID-19 caused by systemic health and social inequities. Finally, our study indicates that for two viral genome sequences of the same origin, their evolution order may be determined from the ratio of mutation type CT over TC.
1 Introduction
The ongoing raging outbreak of coronavirus disease 2019 (COVID‑19) caused by severe acute respiratory syndrome coronavirus 2 (SARS-CoV-2) has led to tremendous human mortality and economic hardship. As of July 31, 2020, over 17106007 confirmed COVID-19 cases had been reported worldwide and 668910 deaths have occurred from the disease [1]. To mitigate this devastating pandemic, we have to control its spread by sufficient testing, social distancing, contact tracking, and developing effective diagnosis tools, efficacious antiviral drugs, antibody therapies, and preventive vaccines.
SARS-CoV-2 is a positive-sense single-strand RNA virus that belongs to the beta coronavirus genus [2]. It has a genome size of 29.82 kb, which encodes multiple non-structural and structural proteins. The leader sequence and ORF1ab encode non-structural proteins for RNA replication and transcriptions. The downstream regions of the genome encode structural proteins, including the spike (S) protein, the nucleocapsid (N) protein, the envelope (E) protein, and the membrane (M) protein. All of the four major structural proteins are required to produce a structurally complete viral particle. The S protein mediates viral attachment to host angiotensin-converting enzyme 2 (ACE2) receptor and subsequent fusion between the viral and host cell membranes aided by transmembrane serine protease 2 (TMPRSS2) to allow the entry of viruses into the host cell [3, 4, 5]. The nucleocapsid (N) protein, one of the most abundant viral proteins, binds to the RNA genome and is involved in replication processes, assembly, and host cellular response during viral infection [6].
Mutagenesis is a basic biological process that changes the genetic information of organisms. As a primary source for many kinds of cancer and heritable diseases, mutagenesis maybe fearful but is a driving force for natural evolution [7, 8]. Although viruses are not organisms per se, they are at the edge of life. Our SARS-CoV-2 Mutation Tracker (https://users.math.msu.edu/users/weig/SARS-CoV-2˙Mutation˙Tracker.html) shows that near 15,000 mutations have occurred on SARS-CoV-2 [9]. More than 1000 mutations on the S protein gene have a significant impact on SARS-CoV-2 infectivity [10, 11, 12]. These mutations should be put into the perspective that COVID-19 has globally spread. The geographical and demographical diversity of the viral transmission and exogenous and endogenous genotoxins exposures have stimulated SARS-CoV-2 mutations. If we consider the average number of mutations per genome, SARS-CoV-2 is mutating slower than other viruses, such as the flu and common cold viruses. This is because SARS-CoV-2 belongs to the coronaviridae family and the Nidovirales order, which has a genetic proofreading mechanism in its replication achieved by an enzyme called non-structure protein 14 (NSP14) in synergy with NSP12, i.e., RNA-dependent RNA polymerase (RdRp) [13, 14]. As a result, SARS-CoV-2 has a relatively high fidelity in its transcription and replication process. In general, Coronavirus mutations are created from three major sources, namely, random errors in replication, such as genetic drift and spontaneous genotoxins, viral replication proofreading and defective repair mechanisms, and host immune responses, such as destructive gene editing [15, 11]. Genotyping tracks mutations overpopulation, space, and time, while also providing a method to understand the molecular mechanism of SARS-CoV-2 proteins, protein-protein interactions, and their synergy with host cell proteins, enzymes, and signaling pathways.
The studies of SARS-CoV genomes have so far predominantly focused on understanding genome mutation variants, implications in virus transmissions [16, 17], and ramifications on the development of diagnostics [9, 18], vaccines [19], antibodies [20], and drugs [19].
Although it is difficult to determine the detailed mechanism of every specific mutation, early work on a few initial SARS-CoV-2 strains in Wuhan, China, revealed that hypermutations CT are most likely resulted from the APOBEC (apolipoprotein B mRNA editing enzyme, catalytic polypeptide-like) deamination in RNA editing [21]. In the standard genetic code, all three stop codons, TAA, TAG, and TGA, involve T but not C. Therefore, the gene-editing imposed CT mutations will have a high possibility to terminate the translation of viral proteins, which undermines viral functions and survivability. Both spontaneous CT transitions and APOBEC deamination are regarded as genotoxins and can lead to cancers for humans. There are two well-known deaminase RNA editing mechanisms in human cells: the APOBEC [22] and the ADAR (adenosine deaminases acting on RNA) [23]. The APOBEC enzymes deaminate cytosines into uracils (CU) on single-stranded nucleic acids (ssDNA or ssRNA). It is well established that the human genome encodes activation-induced cytidine deaminases (AIDs) and several homologous APOBEC cytidine deaminases that function in innate immunity as well as in RNA editing [24, 25]. In both innate and adaptive immunity, AID and APOBEC cytidine deaminases modulate immune responses by mutating specific nucleic acid sequences of hosts and pathogens. The ADAR enzymes deaminate adenines into inosines (A-to-I) and result in AG mutation. The significance of A-to-I editing is appreciated for its abundance in both host and viral RNAs. ADAR enzymes play important roles during viral infections. They can have either a proviral or an antiviral consequence, dependent upon the virus-host combination [26, 27].
The APOBEC family proteins play critical functional roles within the adaptive and innate immune system, which involves at early times after the infection [28]. Therefore, the higher ratio of CT mutations may indicate the strong capacity of the host immune system. However, a strong immune response is a double-edged sword. On the one hand, it may help host cells to defeat the virus more efficiently. On the other hand, it can result in a “cytokine storm”, which is a key cause of the death of COVID-19 patients by the exponential growth of inflammation and organ damage [29].
In this work, we analyze a large volume of single nucleotide polymorphisms (SNPs) found in 33693 complete SARS-CoV-2 genome isolates globally. By analyzing the distribution of 12 SNP types, we notice that the ratio of CT mutations is predominately higher than that of the other types of mutations, indicating that hypermutation CT may result from extensive host RNA editing, i.e., the APOBEC deamination. Additionally, we investigate the distribution of 12 SNP types in different age groups, gender groups, and geographic locations to understand whether these hypermutations have the age/gender/demographic preference. Moreover, we provide deep insights into the mutation motif and hot-spot patterns from 13833 single mutations decoded from 33693 complete SARS-CoV-2 genome sequences, revealing mutational signatures and preferred genetic environments. Finally, we hypothesize that virus genomes evolve through host innate immune response imposed gene editing, i.e., CT, and virus protective mechanism-installed defective revisionary mutations, TC. As a result, both CT and TC mutation ratios are usually high. We show that the ratio of CT to TC mutations is higher than the unity in the forward viral evolution, which suggests the master and slave relationship between host gene editing and virus protective mechanism. Therefore, we propose the use of the CT to TC ratio being higher than the unity (1) as the indication of the forward viral evolution direction.
2 Results
To reveal that CT and AG mutations are driven by RNA-APOBEC and RNA-ADAR editing, we first analyze 33693 complete SARS-CoV-2 genome sequences and total 13833 single mutations are found as of July 31, 2020. To be noted, 13833 single mutations are unique mutations, i.e., the same mutation that appears in different SARS-CoV-2 isolates is only counted once. If we count the same mutation in different SARS-CoV-2 isolates repeatedly according to their frequency, then all of the mutations that are detected in the 33693 complete SARS-CoV-2 genome sequences are called non-unique mutations. With the reference sequence of SARS-CoV-2 genome collected on January 5, 2020 [2], we calculate the proportion of 12 SNP types (i.e., AT, AC, AG, TA, TC, TG, CT, CA, CG, GT, GC, GA) worldwide. The unusually high ratios of CT and AG mutations indicate that RNA-APOBEC editing and RNA-ADAR editing are involved in the host immune response to SARS-CoV-2 infection. Additionally, to understand gene-editing preference, we investigate the distribution of 12 SNP types of mutations in different countries/regions, age groups, and gender groups. Furthermore, we decode mutation motifs from the 2-mer and 3-mer sequence contexts to survey the hot-spot patterns and mutational signatures driven by gene-editing. Moreover, we analyze the proportion of 12 SNP types among SARS-CoV, Bat-SL-BM48-31, Bat-SL-CoVZC45, Bat-SL-RaTG13, and SARS-CoV-2. We discover that the viral evolution order can be determined by the ratios of CT/TC. These results are presented in following subsections.
2.1 Host immune response to SARS-CoV-2 infection with gene editing
2.1.1 Global analysis
Table 1 illustrates the proportion of 12 SNP types of SARS-CoV-2 (i.e., AT, AC, AG, TA, TC, TG, CT, CA, CG, GT, GC, GA) in the global. Here we only consider the unique SNPs.
| Type | AT | AC | AG | TA | TC | TG | CT | CA | CG | GT | GC | GA |
|---|---|---|---|---|---|---|---|---|---|---|---|---|
| Ratio | 4.44% | 3.75% | 14.87% | 3.43% | 14.53% | 2.80% | 24.06% | 4.00% | 1.25% | 13.33% | 2.36% | 11.17% |
First, it is noticed that not all SARS-CoV-2 mutations are created equal. Mutation CG only accounts for 1.25%. A few other mutation types, GC, TG, TA, and AC, are not frequent either. If mutations are random, each mutation should have a ratio of 8.3% on average. It can be seen that CT owns the largest proportion (24.06%), which is much higher than the average ratio. Therefore, the hypermutation CT must be driven by additional mechanisms. It is all known that host RNA-APOBEC editing leads to excessive CT transitions.
Moreover, the second most frequent mutation type is AG transition. Its ratio of 14.87% AG is much higher than the average ratio of 8.3%, indicating that RNA-ADAR editing is also involved in the host immune response. Although the high ratios of CT and AG reveal that the immune system is combating with SARS-CoV-2 by two deaminase RNA editing mechanisms, the relatively high ratios of the reversed mutations TC and GA also indicate that SARS-CoV-2 fights back the destructive gene editing using its defective proofreading and repairing mechanisms.
Finally, it is well-known that mutations can be classified into four transition types (i.e., AG, GA, CT, and TC) and eight transversion types. Table 1 shows that all transition types have relatively high ratios. Whereas, all transversion types, except for GT, have relatively low ratios. This is due to the fact that it is easier to substitute a single ring nucleotide structure for another single ring nucleotide structure than to substitute a double ring nucleotide for a single ring nucleotide. Additionally, transitions are more likely to result in silent mutations. Therefore, transversions can be more destructive to viral genomes.
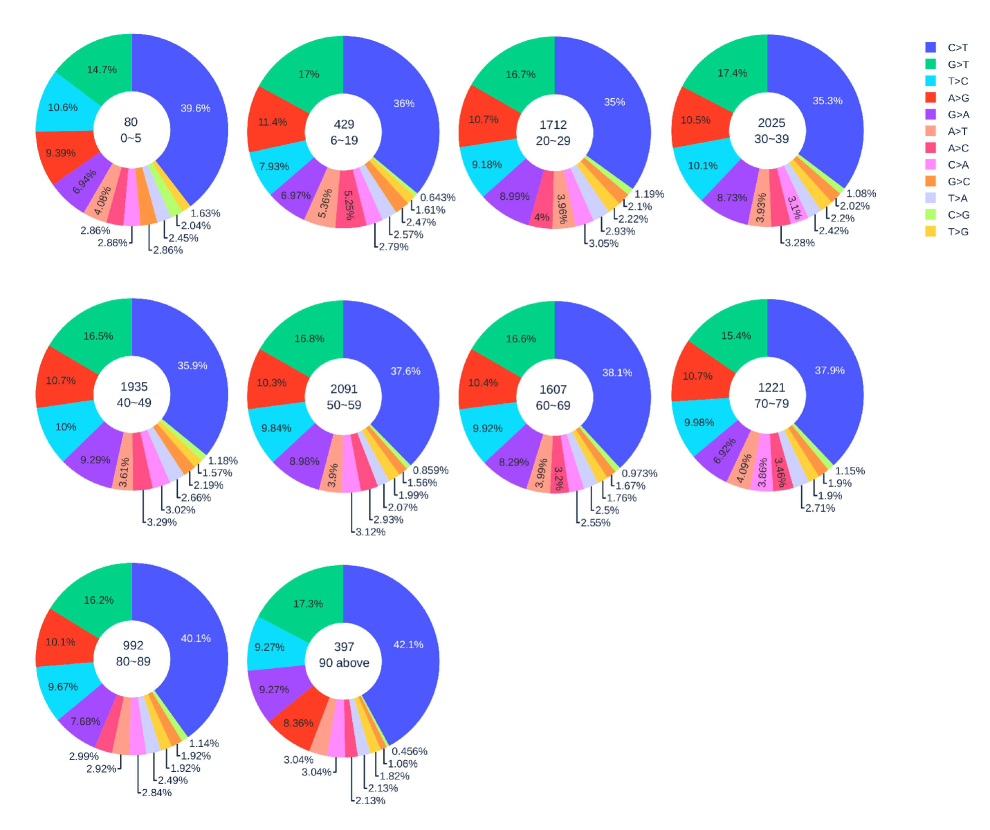
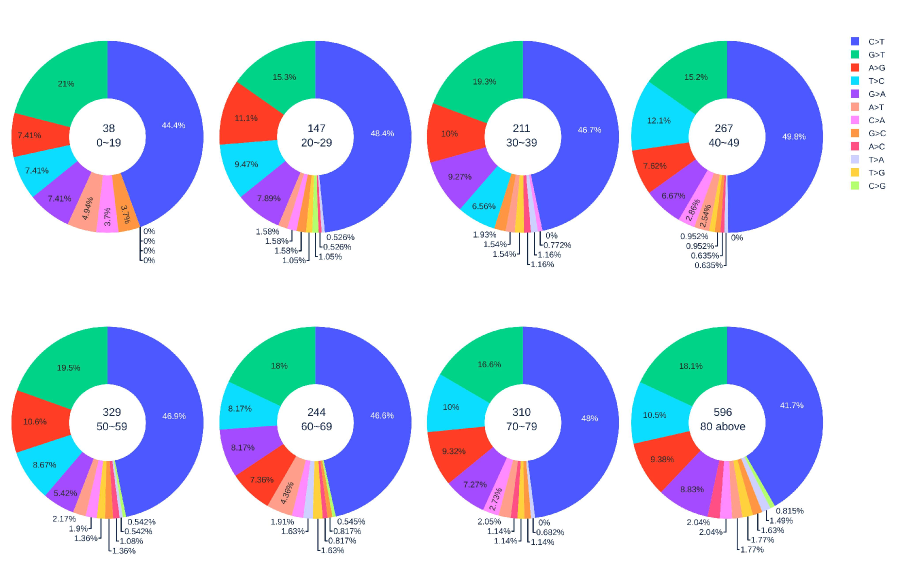
2.1.2 Age analysis
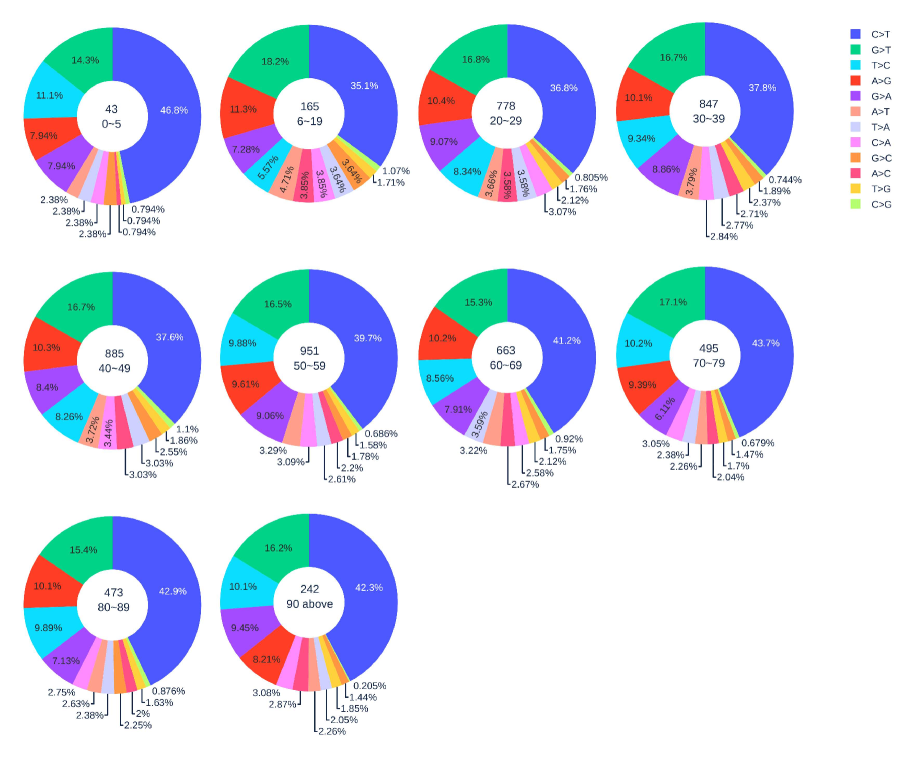
Figure 1 illustrates the distribution of 12 SNP types among unique SNPs in SASR-CoV-2 genome isolates from different age groups. In general, with the increase of age, the ratio of CT gradually increased. Here, 42.1% CT mutations are detected in patients who are older than 90 years old, indicating that the immune systems in elderly patients may fight against the SARS-CoV-2 harder than the immune systems in young patients. However, the severe COVID-19 cases may be due to immune systems’ over response. When SARS-CoV-2 infects a host cell, a set of proteins called cytokines will be released from a broad range of cells (mainly immune cells). Cytokines are involved in the immune response to produce more immune cells and recruit them to the sites of inflammation in order to fight against the viral infection. In turn, more cytokines can be released from the immune cells. This positive feedback loop will result in a “cytokine storm”, which can beget the exponential growth of inflammation, trigger apoptosis, and lead to organ damage [29]. Therefore, we hypothesize that if the immune system overreacts to the invading pathogens, it is more likely to cause the cytokine storm and aggravate the condition of the COVID-19 patients. It can be seen in Figure 1, patients who are older than 80 years old have more CT mutations compared to other age groups. This result reveals that the APOBEC3 activity in the immune system is more active and the immune response is stronger in older people. Consequently, the cytokine storm may happen more frequently in older people than it does in younger people. This might be one of the main causes of the high COVID-19 fatality for the elderly. Age-related mutagenesis, i.e., CT transition, is known to cause more cancers diagnostics in the elderly [30].
Notably, the SARS-CoV-2 samples from children under five years old have a relatively high ratio of CT mutations (39.6%), indicating that they also have a relatively active immune response when fighting against SARS-CoV-2. Moreover, the reversed mutation type TC for samples from children under five years old and adults older than 90 years old has the second-largest ratio. In other age groups, TC has the fourth-largest ratio. As demonstrated before, the reversed mutation TC may reveal that SARS-CoV-2 is capable of fighting back against the host immune system. Therefore, we deduce that SARS-CoV-2 will fiercely counter-attack against the immune system in children under five and adults older than 90.
Our result reveals that the immune systems of children under five years old are less well-developed and weaker than those of adults. They have to fight more intensively when SARS-CoV-2 infects. This result suggests children under five are at risk of COVID-19. However, the long-term health consequence of young children’s unusual response to SARS-CoV-2 infection is to be further studied.
2.1.3 Gender analysis
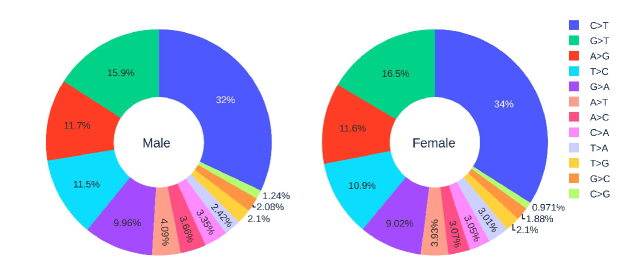
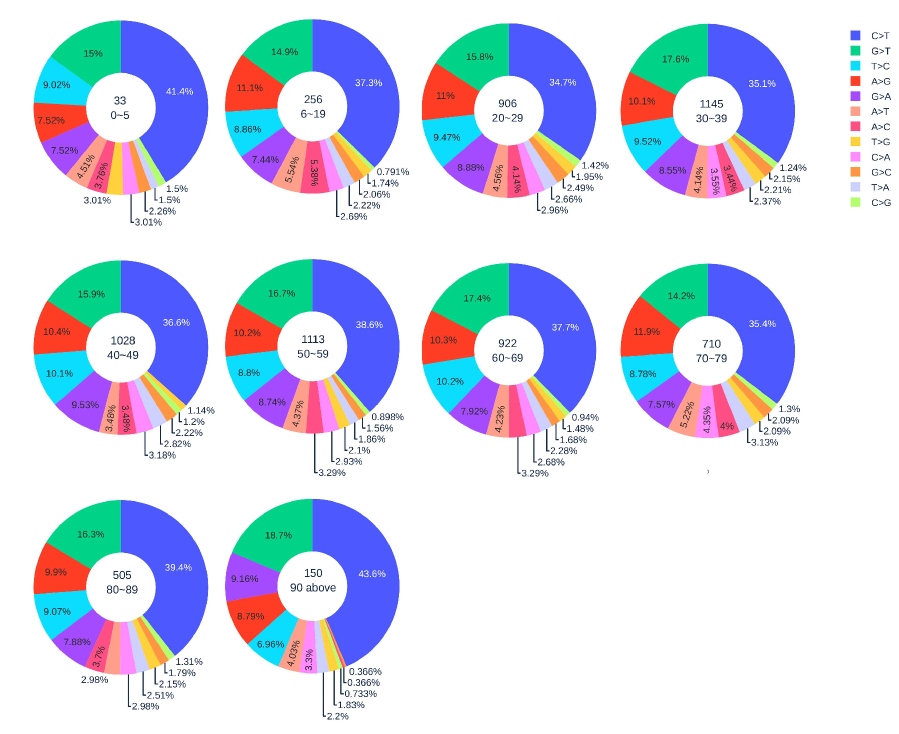
Figure 2 shows the distribution of 12 SNP types in SARS-CoV-2 genome isolates globally from two gender groups. The ratio of CT mutations in females is slightly higher in males, which matches the finding that women have a stronger immune response than men [31, 32]. Moreover, Figure 3 and Figure 4 depict the distribution of 12 SNP types in different age groups among female and male patients. Overall, the proportion of CT mutations in the SARS-CoV-2 genomes from females is higher than the CT proportion in the SARS-CoV-2 genomes from male except for the age between 6-19 and older than 90. Therefore, we can deduce that the RNA editing has age and gender preference, it is more likely to happen or become stronger for the females who are older than 90 years old or under 5 years old.
| Country | Total counts | Age counts | gender counts |
|---|---|---|---|
| United Kingdom | 10740 | 2159 | 2134 |
| United States | 8729 | 1888 | 2095 |
| Australia | 1329 | 776 | 750 |
| India | 1088 | 1068 | 1071 |
| World | 33693 | 12513 | 12181 |
2.1.4 Geographic analysis
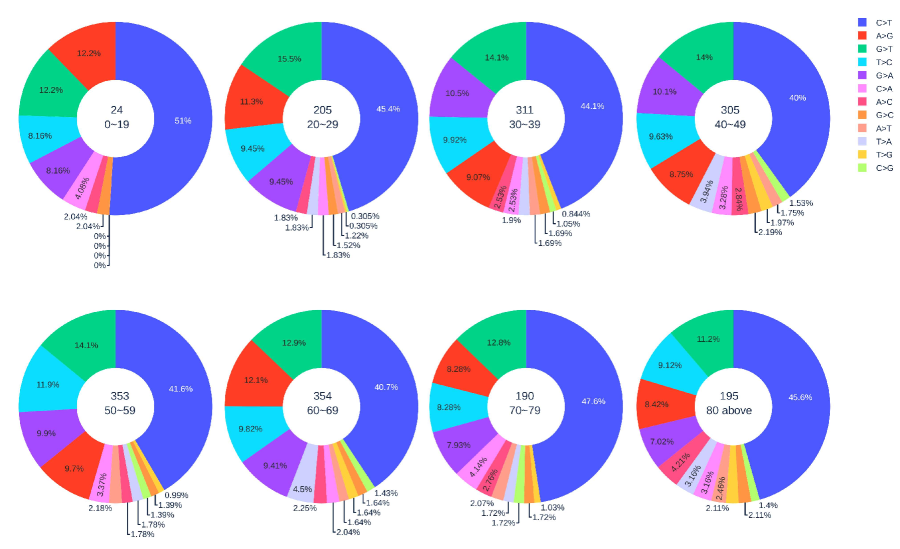
In this section, we analyze the distribution of SARS-CoV-2 mutations in different countries and regions. Limited by the number of complete genome sequences submitted to GISAID that have appropriate labels, we only analyze the countries with more than 1000 labeled sequences to maintain statistical significance. Table 2 lists the total number of SARS-CoV-2 sequences in the United Kingdom, United States, Australia, and India. The number of sequences with age and gender information is given in Table 2.
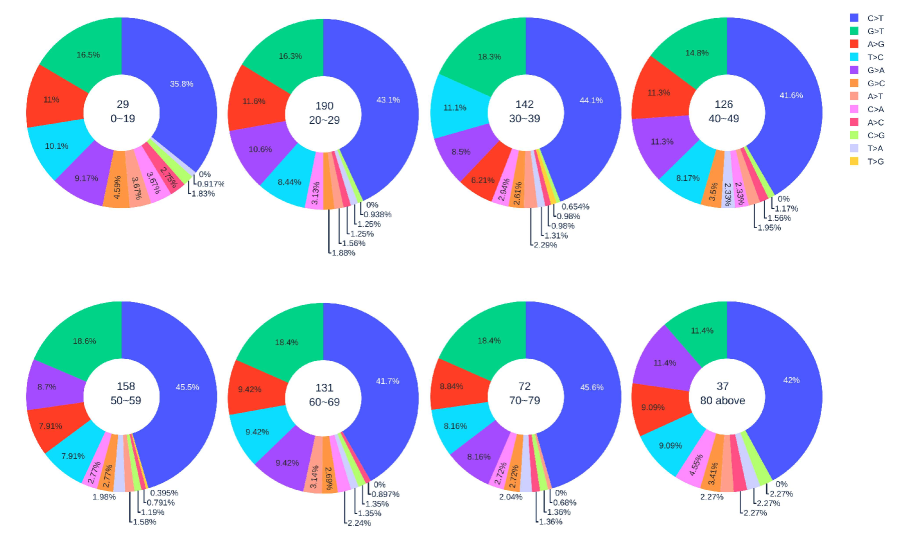
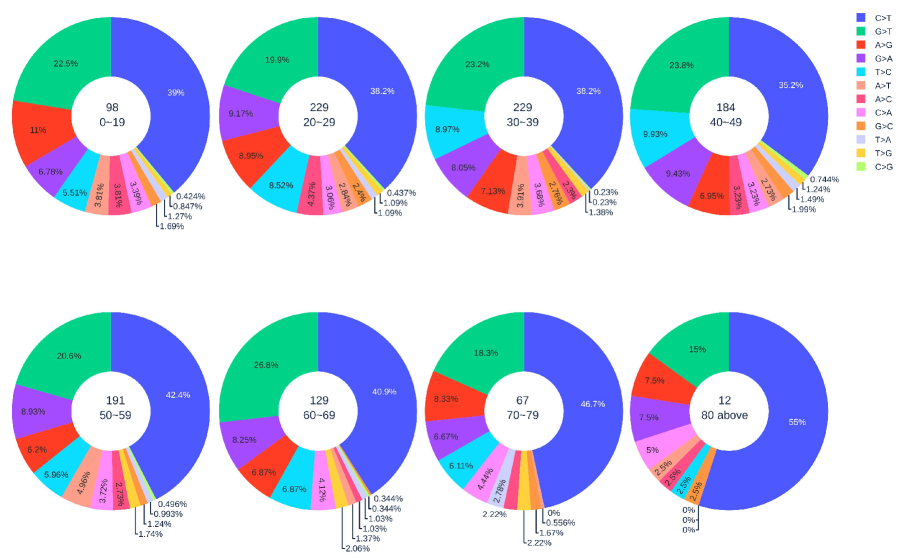
Figure 5, Figure 6, Figure 7, and Figure 8 illustrate the distribution of 12 SNP types in the SARS-CoV-2 genome isolates from different age groups in the United Kingdom, United States, Australia, and India, respectively. We can see that the SARS-CoV-2 genome isolates from the United Kingdom patients have the highest ratio of CT compared to those from the other three countries. It is interesting to note that the SARS-CoV-2 genome isolates from the patients older than 80 years old from the United Kingdom and Australia have less CT mutations, which is not consistent with the global pattern.
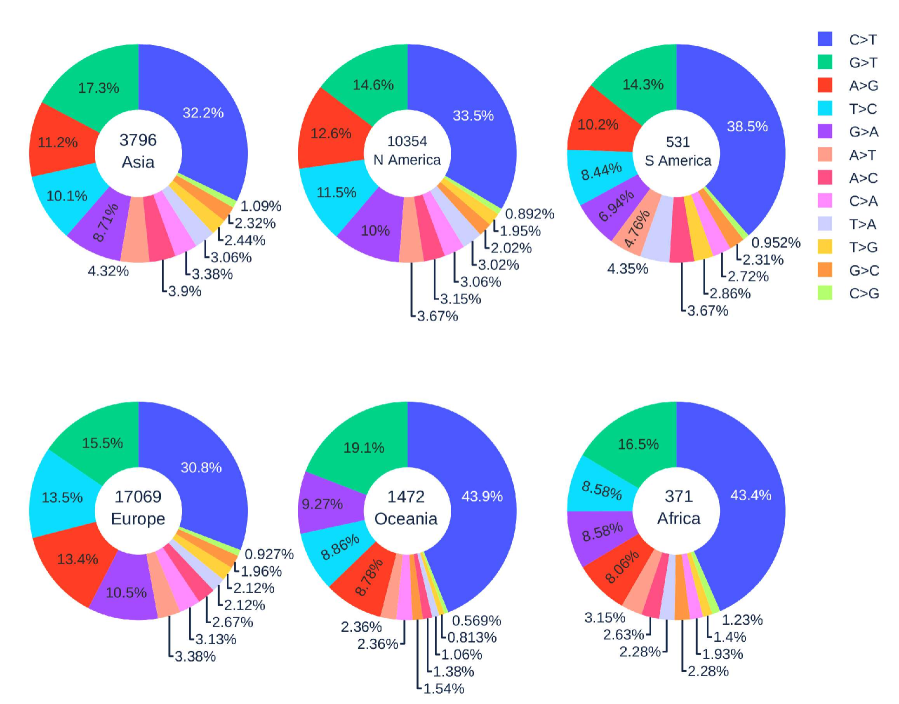
Figure 9 illustrates the distribution of 12 SNP types in six continents. The SARS-CoV-2 genome isolates from Europe, Asia, and North America patients have a relatively low CT mutation ratio (less than 35%), while the reversed TC mutation ratio is relatively high (greater than 10%). On the contrary, South America, Oceania, and Africa have higher CT ratios but lower TC ratio. It worth noting that the CT mutation ratios in the SARS-CoV-2 genome isolates from Oceania and Africa are more than 10% higher than those of Asia, Europe, and North America. This result indicates that the APOBEC editing may be more active, and the counterattack of SARS-CoV-2 might be weakened by the strong immune response in the populations of Oceania and Africa.
African Americans, as an ethnic group of Americans with total or partial ancestry from Africa, are genetically associated with Africans. There have been many concerns about the fact that they are disproportionately affected by COVID-19 (https://www.cdc.gov/coronavirus/2019-ncov/community/health-equity/race-ethnicity.html). The present finding indicates that the immune systems of African Americans may also overreact to SARS-CoV-2 infection by excessive gene editing.
Another interesting issue is that AG mutation ratios of genome isolates from Oceania and Africa are very low (9%). In contrast, AG mutation ratios of genome isolates from other regions are significantly higher ( 11%). These results indicate that Asia and Europe populations may have adopted significantly different genetic and molecular mechanisms in their immune response to viral infection compared to those of Oceania and Africa. Further studies are required to fully understand these differences.
2.2 The SNP preferences on sequence contexts
The mutation preferences in sequence contexts may be used to predict the mutational signatures from genome sequences. Despite numerous studies of the mutation contexts in APOBEC editing inhuman cells, little is known for the mutation contexts in the SARS-CoV-2 genome. As we have a large number of SNP mutations from SARS-CoV-2 genomes, here we discuss the mutation frequencies from 2-mer and 3-mer sequence contexts. We present 4-mer sequence contexts in the Supporting Information.
In general, the patterns discussed in this section are consistent with those presented in Section 2.1.1. However, this section offers more detailed information about mutational signatures.
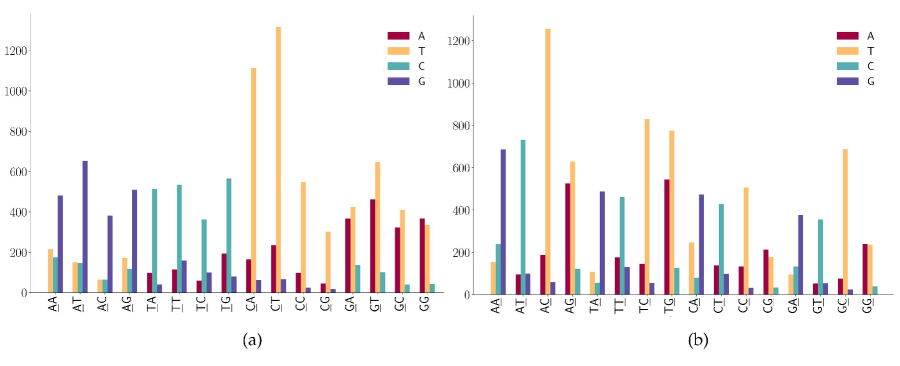
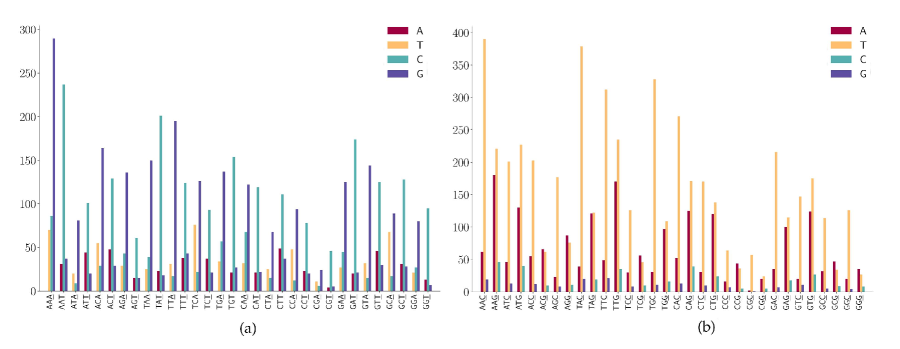
For mutation motifs of SNPs at the first position of 2-mers Figure 10(a), we observe that motif 2-mer CW (where W is either A or T) for CT mutation is the predominant context. Similarly, for mutation motifs of the SNPs at the second position of 2-mers Figure 10(b), motif 2-mer WC for CT mutation is the predominant context. These results are consistent with the previous study that TCW contexts (where W A or T) are predominantly caused by APOBEC-catalyzed deamination of cytosine (C) to thymine (T) or uracil (U) in human cancer cells [33].
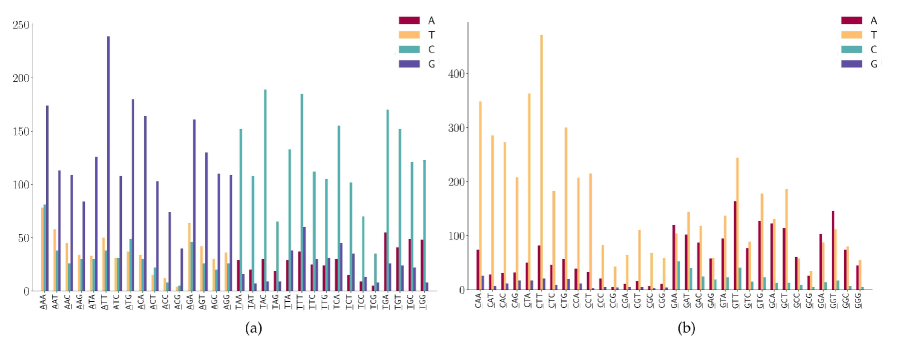
For the SNPs at the first position of 3-mers (ANN or TNN) (Figure 11(a)), we observe the following mutation patterns.
(1) ANN (except for AAC and ACC) has high AG mutation. AAC and ACC contexts have a high frequency in AT mutations.
(2) TNN has a high frequency in TC mutations.
For the SNPs at the first position of 3-mers (CNN or GNN) shown in Figure 11 (b), we observe the following mutation patterns.
(1) CNN has a high frequency in CT mutations.
(2) GGA has a high frequency in GC mutations.
(3) GCA has a relatively high frequency in GA mutations.
(3) GGN (NA) has relatively high frequency in GA mutations.
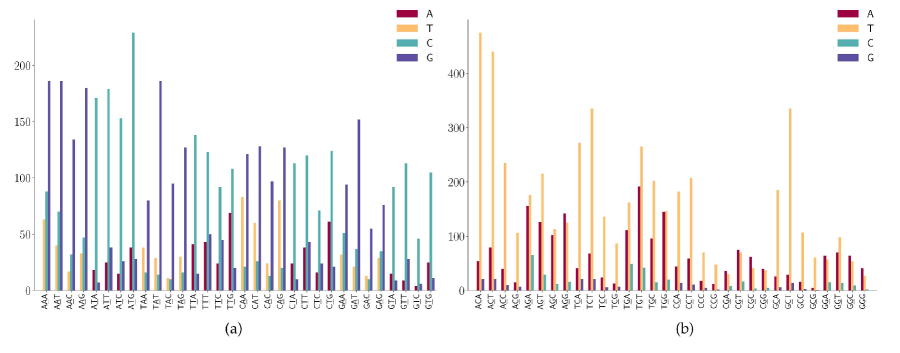
For the SNPs at the second position of the 3-mers (NAN or NTN) as shown in Figure 12 (a), we observe the following mutation patterns.
(1) NAN has a high frequency in AG mutations
(2) NTN has a high frequency in TC mutations
(3) The TC mutation also has a larger proportion in AN.
For the SNPs at the second position of the 3-mers (NCN or NGN) as shown in Figure 12 (b), we observe the following mutation patterns.
(1) WGN (where W is A or T) has CT dominated mutation except for AGG.
(2) SGN (where S is G or C) has GA dominated mutations.
(3) AGG has high GA mutations.
(4) Characteristic combinations SCG (where S is G or C) are stable and only a few of GT mutations are detected.
(5) Characteristic combinations GGS (where S is G or C) are stable, having few GT mutations.
For the SNPs at the third position of 3-mers (NNA or NNT) a shown in Figure 12 (a), we observe the following mutation patterns.
(1) AG mutation has a high frequency in NNA.
(2) TC mutation has a high frequency in NNT.
(3) TC mutation is dominated in NGT and only a few of TA and TG are found in the sequence context of NGT.
For the SNPs at the third position of 3-mers (NNC or NNG) as shown in Figure 13 (b), we observe the following mutation patterns.
(1) NNC has a high frequency in CT mutations.
(2) GT mutation has a high frequency in NNG.
(3) GA also highly expressed in the sequence context of NCG.
(4) Characteristic combinations CGC are stable and the mutations on these patterns are most likely to be CT transitions.
2.3 Coronavirus evolution
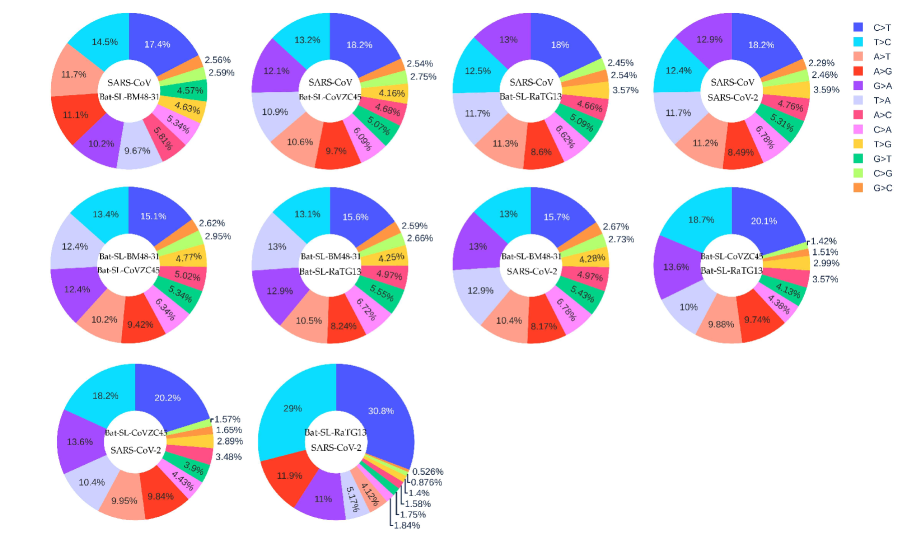
It is reasonable to assume that five coronaviruses SARS-CoV (2003) [34], Bat-SL-BM48-31 (2008) [35], Bat-SL-CoVZC45 (2017) [36], Bat-SL-RaTG13 (2013) [37], and SARS-CoV-2 (2019) [2] are of the same origin but differ from each other by their evolutionary stages. Among them, the data collection date of Bat-SL-RaTG13 (2013) was denoted as July 24, 2013 while the data was not uploaded to the GISIAD database until January 27, 2020. Figure 14 shows the mutation ratio among these five genomes. First, similar to SARS-CoV-2 mutations listed in Table 1, four transition types (i.e., AC, CA, CT, and TC) still have high mutation ratios. Particularly, CT type has the highest ratio, indicating that host immune response still plays the major role. However, transversion type GT is not as important as that in the SARS-CoV-2 mutations discussed early. Nonetheless, transversion types AT and TA appear on the top six mutation types.
We hypothesize that gene editing via APOBEC (CT) and ADAR (AG) is a driving force for RNA viral evolution as shown in Table 1. Viruses may fight back the host immune response with either defective repair or reversed mutations (TC) within survived isolates. Therefore, TC mutation rate would decrease during evolution. We are interested in not only the CT transition ratio, but also the ratio of CT over TC, the reversed transitions. From Table 1 and Figure 14, we can deduce that the following:
-
1.
From SARS-CoV-2 reference genome to 33693 genomes: CT: 24.06%, TC: 14.53% (Higher CT ratio, relatively lower TC ratio, and CT to TC ratio: 1.66)
-
2.
From SARS-CoV to Bat-SL-BM48-31: CT: 17.40%, TC: 14.50% (Higher CT ratio, relatively lower TC ratio, and CT to TC ratio: 1.20)
-
3.
From SARS-CoV to Bat-SL-CoVZC45: CT: 18.20%, TC: 13.20% (Higher CT ratio, relatively lower TC ratio, and CT to TC ratio: 1.37)
-
4.
From SARS-CoV to Bat-SL-RaTG13: CT: 18.00%, TC: 12.50% (Higher CT ratio, relatively lower TC ratio, and CT to TC ratio: 1.50)
-
5.
From SARS-CoV to SARS-CoV-2: CT: 18.20%, TC: 12.40% (Higher CT ratio, relatively lower TC ratio, and CT to TC ratio: 1.47)
-
6.
From Bat-SL-BM48-31 to Bat-SL-CoVZC45: CT: 15.10%, TC: 13.40% (Higher CT ratio, relatively lower TC ratio, and CT to TC ratio: 1.13)
-
7.
from Bat-SL-BM48-31 to Bat-SL-RaTG13: CT: 15.60%, TC: 13.10% (Higher CT ratio, relatively lower TC ratio, CT to TC ratio: 1.19)
-
8.
From Bat-SL-BM48-31 to SARS-CoV-2: CT: 15.70%, TC: 13.00% (Higher CT ratio, relatively lower TC ratio, and CT to TC ratio: 1.21)
-
9.
From Bat-SL-CoVZC45 to Bat-SL-RaTG13: CT: 20.10%, TC: 18.70% (Higher CT ratio, relatively lower TC ratio, and CT to TC ratio: 1.07)
-
10.
From Bat-SL-CoVZC45 to SARS-CoV-2: CT: 20.20%, TC: 18.20% (Higher CT ratio, relatively lower TC ratio, and CT to TC ratio: 1.11)
-
11.
From Bat-SL-RaTG13 to SARS-CoV-2: CT: 30.80%, TC: 29.00% (Higher CT ratio, relatively lower TC ratio, and CT to TC ratio: 1.06)
It is seen that viral evolution order may be determined by the TC over TC ratio. By this analysis, we have the following evolution order for aforementioned coronaviruses, SARS-CoV (2003) Bat-SL-BM48-31 (2008) Bat-SL-CoVZC45 (2017) Bat-SL-RaTG13 (2013) SARS-CoV-2 (2019) 33693 SARS-CoV-2 genome isolates (2020). Here, we have one reversed order between Bat-SL-CoVZC45 (2017) Bat-SL-RaTG13 (2013). This may happen for a few reasons. First, these coronaviruses may not be of the same origin. Second, the data collection date may not be accurate. The sequence of Bat-SL-RaTG13 (2013) was not uploaded until 2020. Finally, our method may admit a few counterexamples.
3 Discussions
The SNPs type distribution of 33693 SARS-CoV-2 isolates is listed in Table 1. The CT SNP mutation is remarkably higher than other mutation types. From the distribution of the 12 SNP types, we may infer that the excessive CT transitions cannot explained by random mutations, instead, hypermutation CT is due to the cytosine-to-uridine deamination gene editing in human host response.
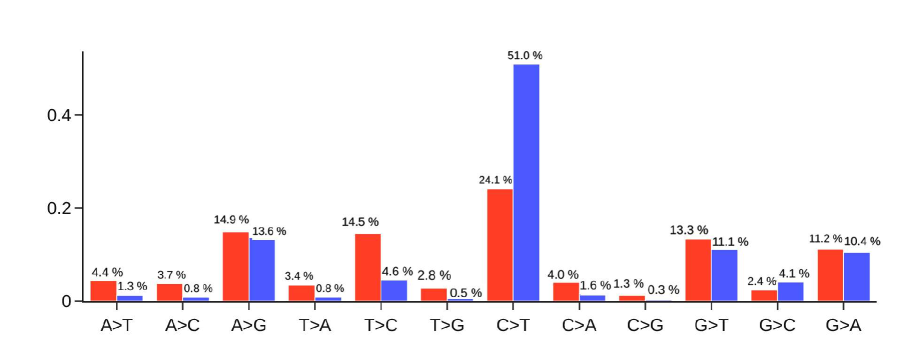
Figure 15 presents a comparison of the ratios of 12 SNP types of among unique and non-unique mutations over all of the SARS-CoV-2 genome isolates. The most striking feature is that the CT ratio is more than doubled in the non-unique mutations, which indicates the overwhelming host immune response to viral infection. Another interesting feature is that the inverse transition TC has a dramatic reduction of 68% from the unique mutation ratio to the non-unique mutation ratio. These changes reflect the fact that many CT mutations are high-frequency ones whereas virus reverses TC mutations are of low frequency in nature. The same explanation applies to many mutation types in Figure 15 that have significantly reduced their ratios in the non-unique mutations. However, we observed that ratios of mutation types AG, GT, and GA do not change much in the non-unique mutations, reflecting the fact that these mutation types maintain a near-average frequency.
Figure 15 shows that the second most frequent mutation type is AG transitions, standing at 13.6 %. The combined CT and AG transition types account for near 65% of all mutations. Therefore, host gene editing via APOBEC and ADAR is the major driven force of SARS-CoV-2 evolution.
Neutralizing antibodies play a significant role in the clearance of viruses and have been considered a crucial immune artifact for the defense or treatment of viral diseases. However, a clinical study shows that five percent of people recovered from COVID-19 had no detectable antibodies [38]. Another observation is that there are a large number of asymptomatic carrier transmission of COVID-19 [39]. The reason for the no-antibody COVID-19 recovers and asymptomatic carriers is unknown. From the mutation analysis in this study, the APOBEC3 RNA editing is implicated as a strong secondary defenses system for mutating virus, and consequently, mitigating infection. We postulate that COVID-19 recoveries or convalescents without antibody and some asymptomatic carriers are probably owing to the increased APOBEC3 activity in host immune systems.
4 Methods and material
4.1 SNP genotyping
Here, 33693 complete genomes of the SARS-CoV-2 strains of the globe are retrieved from the GISAID database [40] as of July 31, 2020. Only the complete genomes of high-coverage that have no stretches of ’NNNNN’ include in the dataset. The complete genome sequences are aligned with the reference genome of SARS-CoV-2 by the MSA tool Clustal Omega using the default parameters [41]. The SNP mutations are retrieved from the aligned genomes according to the reference SARS-CoV-2 genome (GenBank access number: NC_045512.2) [2]. The SNP profile, including nucleotide changes and the corresponding positions in a genome, can be considered as the genotype of the virus.
4.2 SNP analysis
The Cluster Omega is employed to carry out the multiple sequence alignment. The genomic analytics is performed using computer programs in Python and Biopython libraries [42].
4.3 Data availability
The nucleotide sequences of the SARS-CoV-2 genomes used in this analysis are available, upon free registration, from the GISAID database (https://www.gisaid.org/). The SNP IDs and the acknowledgments of the SARS-COV-2 genomes are given in the Supporting Information.
5 Conclusion
We use genotyping to analyze the mutation types and their distributions of SARA-CoV-2 genome isolates. We show that host gene editing, namely APOBEC (apolipoprotein B mRNA editing enzyme, catalytic polypeptide-like) and ADAR (adenosine deaminases acting on RNA), are the main driven forces of SARS-CoV-2 evolution, accounting for near 65% recorded mutations. We reveal that the immune systems of children under age five and the elderly appear to overreact to SARS-CoV-2 infection and may be at high risk from COVID-19. Some minor gender dependence in immune response was also detected. We uncover that the populations of Oceania and Africa react significantly more intensive to SARS-CoV-2 infection than those of Europe and Asia. Our study indicates that while systemic health and social inequities have put African Americans at increased risk of getting sick from COVID-19, their immune systems’ overreacting to viral infection may have put them at increased risk of dying from COVID-19. The mutational signatures have been analyzed to explore the preferred gene editing environments. Finally, we show that the ratio of mutation type CT over TC may be used to indicate the evolution direction and distinguish the evolution order between two genome sequences of the same origin.
Supporting Information
Supporting information is available for supplementary figures, including the distribution of 12 SNP types among non-unique mutations, the distribution of 12 SNP types between each pair of 10 coronaviruses, and 4-mer analysis of mutational signatures. Supplementary tables are available for GISAID IDs and GISAID acknowledgment.
Acknowledgment
This work was supported in part by NIH grants GM126189 and AI145504, NSF Grants DMS-1721024, DMS-1761320, and IIS1900473, Michigan Economic Development Corporation, George Mason University award PD45722, Bristol-Myers Squibb, and Pfizer. The authors thank The IBM TJ Watson Research Center, The COVID-19 High Performance Computing Consortium, and NVIDIA for computational assistance.
References
- [1] WHO. Coronavirus disease 2019 (COVID-19) situation report – 193. Coronavirus Disease (COVID-2019) Situation Reports, 00(00):00–00, 2020.
- [2] Fan Wu, Su Zhao, Bin Yu, Yan-Mei Chen, Wen Wang, Zhi-Gang Song, Yi Hu, Zhao-Wu Tao, Jun-Hua Tian, Yuan-Yuan Pei, et al. A new coronavirus associated with human respiratory disease in China. Nature, 579(7798):265–269, 2020.
- [3] Xiaodong Xiao, Samitabh Chakraborti, Anthony S Dimitrov, Kosi Gramatikoff, and Dimiter S Dimitrov. The SARS-CoV S glycoprotein: expression and functional characterization. Biochemical and biophysical research communications, 312(4):1159–1164, 2003.
- [4] Ilona Glowacka, Stephanie Bertram, Marcel A Müller, Paul Allen, Elizabeth Soilleux, Susanne Pfefferle, Imke Steffen, Theodros Solomon Tsegaye, Yuxian He, Kerstin Gnirss, et al. Evidence that TMPRSS2 activates the severe acute respiratory syndrome coronavirus spike protein for membrane fusion and reduces viral control by the humoral immune response. Journal of virology, 85(9):4122–4134, 2011.
- [5] Markus Hoffmann, Hannah Kleine-Weber, Simon Schroeder, Nadine Krüger, Tanja Herrler, Sandra Erichsen, Tobias S Schiergens, Georg Herrler, Nai-Huei Wu, Andreas Nitsche, et al. SARS-CoV-2 cell entry depends on ACE2 and TMPRSS2 and is blocked by a clinically proven protease inhibitor. Cell, 2020.
- [6] Ruth McBride, Marjorie Van Zyl, and Burtram C Fielding. The coronavirus nucleocapsid is a multifunctional protein. Viruses, 6(8):2991–3018, 2014.
- [7] Peng Yue, Zhaolong Li, and John Moult. Loss of protein structure stability as a major causative factor in monogenic disease. Journal of molecular biology, 353(2):459–473, 2005.
- [8] Shannon Stefl, Hafumi Nishi, Marharyta Petukh, Anna R Panchenko, and Emil Alexov. Molecular mechanisms of disease-causing missense mutations. Journal of molecular biology, 425(21):3919–3936, 2013.
- [9] Rui Wang, Yuta Hozumi, Changchuan Yin, and Guo-Wei Wei. Mutations on COVID-19 diagnostic targets. arXiv preprint arXiv:2005.02188, 2020.
- [10] Bette Korber, Will M Fischer, Sandrasegaram Gnanakaran, Hyejin Yoon, James Theiler, Werner Abfalterer, Nick Hengartner, Elena E Giorgi, Tanmoy Bhattacharya, Brian Foley, et al. Tracking changes in SARS-CoV-2 Spike: evidence that D614G increases infectivity of the COVID-19 virus. Cell, 2020.
- [11] Nathan D Grubaugh, William P Hanage, and Angela L Rasmussen. Making sense of mutation: what D614G means for the COVID-19 pandemic remains unclear. Cell, 2020.
- [12] Jiahui Chen, Rui Wang, Menglun Wang, and Guo-Wei Wei. Mutations strengthened SARS-CoV-2 infectivity. arXiv preprint arXiv:2005.14669, 2020.
- [13] Marion Sevajol, Lorenzo Subissi, Etienne Decroly, Bruno Canard, and Isabelle Imbert. Insights into RNA synthesis, capping, and proofreading mechanisms of SARS-coronavirus. Virus research, 194:90–99, 2014.
- [14] François Ferron, Lorenzo Subissi, Ana Theresa Silveira De Morais, Nhung Thi Tuyet Le, Marion Sevajol, Laure Gluais, Etienne Decroly, Clemens Vonrhein, Gérard Bricogne, Bruno Canard, et al. Structural and molecular basis of mismatch correction and ribavirin excision from coronavirus rna. Proceedings of the National Academy of Sciences, 115(2):E162–E171, 2018.
- [15] Rafael Sanjuán and Pilar Domingo-Calap. Mechanisms of viral mutation. Cellular and molecular life sciences, 73(23):4433–4448, 2016.
- [16] Changchuan Yin. Genotyping coronavirus SARS-CoV-2: methods and implications. Genomics, 2020.
- [17] Tung Phan. Genetic diversity and evolution of SARS-CoV-2. Infection, genetics and evolution, 81:104260, 2020.
- [18] Kashif Aziz Khan and Peter Cheung. Presence of mismatches between diagnostic PCR assays and coronavirus sars-cov-2 genome. Royal Society Open Science, 7(6):200636, 2020.
- [19] Rui Wang, Yuta Hozumi, Changchuan Yin, and Guo-Wei Wei. Decoding SARS-CoV-2 transmission, evolution, and ramification on COVID-19 diagnosis, vaccine, and medicine. Journal of Chemical Information and Modeling, page https://doi.org/10.1021/acs.jcim.0c00501, 2020.
- [20] Alina Baum, Benjamin O Fulton, Elzbieta Wloga, Richard Copin, Kristen E Pascal, Vincenzo Russo, Stephanie Giordano, Kathryn Lanza, Nicole Negron, Min Ni, et al. Antibody cocktail to SARS-CoV-2 spike protein prevents rapid mutational escape seen with individual antibodies. Science, 2020.
- [21] Salvatore Di Giorgio, Filippo Martignano, Maria Gabriella Torcia, Giorgio Mattiuz, and Silvestro G Conticello. Evidence for RNA editing in the transcriptome of 2019 novel coronavirus. Science Advances, 6(25), 2020.
- [22] Yong-Hui Zheng, Dan Irwin, Takeshi Kurosu, Kenzo Tokunaga, Tetsutaro Sata, and B Matija Peterlin. Human APOBEC3F is another host factor that blocks human immunodeficiency virus type 1 replication. Journal of virology, 78(11):6073–6076, 2004.
- [23] Kazuko Nishikura. A-to-I editing of coding and non-coding RNAs by ADARs. Nature reviews Molecular cell biology, 17(2):83–96, 2016.
- [24] Harold C Smith, Ryan P Bennett, Ayse Kizilyer, William M McDougall, and Kimberly M Prohaska. Functions and regulation of the APOBEC family of proteins. In Seminars in cell & developmental biology, volume 23, pages 258–268. Elsevier, 2012.
- [25] Mei-Chen Liu, Wen-Yun Liao, Katherine M Buckley, Shu Yuan Yang, Jonathan P Rast, and Sebastian D Fugmann. AID/APOBEC-like cytidine deaminases are ancient innate immune mediators in invertebrates. Nature communications, 9(1):1–11, 2018.
- [26] Charles E Samuel. Adenosine deaminases acting on RNA (ADARs) are both antiviral and proviral. Virology, 411(2):180–193, 2011.
- [27] Sarah R Gonzales-van Horn and Peter Sarnow. Making the mark: the role of adenosine modifications in the life cycle of RNA viruses. Cell host & microbe, 21(6):661–669, 2017.
- [28] Reuben S Harris and Jaquelin P Dudley. APOBECs and virus restriction. Virology, 479:131–145, 2015.
- [29] Peipei Song, Wei Li, Jianqin Xie, Yanlong Hou, and Chongge You. Cytokine storm induced by SARS-CoV-2. Clinica Chimica Acta, 2020.
- [30] Ludmil B Alexandrov, Serena Nik-Zainal, David C Wedge, Samuel AJR Aparicio, Sam Behjati, Andrew V Biankin, Graham R Bignell, Niccolo Bolli, Ake Borg, Anne-Lise Børresen-Dale, et al. Signatures of mutational processes in human cancer. Nature, 500(7463):415–421, 2013.
- [31] Anura Hewagama, Dipak Patel, Sushma Yarlagadda, Faith M Strickland, and Bruce C Richardson. Stronger inflammatory/cytotoxic T-cell response in women identified by microarray analysis. Genes & Immunity, 10(5):509–516, 2009.
- [32] Sabra L Klein. Sex influences immune responses to viruses, and efficacy of prophylaxis and treatments for viral diseases. Bioessays, 34(12):1050–1059, 2012.
- [33] Steven A Roberts, Michael S Lawrence, Leszek J Klimczak, Sara A Grimm, David Fargo, Petar Stojanov, Adam Kiezun, Gregory V Kryukov, Scott L Carter, Gordon Saksena, et al. An APOBEC cytidine deaminase mutagenesis pattern is widespread in human cancers. Nature genetics, 45(9):970–976, 2013.
- [34] Nelson Lee, David Hui, Alan Wu, Paul Chan, Peter Cameron, Gavin M Joynt, Anil Ahuja, Man Yee Yung, CB Leung, KF To, et al. A major outbreak of severe acute respiratory syndrome in Hong Kong. New England Journal of Medicine, 348(20):1986–1994, 2003.
- [35] Jan Felix Drexler, Florian Gloza-Rausch, Jörg Glende, Victor Max Corman, Doreen Muth, Matthias Goettsche, Antje Seebens, Matthias Niedrig, Susanne Pfefferle, Stoian Yordanov, et al. Genomic characterization of severe acute respiratory syndrome-related coronavirus in European bats and classification of coronaviruses based on partial RNA-dependent RNA polymerase gene sequences. Journal of virology, 84(21):11336–11349, 2010.
- [36] Dan Hu, Changqiang Zhu, Lele Ai, Ting He, Yi Wang, Fuqiang Ye, Lu Yang, Chenxi Ding, Xuhui Zhu, Ruicheng Lv, et al. Genomic characterization and infectivity of a novel SARS-like coronavirus in Chinese bats. Emerging Microbes & Infections, 7(1):1–10, 2018.
- [37] Peng Zhou, Xing-Lou Yang, Xian-Guang Wang, Ben Hu, Lei Zhang, Wei Zhang, Hao-Rui Si, Yan Zhu, Bei Li, Chao-Lin Huang, et al. A pneumonia outbreak associated with a new coronavirus of probable bat origin. Nature, 579(7798):270–273, 2020.
- [38] Fan Wu, Aojie Wang, Mei Liu, Qimin Wang, Jun Chen, Shuai Xia, Yun Ling, Yuling Zhang, Jingna Xun, Lu Lu, et al. Neutralizing antibody responses to SARS-CoV-2 in a COVID-19 recovered patient cohort and their implications. 2020.
- [39] Yan Bai, Lingsheng Yao, Tao Wei, Fei Tian, Dong-Yan Jin, Lijuan Chen, and Meiyun Wang. Presumed asymptomatic carrier transmission of COVID-19. JAMA, 323(14):1406–1407, 2020.
- [40] Yuelong Shu and John McCauley. Gisaid: Global initiative on sharing all influenza data–from vision to reality. Eurosurveillance, 22(13), 2017.
- [41] Fabian Sievers and Desmond G Higgins. Clustal omega. Current protocols in bioinformatics, 48(1):3–13, 2014.
- [42] Peter JA Cock, Tiago Antao, Jeffrey T Chang, Brad A Chapman, Cymon J Cox, Andrew Dalke, Iddo Friedberg, Thomas Hamelryck, Frank Kauff, Bartek Wilczynski, et al. Biopython: freely available python tools for computational molecular biology and bioinformatics. Bioinformatics, 25(11):1422–1423, 2009.