Proxima Centauri - the nearest planet host observed simultaneously with AstroSat, Chandra and HST
Abstract
Our nearest stellar neighbour, Proxima Centauri, is a low mass star with spectral type dM5.5 and hosting an Earth-like planet orbiting within its habitable zone. However, the habitability of the planet depends on the high-energy radiation of the chromospheric and coronal activity of the host star. We report the AstroSat, Chandra and HST observation of Proxima Centauri carried out as part of multi-wavelength simultaneous observational campaign. Using the soft X-ray data, we probe the different activity states of the star. We investigate the coronal temperatures, emission measures and abundance. Finally, we compare our results with earlier observations of Proxima Centauri.
keywords:
stars: activity – stars: coronae – stars: low-mass, late-type – stars: individual: Proxima Centauri1 Introduction
The habitability of an extrasolar planet depends not only on its distance from its host but also on the host’s magnetic activity. The host’s high-energy emission in the X-ray and UV-range determines the amount of mass loss from the planetary atmosphere (Lammer et al., 2003); given some incident high-energy flux, evaporation takes place in the form of “hydrodynamic escape”. The nearest extrasolar planet orbits around the star Proxima Centauri, which itself is located in a hierarchical triple system consisting of Proxima Centauri and a closer binary Centauri AB (with components of spectral type G2V and K1V). Proxima Centauri is an M-dwarf of spectral type dM5.5e (Shapley, 1951).
Some solar flares are known to be associated with coronal mass ejection when suddenly energetic particles are released into interplanetary space. If and when such particles enter the Earth’s magnetosphere, geomagnetic disturbances of various strengths are observed. By analogy, we may expect analogous events in the Proxima Centauri planetary system, and recently a superflare event on Proxima Centauri has been reported, which would have been barely visible with the naked eye (Howard et al., 2018); we summarize some of the relevant stellar parameters of Proxima Centauri in Tab. 1.
Proxima Centauri, like all flare stars, is a copious producer of X-ray and UV emission. It has, therefore, been observed frequently by several X-ray (and UV satellites) such as Einstein, EXOSAT, ROSAT, ASCA, Chandra and XMM-Newton (Haisch & Linsky, 1980; Haisch et al., 1983; Haisch et al., 1995; Güdel et al., 2004). Proxima Centauri’s quiescent X-ray emission varies from 4 to 16 1026 erg/s (Haisch et al., 1990). Although its surface area is much smaller than that of our Sun, its X-ray emission is usually quite a bit larger. Frequent flaring is observed from Proxima Centauri in optical, UV, X-ray and radio wavelengths, with several flares studied in detail over the over last four decades (Haisch et al., 1983; Lim et al., 1996; Güdel et al., 2002; Fuhrmeister et al., 2011; MacGregor et al., 2018). Furthermore, based on 15 yr All Sky Automated Survey (ASAS) V-band data Wargelin et al. (2017) found that Proxima Centauri shows a 7 years modulation with similar indications of activity cycle in X-ray wavelength.
Currently, we do not have a reliable method to estimate the energetic particle output of magnetically active late-type stars. It is, however, possible to measure the radiative output and assess the planetary evaporation due to incident high-energy radiation. To assess the full high-energy radiation field between 5 and 3200 Å one has to combine the UV and X-ray observations. Since most of the radiation in the EUV range (150 Å 911 Å) is obscured by the interstellar medium even for the very nearest stars like Proxima Centauri, we require simultaneous X-ray and UV/optical observations as well as emission measure modelling to reconstruct the coronal contribution to the EUV flux. We present a detailed analysis of coronal emission of Proxima Centauri during both quiescent and flaring states observed simultaneously with AstroSat Soft X-ray Telescope (SXT; Singh et al. 2014, 2016), Chandra Low Energy Transmission Grating (LETG/HRC-S) (Brinkman et al., 1987, 1997) and Hubble Space Telescope (HST) .
Our paper is structured as follows: in the following section, we describe our observations obtained with AstroSat and the data analysis (Section 2). In Section 3, we compare the timing behaviour of Proxima Centauri observed with AstroSat and 0th order LETG/HRC-S observations. We also briefly present the HST observation of the flare event that was seen simultaneously with AstroSat and Chandra. We further discuss the coronal properties of Proxima Centauri and verify the consistency of the results with the LETG/HRC-S observations. In Sections 4, we summarise our findings.
| Proxima Centauri | ||
| Distance (pc) | 1.3 | a |
| Spectral type | dM5.5e | b |
| Rotation period (d) | 83 | c |
| LX (erg/s) | 4-16 1026 | d |
| Lbol (erg/s) | 6 1030 | e |
| -4 | ||
| Proxima Centauri b | ||
| Mass (M⊕) | 1.3 | e |
| Orbital period (d) | 11.2 | e |
| Semi-major axis a (AU) | 0.05 | e |
| AstroSat | ||
| Observation start | 31/05/2017 06:08:50 | |
| Observation end | 01/06/2017 13:51:33 | |
| Duration (ks) | 42 | |
| Primary instrument | SXT | |
| ObsID | AT | |
| Chandra | ||
| Observation start | 31/05/2017 16:25:42 | |
| Observation end | 01/06/2017 05:28:58 | |
| Duration (ks) | 45 | |
| Primary instrument | LETG/HRC-S | |
| ObsID | 19708 |
2 Observations and Data Analysis
The data presented in this paper are simultaneous observations of Proxima Centauri carried out with India’s first space observatory AstroSat, the LETG/HRC-S onboard Chandra and HST (ObsID: 14860) between 31 May - 01 June 2017. The observations cover 19 consecutive AstroSat orbits. The detailed observation log are provided in Table 1.
AstroSat is a multi-wavelength astronomy mission, carrying five multi-band payloads (Agrawal, 2006; Singh et al., 2014; Agrawal, 2017). The Soft X-ray Telescope aboard AstroSat covers the 0.3-7.0 keV energy band with an effective area of 90 cm2 at 1.5 keV (Singh et al., 2017b). The SXT is a grazing incidence soft X-ray telescope with a focal length of 200 cm, equipped with a thermo-electrically cooled CCD detector in its focal plane (Singh et al., 2014, 2016, 2017b, 2017a). The SXT level 1 data from individual orbits are received at the SXT Payload Operation Centre (POC) and are processed using the SXTPIPELINE version 1.4b at the POC. Using the SXTPIPELINE the events are extracted and time tagged, and the raw coordinates are transformed to sky coordinates. The pipeline also carries out bias subtraction, bad pixel flagging, event grading and pulse height amplitude reconstruction for each event. So-called “Good Time Interval” files for each orbit are selected and merged event files are created111http://www.tifr.res.in/astrosatxt/dataanalysis.html.
We used XSELECT version 2.4c in HEASOFT 6.24 to extract the light curve for the regions centered on the sources. The SXT light curves and spectra were obtained using standard filtering criteria222http://astrosat-ssc.iucaa.in/?q=data_and_analysis. We used a blank-sky SXT spectrum provided by the SXT team for modeling the background spectrum. We used the XSPEC-compatible RMF and ARF files for SXT provided by the AstroSat Science Support cell3. These were sxtpcexcl00v04a.arf and sxtpcmatg0to12.rmf. The spectra were binned to a minimum of 25 counts per energy bin. The spectral analysis was carried out with XSPEC version 12.9.0 (Arnaud, 1996) after dividing the data into periods of quiescence and flaring (see Sections 3.1 and 3.2).
For the Chandra data, we followed the standard CIAO analysis guide333http://cxc.harvard.edu/ciao/guides/ for reducing Chandra LETG/HRC-S data. We used CIAO version 4.10 of the data processing software. According to the standard data processing procedure the Good Time Interval files were created.
Proxima Centauri was simultaneously observed using the STIS spectrograph aboard HST with the E140M echelle grating. To produce flux and wavelength calibrated spectra, we used the standard calSTIS pipeline version FIXME. We split the HST observations into sub-exposures with the calSTIS inttag function at a cadence of FIXME, resulting in individual spectra for each of these sub-exposures. From these spectra, we integrated flux from 1200-1700 Å region to generate a broadband FUV light curve.
3 Results
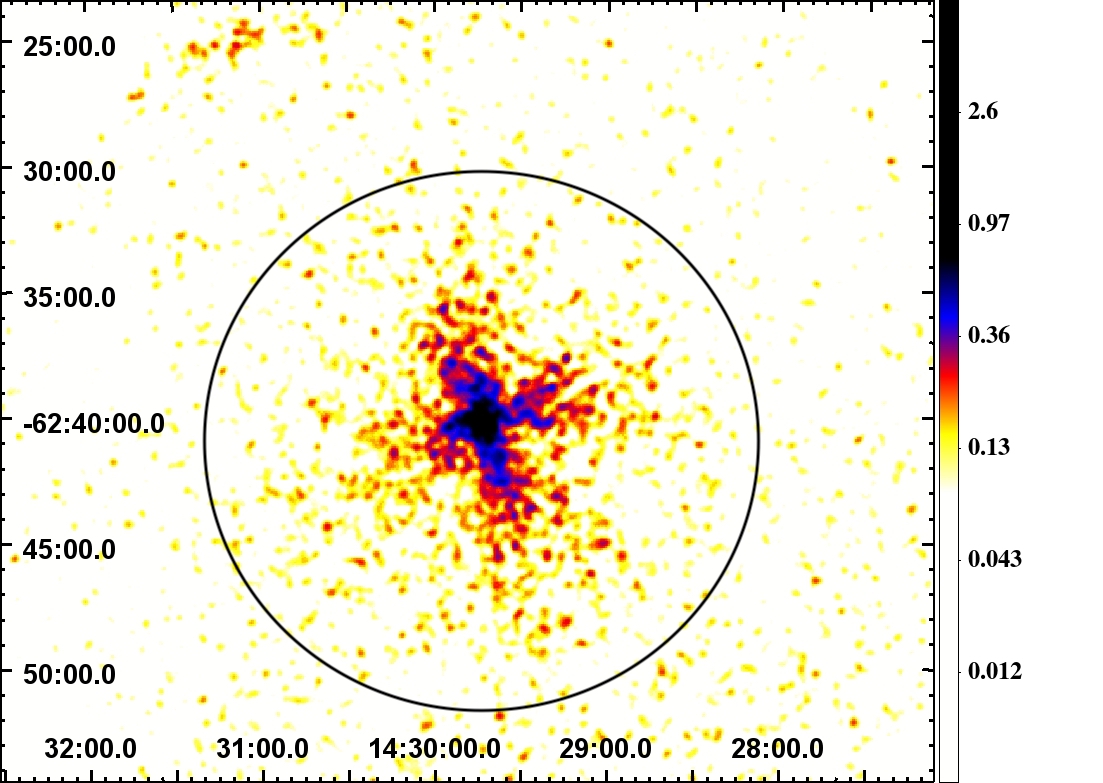
To provide an impression of what AstroSat data look like, we show our AstroSat-SXT image of Proxima Centauri in Fig. 1. The source signal was extracted from a circular region with 12 radius centered on the proper-motion corrected and nominal position of Proxima Centauri.
3.1 X-ray light curves
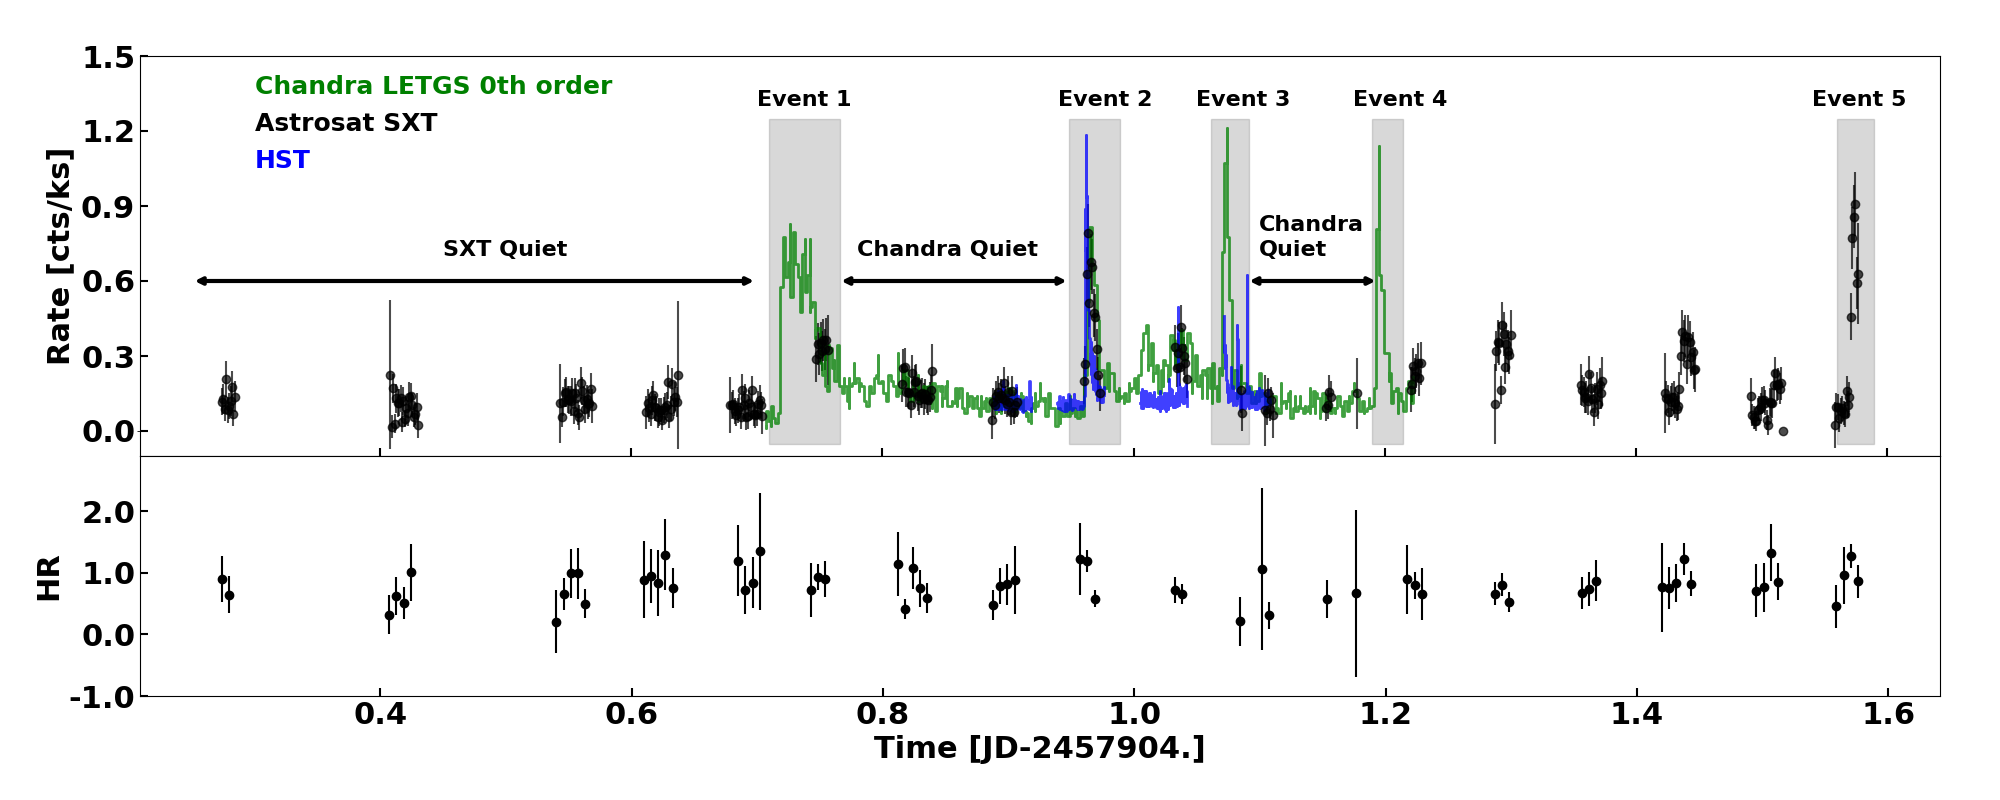
In Fig. 2 (black data points), we plot the background-subtracted SXT light curves for Proxima Centauri binned by 100 s over the entire 110 ks observing period by AstroSat; the obtained zeroth-order LETG/HRC-S light curve is also shown as green data points. Fig. 2 clearly shows the different observation patterns followed by AstroSat and Chandra; the AstroSat data stream is frequently interrupted by Earth blocks, while the Chandra data stream is continuous. Fortuitously, the count rates measured by both instruments are very similar. Although the HRC-S has no useful energy resolution in 0th order, we can study spectral variability by using the SXT data to create hardness ratios (HR). It is defined as the ratio between the counts in the hard band (1.0-3.0 keV) and the soft band (0.3-1.0 keV) we can study spectral variability. In Fig. 2 bottom panel, the HR binned to 500 s is plotted. Due to the sparse sampling of the HR plots, we do not see any heating related trends.
Several energetic events can be seen in both AstroSat and Chandra light curves; we call them Events 1-5. There are four flare-like events seen in the Chandra light curve we call them Events 1-4. The peak count rate of Event 1, 3 and 4 observed in Chandra light curves are 0.75, 1.23 and 1.18 cts s-1, respectively. Event 2 which occurred around JD2457904.94 was covered by both X-ray instruments as well as HST. During Event 2 the count rate increased from the quiescent value of cts s-1 to cts s-1 in both Chandra and SXT lightcurves in 0.5-4.0 keV range. Correspondingly, during the flare the HST lightcurve shows that the normalised flux increases by two orders of magnitude. The Event 2 occurs over 2700s producing integrated energy of 4.7 erg in 0.5-4.0 keV (see Section 3.2 for discussion of spectral fitting). The energetics of the Event 2 indicates a moderate flare in comparison to the very strong flare studied by Güdel et al. (2004) with a total energy of erg and several other flares with energies of the order of erg studied by Fuhrmeister et al. (2011). Furthermore, we note an increased activity state of Proxima Centauri towards the end of AstroSat observations which we call Event 5. The count rate reaches a maximum of 0.90 cts s-1. However, since the observations ended during the event we did not carry out further analysis.
| Parameter | LETG/HRC-S | AstroSat | ||
|---|---|---|---|---|
| Quiet | Events 1-4 | Quiet | Event 2 | |
| T1 | 0.5 | 0.5 | 0.5 | 0.5 |
| keV | ||||
| T2 | 1.0 | 1.0 | 1.0 | 1.0 |
| keV | ||||
| T3 | 2.0 | 2.0 | 2.0 | 2.0 |
| keV | ||||
| EM1 | 2.16 | 2.04 | 3.99 | 9.88 |
| cm | ||||
| EM2 | 2.64 | 3.76 | 13.21 | 15.47 |
| cm | ||||
| EM3 | 5.93 | 5.14 | 10.81 | 12.32 |
| cm | ||||
| Abundance† | 0.23 | 0.35 | 0.38 | 0.32 |
| Flux | 3.520.58 | 7.85 0.75 | 5.13 0.72 | 15.59 1.56 |
| LX | 0.710.11 | 1.580.15 | 1.030.15 | 3.150.32 |
| 1.77 | 1.93 | 1.12 | 1.23 | |
†Relative to solar photosphere
3.2 Spectra
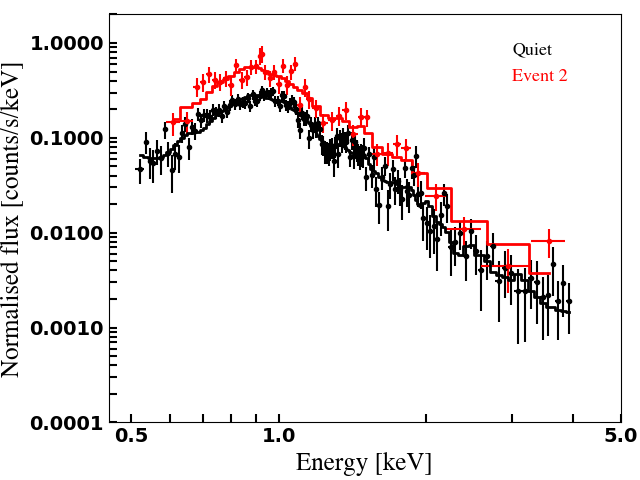
We extracted the quiescent and flaring interval spectra of Proxima Centauri to study the emission measure and coronal elemental abundance changes as a result of the flares. In Fig. 3 (left panel), we plot the SXT spectra during quiescence (black data points) and event 2 (red data points).
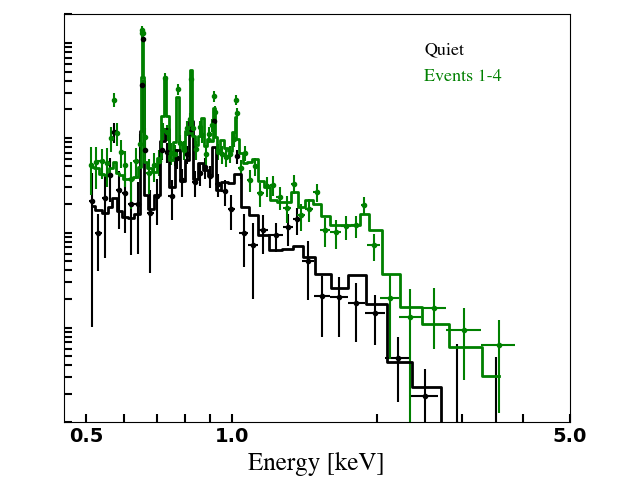
The Chandra LETG/HRC-S zeroth-order light curve shows a large number of flaring events. The event 2 observed by AstroSat SXT has been observed by Chandra LETG/HRC-S as well, however, the signal-to-noise ratio for LETG/HRC-S spectra was not adequate for the spectral fit. Hence we combined all the LETG flare data (events 1-4) for fitting and selected two time periods in the remaining data (marked as "Chandra Quiet" in Figure 2) to create a quasi-quiescent spectrum. In Figure 3 right panel, we show the Chandra integrated spectra of the quiescent and combined events 1-4. We fit the LETG/HRC-S spectra in 0.206-7.0 keV range for the positive order and 0.252-7.0 keV range for the negative order independently for the flare and quiescent time intervals.
Using XSPEC, we performed a global fit to the SXT spectra using APEC plasma models 444https://heasarc.gsfc.nasa.gov/xanadu/xspec/manual/node135.html to the SXT spectra. To compare the quiescent and the flaring state we defined a fixed temperature grid with values 0.5, 1.0 and 2.0 keV (5.7, 11.5 and 23 MK, respectively). In these fits, the determined abundances are relative to solar values Grevesse & Sauval (1998), and all three temperature components share the same abundance. We allowed the abundance to vary independently to fit the quiescent and flare spectra. Assuming a distance of 1.3 pc, we also calculate the emission measure from the component’s normalisation. Similar to SXT spectra, we fit the quiescent and the events 1-4 observed with Chandra with 3 temperature APEC models allowing the abundance to vary freely. The resulting fit parameters are given in Table 2.
Although the 3 temperature component APEC may be adequate to interpret the spectra observed with SXT, the assumption of three discrete temperatures is not realistic to physically describe the stellar coronae. Hence we also experimented with a more complex model such as a c6pmekl 555https://heasarc.gsfc.nasa.gov/xanadu/xspec/manual/node149.html which uses 6th order Chebyshev polynomial describing differential emission measure (Lemen et al., 1989; Singh et al., 1996). However, we found that the 3 temperature model described above provides a reasonable description of our data.
During a flare, fresh chromospheric material unaffected by elemental differentiation ( First ionisation potential effect also known as "FIP effect") is expected to be evaporated and transported into the corona, thus changing the coronal emission measure and potentially some element abundances (Ottmann & Schmitt, 1996; Benz & Güdel, 2010). In a moderately active M star such as Proxima Centauri, during quiescent emission, a pronounced anti-FIP effect is expected (Wood & Linsky, 2010; Fuhrmeister et al., 2011), but uncertainties for the abundances during quiescence and flaring were too large in our fits to detect any differences.
Since the quantum efficiency and the effective area of X-ray instruments are not uniform over energy bands, we compare the Chandra LETG/HRC-S and AstroSat SXT in smaller segments of energy bandpasses. We used the quiescent spectra of both the instruments in five energy bandpasses 0.5-1.0 keV, 1.0-1.5 keV, 1.5-2.0 keV, 2.0-4.0 keV, and 4.0-7.0 keV. We fit 3 temperature APEC models and ignored all the data points out of the energy band of interest. We note that the LETG/HRC-S above 2 keV is not useful due to statistical limitations. The flux ratio between the AstroSat SXT and Chandra LETG/HRC-S produces a difference 1.5. The difference in the fluxes could be inherent due to the difference in the time periods chosen for the spectra. Furthermore, since the calibration to convert the counts into absolute fluxes are not very accurate, this can also result in the discrepancies when we compare the fluxes from different instruments.
3.3 Simultaneous observation
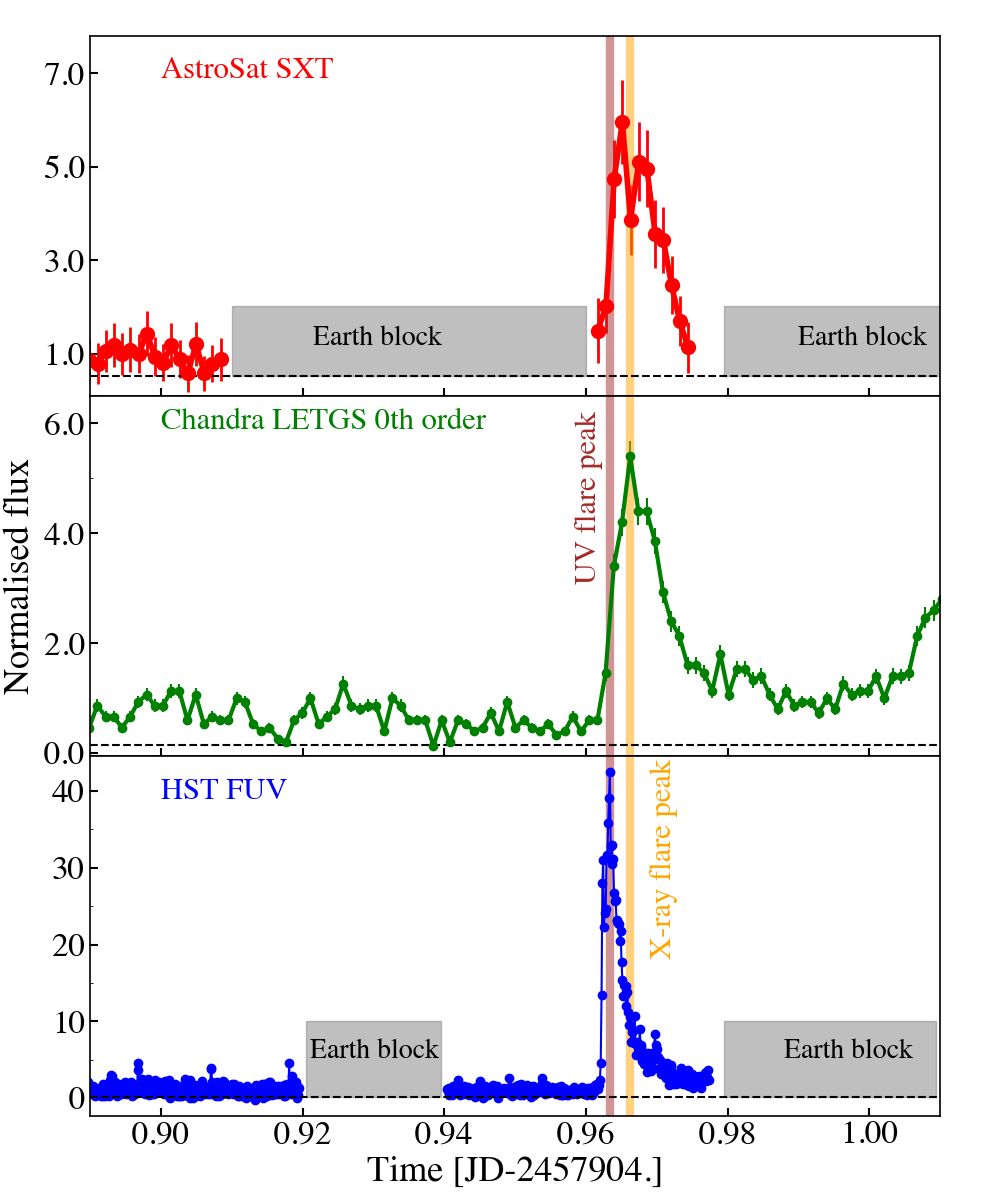
In Figure 4, we show a close-up view of Event 1 observed simultaneously with AstroSat SXT, Chandra LETG/HRC-S and HST binned to 100s each. The vertical lines in brown and yellow represents the UV and X-ray flare peaks, respectively. The amplitudes of the HST light curves are scaled to be consistent with X-ray light curves. A detailed analysis of the HST data will be presented in Schneider et al (in preparation). However, a visual inspection of Fig. 4 indicates that the HST FUV light curve precedes the X-ray light curves by about a few minutes. This may indicate that the presence of Neupert effect (Neupert, 1968) during the rising phase of Event 2. Using the Z-transformed Discrete Correlation Function (ZDCF) (Alexander, 1997), the cross-correlation of the HST and the X-ray light curves produces a time-lag between the peaks to be 300-400 s, indicating that due to electron impingement the UV light curve precedes the thermal radiation.
3.4 Comparison
The quiescent emission measured with Einstein, EXOSAT and ROSAT in 0.3-4.0 keV energy ranges are 7.2, 4-16 and 2.6-7.2 erg s-1 cm-2, respectively. The quiescent X-ray flux observed by Einstein and EXOSAT was reported by Haisch & Linsky (1980) and Haisch et al. (1990), respectively. We used the ROSAT observations listed in the ROSAT Positive Sensitive Proportional Counter source catalogue Voges et al. (1996, 2000). Assuming a coronal temperature of 1 keV, sub-solar abundance of 0.5 and using WebPIMMS, we computed energy conversion factor ECFPSPC = 6.4 erg cm-2 counts-1 to convert the observed ROSAT counts to flux in canonical 0.1-2.4 keV ROSAT energy band. Furthermore, we use the X-ray flux reported by Fuhrmeister et al. (2011) based on XMM-Newton observations. In Figure 5, we plot quiescent flux measured between 1979 and 2017 as a function of time. Furthermore, we assume similar temperature and abundance as before and used WebPIMMS to estimate the flux in the 0.3-4.0 keV energy range. The flux obtained from AstroSat is consistent with the previous estimates of quiescent flux for Proxima Centauri.
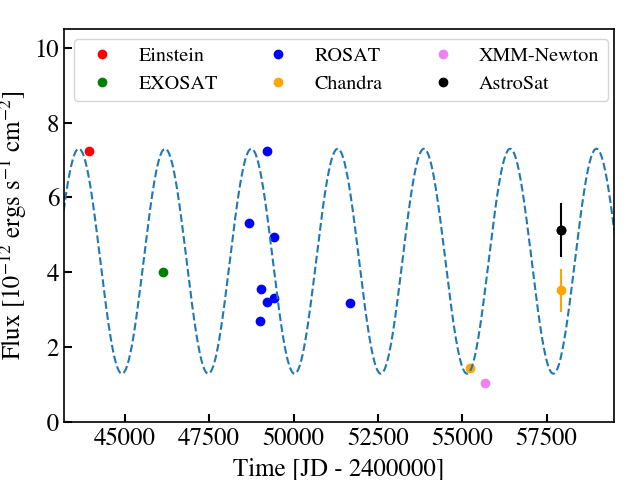
While a clear cyclic behaviour with a period of 7.0 years is observed for Proxima Centauri in ASAS observations, a similar variation in the X-ray data is not apparent immediately. However, Wargelin et al. (2017) reported the evidence for a 7-yr stellar cycle using observations from several X-ray missions, principally Swift. The temporal coverage of X-ray observation, the energy resolution and uncertainties due cross-calibration restrict a detailed analysis of the cyclic behaviour of Proxima Centauri. However, we performed a periodogram analysis of all the compiled X-ray data, but we were unable to obtain a significant peak indicating a period. We used the 7-yr period obtained from the optical light curve obtained based on ASAS observations reported by (Suárez Mascareño et al., 2016). We assumed that the optical period also applies to the X-ray data and plot a sinusoidal curve with a period of 7-yr in Fig. 5. Furthermore, assuming that the optical cycle also applies to the X-ray cycle, we carried out a correlation analysis between the two datasets. We used the fitted optical light curve at each X-ray observation, to relate the X-ray observations to the measured optical magnitude. We computed the linear Pearson correlation coefficient () of -0.42 between the X-ray flux and the optical magnitude with a two-tailed probability value of 0.02. The results suggest an anti-correlation between the X-ray and optical data. However, obtaining additional X-ray data from missions such as AstroSat will be valuable to obtain a precise cyclic variation of Proxima Centauri.
4 Summary
To summarise,
-
•
We have presented the light curves and spectra of Proxima Centauri obtained from the SXT onboard AstroSat. The observation was carried out as a part of the simultaneous observational campaign with Chandra and HST.
-
•
Both SXT and Chandra LETG/HRC-S zeroth-order light curves cover a flare-like event.
-
•
The timing behaviour of the flare-like event shows Neupert effect similar to the solar flares where the UV light curve precedes the soft X-ray light curves.
-
•
Three-temperature component models provide the best fit to SXT spectra with sub-solar abundance.
-
•
The emission measure distribution model peaks around 1 keV.
-
•
The AstroSat quiescent X-ray flux in 0.3-4.0 keV energy range is consistent with previous estimates of quiescent flux.
Acknowledgements
This publication uses the data from the AstroSat mission of the Indian Space Research Organisation (ISRO). This work has used the data from the Soft X-ray Telescope (SXT) The SXT POCs at TIFR are thanked for verifying and releasing the data via the ISSDC data archive and providing the necessary software tools. This research has made use of the data and software obtained from NASA’s High Energy Astrophysics Science Archive Research Center (HEASARC), a service of Goddard Space Flight Center and the Smithsonian Astrophysical Observatory. The use of the XRT Data Analysis Software (XRTDAS) developed under the responsibility of the ASI Science Data Center (ASDC), is gratefully acknowledged. This work has made use of observations with Chandra and HST. This work was also partially supported by a Leverhulme Trust Research Project Grant.
References
- Agrawal (2006) Agrawal P. C., 2006, Advances in Space Research, 38, 2989
- Agrawal (2017) Agrawal P. C., 2017, Journal of Astrophysics and Astronomy, 38, 27
- Alexander (1997) Alexander T., 1997, in Maoz D., Sternberg A., Leibowitz E. M., eds, Astrophysics and Space Science Library Vol. 218, Astronomical Time Series. p. 163, doi:10.1007/978-94-015-8941-3_14
- Anglada-Escudé et al. (2016) Anglada-Escudé G., et al., 2016, Nature, 536, 437
- Arnaud (1996) Arnaud K. A., 1996, in Jacoby G. H., Barnes J., eds, ASP Conf. Ser. 101: Astronomical Data Analysis Software and Systems V. pp 17–+
- Benz & Güdel (2010) Benz A. O., Güdel M., 2010, ARA&A, 48, 241
- Boyajian et al. (2012) Boyajian T. S., et al., 2012, ApJ, 757, 112
- Brinkman et al. (1987) Brinkman A. C., van Rooijen J. J., Bleeker J. A. M., Dijkstra J. H., Heise J., de Korte P. A. J., Mewe R., Paerels F., 1987, Astrophysical Letters and Communications, 26, 73
- Brinkman et al. (1997) Brinkman A. C., et al., 1997, in Hoover R. B., Walker A. B., eds, Proc. SPIEVol. 3113, Grazing Incidence and Multilayer X-Ray Optical Systems. pp 181–192, doi:10.1117/12.278846
- Fuhrmeister et al. (2011) Fuhrmeister B., Lalitha S., Poppenhaeger K., Rudolf N., Liefke C., Reiners A., Schmitt J. H. M. M., Ness J.-U., 2011, A&A, 534, A133
- Grevesse & Sauval (1998) Grevesse N., Sauval A. J., 1998, Space Sci. Rev., 85, 161
- Güdel et al. (2002) Güdel M., Audard M., Skinner S. L., Horvath M. I., 2002, ApJ, 580, L73
- Güdel et al. (2004) Güdel M., Audard M., Reale F., Skinner S. L., Linsky J. L., 2004, A&A, 416, 713
- Haisch & Linsky (1980) Haisch B. M., Linsky J. L., 1980, ApJ, 236, L33
- Haisch et al. (1983) Haisch B. M., Linsky J. L., Bornmann P. L., Stencel R. E., Antiochos S. K., Golub L., Vaiana G. S., 1983, ApJ, 267, 280
- Haisch et al. (1990) Haisch B. M., Butler C. J., Foing B., Rodono M., Giampapa M. S., 1990, A&A, 232, 387
- Haisch et al. (1995) Haisch B., Antunes A., Schmitt J. H. M. M., 1995, Science, 268, 1327
- Howard et al. (2018) Howard W. S., et al., 2018, ApJ, 860, L30
- Kiraga & Stepien (2007) Kiraga M., Stepien K., 2007, Acta Astron., 57, 149
- Lammer et al. (2003) Lammer H., Selsis F., Ribas I., Guinan E. F., Bauer S. J., Weiss W. W., 2003, ApJ, 598, L121
- Lemen et al. (1989) Lemen J. R., Mewe R., Schrijver C. J., Fludra A., 1989, ApJ, 341, 474
- Lim et al. (1996) Lim J., White S. M., Slee O. B., 1996, ApJ, 460, 976
- MacGregor et al. (2018) MacGregor M. A., Weinberger A. J., Wilner D. J., Kowalski A. F., Cranmer S. R., 2018, ApJ, 855, L2
- Neupert (1968) Neupert W. M., 1968, ApJ, 153, L59
- Ottmann & Schmitt (1996) Ottmann R., Schmitt J. H. M. M., 1996, A&A, 307, 813
- Reid et al. (2001) Reid I. N., Burgasser A. J., Cruz K. L., Kirkpatrick J. D., Gizis J. E., 2001, AJ, 121, 1710
- Shapley (1951) Shapley H., 1951, Proceedings of the National Academy of Science, 37, 15
- Singh et al. (1996) Singh K. P., White N. E., Drake S. A., 1996, ApJ, 456, 766
- Singh et al. (2014) Singh K. P., et al., 2014, in Space Telescopes and Instrumentation 2014: Ultraviolet to Gamma Ray. p. 91441S, doi:10.1117/12.2062667
- Singh et al. (2016) Singh K. P., et al., 2016, in Space Telescopes and Instrumentation 2016: Ultraviolet to Gamma Ray. p. 99051E, doi:10.1117/12.2235309
- Singh et al. (2017a) Singh K. P., et al., 2017a, Journal of Astrophysics and Astronomy, 38, 29
- Singh et al. (2017b) Singh K. P., Dewangan G. C., Chandra S., Bhattacharayya S., Chitnis V., Stewart G. C., Westergaard N. J., 2017b, Current Science, 113, 587
- Suárez Mascareño et al. (2016) Suárez Mascareño A., Rebolo R., González Hernández J. I., 2016, A&A, 595, A12
- Voges et al. (1996) Voges W., et al., 1996, IAU Circ., 6420, 2
- Voges et al. (2000) Voges W., et al., 2000, IAU Circ., 7432, 3
- Wargelin et al. (2017) Wargelin B. J., Saar S. H., Pojmański G., Drake J. J., Kashyap V. L., 2017, MNRAS, 464, 3281
- Wood & Linsky (2010) Wood B. E., Linsky J. L., 2010, The Astrophysical Journal, 717, 1279
- van Leeuwen (2007) van Leeuwen F., 2007, A&A, 474, 653