Vítor Albierovalbiero@nd.edu1
\addauthorKevin W. Bowyerkwb@nd.edu1
\addinstitution
Computer Vision Research Lab
University of Notre Dame
Notre Dame, USA
Is Face Recognition Sexist?
Is Face Recognition Sexist?
No, Gendered Hairstyles and Biology Are
Abstract
Recent news articles have accused face recognition of being “biased”, “sexist” or “racist”. There is consensus in the research literature that face recognition accuracy is lower for females, who often have both a higher false match rate and a higher false non-match rate. However, there is little published research aimed at identifying the cause of lower accuracy for females. For instance, the 2019 Face Recognition Vendor Test that documents lower female accuracy across a broad range of algorithms and datasets also lists “Analyze cause and effect” under the heading “What we did not do”. We present the first experimental analysis to identify major causes of lower face recognition accuracy for females on datasets where previous research has observed this result. Controlling for equal amount of visible face in the test images reverses the apparent higher false non-match rate for females. Also, principal component analysis indicates that images of two different females are inherently more similar than of two different males, potentially accounting for a difference in false match rates.
1 Introduction
Many news articles in recent years have criticized face recognition as being “biased”, “sexist” or “racist” [Lohr(2018), Hoggins(2019), Doctorow(2019), Santow(2020)]. Various papers summarized in Related Work have reported that face recognition is less accurate for females. Accuracy also varies between racial groups, and age ranges, but this paper focuses on the female / male difference. Surprisingly, given the media attention on the issue, the underlying cause(s) of lower accuracy for females are heretofore unknown. The popularity of deep CNN algorithms perhaps naturally gives rise to the common speculation that the cause is female under-representation in the training data. But recent studies show that simply using a gender-balanced training set does not result in balanced accuracy on test data [Albiero et al.(2020c)Albiero, Zhang, and Bowyer, Albiero et al.(2020b)Albiero, Krishnapriya, Vangara, Zhang, King, and Bowyer].
This paper is the first to present experimental results that explain the causes of lower face recognition accuracy for females, on datasets where this result is observed in previous research. To promote reproducible and transparent results, we use a state-of-the-art deep CNN matcher and datasets that are available to other researchers. Our experiments show that gendered hairstyles result in, on average, more of the face being occluded for females, and that the inherent variability between different female faces is lower.
2 Related Work
Drozdowski et al. [Drozdowski et al.(2020)Drozdowski, Rathgeb, Dantcheva, Damer, and Busch] give a current, broad survey on demographic bias in biometrics. Here we focus on selected prior works dealing specifically with female / male accuracy difference.
The earliest work we are aware of to report lower accuracy for females is the 2002 Face Recognition Vendor Test (FRVT) [Phillips et al.(2003)Phillips, Grother, Micheals, Blackburn, Tabassi, and Bone]. Evaluating ten algorithms of that era, identification rates of the top systems are 6% to 9% higher for males. However, for the highest-accuracy matcher, accuracy was essentially the same. In a 2009 meta-analysis of results from eight prior papers, Lui et al. [Lui et al.(2009)Lui, Bolme, Draper, Beveridge, Givens, and Phillips] concluded that there was a weak pattern of lower accuracy for females, and noted interactions with factors such as age, expression, lighting and indoor/outdoor imaging. Beveridge et al. [Beveridge et al.(2009)Beveridge, Givens, Phillips, and Draper] analyzed results for three algorithms on a Face Recognition Grand Challenge [Phillips et al.(2005)Phillips, Flynn, Scruggs, Bowyer, Chang, Hoffman, Marques, Min, and Worek] dataset, and found that males had a higher verification rate for the two higher-accuracy algorithms and females had a higher verification rate for the third, lower-accuracy algorithm. Klare et al [Klare et al.(2012)Klare, Burge, Klontz, Vorder Bruegge, and Jain] presented results from three commercial off-the-shelf (COTS) and three research algorithms showing that females had a worse receiver operating characteristic (ROC) curve for all six, and also showed example results for which females had both a worse impostor distribution and a worse genuine distribution.
The above works are from before the deep convolutional neural network (CNN) wave in face recognition. Related works since the rise of deep CNN matchers report similar results.
Cook et al. [Cook et al.(2019)Cook, Howard, Sirotin, and Tipton] analyze images acquired using eleven different automated kiosks with the same COTS matcher, and report that genuine scores are lower for females. Lu et al. [Lu et al.(2019)Lu, Chen, Castillo, and Chellappa] use deep CNN matchers and datasets from the IARPA Janus program in a detailed study of the effect of various covariates, and report that accuracy is lower for females. Howard et al. [Howard et al.(2018)Howard, Blanchard, Sirotin, Hasselgren, and Vemury] report higher false match rates for African-American and Caucasian females under age 40. For subjects over 40, African-American females again had a higher false match rate, but Caucasian females had a lower false match rate than Caucasian males. However, the dataset is the smallest of the recent papers on this topic, with just 363 subjects, divided into 8 subsets for this analysis. Vera-Rodriguez et al. [R. Vera-Rodriguez(2019)] use a Resnet-50 and a VGGFace matcher with the VGGFace2 dataset [Cao et al.(2018)Cao, Shen, Xie, Parkhi, and Zisserman], and report that females have a worse ROC for both. Albiero et al. [Albiero et al.(2020b)Albiero, Krishnapriya, Vangara, Zhang, King, and Bowyer] use the ArcFace matcher with four datasets, and report that the general pattern of results is that females have a worse ROC curve, impostor distribution and genuine distribution. Similarly, Krishnapriya et al. [Krishnapriya et al.(2020)Krishnapriya, Albiero, Vangara, King, and Bowyer] show that both the ArcFace and the VGGFace2 matcher, which are trained on different datasets and with different loss functions, result in a worse ROC curve, impostor distribution and genuine distribution for females, for both African-American and Caucasian image cohorts. Grother et al. [Patrick Grother and Hanaoka(2003)], in the 2019 FRVT focused on demographic analysis, found that females have higher false match rates (worse impostor distribution), and that the phenomenon is consistent across a wide range of different matchers and datasets. Relative to the genuine distribution, they report that women often have higher false negative error rates, but also note that there are exceptions to this generalization.
The general pattern across these works, for a broad variety of matchers and datasets, is that face recognition accuracy is lower for females, with females having a worse impostor distribution and a worse genuine distribution.
Several researchers have speculated cosmetics use as a cause of the gender gap in accuracy [Klare et al.(2012)Klare, Burge, Klontz, Vorder Bruegge, and Jain, Cook et al.(2019)Cook, Howard, Sirotin, and Tipton, Lu et al.(2019)Lu, Chen, Castillo, and Chellappa]. Dantcheva et al. [Dantcheva et al.(2012)Dantcheva, Chen, and Ross] and others have documented how the use of cosmetics can degrade face recognition accuracy. In scenarios where females have substantial cosmetics use and males do not, this is a possible cause of the accuracy gender gap. However, Albiero et al [Albiero et al.(2020b)Albiero, Krishnapriya, Vangara, Zhang, King, and Bowyer] showed that cosmetics plays at most a minor role in the MORPH dataset, which is the main dataset also used in this paper. Other speculated causes include more varied hairstyles for females [Albiero et al.(2020b)Albiero, Krishnapriya, Vangara, Zhang, King, and Bowyer] and shorter height for women, leading to non-optimal camera angle [P. J. Grother and Phillips(2010), Cook et al.(2019)Cook, Howard, Sirotin, and Tipton].
Buolamwini and Gebru [Buolamwini and Gebru(2018)], Muthukumar et al. [Muthukumar et al.(2018)Muthukumar, Pedapati, Ratha, Sattigeri, Wu, Kingsbury, Kumar, Thomas, Mojsilovic, and Varshney] and others have looked at the accuracy of algorithms that predict gender from a face image, and found lower accuracy for females. Gender classification of a face image is a related problem but distinct from face recognition.
Very few works attempt to identify the cause(s) of the accuracy gender gap. For example, the recent NIST report on demographic effects [Patrick Grother and Hanaoka(2003)] lists “analyze cause and effect” as an item under “what we did not do”. However, Albiero et al. [Albiero et al.(2020b)Albiero, Krishnapriya, Vangara, Zhang, King, and Bowyer] reported on experiments to determine if cosmetics use, facial expression, forehead occlusion by hair, or downward-looking camera angle could explain the worse impostor and genuine distributions observed for females. They found that these factors, either individually or together, did not significantly impact the gender gap in accuracy. A popular speculation is that accuracy is lower for females because they are under-represented in the training data. Albiero et al. [Albiero et al.(2020c)Albiero, Zhang, and Bowyer] trained matchers from scratch using male / female ratios of 0/100, 25/75, 50/50, 75/25 and 100/0. They found that explicitly gender-balanced training data does not result in balanced accuracy on test data, and that in fact a 25% male / 75% female training set resulted in the least-imbalanced test accuracy, but was generally not the training mix that maximized female, male, or average accuracy.
3 Lower Recognition Accuracy For Females
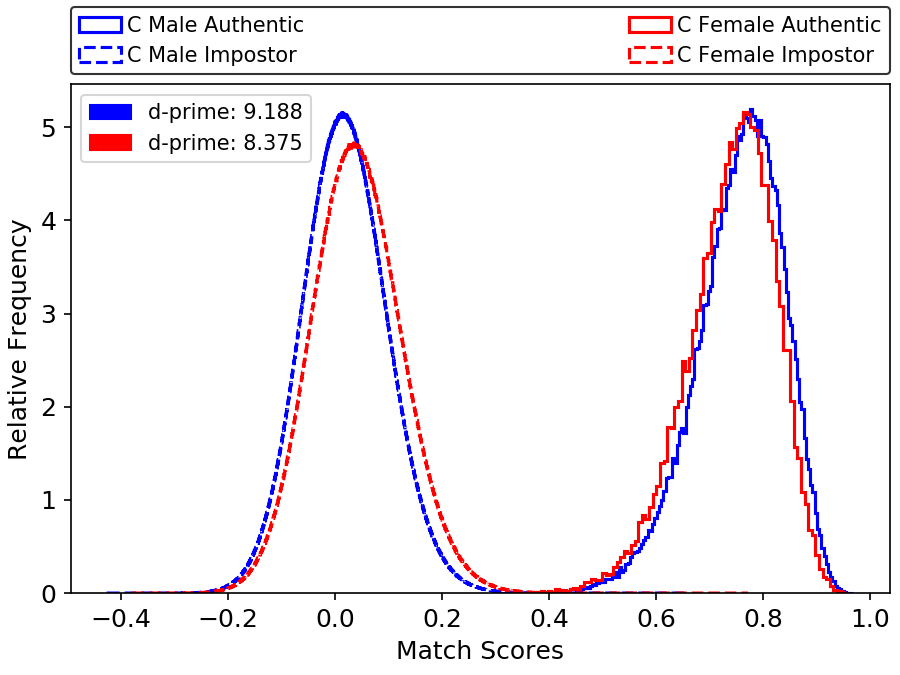
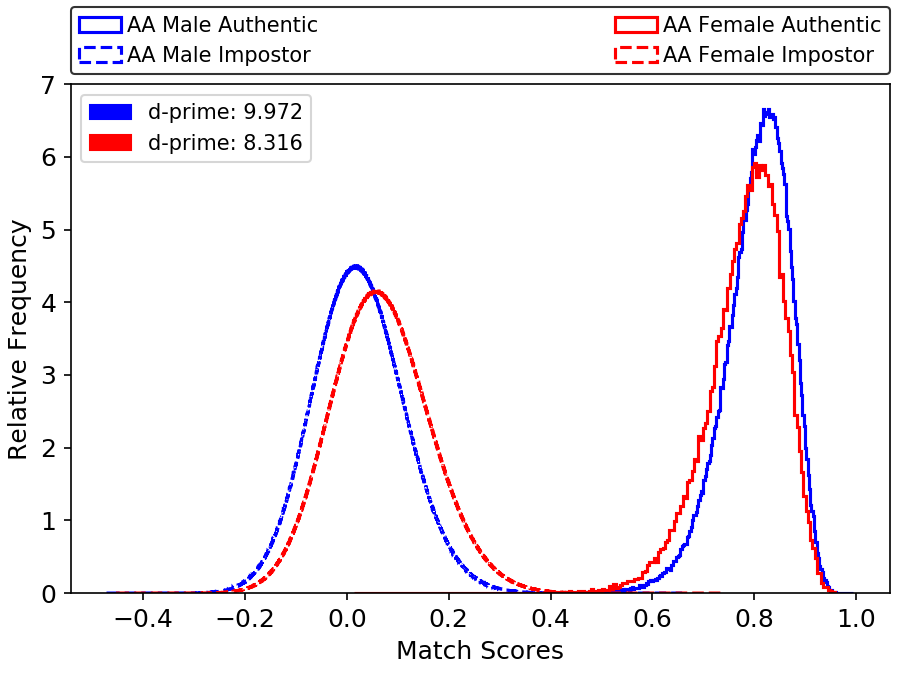
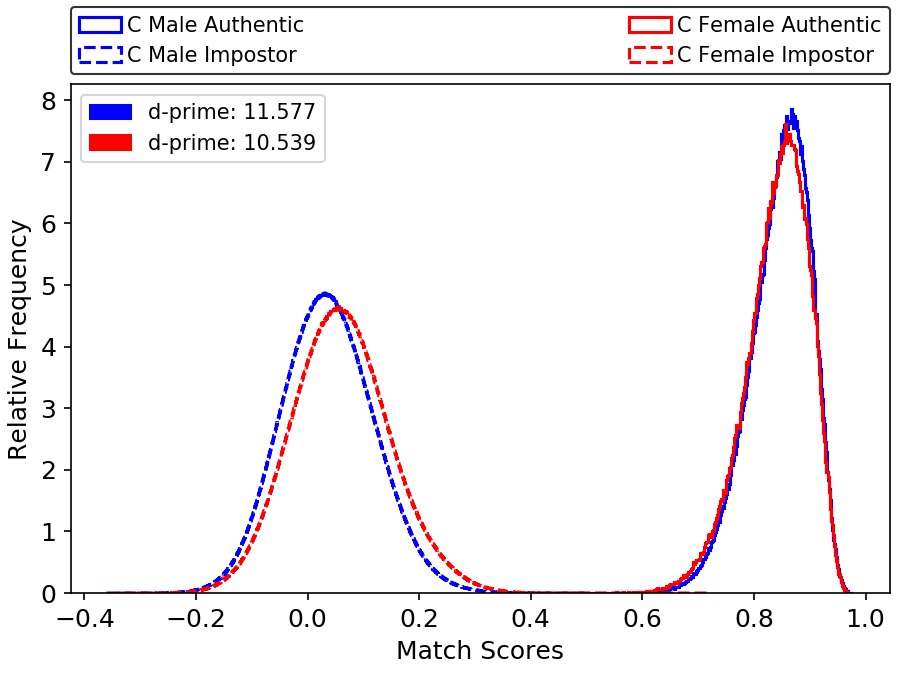
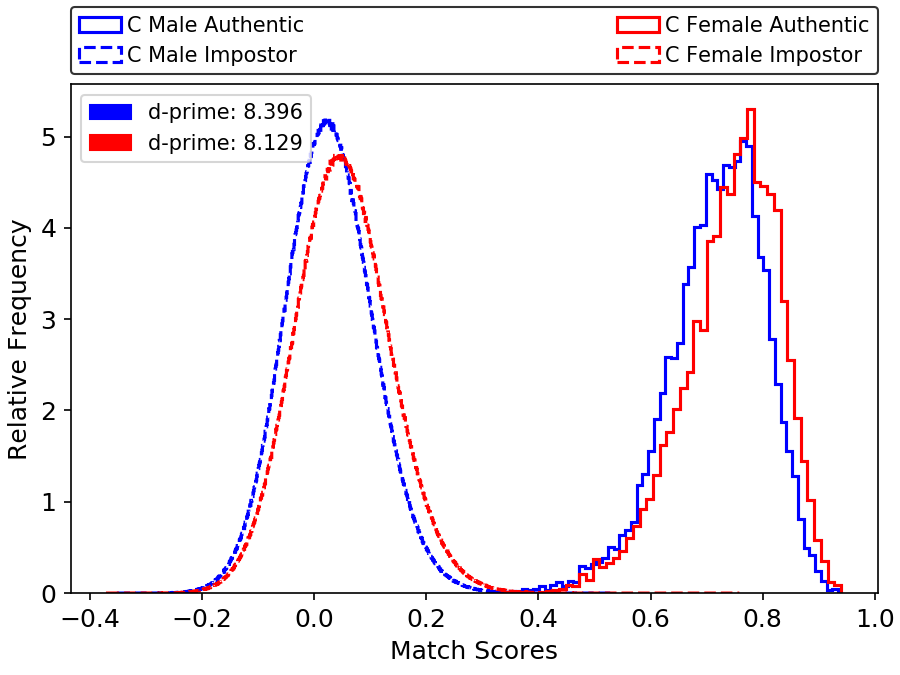
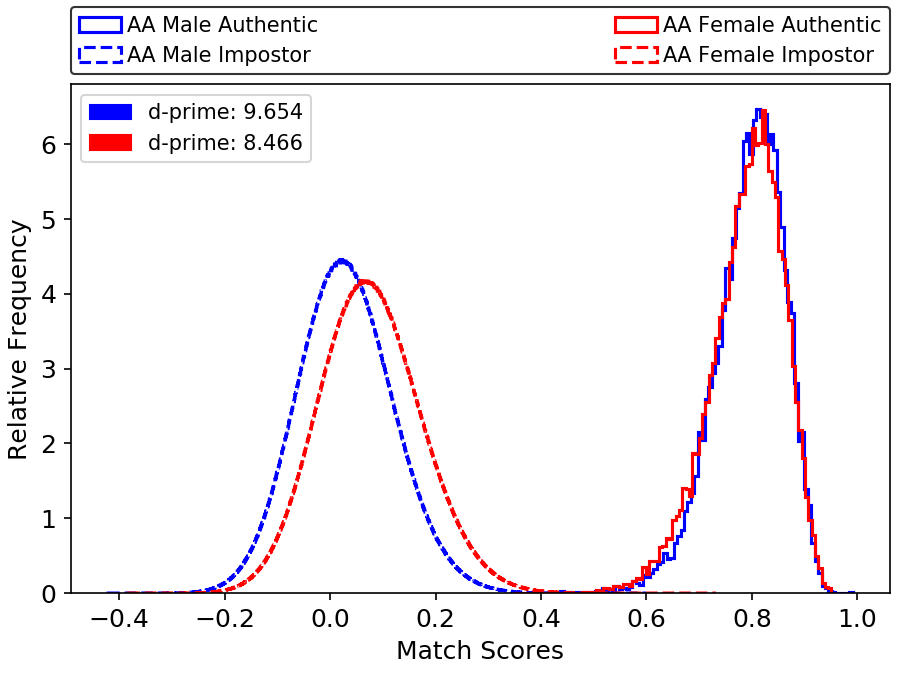
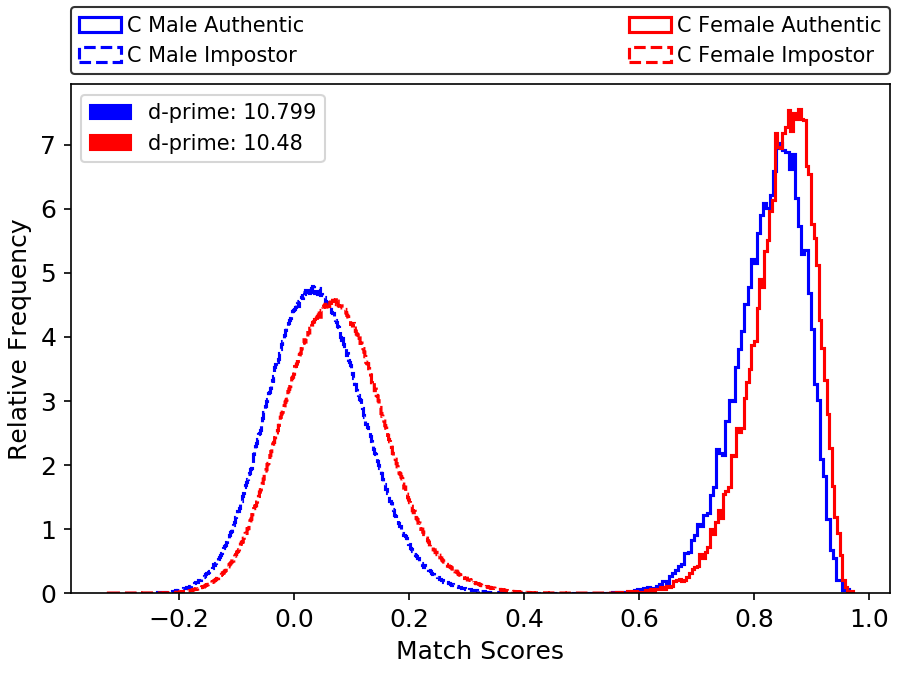
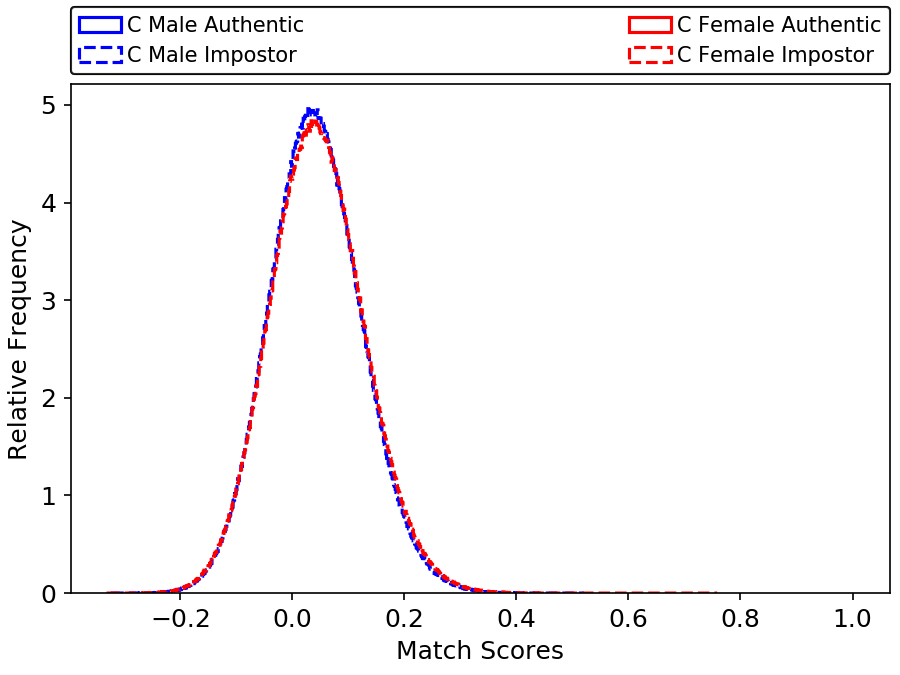
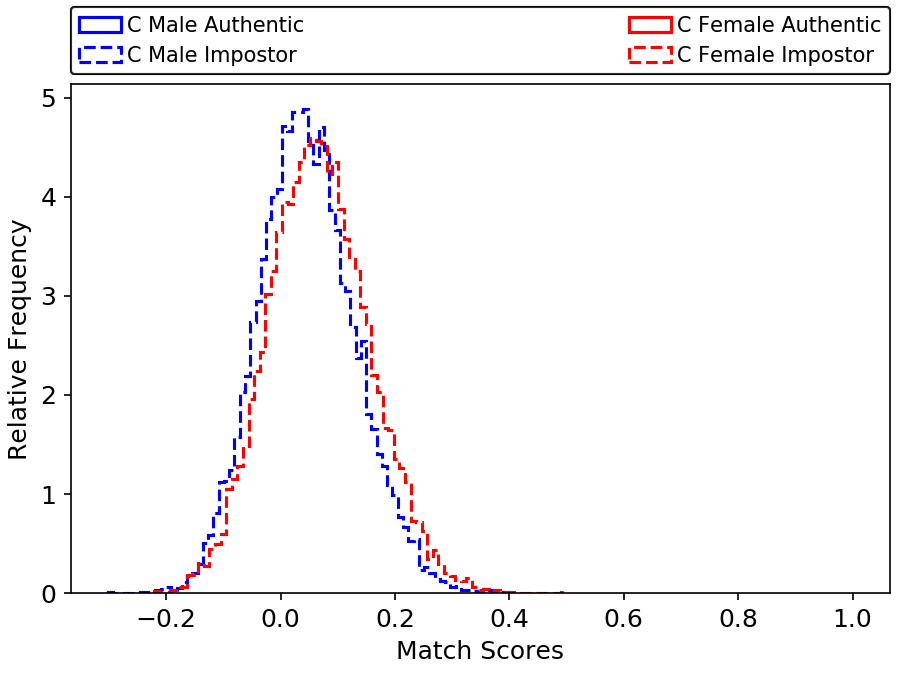
The results in Figure 2 are representative of the consensus across many different matchers and datasets as covered in the Related Work. Note that the female impostor distribution ranges over higher similarity scores, indicating a higher false match rate (FMR), and also that the female genuine distribution ranges over lower similarity scores, indicating a higher false non-match rate (FNMR).
The MORPH dataset [Ricanek and Tesafaye(2006), MOR()] was originally collected to support research in face aging, and has been widely used in that context. In the last few years, it has also been used in the study of demographic variation in accuracy [Krishnapriya et al.(2020)Krishnapriya, Albiero, Vangara, King, and Bowyer, Albiero et al.(2020c)Albiero, Zhang, and Bowyer, Albiero et al.(2020b)Albiero, Krishnapriya, Vangara, Zhang, King, and Bowyer, Albiero et al.(2020a)Albiero, Bowyer, Vangara, and King, Krishnapriya et al.(2019)Krishnapriya, Vangara, King, Albiero, and Bowyer]. MORPH contains mugshot-style images that are nominally frontal pose, neutral expression and acquired with controlled lighting and an 18% gray background. We curated the MORPH 3 dataset in order to remove duplicate images, twins, and mislabeled images. The results in Figure 2 are for a subset of MORPH 3 that contains: 35,276 images of 8,835 Caucasian males, 10,941 images of 2,798 Caucasian females, 56,245 images of 8,839 African-American males, and 24,857 images of 5,929 African-American females.
The Notre Dame dataset is a subset of the Face Recognition Grand Challenge dataset [Phillips et al.(2005)Phillips, Flynn, Scruggs, Bowyer, Chang, Hoffman, Marques, Min, and Worek], made available by the authors of a recent work in this area [Albiero et al.(2020b)Albiero, Krishnapriya, Vangara, Zhang, King, and Bowyer]. It contains frontal images, higher resolution than MORPH, with uniform background, for 261 Caucasian males (14,345 images) and 169 Caucasian females (10,021 images). Thus the number of subjects is an order-of-magnitude smaller than MORPH, and subjects have more images on average.
ArcFace [Deng et al.(2019a)Deng, Guo, Xue, and Zafeiriou] is a state-of-the-art deep CNN matcher. The instance of ArcFace used here corresponds to a set of publicly-available weights [Guo()], trained on the MS1MV2 dataset, which is a publicly-available, “cleaned” version of MS1M [Guo et al.(2016)Guo, Zhang, Hu, He, and Gao]. We estimate that MS1MV2 is about 73% male / 27% female in number of subjects and 67% male / 33% female in number of images [Albiero et al.(2020c)Albiero, Zhang, and Bowyer]. There should be zero overlap of subjects between MS1MV2 and the datasets generating the results in Figure 2.
The lower accuracy for females can be quantified in terms of the separation between the female and male impostor and genuine distributions. The cross-gender and same-gender d-prime values are shown in Table 1. For all three datasets, the female impostor distribution is shifted toward higher similarity scores than the male impostor distribution, the female impostor distribution is shifted toward lower similarity scores, with the result that the impostor-to-genuine separation is lower for females.
4 Less “Pixels On the Face” In Female Face Images


| Cross Gender d-prime | Same Gender Genuine-Impostor d-prime | |||
| Dataset | Genuine | Impostor | Male | Female |
| MORPH Caucasian | 0.197 | 0.266 | 9.19 | 8.38 |
| MORPH African-American | 0.314 | 0.458 | 9.97 | 8.32 |
| Notre Dame | 0.087 | 0.271 | 11.58 | 10.54 |
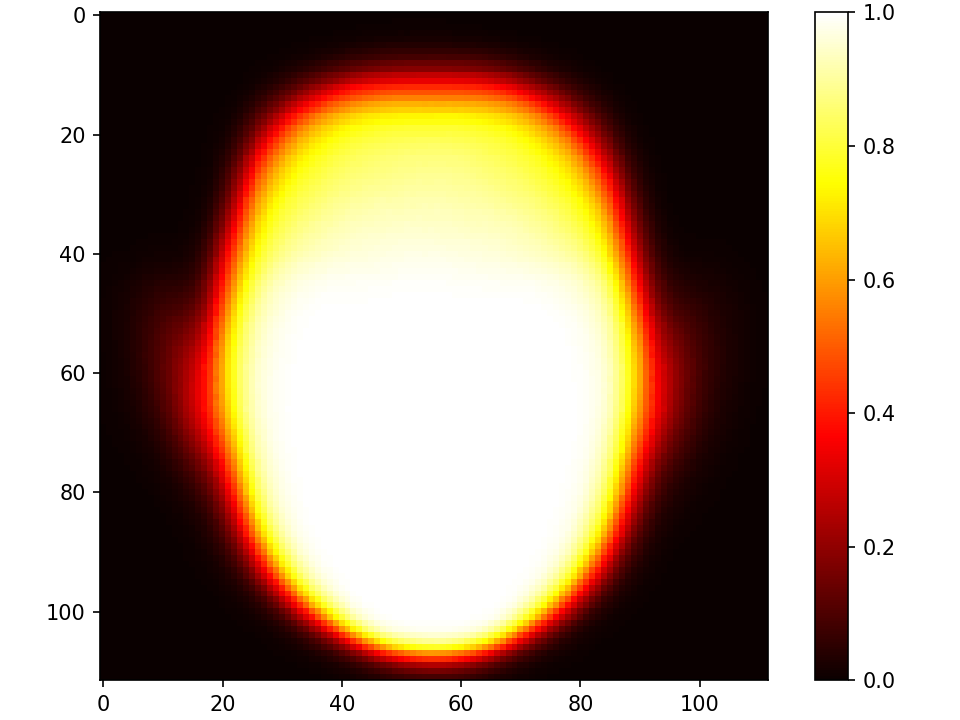

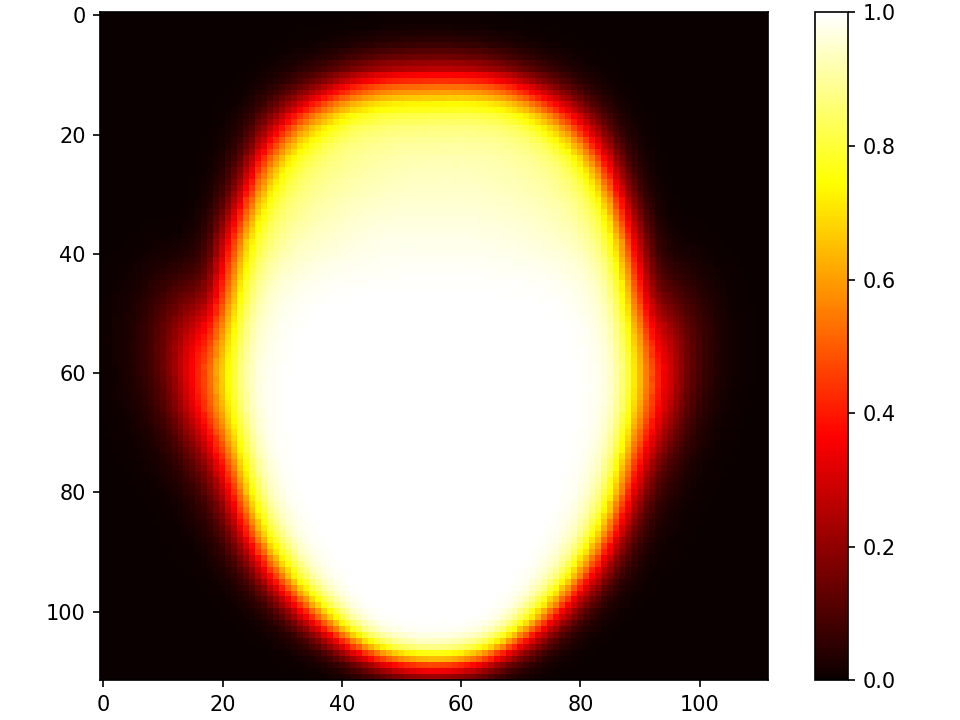
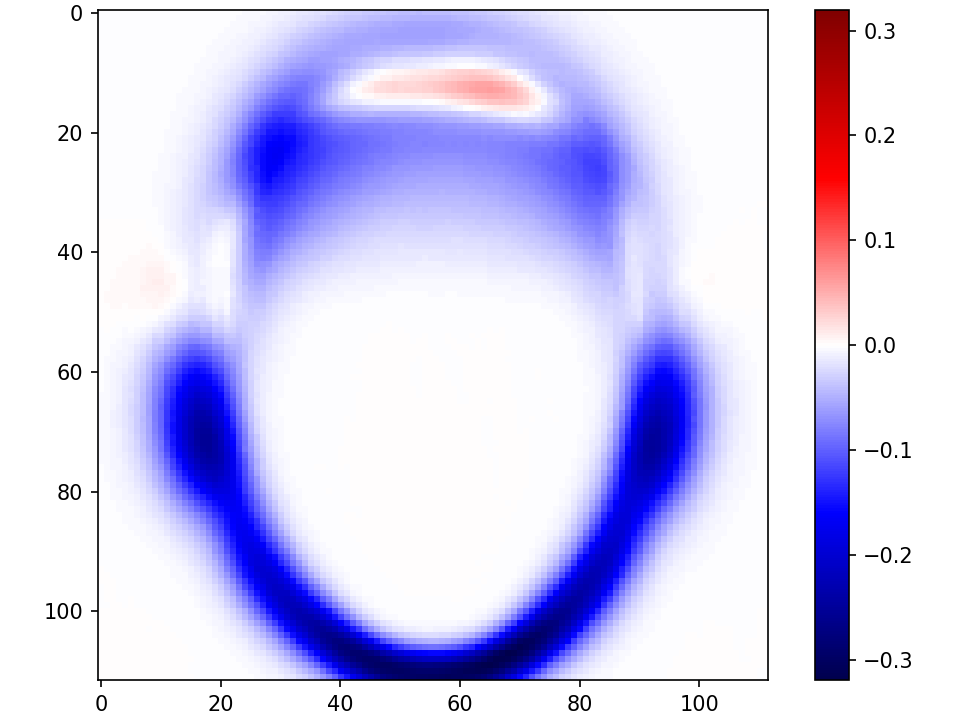
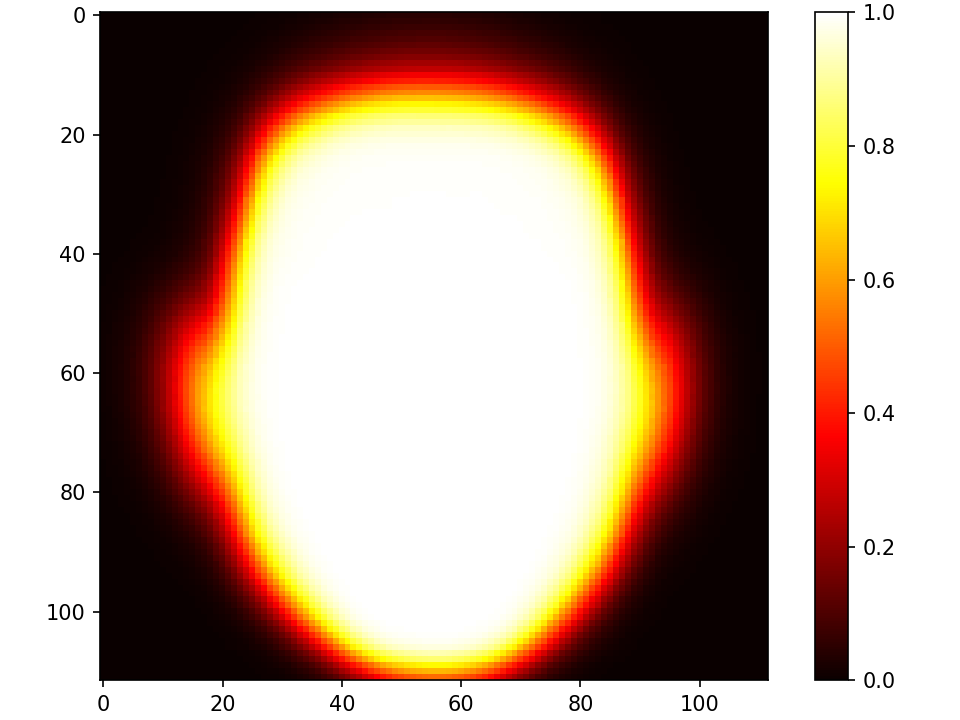

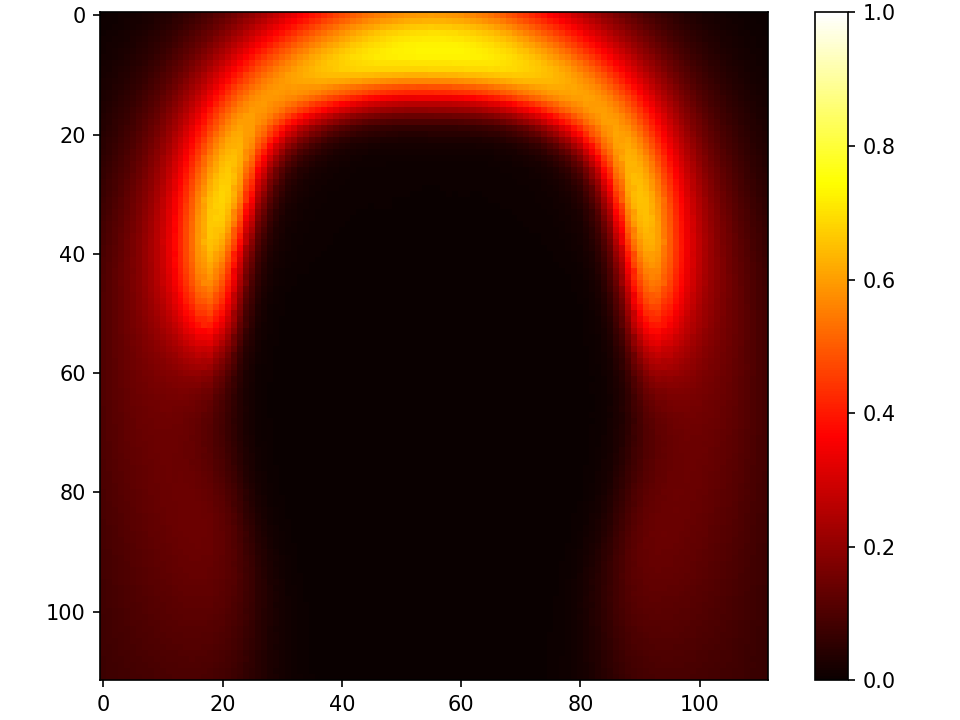
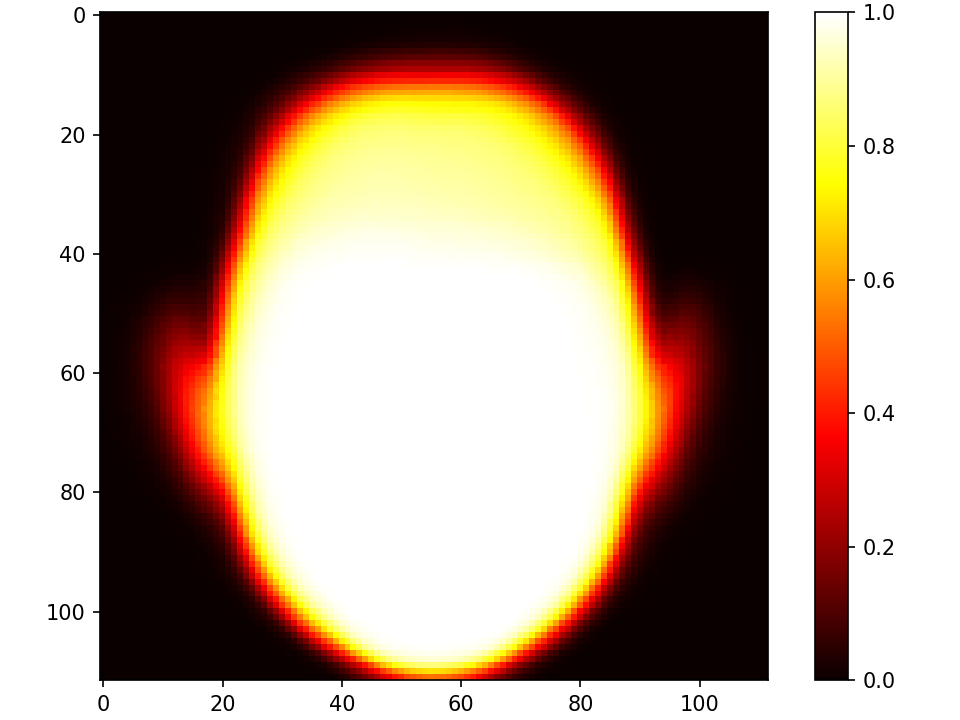
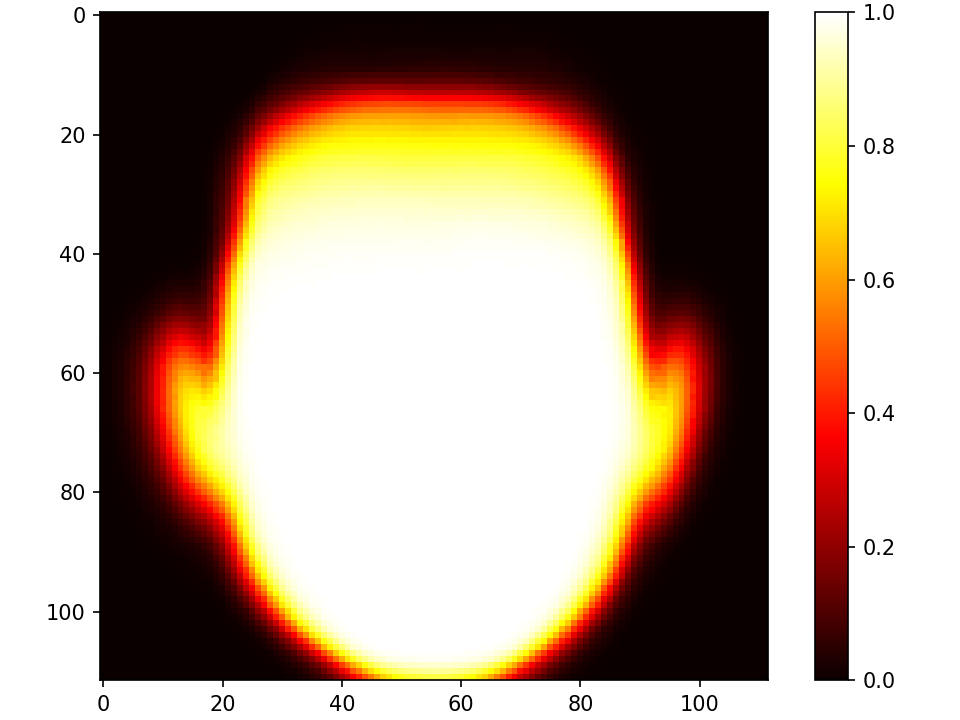

This section considers the face images that are input to the deep CNN, the fraction of the image that represents “pixels on the face”, and how this differs between female and male. The faces in the MORPH and Notre Dame images are detected and aligned using RetinaFace [Deng et al.(2019b)Deng, Guo, Zhou, Yu, Kotsia, and Zafeiriou]. This results in the 112x112 image with face centered in standard location that is the input to the deep CNN. Examples are shown in Figure 5. To obtain a binary mask that indicates which pixels represent face and which do not, we use the modified Bilateral Segmentation Network (“BiSeNet”) to segment the faces ([Yu et al.(2018)Yu, Wang, Peng, Gao, Yu, and Sang], implementation at [bis()]). A pre-trained version of BiSeNet segments face images into regions. For our purposes, “face” is the union of BiSeNet regions 1 to 13, corresponding to skin, eyebrows, eyes, ears, nose and mouth. BiSeNet regions corresponding to neck, clothes, hair and hat are excluded. Examples of the face/non-face masks are shown in Figure 5. These masks are used to compute heatmaps for face being visible at each pixel, for female and male images.
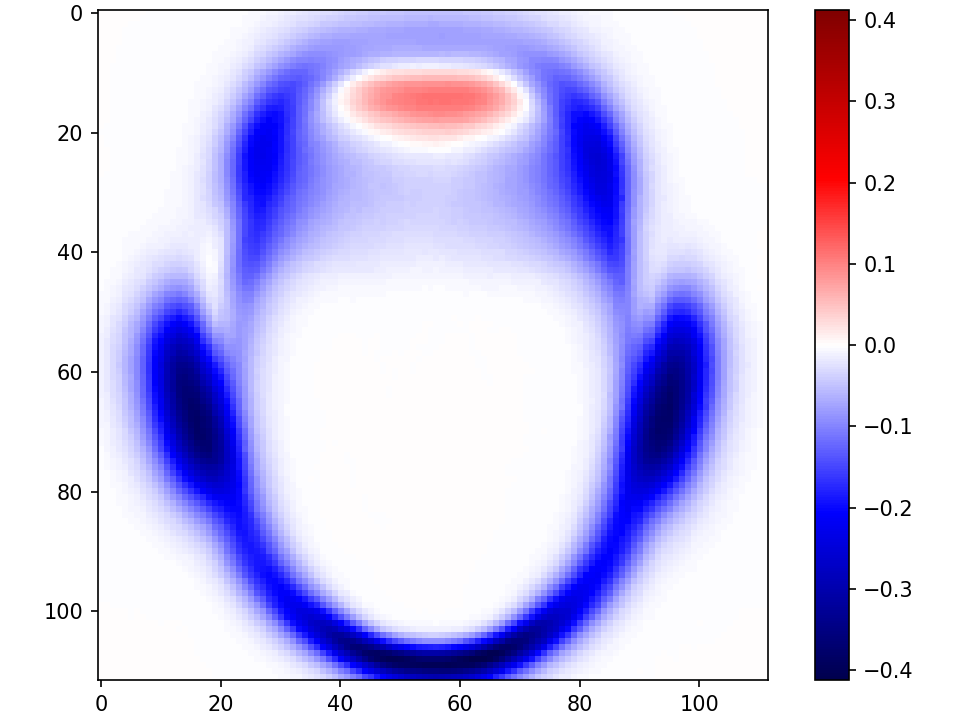
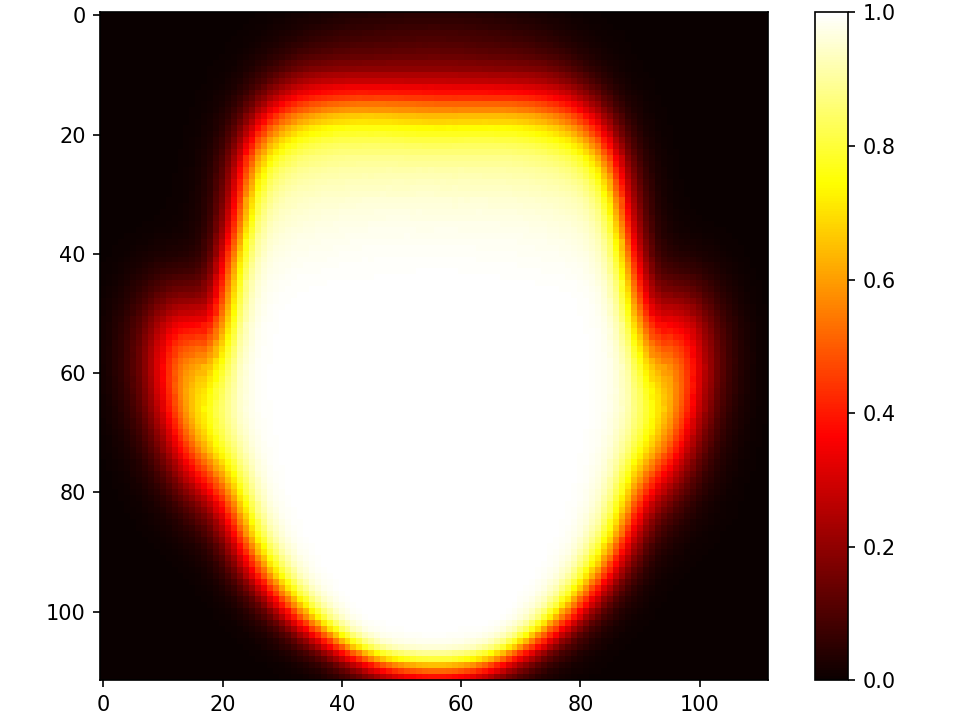
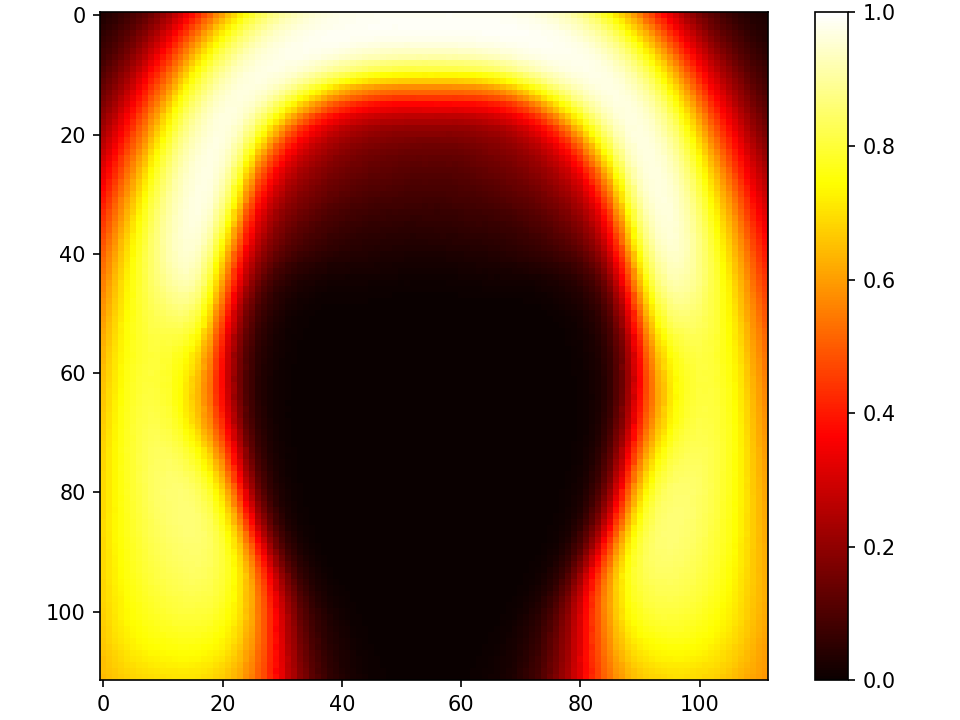
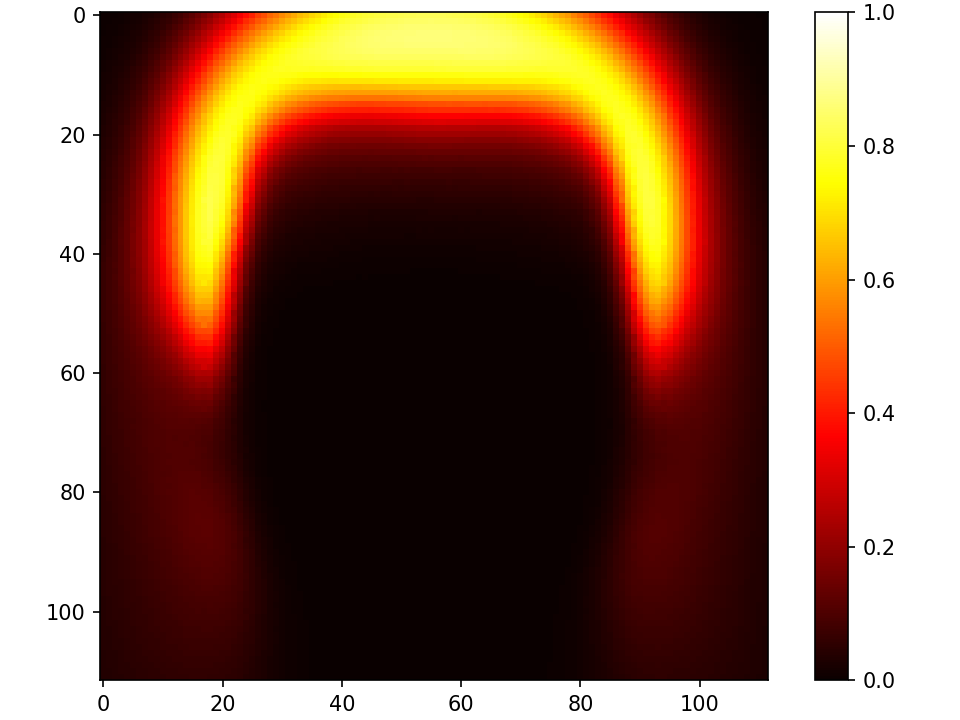
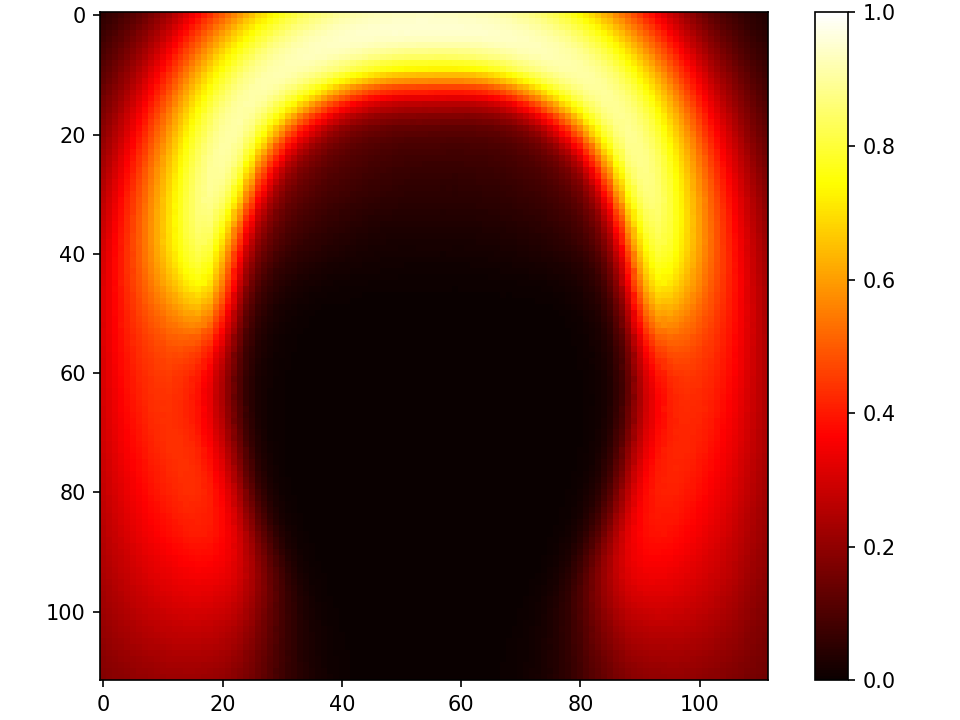
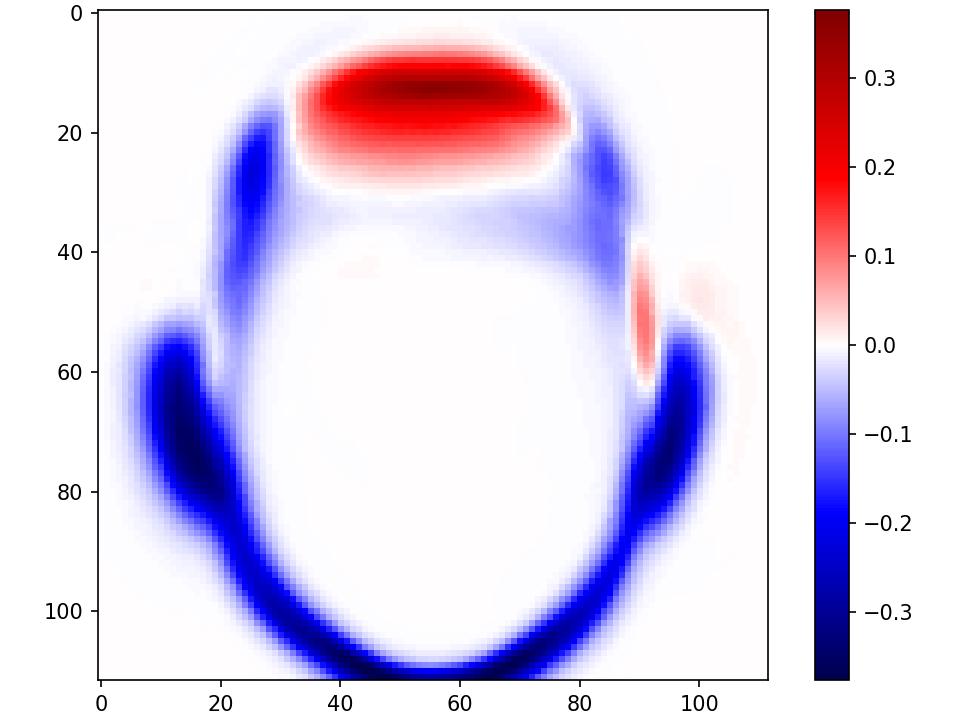
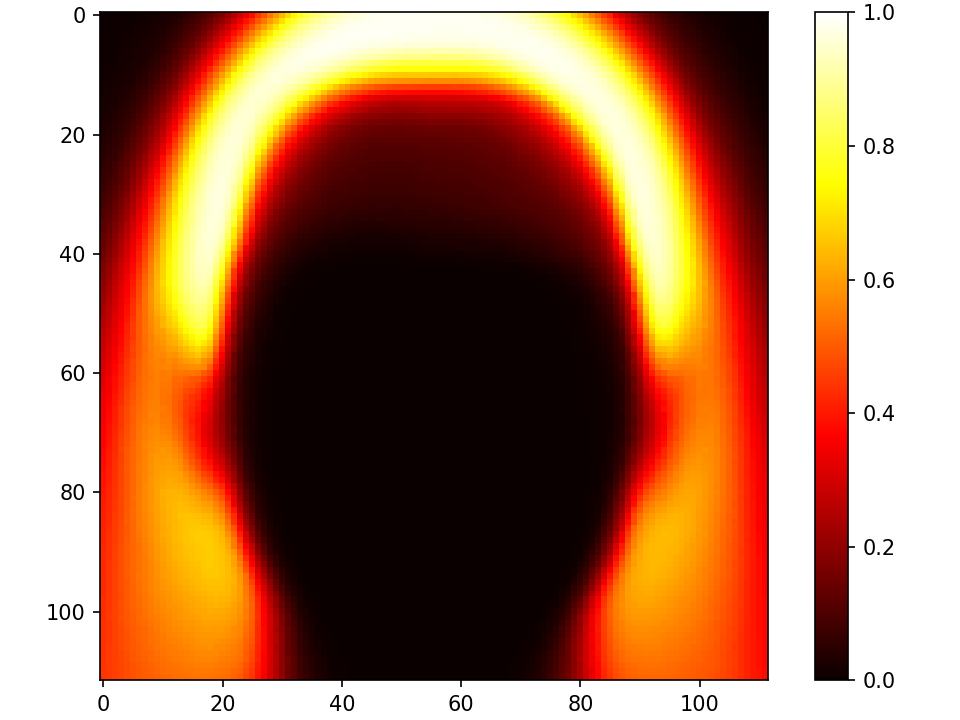
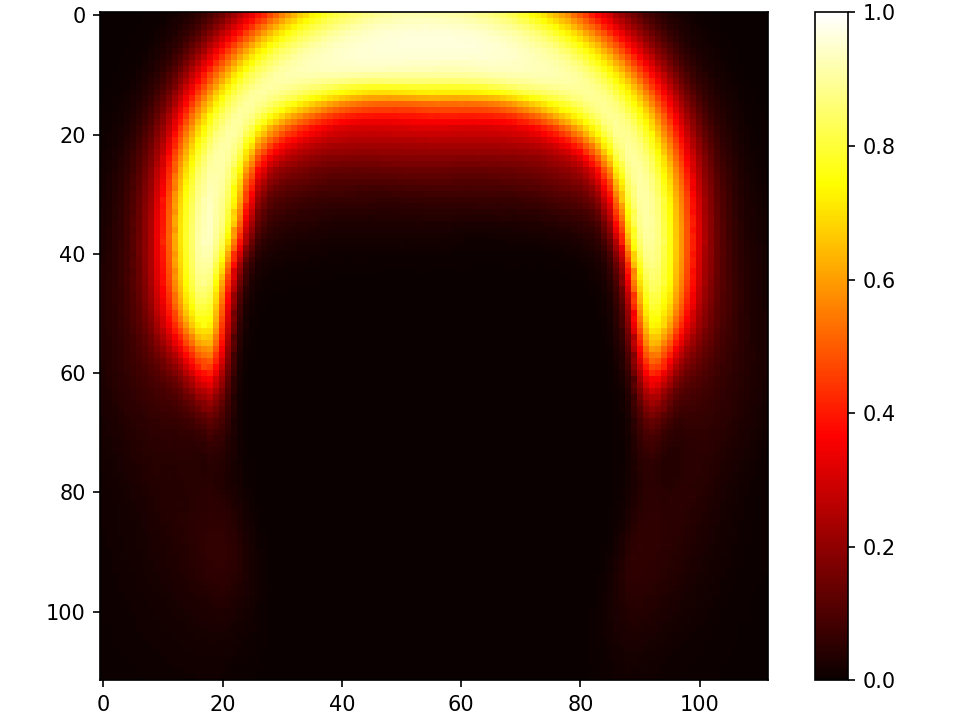
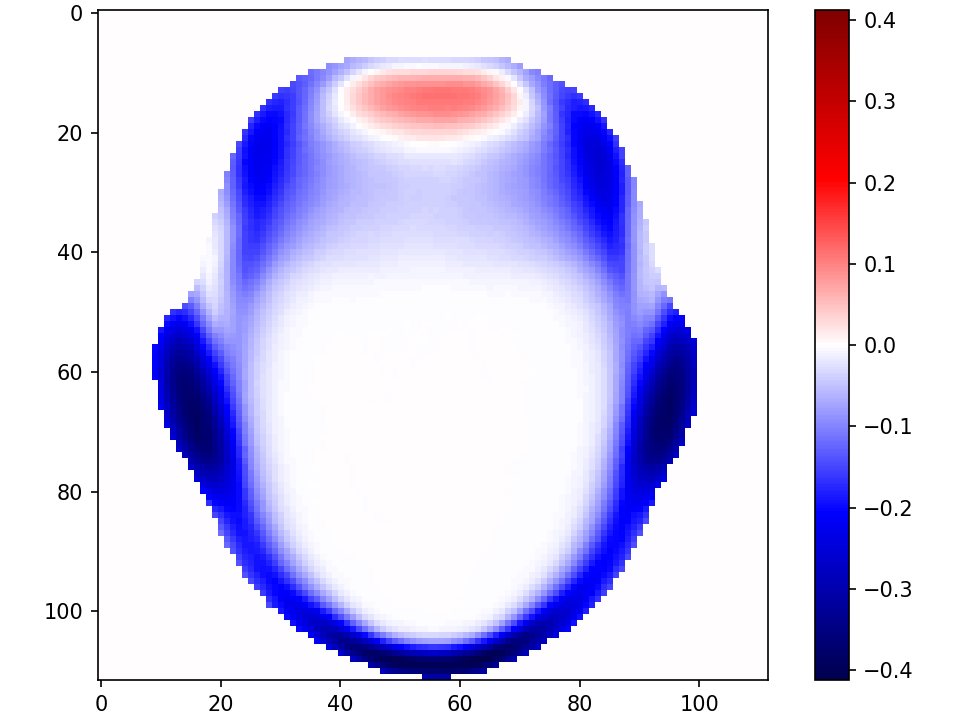
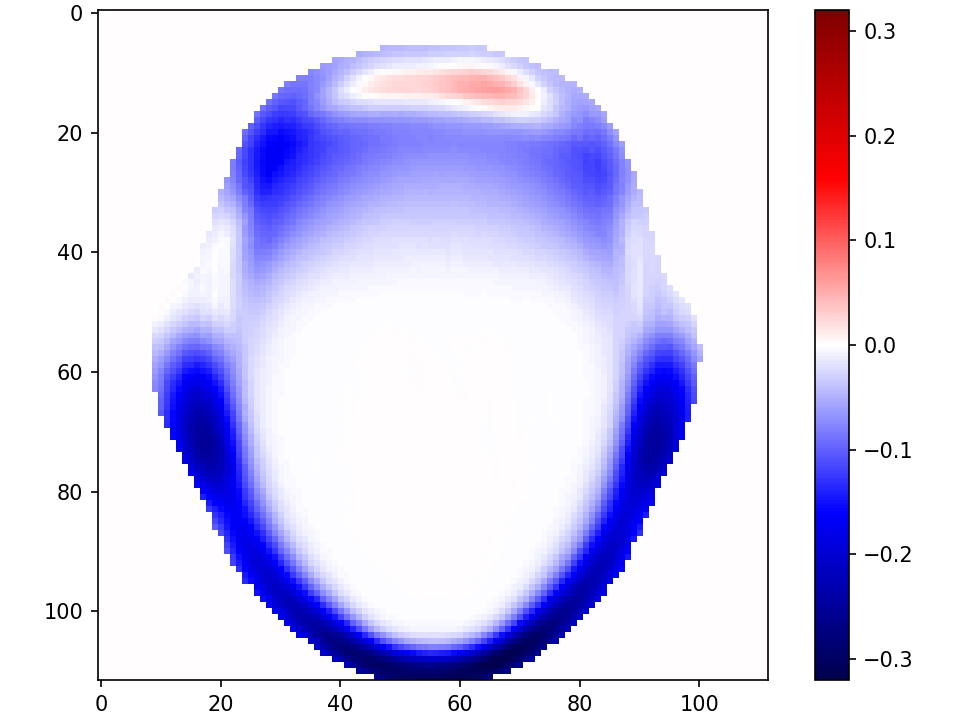
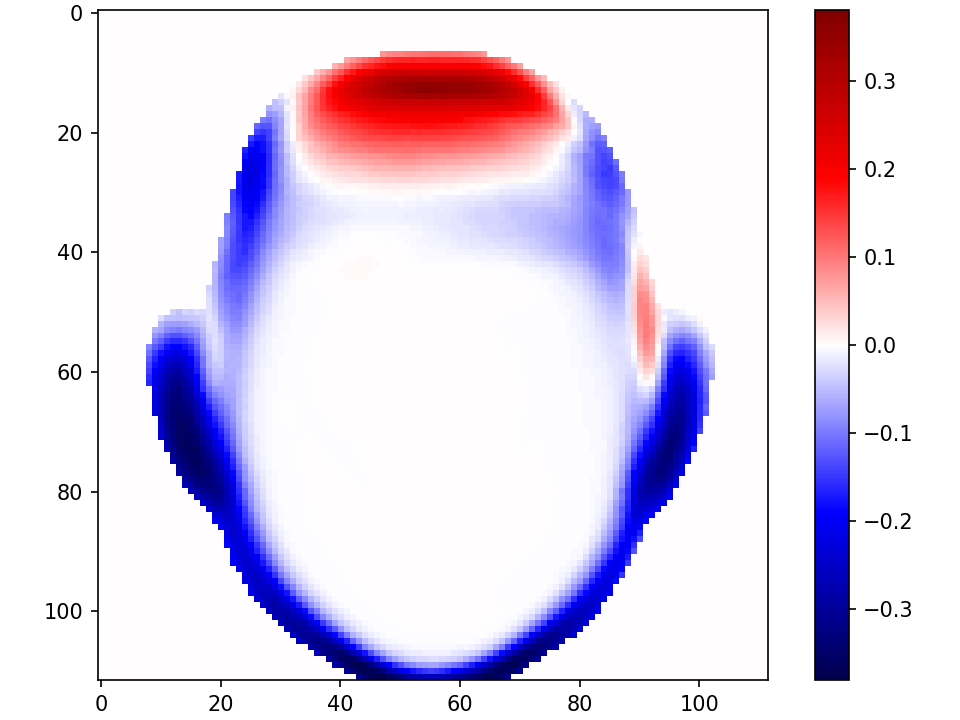
The value of each heatmap pixel is from 0 to 1, reflecting the fraction of the female (male) face images for which that pixel is labelled as face. Figure 9 shows the female and male heatmaps and the difference between them. The chin in the male heatmap extends slightly further toward the bottom. This reflects the “biology” of females and males having, on average, different head size / shape. Another difference is that the ear region and the sides of the face are less prominent in the female heatmap. This reflects gender-associated hairstyles, where female hairstyles more frequently occlude the ears and part of the sides of the face. The difference heatmaps summarize all of this, with blue representing pixels that more frequently labeled face for males than for females, and red representing the opposite. The heatmaps make it clear that, on average, female face images contain fewer “pixels on the face” than male face images, and that gendered hairstyles are a major underlying cause.
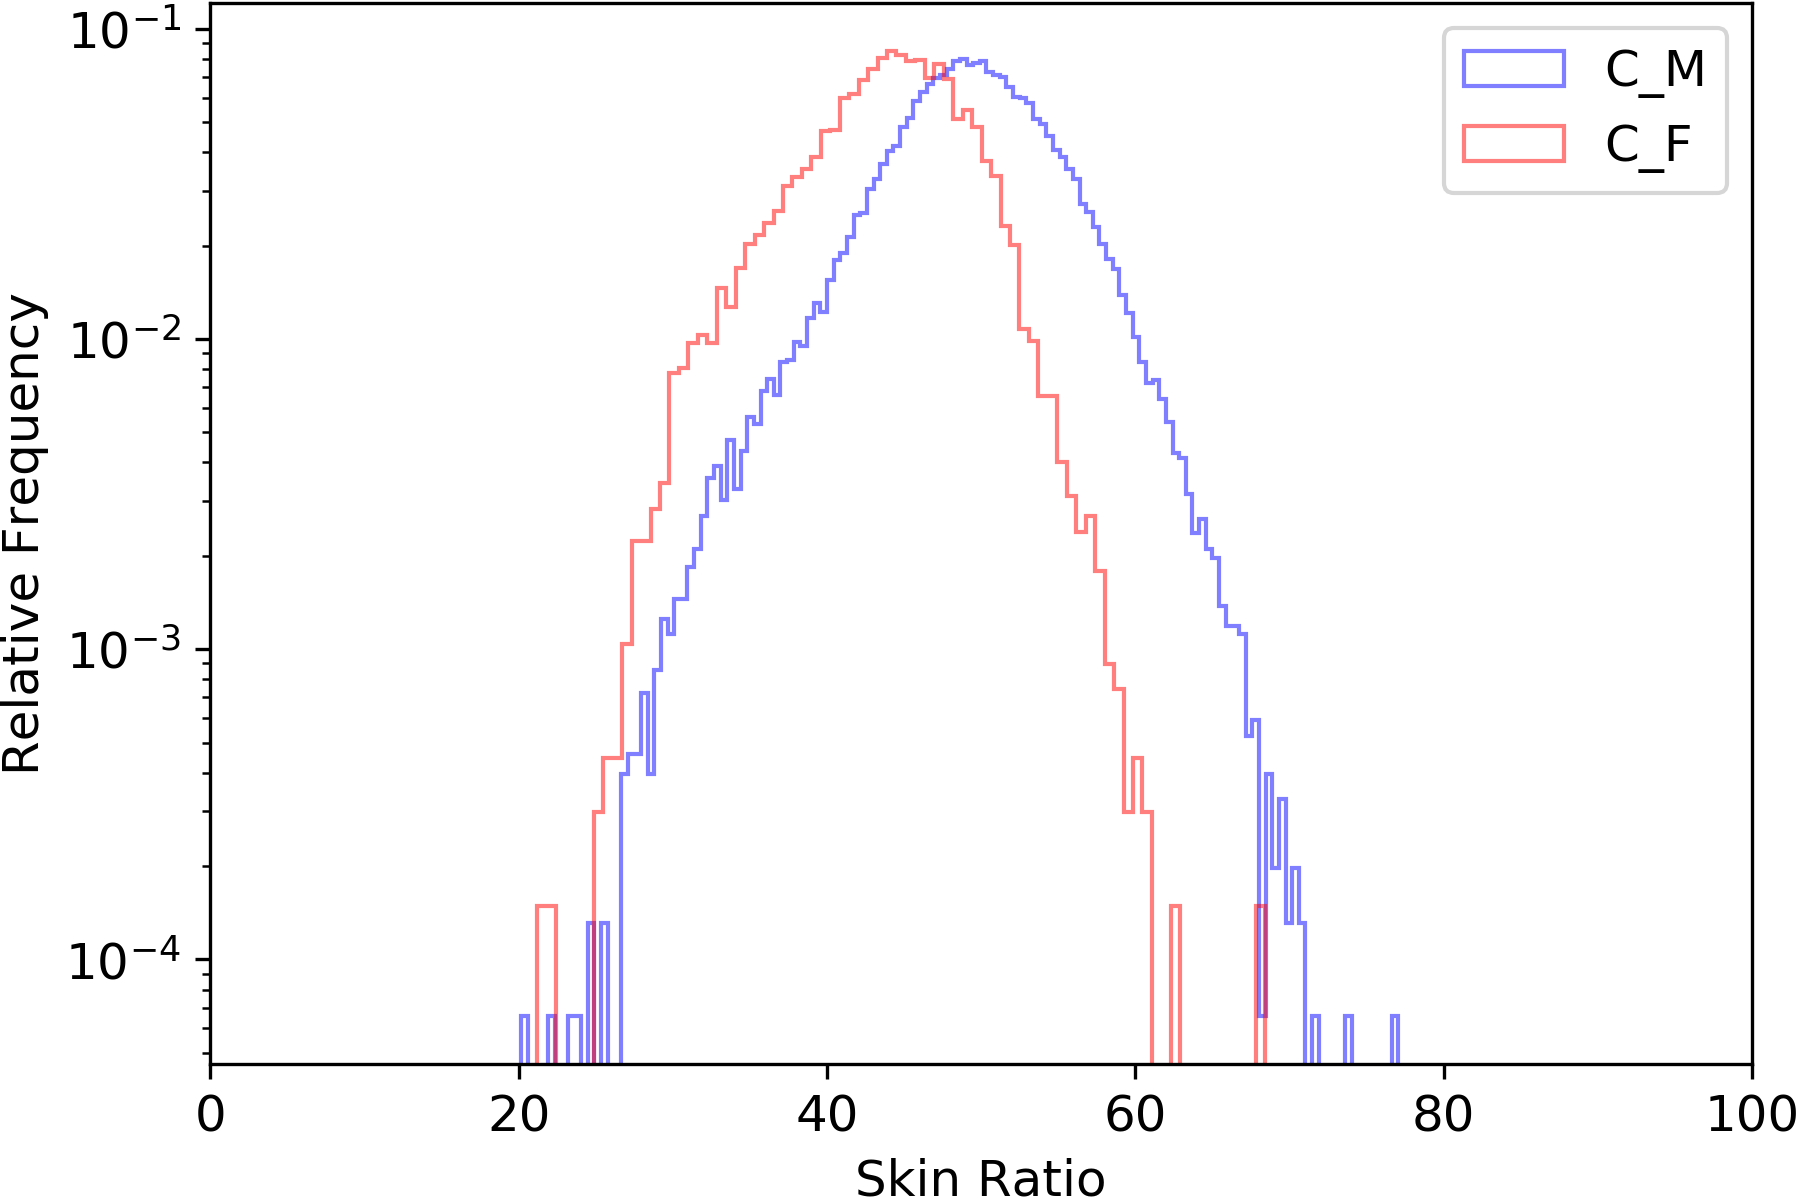
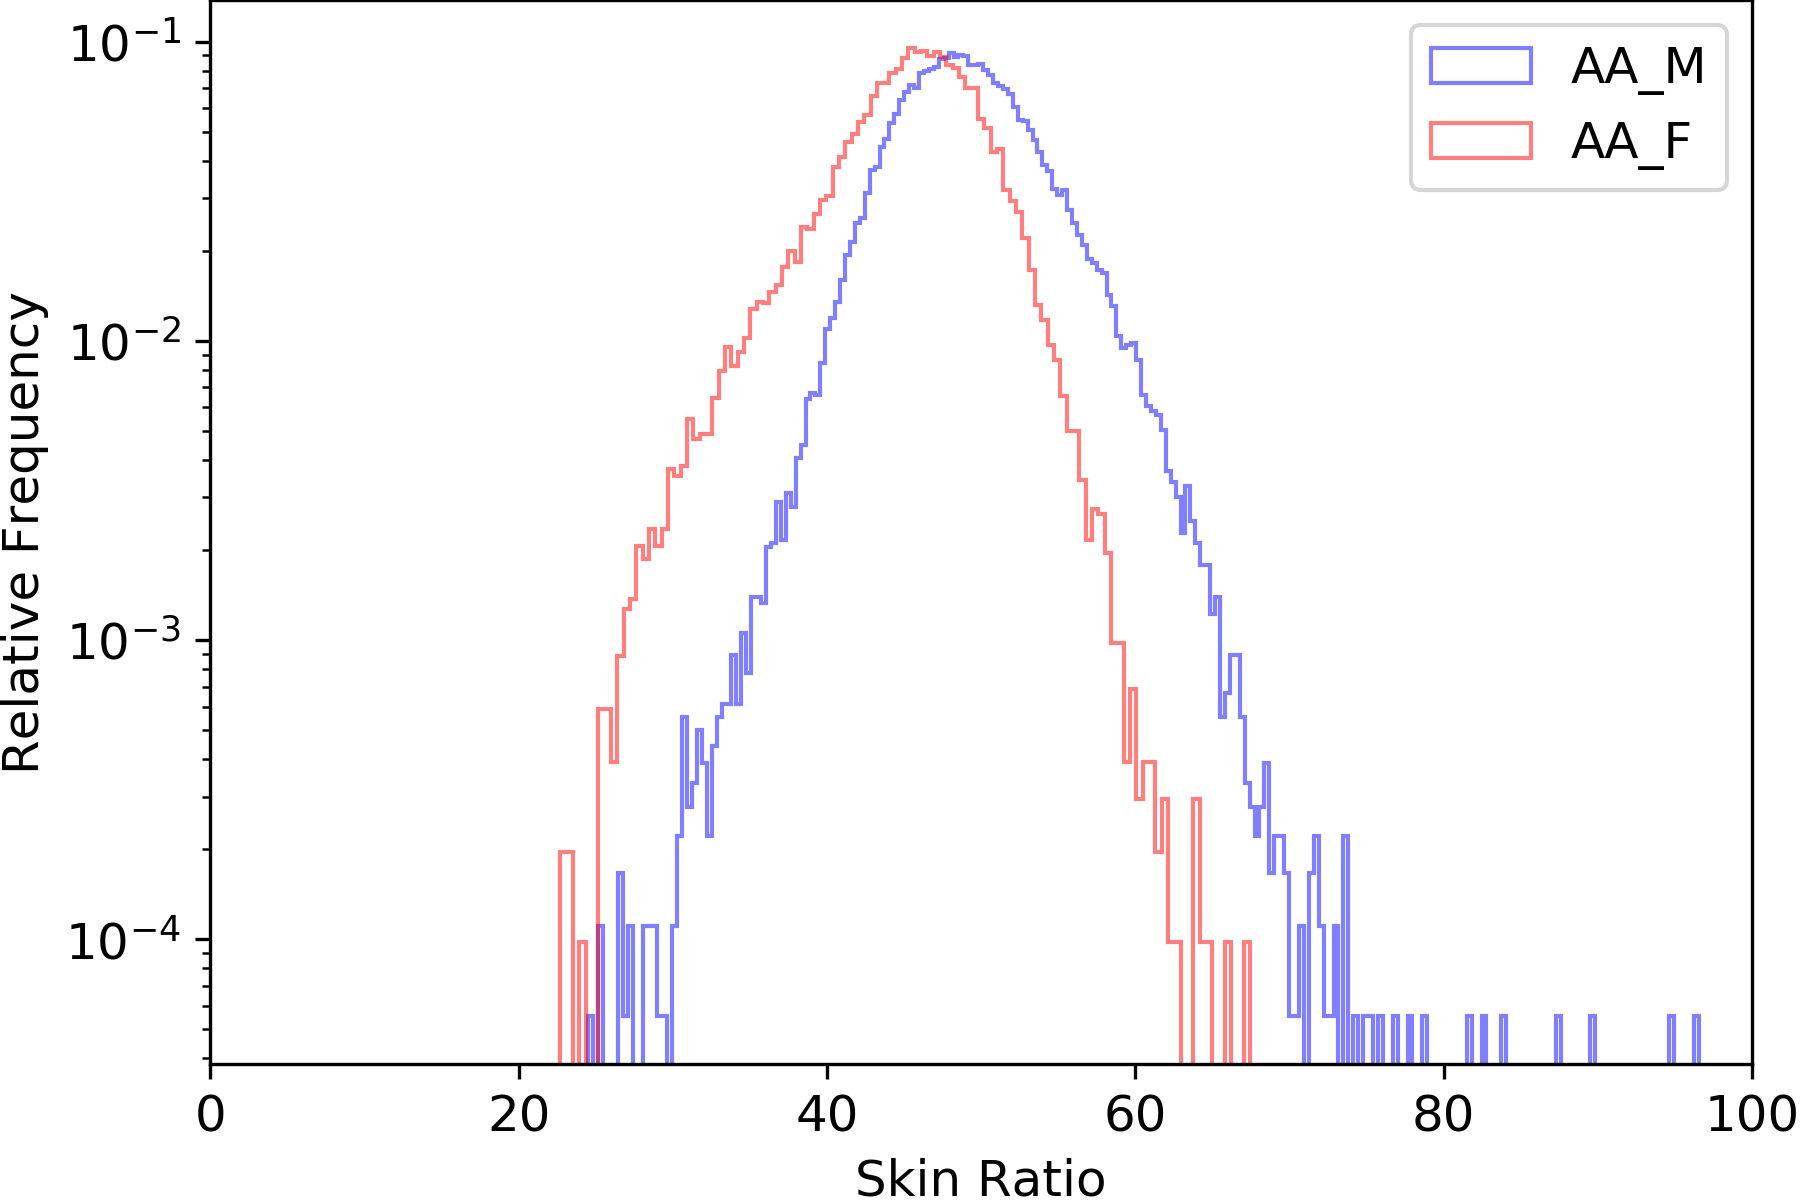
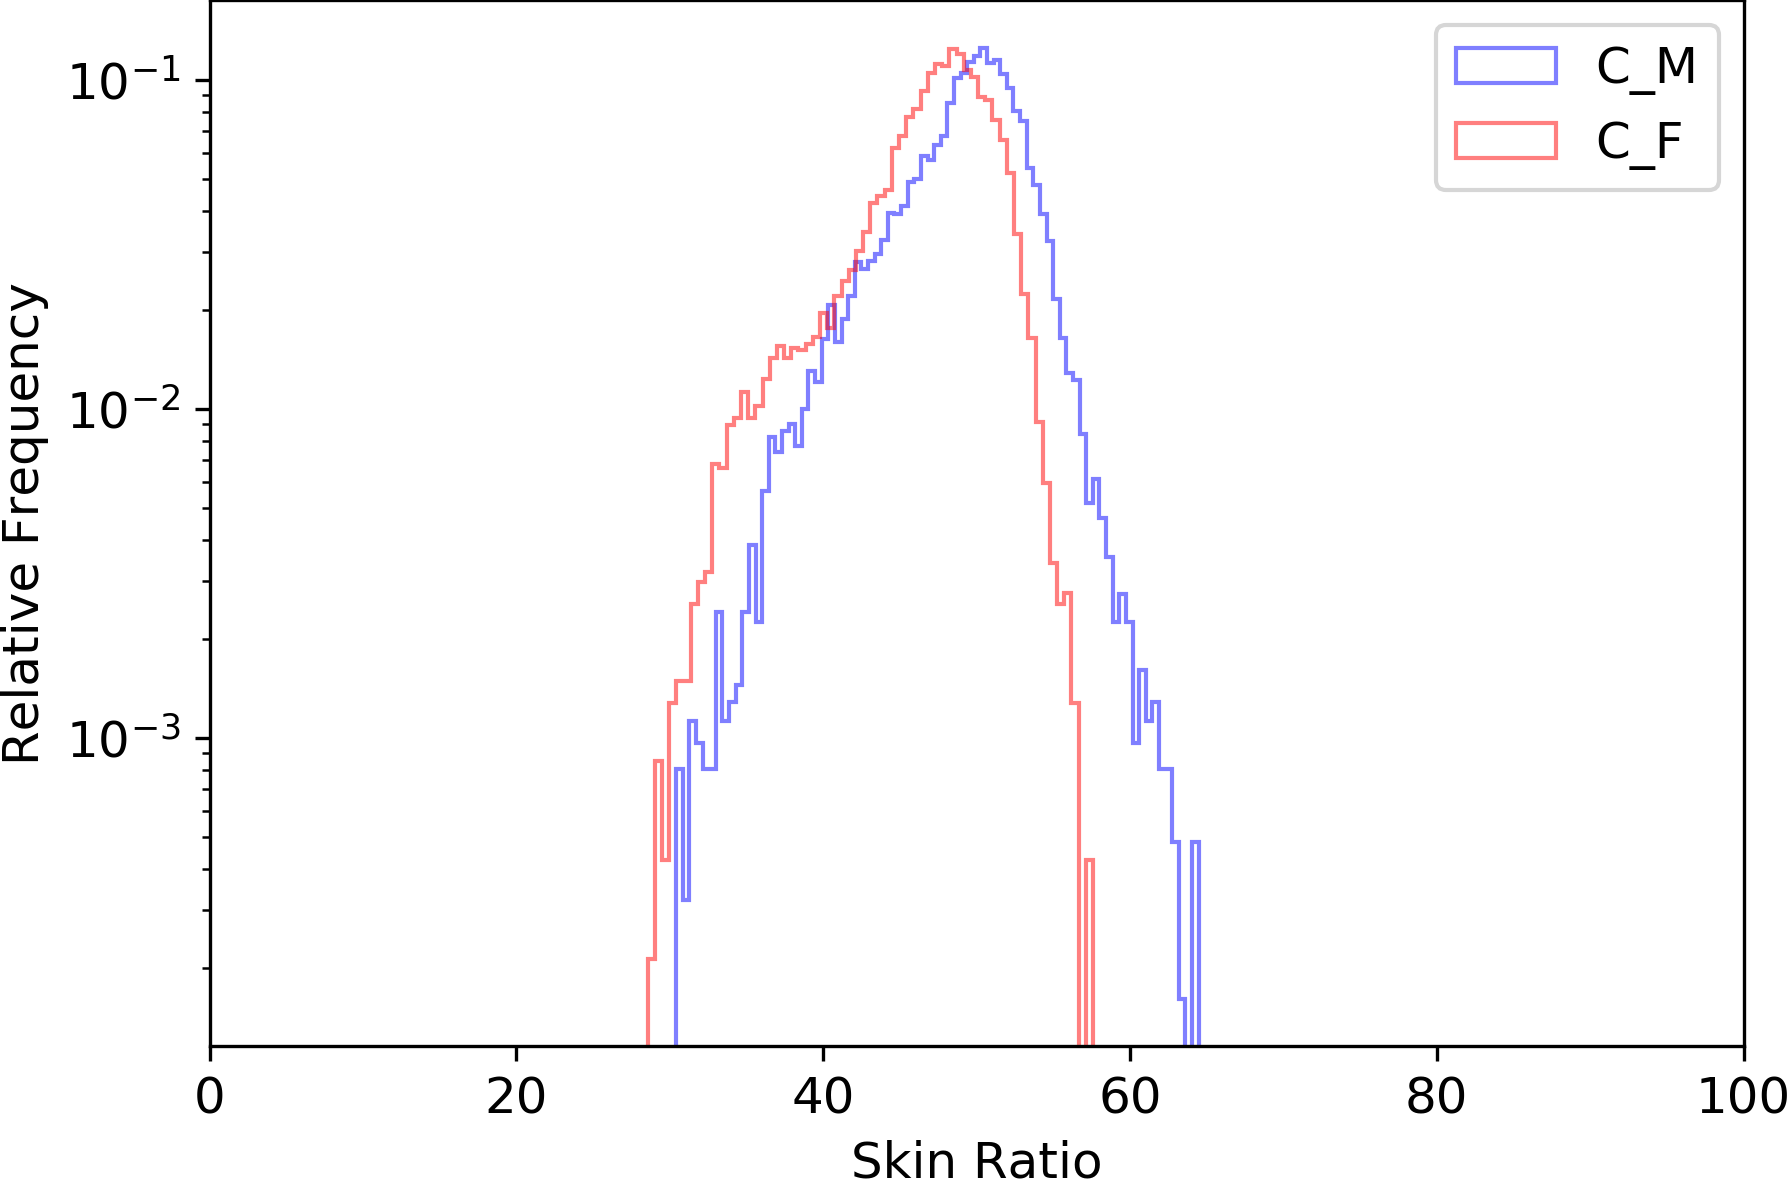
A different view of this information is the distribution of the fraction of the image that represents the face. The “% face” distributions compared in Figure 11 show that the proportion of female face images is larger in the range of approximately 25% to 45%, and the proportion of male face images is larger in the range of about 45% to 70%. Again it is clear that, on average, the female face images contain less information about the face.
Note the correlation of the difference in the % face distributions in Figure 11 and the difference in the genuine distributions in Figure 2. The most pronounced difference in the % face distributions is for MORPH African-American, which also has the most pronounced difference in genuine distributions. The most similar % face distributions are for Notre Dame Caucasian, which also has the most similar genuine distributions.
5 Equal Face Info Flips Genuine Distribution Difference
The previous section shows that the observation that face recognition accuracy is lower for females is based on images in which the female face images contain less information about the face. Given this, it is natural to ask what happens if the dataset is controlled to have equal information in female and male face images.
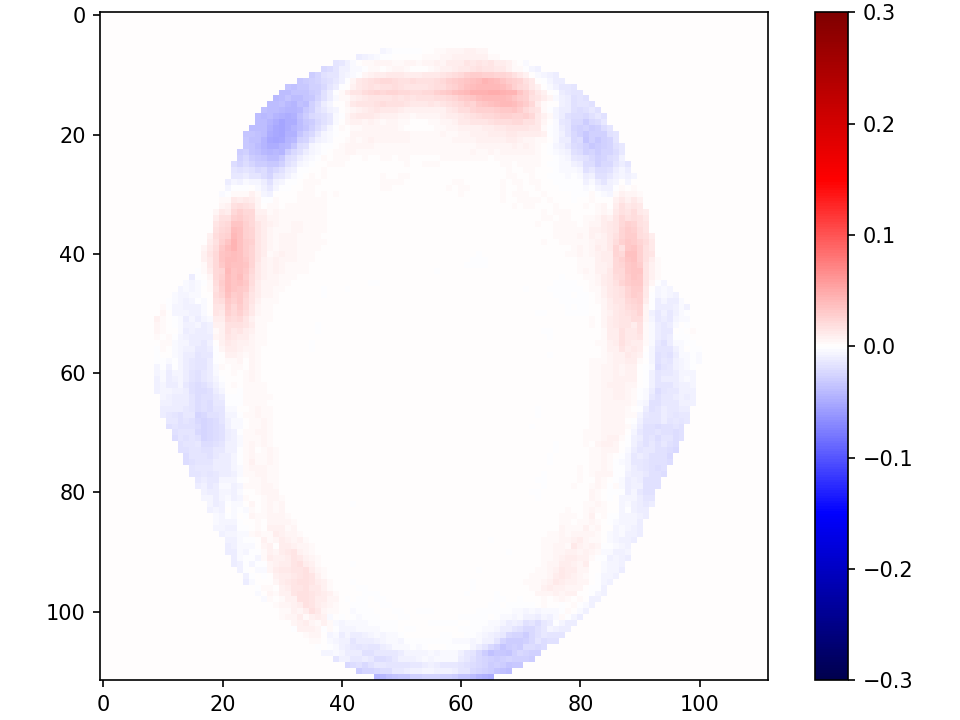
We created a version of the dataset designed to minimize the difference in information between the female and male face images. First, we masked the area outside of the 10% level in the female heatmap, in all female and male images. Because the female face region is generally a subset of the male, this establishes the same maximum set of pixels containing face information in all images, and preserves a large majority of the available face information. However, this still leaves a bias of greater information content for male images because, as the comparison heatmap shows, any given pixel is generally labeled as face for a higher fraction of the male images than the female images. Therefore, as a second step, for each female image, we selected the male image that had the maximum intersection-over-union (IoU) of pixels labeled as face in the two images. The difference heatmap for this nearly info-equalized set of images, and the resulting impostor and genuine distributions, are shown in Figure 13. These results are for a set of 4,730 Caucasian female images (2,095 subjects) and 4,730 Caucasian male images (2,799 subjects), and 12,383 African-American female images (4,656 subjects) and 12,383 African-American male images (5,414 subjects) for MORPH, and 2,442 Caucasian female images (160 subjects) and 2,442 Caucasian male images (238 subjects) for Notre Dame.
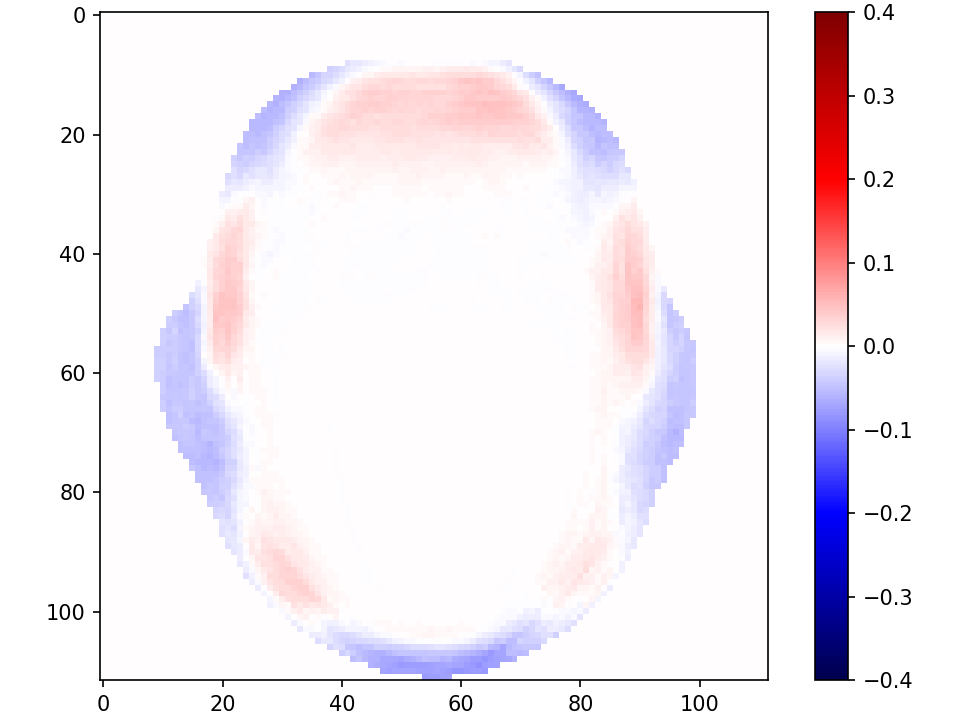
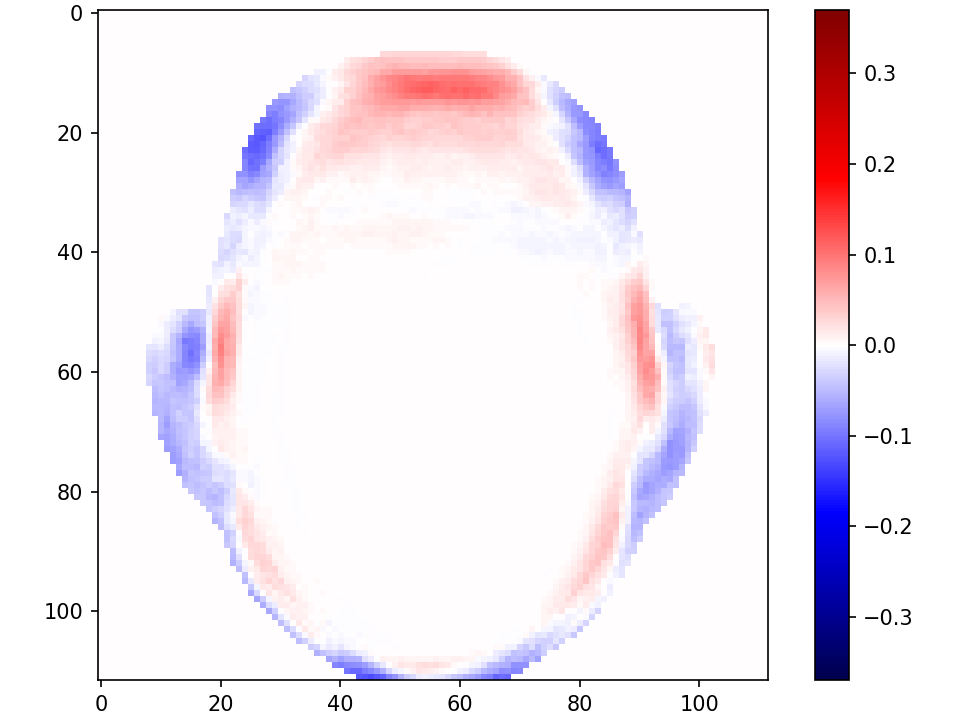
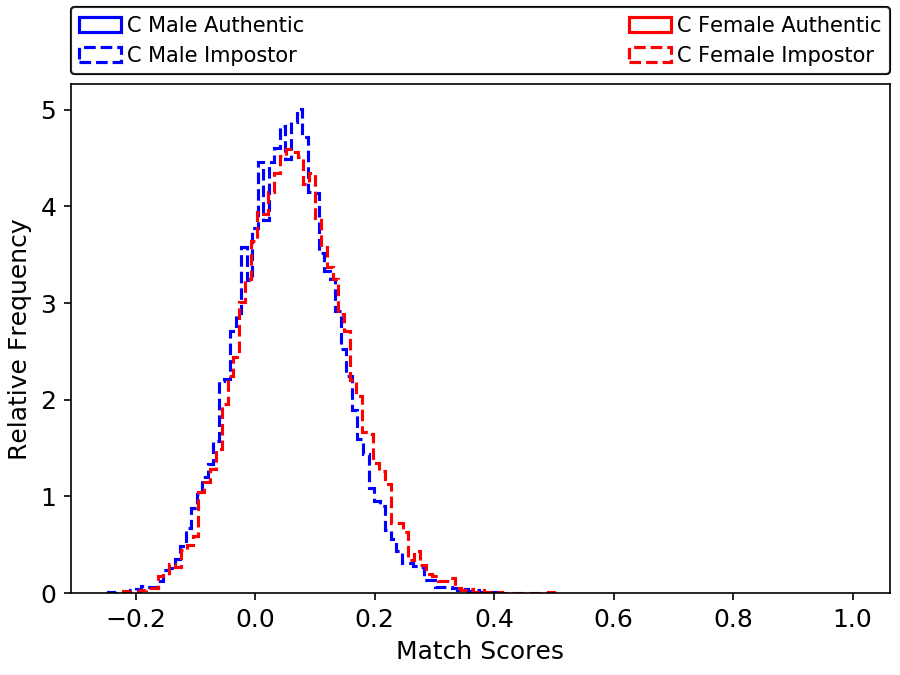
The difference heatmaps show that the difference in information between female and male images is effectively minimized. Remaining differences at any pixel are generally less than 5% and are roughly balanced between female and male. The impostor and genuine distributions for the information-equalized images show a fundamental change from those for the original dataset. While the impostor distribution for females is still worse than for males, the genuine distribution for females is now the same as, or slightly better than, the genuine distribution for males.
Note that this change in the comparison of the female and male genuine distributions occurs solely from creating an approximately information-equalized test set. The matching algorithm is the same, and was trained on the MS1MV2 dataset which has known female under-representation. This suggests that the result that females have a worse genuine distribution was, in effect, based on bias in the test data rather than bias in the training data.
6 Impostor Difference Reflects Between-Subject Variation
The information-equalized dataset shows that females have a genuine distribution as good or better than males, but the impostor distribution for females is still worse. To explore how and why this can be the case, we employ a concept that was once ubiquitous in face recognition, but that may be less known to those entering the field since the wave of deep CNNs - “eigenfaces” based on principal component analysis (PCA) [Turk and Pentland(1991), Turk(2001)]. The essence of eigenfaces is to learn, from a set of training images, a face space that accounts for the most variation possible in a linear combination of orthogonal dimensions. While eigenfaces have been used for gender classification (e.g., [Valentin et al.(1997)Valentin, Abdi, Edelman, and O’Toole]), we are not aware of any previous comparison of the dimensionality of face spaces computed separately for females and males.
We computed the face space separately for females and for males, using one image with the highest fraction of pixels labeled as face for each person, with skin pixels outside of a 10% mask zeroed. For simplicity of comparison, we randomly selected the same number of males as there are females. This resulted in 2,798 images each for MORPH Caucasian females and males, 5,929 images each for MORPH African-American females and males, and 169 images each for Notre Dame Caucasian.
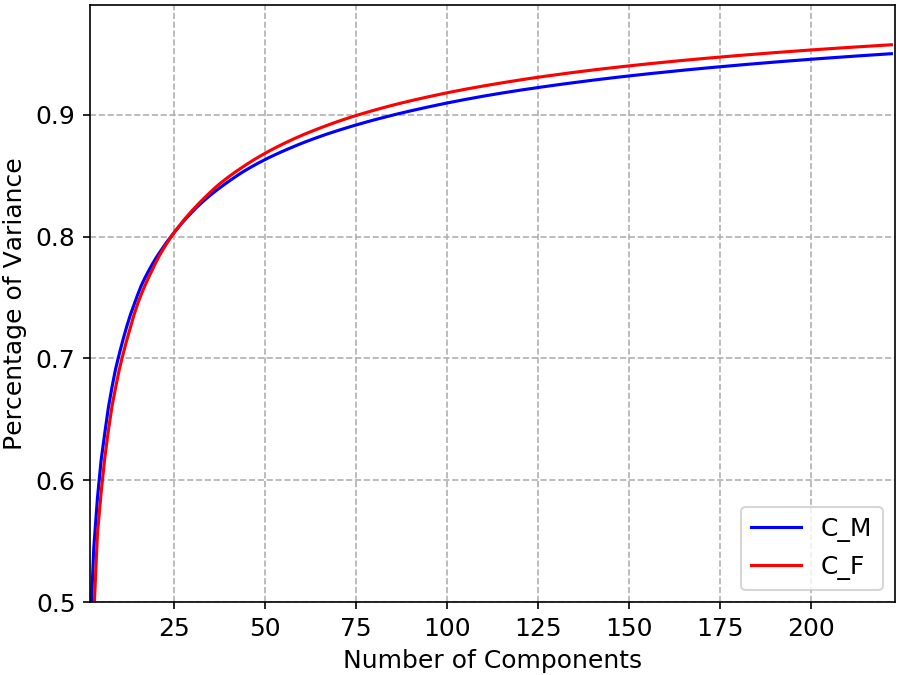
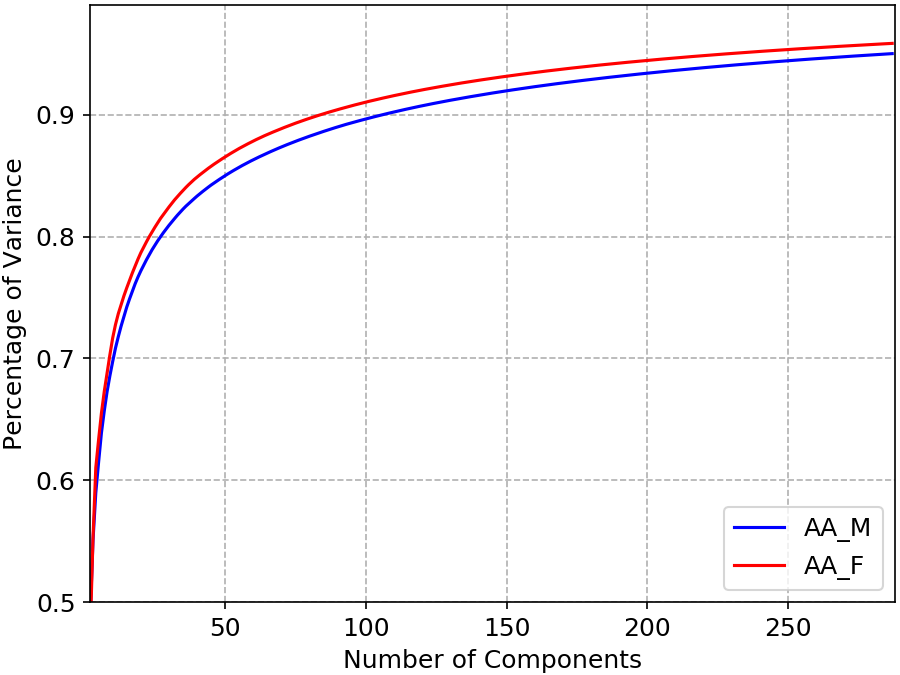
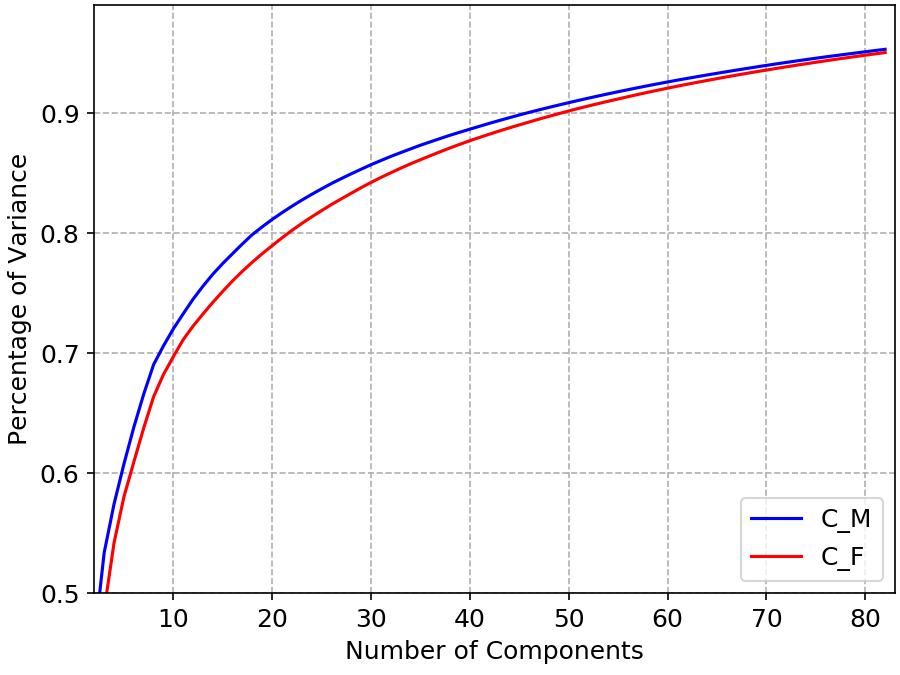
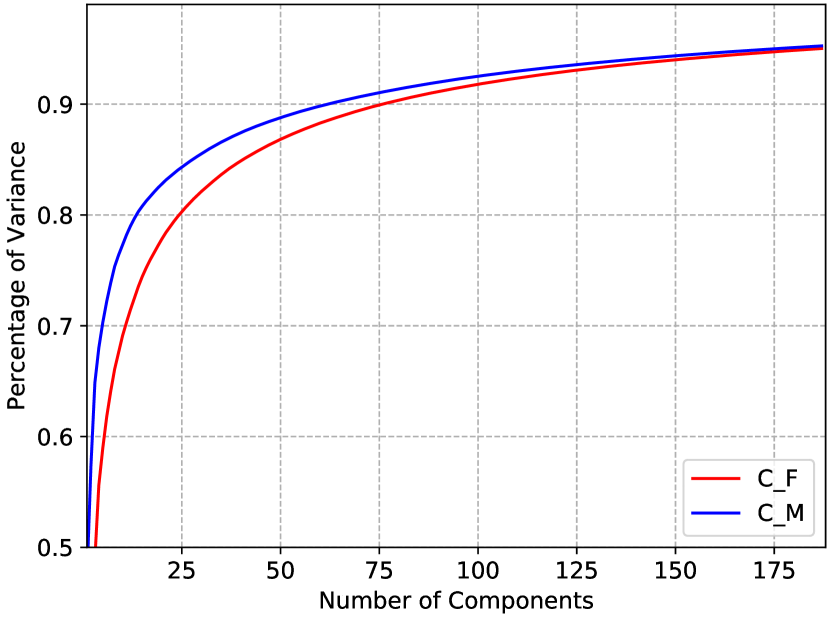
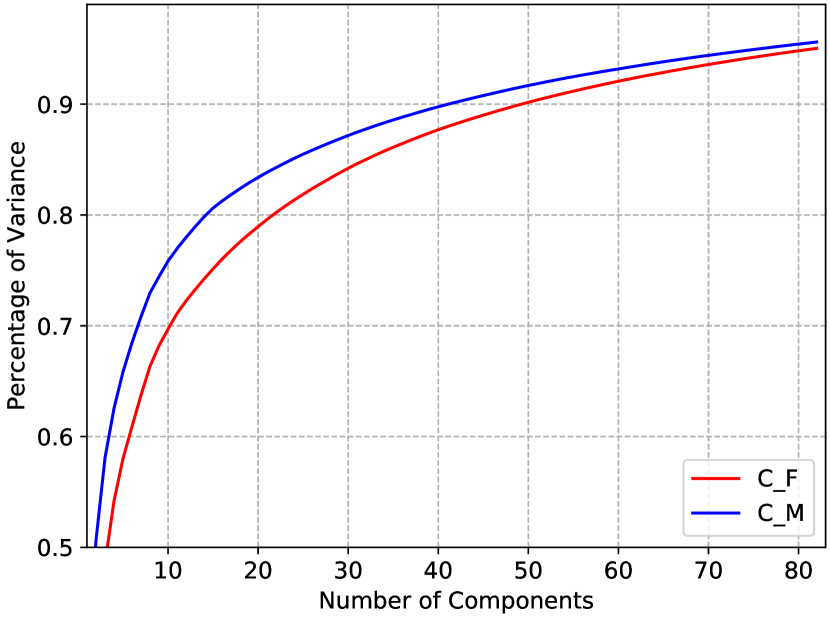
Figure 15 compares the face space for females and males in terms of the percent of variation accounted for by a given number of eigenfaces. For MORPH Caucasian, females need 187 eigenfaces to capture 95% of variation, whereas males need 222 eigenfaces. Thus, 95% of the variation in face images of different persons is captured in a face space of about 10% lower dimension for females than for males. For MORPH African-American, females need 229 eigenfaces to capture 95% of the variation, whereas African-American males need 287 eigenfaces. In this case, 95% of the variation in face images between different persons is captured in a face space of about 20% lower dimension for females. For Notre Dame Caucasian, the result is different, as females require more eigenfaces than males, 82 to 80. The reason for this difference is not immediately obvious, but the Notre Dame dataset is different in several respects. One, there are only 169 subjects / images contributing to each face space. Two, the subjects are overwhelming young, with over 90% of both female and male subjects in the age range 18-29, whereas the large majority of the subjects in the MORPH African-American and MORPH Caucasian are 30 or older. Three, and perhaps related to the small number of subjects almost all of whom are young, a much smaller number of eigenfaces is needed to reach 95% of variation.
The curves in Figure 15 are for the central masked face regions. The results are similar if the original 112x112 images are used. For example, for MORPH Caucasian, females need 303 eigenfaces and males need 331 to capture 95% of variance. Overall, the implication of this face space analysis is that, for a given dimension of face space, images of two different females are more similar than images of two different males.
To determine if the size of the Notre Dame dataset is the problem, we create male and female subsets of MORPH Caucasian images, with same number of subjects and same age distribution as the Notre Dame dataset. Figure 16 shows that when this subset of MORPH data is used, the result is similar to the Notre Dame dataset.

7 Face Spaces and Impostor Distributions
The previous section shows that, for the same number of subjects and images, the male image set requires a larger dimension of face space than the female image set to account for the same percent variation. For the same dimensionality of face space, a greater percent of the variation in female face appearance is accounted for. In face space, faces of two different females are more similar-appearing on average than faces of two different males. We conjecture that this is an explanation for why the male impostor distribution is centered at a lower similarity value than the female impostor distribution.
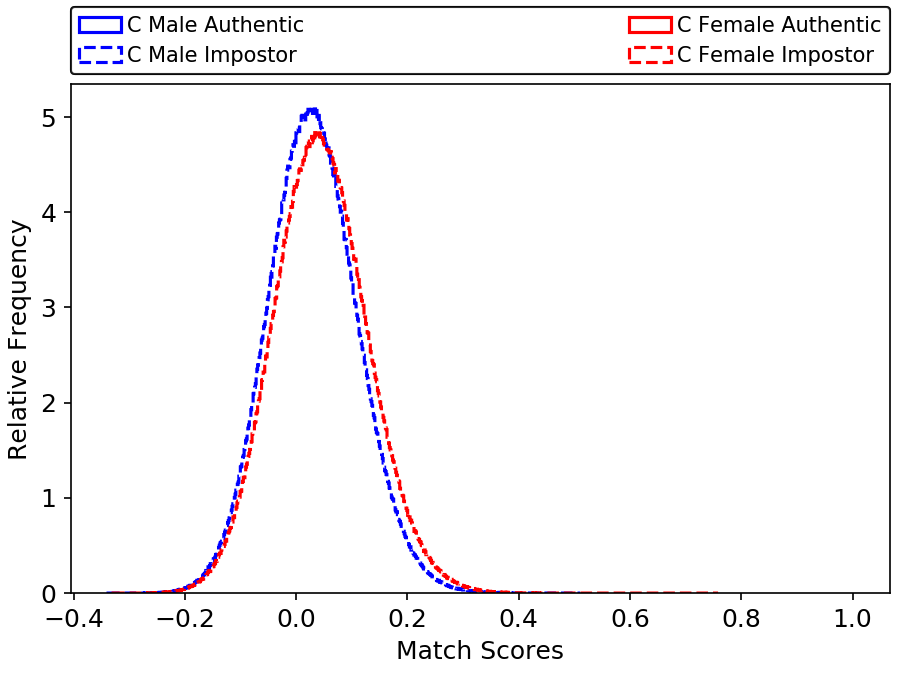
To investigate this further, we select a subset of male face images that generates a face space that better matches that of the female image set. We select the same number of males as there are females, and use one image per person, and we select the male images that have the lowest reconstruction error at 80% variance. This selection flipped the relative position of the female and male PCA curves as seen in Figure 19. We then compare the impostor distribution of the males random selection and the 80% variance selection. Figure 19 shows that the impostor distribution for males and females is closer when the PCA curve is flipped, meaning that when males have less variation in between-subject, their impostor matches are similar to women.
We were able to reproduce the PCA inverting experiment with the MORPH Caucasian and Notre Dame dataset, but not on MORPH African-American. The original difference in the PCA between African-American males and females is larger than the other two datasets, and when we remove male images with highest error rate, females still require less components to achieve the same variation. This issue exists even if we reduce womens’ data to half, so that we can have more male data to remove, achieving a much closer PCA curve, but that does not flip and does not come as close as the MORPH Caucasian and Notre Dame dataset do. In our experiments, to achieve a more similar impostor distribution across gender, the males’ PCA curve must be higher (require less components) than the females, if they are near-equal, male impostor distribution is still better.
8 Conclusions and Discussion
The results in Figure 2 are representative of the consensus of previous research that face recognition accuracy is lower for females. The most extensive study in this area, in terms of number of different matchers and datasets considered, is the recent NIST report on demographic effects [Patrick Grother and Hanaoka(2003)]. This report found that females consistently have higher FMR (worse impostor distribution), and generally also have higher FNMR (worse genuine distribution) but that there are exceptions to the higher FNMR generalization.
However, the studies covered in Related Work are done with test sets that are largely uncontrolled with respect to differences between female and male images. One recommendation for future studies on demographic differences in face recognition accuracy is to include information such as the % face distributions or the face difference heatmap for the test images. This would encourage an awareness of how test data may come with a built-in “bias” toward observing certain accuracy differences.
Female / male differences in size and shape of the face are well known and have long been studied in diverse fields such as ergonomics [Zhuang et al.(2010)Zhuang, Landsittel, Benson, Roberge, and Shaffer], anthropology [Holton et al.(2014)Holton, Yokley, Froehle, and Southard], and surgery [Farkas et al.(2005)Farkas, Katic, and Forrest]. Female and male faces also change differently with age [Albert et al.(2007)Albert, Ricanek, and Patterson]. As a matter of biology, the range of size and shape of the female face is smaller than the range of size and shape of the male face. In the face recognition context, this becomes evident in an eigenface comparison of the female and male “face spaces”.
Thus, an initial condition for face matchers is the fact that, on average, two different female faces actually do appear more similar than two different male faces. The impostor distribution for females is naturally centered at higher similarity values that the impostor distribution for males. Any face matching algorithm that computes a similarity score without, in effect, classifying the face as female or male and allowing that to influence the score, seems likely to have different female / male impostor distributions.
The range of face size and shape being smaller for females can also cause the distribution of genuine scores for females to be centered at higher similarity values than for males. This is the result seen for the information-equalized dataset in Figure 13. The fact that the opposite is commonly found in female / male comparisons of accuracy, with the female genuine distribution worse than the male, is due to effects of gendered hairstyles combined with biological differences in face size and shape. Most of the difference in the % face distributions in Figure 11 is due to the effects of gendered hairstyles.
Is face recognition technology sexist? The worse genuine distribution seems due primarily to the gender differences in hairstyles. The worse impostor distribution seems due primarily to the biological differences in the range of female and male face appearance. So, the “sexist” result of lower accuracy for females seems largely due to a combination of biological differences and gendered hairstyle conventions, and not to face recognition methods and training datasets.
Future work could include analyzing the female/male difference for an Asian image cohort, or other cohorts.
Acknowledgment
The authors would like to thank Ross Beveridge, Alice O’Toole and Volker Blanz for helpful discussions on this project.
References
- [MOR()] Morph dataset. https://www.faceaginggroup.com/?page_id=1414.
- [bis()] https://github.com/zllrunning/face-parsing.PyTorch, last accessed on December 2019.
- [Albert et al.(2007)Albert, Ricanek, and Patterson] A. Midori Albert, Karl Ricanek, and Eric Patterson. A review of the literature on the aging adult skull and face: Implications for forensic science research and applications. Forensic Science International, October 2007.
- [Albiero et al.(2020a)Albiero, Bowyer, Vangara, and King] Vítor Albiero, Kevin W. Bowyer, Kushal Vangara, and Michael C. King. Does face recognition accuracy get better with age? deep face matchers say no. In Winter Conference on Applications of Computer Vision (WACV), 2020a.
- [Albiero et al.(2020b)Albiero, Krishnapriya, Vangara, Zhang, King, and Bowyer] Vítor Albiero, K.S. Krishnapriya, Kushal Vangara, Kai Zhang, Michael C. King, and Kevin W. Bowyer. Analysis of gender inequality in face recognition accuracy. In Winter Conference on Applications of Computer Vision Workshops (WACVW), 2020b.
- [Albiero et al.(2020c)Albiero, Zhang, and Bowyer] Vítor Albiero, Kai Zhang, and Kevin W. Bowyer. How does gender balance in training data affect face recognition accuracy? In International Joint Conference on Biometrics (IJCB), 2020c.
- [Beveridge et al.(2009)Beveridge, Givens, Phillips, and Draper] J. Ross Beveridge, Geof H. Givens, P. Jonathon Phillips, and Bruce A. Draper. Factors that influence algorithm performance in the Face Recognition Grand Challenge. Computer Vision and Image Understanding, 113(6):750–762, 2009.
- [Buolamwini and Gebru(2018)] Joy Buolamwini and Timnit Gebru. Gender shades: Intersectional accuracy disparities in commercial gender classification. In Conference on fairness, accountability and transparency, 2018.
- [Cao et al.(2018)Cao, Shen, Xie, Parkhi, and Zisserman] Q. Cao, L. Shen, W. Xie, O. M. Parkhi, and A. Zisserman. VGGFace2: A dataset for recognising faces across pose and age. In Face and Gesture Recognition, 2018.
- [Cook et al.(2019)Cook, Howard, Sirotin, and Tipton] Cynthia M Cook, John J Howard, Yevgeniy B Sirotin, and Jerry L Tipton. Fixed and Varying Effects of Demographic Factors on the Performance of Eleven Commercial Facial Recognition Systems. IEEE Transactions on Biometrics, Behavior, and Identity Science, 40(1), 2019.
- [Dantcheva et al.(2012)Dantcheva, Chen, and Ross] A. Dantcheva, C. Chen, and A. Ross. Can facial cosmetics affect the matching accuracy of face recognition systems? In 2012 IEEE Fifth International Conference on Biometrics: Theory, Applications and Systems (BTAS), 2012.
- [Deng et al.(2019a)Deng, Guo, Xue, and Zafeiriou] Jiankang Deng, Jia Guo, Niannan Xue, and Stefanos Zafeiriou. Arcface: Additive angular margin loss for deep face recognition. In Proceedings of the IEEE Conference on Computer Vision and Pattern Recognition, 2019a.
- [Deng et al.(2019b)Deng, Guo, Zhou, Yu, Kotsia, and Zafeiriou] Jiankang Deng, Jia Guo, Yuxiang Zhou, Jinke Yu, Irene Kotsia, and Stefanos Zafeiriou. Retinaface: Single-stage dense face localisation in the wild. arXiv preprint arXiv:1905.00641, 2019b.
- [Doctorow(2019)] C. Doctorow. NIST confirms that facial recognition is a racist, sexist dumpster-fire, 2019. https://boingboing.net/2019/12/19/demographics-v-robots.html5.
- [Drozdowski et al.(2020)Drozdowski, Rathgeb, Dantcheva, Damer, and Busch] Pawel Drozdowski, Christian Rathgeb, Antitza Dantcheva, Naser Damer, and Christoph Busch. Demographic bias in biometrics: A survey on an emerging challenge. IEEE Transactions on Technology and Society, 1(2), 2020.
- [Farkas et al.(2005)Farkas, Katic, and Forrest] Leslie G. Farkas, Marko J. Katic, and Christopher R. Forrest. International anthropometric study of facial morphology in various ethnic groups/races. Journal of Craniofacial Surgery, August 2005.
- [Guo()] Jia Guo. Insightface: 2D and 3D face analysis project. https://github.com/deepinsight/insightface, last accessed on November 2019.
- [Guo et al.(2016)Guo, Zhang, Hu, He, and Gao] Yandong Guo, Lei Zhang, Yuxiao Hu, Xiaodong He, and Jianfeng Gao. MS-celeb-1M: A dataset and benchmark for large-scale face recognition. In European Conference on Computer Vision, 2016.
- [Hoggins(2019)] T. Hoggins. ‘racist and sexist’ facial recognition cameras could lead to false arrests, Dec. 20 2019. https://www.telegraph.co.uk/technology/2019/12/20/racist-sexist-facial-recognition-cameras-could-lead-false-arrests/.
- [Holton et al.(2014)Holton, Yokley, Froehle, and Southard] Nathan E. Holton, Todd R. Yokley, Andrew W. Froehle, and Thomas E. Southard. Ontogenetic scaling of the human nose in a longitudinal sample: Implications for genus homo facial evolution. American Journal of Physical Anthropology, 153, 2014.
- [Howard et al.(2018)Howard, Blanchard, Sirotin, Hasselgren, and Vemury] J. J. Howard, A. A. Blanchard, Y. B. Sirotin, J. A. Hasselgren, and A. Vemury. An investigation of high-throughput biometric systems: Results of the 2018 department of homeland security biometric technology rally. In IEEE International Conference on Biometrics: Theory Applications and Systems, 2018.
- [Klare et al.(2012)Klare, Burge, Klontz, Vorder Bruegge, and Jain] Brendan F. Klare, Mark J. Burge, Joshua C. Klontz, Richard W. Vorder Bruegge, and Anil K. Jain. Face recognition performance: Role of demographic information. IEEE Transactions on Information Forensics and Security, 7(6):1789–1801, 2012.
- [Krishnapriya et al.(2019)Krishnapriya, Vangara, King, Albiero, and Bowyer] K.S. Krishnapriya, K. Vangara, M. C. King, V. Albiero, and K.W. Bowyer. Characterizing the variability in face recognition accuracy relative to race. In Conference on Computer Vision and Pattern Recognition Workshops (CVPRW), 2019.
- [Krishnapriya et al.(2020)Krishnapriya, Albiero, Vangara, King, and Bowyer] K.S. Krishnapriya, V. Albiero, K. Vangara, M.C. King, and K.W. Bowyer. Issues related to face recognition accuracy varying based on race and skin tone. IEEE Transactions on Technology and Society, 1(1), March 2020.
- [Lohr(2018)] S. Lohr. Facial recognition is accurate, if you’re a white guy. The New York Times, Feb. 9 2018.
- [Lu et al.(2019)Lu, Chen, Castillo, and Chellappa] B. Lu, J. Chen, C. D. Castillo, and R. Chellappa. An experimental evaluation of covariates effects on unconstrained face verification. IEEE Transactions on Biometrics, Behavior, and Identity Science, 40(1), 2019.
- [Lui et al.(2009)Lui, Bolme, Draper, Beveridge, Givens, and Phillips] Yui Man Lui, David Bolme, Bruce A. Draper, J. Ross Beveridge, Geoff Givens, and P. Jonathon Phillips. A meta-analysis of face recognition covariates. In IEEE 3rd International Conference on Biometrics: Theory, Applications and Systems, 2009.
- [Muthukumar et al.(2018)Muthukumar, Pedapati, Ratha, Sattigeri, Wu, Kingsbury, Kumar, Thomas, Mojsilovic, and Varshney] V. Muthukumar, T. Pedapati, N. Ratha, P. Sattigeri, C.-W. Wu, B. Kingsbury, A. Kumar, S. Thomas, A. Mojsilovic, and K. R. Varshney. Understanding unequal gender classification accuracy from face images. https://arxiv.org/abs/1812.00099, 2018.
- [P. J. Grother and Phillips(2010)] G. W. Quinn P. J. Grother and P. J. Phillips. Report on the evaluation of 2D still-image face recognition algorithms. NIST interagency report 7709, 2010.
- [Patrick Grother and Hanaoka(2003)] Mei Ngan Patrick Grother and Kayee Hanaoka. Face Recognition Vendor Test (FRVT) Part 3: Demographic Effects. NIST IR 8280, 2003.
- [Phillips et al.(2005)Phillips, Flynn, Scruggs, Bowyer, Chang, Hoffman, Marques, Min, and Worek] P. J. Phillips, P. J. Flynn, T. Scruggs, K. W. Bowyer, Jin Chang, K. Hoffman, J. Marques, Jaesik Min, and W. Worek. Overview of the face recognition grand challenge. In Computer Vision and Pattern Recognition (CVPR), 2005.
- [Phillips et al.(2003)Phillips, Grother, Micheals, Blackburn, Tabassi, and Bone] P.J. Phillips, P.J. Grother, R.J. Micheals, D.M. Blackburn, E. Tabassi, and J.M. Bone. Face Recognition Vendor Test 2002: Evaluation Report. NIST IR 6965, 2003.
- [R. Vera-Rodriguez(2019)] A. Morales R. Vera-Rodriguez, M. Blazquez. Facegenderid: Exploiting gender information in dcnns face recognition systems. In Conference on Computer Vision and Pattern Recognition Workshops (CVPRW), 2019.
- [Ricanek and Tesafaye(2006)] Karl Ricanek and Tamirat Tesafaye. MORPH: A longitudinal image database of normal adult age-progression. In International Conference on Automatic Face and Gesture Recognition, 2006.
- [Santow(2020)] E. Santow. Emerging from AI utopia. Science, April 2020.
- [Turk(2001)] Matthew Turk. A random walk through eigenspace. IEICE transactions on information and systems, 84, December 2001.
- [Turk and Pentland(1991)] Matthew Turk and Alex Pentland. Eigenfaces for recognition. Journal of cognitive neuroscience, 3:71–86, 1991.
- [Valentin et al.(1997)Valentin, Abdi, Edelman, and O’Toole] Dominique Valentin, Herve Abdi, Betty Edelman, and Alice J. O’Toole. Principal component and neural network analyses of face images: What can be generalized in gender classification. Journal of Mathematical Psychology, 42, 1997.
- [Yu et al.(2018)Yu, Wang, Peng, Gao, Yu, and Sang] Changqian Yu, Jingbo Wang, Chao Peng, Changxin Gao, Gang Yu, and Nong Sang. Bisenet: Bilateral segmentation network for real-time semantic segmentation. In Proceedings of the European Conference on Computer Vision (ECCV), 2018.
- [Zhuang et al.(2010)Zhuang, Landsittel, Benson, Roberge, and Shaffer] Ziqing Zhuang, Douglas Landsittel, Stacey Benson, Raymond Roberge, and Ronald Shaffer. Facial anthropometric differences among gender, ethnicity, and age groups. Annals of Occupational Hygiene, March 2010.