Spectrum-Based Log Diagnosis
Abstract.
Background: Continuous Engineering practices are increasingly adopted in modern software development. However, a frequently reported need is for more effective methods to analyze the massive amounts of data resulting from the numerous build and test runs.
Aims: We present and evaluate Spectrum-Based Log Diagnosis (SBLD), a method to help developers quickly diagnose problems found in complex integration and deployment runs. Inspired by Spectrum-Based Fault Localization, SBLD leverages the differences in event occurrences between logs for failing and passing runs, to highlight events that are stronger associated with failing runs.
Method: Using data provided by Cisco Norway, we empirically investigate the following questions: (i) How well does SBLD reduce the effort needed to identify all failure-relevant events in the log for a failing run? (ii) How is the performance of SBLD affected by available data? (iii) How does SBLD compare to searching for simple textual patterns that often occur in failure-relevant events? We answer (i) and (ii) using summary statistics and heatmap visualizations, and for (iii) we compare three configurations of SBLD (with resp. minimum, median and maximum data) against a textual search using Wilcoxon signed-rank tests and the Vargha-Delaney measure of stochastic superiority.
Results: Our evaluation shows that (i) SBLD achieves a significant effort reduction for the dataset used, (ii) SBLD benefits from additional logs for passing runs in general, and it benefits from additional logs for failing runs when there is a proportional amount of logs for passing runs in the data. Finally, (iii) SBLD and textual search are roughly equally effective at effort-reduction, while textual search has slightly better recall. We investigate the cause, and discuss how it is due to characteristics of a specific part of our data.
Conclusions: We conclude that SBLD shows promise as a method for diagnosing failing runs, that its performance is positively affected by additional data, but that it does not outperform textual search on the dataset considered. Future work includes investigating SBLD’s generalizability on additional datasets.
1. Introduction
Continuous Engineering (CE) practices, such as Continuous Integration (CI) and Continuous Deployment (CD), are gaining prominence in software engineering, as they help streamline and optimize the way software is built, tested and shipped. The most salient advantage of CE is the tighter feedback loops: CE practices help developers test and build their software more, and makes software releases less brittle by enabling more incremental releases.
Nevertheless, a frequently reported barrier for success is the need to effectively analyze the data that results from the numerous build and test runs (Laukkanen2017, 1, 2, 3, 4, 5). One evident example of this is the handling and analysis of results from complex end-to-end integration tests which we focus on in this paper: CE practices make it easier to run such end-to-end tests, which include system integration and deployment to production hardware, and they are critical for ensuring the quality of the end product. However, since these end-to-end tests by their nature can fail for multiple reasons, not least in the sense that new product code can make the tests fail in new ways, it is critical to rapidly diagnose these failures.
In this paper we concern ourselves with how to rapidly analyze a set of logs resulting from complex CE tasks111 For simplicity, and without loss of generality, we will refer to these CE tasks as “integration tests” or “tests” throughout the paper, though we acknowledge that they include more than just testing, such as building the system and deploying it on hardware in a test or staging environment, and failures can occur in any of these phases. The proposed approach aims to cover all these situations, and is evaluated on real-life logs capturing everything from building the system, to deploying it on production hardware, and running complex integration and interaction scenarios. where the overall outcome of the task (i.e. ’fail’ or ’pass’) is known, but where analysts must consult the resulting logs to fully diagnose why the failures occurred. Since these logs can get large and unwieldy, we develop a tool that automatically suggests which segments in the logs are most likely relevant for troubleshooting purposes. Our method gives each event in the log an interestingness score based on the overall event frequencies in the test result set: The log events are in turn clustered based on these scores, and the event clusters are presented to the user in decreasing order of overall interestingness. The goal is to enable users to find all relevant diagnostic information in the first presented event cluster, while having the option of retrieving additional clusters if needed. An additional benefit of our method is that the extracted events can help identify commonly occurring patterns that are symptomatic for specific errors. Future logs that exhibit the same characteristics can then be automatically classified as having symptoms of that error.
Contributions: We present Spectrum-Based Log Diagnosis (SBLD), a method for helping developers quickly find the most relevant segments of a log. Using data from Cisco Norway, we empirically evaluate SBLD by investigating the following three questions: (i) How well does SBLD reduce the effort needed to identify all failure-relevant events in the log for a failing run? (ii) How is the performance of SBLD affected by available data? (iii) How does SBLD compare to searching for simple textual patterns that often occur in failure-relevant events?
Overview: The rest of the paper is structured as follows: Section 2 explains SBLD and the methodology underlying its event ranking procedures. Sections 3 and 4 motivates our research questions and empirical design. We report and discuss our results in Section 5. Section 6 surveys related work, and we discuss threats to validity in Section 7 before concluding in Section 8.
2. Approach
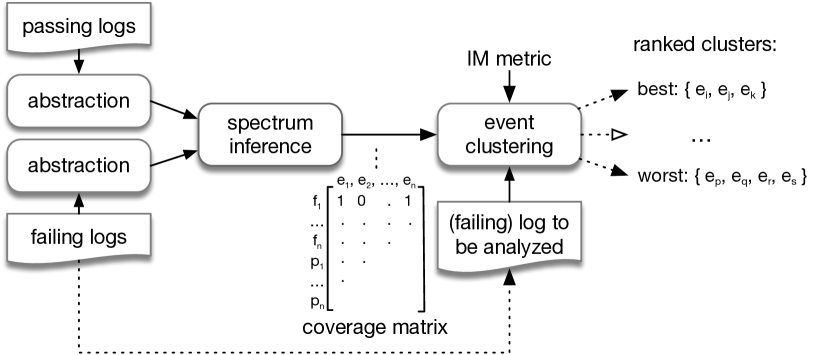
SBLD takes a set of log files from test failures, a set of log files from test successes, and a singular log file from a test failure called the target log that the user wants analyzed and produces a list of segments from the target log file that are likely relevant for understanding why the corresponding test run failed.
In the following we explain the workings of SBLD in a stepwise manner. At each step, we present the technical background needed to understand how SBLD accomplishes its task. A visual overview of SBLD is shown in Figure 1.
Prerequisites: First of all, SBLD requires access to a set of log files from failing test runs and a set of log files from successful test runs. For brevity, we will refer to log files from failing test runs as ’failing logs’, and log files from successful test runs as ’passing logs’.222 Note that we explicitly assume that the outcome of each run is known; This work is not concerned with determining whether the run was a failure or a success, but rather with helping identify why the failing runs failed. We also require a programmatic way of segmenting each log file into individually meaningful components. For the dataset used in this paper these components are events in the form of blocks of text preceded by a date and a time-stamp in a predictable format. Lastly, we require that run-time specific information such as timestamps, dynamically generated IP addresses, check-sums and so on are removed from the logs and replaced with standardized text. We refer to the process of enforcing these requirements and delineating the log into events as the abstraction step. This enables SBLD to treat events like “2019-04-05 19:19:22.441 CEST: Alice calls Bob” and “2019-04-07 13:12:11.337 CEST: Alice calls Bob” as two instances of the same generic event "Alice calls Bob". The appropriate degree of abstraction and how to meaningfully delineate a log will be context-dependent and thus we require the user to perform these steps before using SBLD. In the current paper we use an abstraction mechanism and dataset generously provided by Cisco Norway.
Computing coverage and event relevance: SBLD requires an assumption about what makes an event relevant and a method for computing this relevance. Our method takes inspiration from Spectrum-Based Fault Localization (SBFL) in which the suspiciousness or fault-proneness of a program statement is treated as a function of the number of times the statement was activated in a failing test case, combined with the number of times it is skipped in a passing test case (Jones2002, 6, 7, 8). The four primitives that need to be computed are shown on the right-hand side in Table 1. We treat each abstracted event as a statement and study their occurrences in the logs like Fault Localization tracks the activation of statements in test cases. We compute the analysis primitives by devising a binary coverage matrix whose columns represent every unique event observed in the set of failing and successful logs while each row represents a log and tracks whether the event at column occurred in log (1), or not (0), as shown in Figure 1.
By computing these primitives, we can rank each event by using an interestingness measure (also referred to as ranking metric, heuristic, or similarity coefficient (Wong2016, 9)). The choice of interestingness measure is ultimately left to the user, as these are context dependent and there is no generally optimal choice of interestingness measure (Yoo2014, 10). In this paper we consider a selection of nine interestingness measures prominent in the literature and a simple metric that emphasizes the events that exclusively occur in failing logs in the spirit of the union model discussed by Renieres et al. (renieres2003:fault, 11). We report on the median performance of these interestingness measures with the intention of providing a representative, yet unbiased, result. The ten measures considered are precisely defined in Table 1.
|
|
||||||||||||||||||||||||||||||||||||||||
Analyzing a target log file: Using our database of event scores, we first identify the events occurring in the target log file and the interestingness scores associated with these events. Then, we group similarly scored events together using a clustering algorithm. Finally, we present the best performing cluster of events to the end user. The clustering step helps us make a meaningful selection of events rather than setting an often arbitrary window selection size. Among other things, it prevents two identically scored events from falling at opposite sides of the selection threshold. If the user suspects that the best performing cluster did not report all relevant events, she can inspect additional event clusters in order of decreasing aggregate interestingness score. To perform the clustering step we use Hierarchical Agglomerative Clustering (HAC) with Complete linkage (manning2008introduction, 23), where sub-clusters are merged until the maximal distance between members of each candidate cluster exceeds some specified threshold. In SBLD, this threshold is the uncorrected sample standard deviation of the event scores for the events being clustered.333 Specifically, we use the numpy.std procedure from the SciPy framework (2020SciPy-NMeth, 24), in which the uncorrected sample standard deviation is given by where is the sample mean of the interestingness scores obtained for the events in the log being analyzed and is the number of events in the log. This ensures that the “interestingness-distance” between two events in a cluster never exceeds the uncorrected sample standard deviation observed in the set.
3. Research Questions
The goal of this paper is to present SBLD and help practitioners make an informed decision whether SBLD meets their needs. To this end, we have identified three research questions that encompass several concerns practitioners are likely to have and that also are of interested to the research community at large:
-
RQ1
How well does SBLD reduce the effort needed to identify all known-to-be relevant events ("does it work?") ?
-
RQ2
How is the efficacy of SBLD impacted by increased evidence in the form of additional failing and passing logs ("how much data do we need before running the analysis?") ?
-
RQ3
How does SBLD perform compared to a strategy based on searching for common textual patterns with a tool like grep ("is it better than doing the obvious thing?") ?
RQ1 looks at the aggregated performance of SBLD to assess its viability. With RQ2 we assess how sensitive the performance is to the amount of available data: How many logs should you have before you can expect the analysis to yield good results? Is more data unequivocally a good thing? What type of log is more informative: A passing log or a failing log? Finally, we compare SBLD’s performance to a more traditional method for finding relevant segments in logs: Using a textual search for strings one expects to occur near informative segments, like "failure" and "error". The next section details the dataset used, our chosen quality measures for assessment and our methodology for answering each research question.
4. Experimental Design
| # fail | # pass | distinct | fail-only | mixed | pass-only | ||
|---|---|---|---|---|---|---|---|
| test | signature | logs | logs | events | events | events | events |
| 1 | C | 24 | 100 | 36391 | 21870 | 207 | 14314 |
| 2 | E | 11 | 25 | 380 | 79 | 100 | 201 |
| 3 | E | 11 | 25 | 679 | 174 | 43 | 462 |
| 4 | E | 4 | 25 | 227 | 49 | 39 | 139 |
| 5 | C | 2 | 100 | 33420 | 2034 | 82 | 31304 |
| 6 | C | 19 | 100 | 49155 | 15684 | 893 | 32578 |
| 7 | C | 21 | 100 | 37316 | 17881 | 154 | 19281 |
| 8 | C | 4 | 100 | 26614 | 3976 | 67 | 22571 |
| 9 | C | 21 | 100 | 36828 | 19240 | 228 | 17360 |
| 10 | C | 22 | 100 | 110479 | 19134 | 1135 | 90210 |
| 11 | E | 5 | 25 | 586 | 95 | 47 | 444 |
| 12 | E | 7 | 25 | 532 | 66 | 18 | 448 |
| 13 | C | 2 | 100 | 15351 | 2048 | 232 | 13071 |
| 14 | C | 3 | 100 | 16318 | 2991 | 237 | 13090 |
| 15 | C | 26 | 100 | 60362 | 20964 | 1395 | 38003 |
| 16 | C | 12 | 100 | 2206 | 159 | 112 | 1935 |
| 17 | E | 8 | 25 | 271 | 58 | 98 | 115 |
| 18 | A | 23 | 75 | 3209 | 570 | 156 | 2483 |
| 19 | C | 13 | 100 | 36268 | 13544 | 411 | 22313 |
| 20 | B | 3 | 19 | 688 | 69 | 31 | 588 |
| 21 | B | 22 | 25 | 540 | 187 | 94 | 259 |
| 22 | E | 1 | 25 | 276 | 11 | 13 | 252 |
| 23 | C | 13 | 100 | 28395 | 13629 | 114 | 14652 |
| 24 | E | 7 | 26 | 655 | 117 | 56 | 482 |
| 25 | C | 21 | 100 | 44693 | 18461 | 543 | 25689 |
| 26 | C | 21 | 100 | 42259 | 19434 | 408 | 22417 |
| 27 | C | 21 | 100 | 44229 | 18115 | 396 | 25718 |
| 28 | C | 20 | 100 | 43862 | 16922 | 642 | 26298 |
| 29 | C | 28 | 100 | 54003 | 24216 | 1226 | 28561 |
| 30 | C | 31 | 100 | 53482 | 26997 | 1063 | 25422 |
| 31 | C | 27 | 100 | 53092 | 23283 | 463 | 29346 |
| 32 | C | 21 | 100 | 55195 | 19817 | 768 | 34610 |
| 33 | E | 9 | 25 | 291 | 70 | 30 | 191 |
| 34 | D | 2 | 13 | 697 | 76 | 92 | 529 |
| 35 | E | 9 | 25 | 479 | 141 | 47 | 291 |
| 36 | E | 10 | 75 | 1026 | 137 | 68 | 821 |
| 37 | E | 7 | 25 | 7165 | 1804 | 94 | 5267 |
| 38 | E | 4 | 25 | 647 | 67 | 49 | 531 |
| 39 | G | 47 | 333 | 3350 | 428 | 144 | 2778 |
| 40 | G | 26 | 333 | 3599 | 240 | 157 | 3202 |
| 41 | G | 26 | 332 | 4918 | 239 | 145 | 4534 |
| 42 | C | 17 | 100 | 30411 | 14844 | 348 | 15219 |
| 43 | F | 267 | 477 | 10002 | 3204 | 1519 | 5279 |
| 44 | C | 9 | 100 | 29906 | 8260 | 274 | 21372 |
| 45 | E | 3 | 25 | 380 | 44 | 43 | 293 |
| sub- | fail-only | pass-only | fail & | failure | |
| signature | pattern | events | events | pass | strings* |
| A | 1 | 1 | 0 | 0 | yes |
| A | 2 | 2 | 0 | 0 | no |
| B | 1 | 2 | 0 | 0 | yes |
| C | 1 | 21 | 0 | 0 | yes |
| C | 2 | 21 | 0 | 0 | yes |
| D | 1 | 4 | 0 | 0 | yes |
| D# | 2 | 69 | 267 | 115 | no |
| D# | 3 | 2 | 10 | 13 | no |
| E# | 1 | 24 | 239 | 171 | no |
| E | 1 | 1 | 0 | 0 | no |
| E | 2 | 9 | 0 | 0 | no |
| E | 3 | 9 | 0 | 0 | yes |
| E | 4 | 23 | 0 | 0 | yes |
| F | 1 | 19 | 0 | 0 | yes |
| F | 2 | 19 | 0 | 0 | no |
| F | 3 | 19 | 0 | 0 | yes |
| F | 4 | 14 | 0 | 0 | yes |
| G | 1 | 2 | 0 | 0 | yes |
| G | 2 | 1 | 0 | 0 | no |
| G | 3 | 1 | 0 | 0 | no |
| * signature contains the lexical patterns ’error’, ’fault’ or ’fail*’ | |||||
| # sub-patterns that were removed to ensure a clean ground truth | |||||
4.1. Dataset and ground truth
Our dataset provided by Cisco Norway consists of failing and passing log files from 45 different end-to-end integration tests. In addition to the log text we also have data on when a given log file was produced. Most test-sets span a time-period of 38 days, while the largest set (test 43 in Table 2) spans 112 days. Each failing log is known to exemplify symptoms of one of seven known errors, and Cisco Norway has given us a set of regular expressions that help determine which events are relevant for a given known error. We refer to the set of regular expressions that identify a known error as a signature for that error. These signatures help us construct a ground truth for our investigation. Moreover, an important motivation for developing SBLD is to help create signatures for novel problems: The events highlighted by SBLD should be characteristic of the observed failure, and the textual contents of the events can be used in new signature expressions.
Descriptive facts about our dataset is listed in Table 2 while Table 3 summarizes key insights about the signatures used.
Ideally, our ground truth should highlight exactly and only the log events that an end user would find relevant for troubleshooting an error. However, the signatures used in this investigation were designed to find sufficient evidence that the entire log in question belongs to a certain error class: the log might contain other events that a human user would find equally relevant for diagnosing a problem, but the signature in question might not encompass these events. Nevertheless, the events that constitute sufficient evidence for assigning the log to a given error class are presumably relevant and should be presented as soon as possible to the end user. However, if our method cannot differentiate between these signature events and other events we cannot say anything certain about the relevance of those other events. This fact is reflected in our choice of quality measures, specifically in how we assess the precision of the approach. This is explained in detail in the next section.
When producing the ground truth, we first ensured that a log would only be associated with a signature if the entire log taken as a whole satisfied all the sub-patterns of that signature. If so, we then determined which events the patterns were matching on. These events constitute the known-to-be relevant set of events for a given log. However, we identified some problems with two of the provided signatures that made them unsuitable for assessing SBLD. Signature E (see Table 3) had a sub-pattern that searched for a "starting test"-prefix that necessarily matches on the first event in all logs due to the structure of the logs. Similarly, signature D contained two sub-patterns that necessarily match all logs in the set–in this case by searching for whether the test was run on a given machine, which was true for all logs for the corresponding test. We therefore elected to remove these sub-patterns from the signatures before conducting the analysis.
4.2. Quality Measures
As a measure of how well SBLD reports all known-to-be relevant log events, we measure recall in best cluster, which we for brevity refer to as simply recall. This is an adaption of the classic recall measure used in information retrieval, which tracks the proportion of all relevant events that were retrieved by the system (manning2008introduction, 23). As our method presents events to the user in a series of ranked clusters, we ideally want all known-to-be relevant events to appear in the highest ranked cluster. We therefore track the overall recall obtained as if the first cluster were the only events retrieved. Note, however, that SBLD ranks all clusters, and a user can retrieve additional clusters if desired. We explore whether this could improve SBLD’s performance on a specific problematic test-set in Section 5.4.
It is trivial to obtain a perfect recall by simply retrieving all events in the log, but such a method would obviously be of little help to a user who wants to reduce the effort needed to diagnose failures. We therefore also track the effort reduction (ER), defined as
Much like effective information retrieval systems aim for high recall and precision, we want our method to score a perfect recall while obtaining the highest effort reduction possible.
4.3. Recording the impact of added data
To study the impact of added data on SBLD’s performance, we need to measure how SBLD’s performance on a target log is affected by adding an extra failing log or a passing log . There are several strategies for accomplishing this. One way is to try all combinations in the dataset i.e. compute the performance on any using any choice of failing and passing logs to produce the interestingness scores. This approach does not account for the fact that the logs in the data are produced at different points in time and is also extremely expensive computationally. We opted instead to order the logs chronologically and simulate a step-wise increase in data as time progresses, as shown in Algorithm 1.
4.4. Variability in interestingness measures
As mentioned in Section 2, SBLD requires a choice of interestingness measure for scoring the events, which can have a considerable impact on SBLD’s performance. Considering that the best choice of interestingness measure is context-dependent, there is no global optimum, it is up to the user to decide which interestingness metric best reflects their notion of event relevance.
Consequently, we want to empirically study SBLD in way that captures the variability introduced by this decision. To this end, we record the median score obtained by performing SBLD for every possible choice of interestingness measure from those listed in Table 1. Algorithm 1 demonstrates the procedure in pseudo-code.
4.5. Comparing alternatives
To answer RQ2 and RQ3, we use pairwise comparisons of different configurations of SBLD with a method that searches for regular expressions. The alternatives are compared on each individual failing log in the set in a paired fashion. An important consequence of this is that the statistical comparisons have no concept of which test the failing log belongs to, and thus the test for which there is most data has the highest impact on the result of the comparison.
The pairwise comparisons are conducted using paired Wilcoxon signed-rank tests (wilcoxon1945, 25) where the Pratt correction (Pratt1959, 26) is used to handle ties. We apply Holm’s correction (Holm1979, 27) to the obtained p-values to account for the family-wise error rate arising from multiple comparisons. We declare a comparison statistically significant if the Holm-adjusted p-value is below . The Wilcoxon tests check the two-sided null hypothesis of no difference between the alternatives. We report the Vargha-Delaney and (Vargha2000, 28) measures of stochastic superiority to indicate which alternative is the strongest. Conventionally, is considered a small difference, is considered a medium difference and or greater is considered large (Vargha2000, 28). Observe also that .
4.6. Analysis procedures
We implement the SBLD approach in a prototype tool DAIM (Diagnosis and Analysis using Interestingness Measures), and use DAIM to empirically evaluate the idea.
RQ1 - overall performance: We investigate the overall performance of SBLD by analyzing a boxplot for each test in our dataset. Every individual datum that forms the basis of the plot is the median performance of SBLD over all choices of interestingness measures for a given set of failing and passing logs subject to the chronological ordering scheme outlined above.
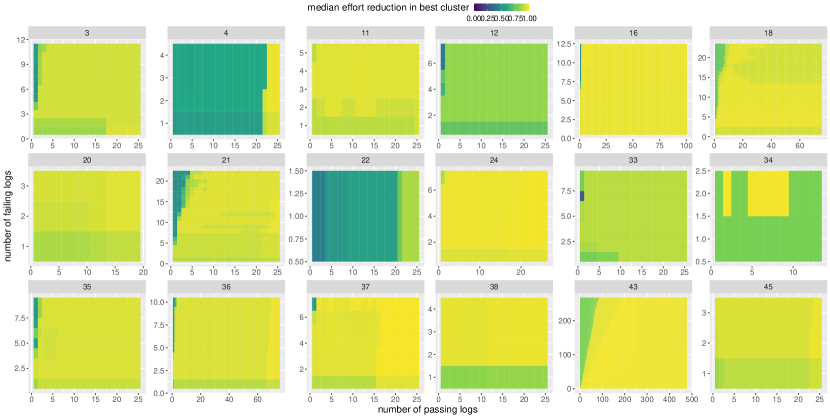
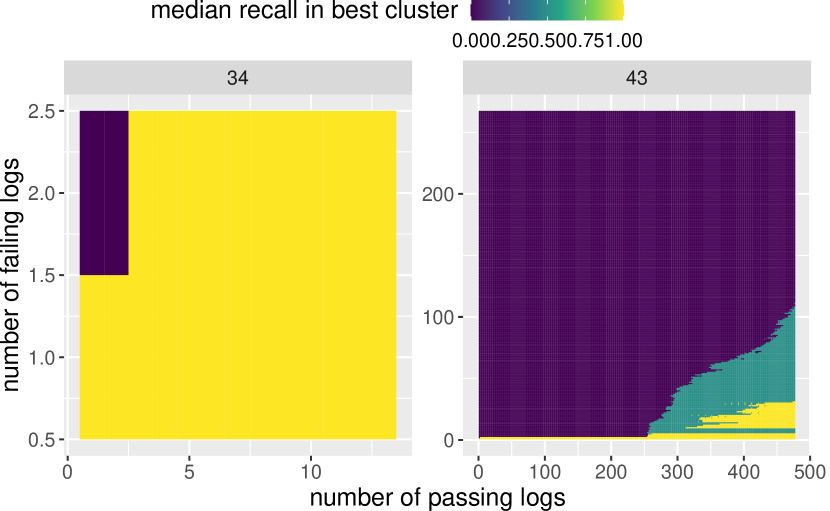
RQ2 - impact of data: We analyze the impact of added data by producing and evaluating heatmaps that show the obtained performance as a function of the number of failing logs (y-axis) and number of passing logs (x-axis). The color intensity of each tile in the heatmaps is calculated by taking the median of the scores obtained for each failing log analyzed with the given number of failing and passing logs as data for the spectrum inference, wherein the score for each log is the median over all the interestingness measures considered as outlined in Section 4.4.
Furthermore, we compare three variant configurations of SBLD that give an overall impression of the influence of added data. The three configurations considered are minimal evidence, median evidence and maximal evidence, where minimal evidence uses only events from the log being analyzed and one additional passing log, median evidence uses the median amount of respectively failing and and passing logs available while maximal evidence uses all available data for a given test. The comparisons are conducted with the statistical scheme described above in Section 4.5.
RQ3 - SBLD versus pattern-based search: To compare SBLD against a pattern-based search, we record the effort reduction and recall obtained when only selecting events in the log that match on the case-insensitive regular expression "error|fault|fail*", where the denotes a wildcard-operator and the denotes logical . This simulates the results that a user would obtain by using a tool like grep to search for words like ’error’ and ’failure’. Sometimes the ground-truth signature expressions contain words from this pattern, and we indicate this in Table 3. If so, the regular expression-based method is guaranteed to retrieve the event. Similarly to RQ2, we compare the three configurations of SBLD described above (minimum, median and maximal evidence) against the pattern-based search using the statistical described in Section 4.5.
5. Results and Discussion
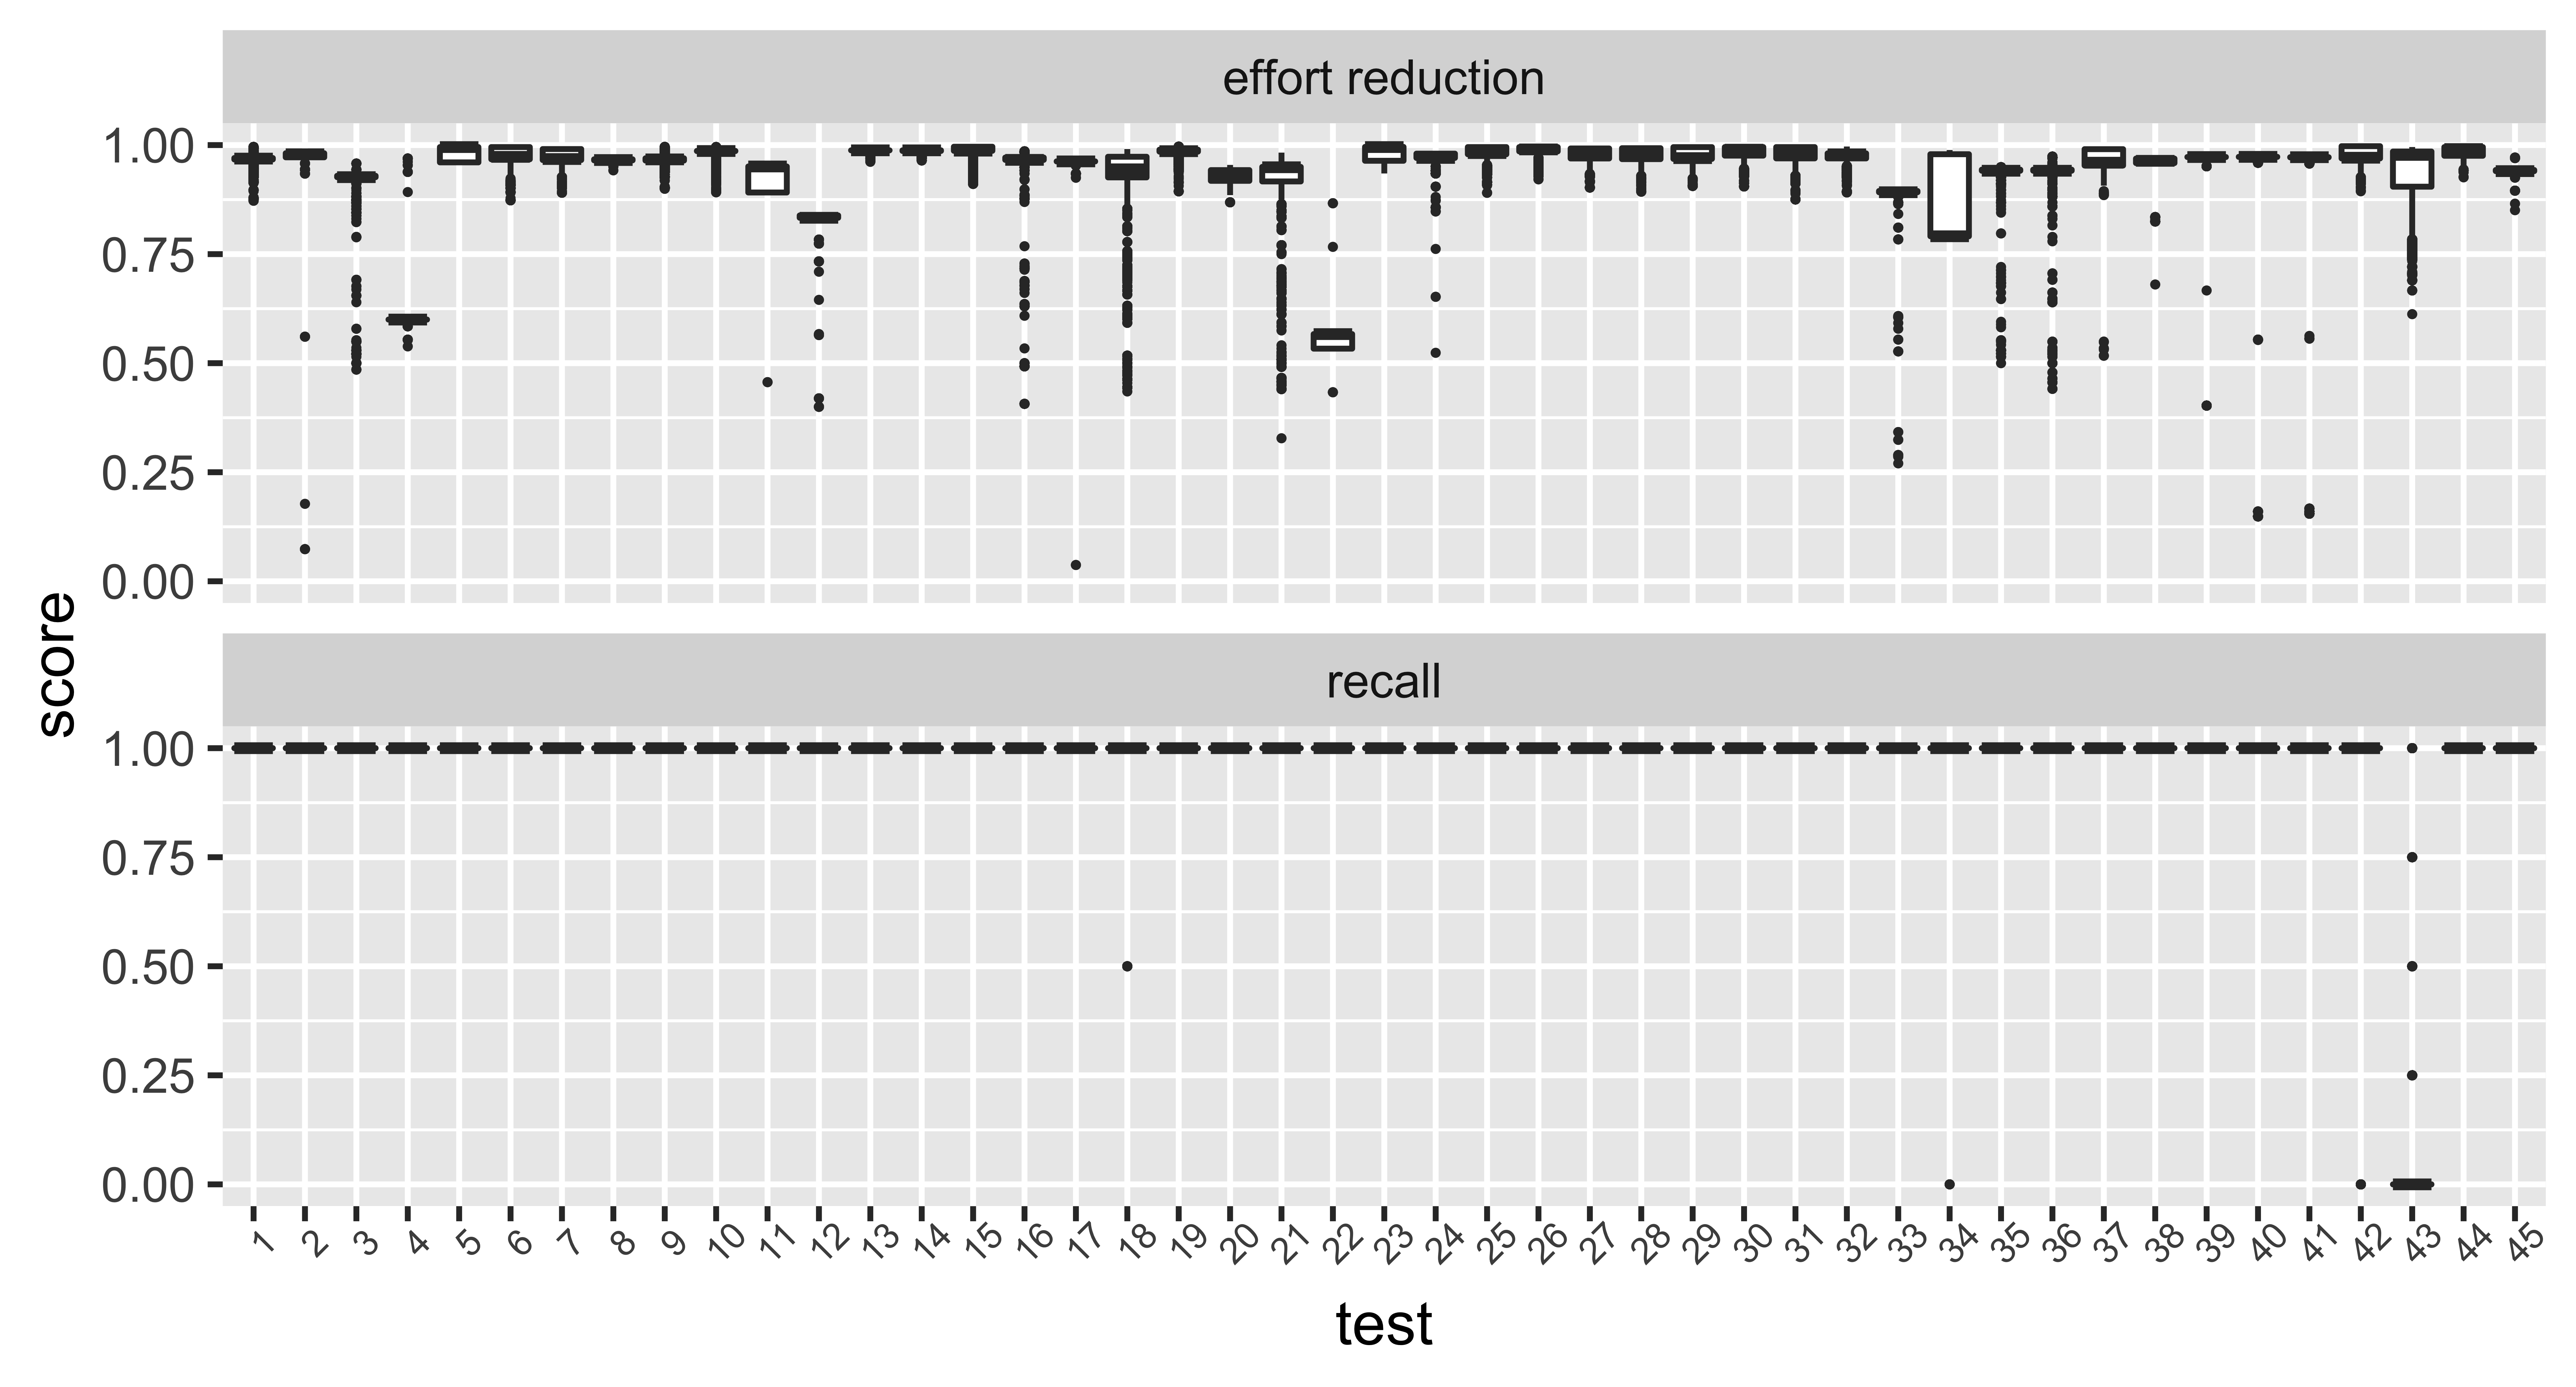
This section gradually dissects Figure 2, showing a breakdown of SBLD’s performance per test for both recall and effort reduction, Figures 3 and 4, showing SBLD’s performance as a function of the number of failing and passing logs used, as well as Table 4, which shows the results of the statistical comparisons we have performed.
| variant 1 | variant 2 | quality measure | Wilcoxon statistic | Holm-adjusted p-value | ||
|---|---|---|---|---|---|---|
| pattern-based search | minimal evidence | effort reduction | 29568.5 | 0.777 | 0.223 | 0.001 |
| pattern-based search | maximal evidence | effort reduction | 202413.0 | 0.506 | 0.494 | 1.000 |
| pattern-based search | median evidence | effort reduction | 170870.5 | 0.496 | 0.504 | 0.001 |
| minimal evidence | maximal evidence | effort reduction | 832.0 | 0.145 | 0.855 | 0.001 |
| minimal evidence | median evidence | effort reduction | 2666.0 | 0.125 | 0.875 | 0.001 |
| maximal evidence | median evidence | effort reduction | 164674.0 | 0.521 | 0.479 | 1.000 |
| pattern-based search | minimal evidence | recall | 57707.0 | 0.610 | 0.390 | 0.001 |
| pattern-based search | maximal evidence | recall | 67296.0 | 0.599 | 0.401 | 0.001 |
| pattern-based search | median evidence | recall | 58663.5 | 0.609 | 0.391 | 0.001 |
| minimal evidence | maximal evidence | recall | 867.5 | 0.481 | 0.519 | 0.001 |
| minimal evidence | median evidence | recall | 909.0 | 0.498 | 0.502 | 0.020 |
| maximal evidence | median evidence | recall | 0.0 | 0.518 | 0.482 | 0.001 |
5.1. RQ1: The overall performance of SBLD
Figure 2 suggests that SBLD’s overall performance is strong, since it obtains near-perfect recall while retaining a high degree of effort reduction. In terms of recall, SBLD obtains a perfect performance on all except four tests: 18, 34, 42 and 43, with the lower quartile stationed at perfect recall for all tests except 43 (which we discuss in detail in Section 5.4). For test 18, only 75 out of 20700 observations () obtained a recall score of while the rest obtained a perfect score. On test 34 (the smallest in our dataset), 4 out of 39 observations obtained a score of zero recall while the others obtained perfect recall. For test 42, 700 out of 15300 () observations obtained a score of zero recall while the rest obtained perfect recall. Hence with the exception of test 43 which is discussed later, SBLD obtains very strong recall scores overall with only a few outliers.
The performance is also strong in terms of effort reduction, albeit more varied. To a certain extent this is expected since the attainable effort reduction on any log will vary with the length of the log and the number of ground-truth relevant events in the log. As can be seen in Figure 2, most of the observations fall well over the 75% mark, with the exceptions being tests 4 and 22. For test 4, Figure 3 suggests that one or more of the latest passing logs helped SBLD refine the interestingness scores. A similar but less pronounced effect seems to have happened for test 22. However, as reported in Table 2, test 22 consists only of one failing log. Manual inspection reveals that the log consists of 30 events, of which 11 are fail-only events. Without additional failing logs, most interestingness measures will give a high score to all events that are unique to that singular failing log, which is likely to include many events that are not ground-truth relevant. Reporting 11 out of 30 events to the user yields a meager effort reduction of around 63%. Nevertheless, the general trend is that SBLD retrieves a compact set of events to the user which yields a high effort reduction score.
In summary, the overall performance shows that SBLD retrieves the majority of all known-to-be-relevant events in compact clusters, which dramatically reduces the analysis burden for the end user. The major exception is Test 43, which we return to in Section 5.4.
5.2. RQ2: On the impact of evidence
The heatmaps suggest that the effort reduction is generally not adversely affected by adding more passing logs. If the assumptions underlying our interestingness measures are correct, this is to be expected: Each additional passing log either gives us reason to devalue certain events that co-occur in failing and passing logs or contain passing-only events that are deemed uninteresting. Most interestingness measures highly value events that exclusively occur in failing logs, and additional passing logs help reduce the number of events that satisfy this criteria. However, since our method bases itself on clustering similarly scored events it is weak to ties in interestingness scores. It is possible that an additional passing log introduces ties where there previously was none. This is likely to have an exaggerated effect in situations with little data, where each additional log can have a dramatic impact on the interestingness scores. This might explain the gradual dip in effort reduction seen in Test 34, for which there are only two failing logs.
Adding more failing logs, on the other hand, draws a more nuanced picture: When the number of failing logs (y-axis) is high relative to the number of passing logs (x-axis), effort reduction seems to suffer. Again, while most interestingness measures will prioritize events that only occur in failing logs, this strategy only works if there is a sufficient corpus of passing logs to weed out false positives. When there are far fewer passing than failing logs, many events will be unique to the failing logs even though they merely reflect a different valid execution path that the test can take. This is especially true for complex integration tests like the ones in our dataset, which might test a system’s ability to recover from an error, or in other ways have many valid execution paths.
The statistical comparisons summarized in Table 4 suggest that the minimal evidence strategy performs poorly compared to the median and maximal evidence strategies. This is especially pronounced for effort reduction, where the Vargha-Delaney metric scores well over 80% in favor of the maximal and median strategy. For recall, the difference between the minimum strategy and the other variants is small, albeit statistically significant. Furthermore, the jump from minimal evidence to median evidence is much more pronounced than the jump from median evidence to maximal evidence. For effort reduction, there is in fact no statistically discernible difference between the median and maximal strategies. For recall, the maximal strategies seems a tiny bit better, but the measure suggests the magnitude of the difference to be small.
Overall, SBLD seems to benefit from extra data, especially additional passing logs. Failing logs also help, but depend on a proportional amount of passing logs for SBLD to fully benefit. The performance increase from going from minimal data to some data is more pronounced than going from some data to maximal data. This suggests that there may be diminishing returns to collecting extra logs, but our investigation cannot prove or disprove this.
5.3. RQ3: SBLD versus simple pattern-search
In terms of effort reduction, Table 4 shows that the pattern-based search clearly beats the minimal evidence variant of SBLD. It does not, however, beat the median and maximal variants: The comparison to median evidence suggests a statistically significant win in favor of median evidence, but the effect reported by is so small that it is unlikely to matter in practice. No statistically significant difference could be established between the pattern-based search and SBLD with maximal evidence.
In one sense, it is to be expected that the pattern-based search does well on effort reduction assuming that events containing words like "fault" and "error" are rare. The fact that the pattern-based search works so well could indicate that Cisco Norway has a well-designed logging infrastructure where such words are rare and occur at relevant positions in the logs. On the other hand, it is then notable that the median and maximum variants of SBLD perform comparably on effort reduction without having any concept of the textual content in the events.
In terms of recall, however, pattern-based search beats all variants of SBLD in a statistically significant manner, where the effect size of the differences is small to medium. One likely explanation for this better performance is that the pattern-based search performs very well on Test 43, which SBLD generally performs less well on. Since the comparisons are run per failing log and test 43 constitutes 29% of the failing logs (specifically, 267 out of 910 logs), the performance of test 43 has a massive impact. We return to test 43 and its impact on our results in Section 5.4.
On the whole, SBLD performs similarly to pattern-based search, obtaining slightly poorer results on recall for reasons that are likely due to a particular test we discuss below. At any rate, there is no contradiction in combining SBLD with a traditional pattern-based search. Analysts could start by issuing a set of pattern-based searches and run SBLD afterward if the pattern search returned unhelpful results. Indeed, an excellent and intended use of SBLD is to suggest candidate signature patterns that, once proven reliable, can be incorporated in a regular-expression based search to automatically identify known issues in future runs.
5.4. What happens in Test 43?
SBLD’s performance is much worse on Test 43 than the other tests, which warrants a dedicated investigation. The first thing we observed in the results for Test 43 is that all of the ground-truth-relevant events occurred exclusively in failing logs and were often singular (11 out of the 33) or infrequent (30 out of 33 events occurred in 10% of the failing logs or fewer). Consequently, we observed a strong performance from the Tarantula and Failed only-measures that put a high premium on failure-exclusive events. Most of the interestingness measures, on the other hand, will prefer an event that is very frequent in the failing logs and sometimes occur in passing logs over a very rare event that only occurs in failing logs. This goes a long way in explaining the poor performance on recall. The abundance of singular events might also suggest that there is an error in the event abstraction framework, where several events that should be treated as instances of the same abstract event are treated as separate events. We discuss this further in Section 7.
Another observation we made is that the failing logs contained only two ground-truth relevant events, which means that the recorded recall can quickly fluctuate between , and .
Would the overall performance improve by retrieving an additional cluster? A priori, retrieving an extra cluster would strictly improve or not change recall since more events are retrieved without removing the previously retrieved events. Furthermore, retrieving an additional cluster necessarily decreases the effort reduction. We re-ran the analysis on Test 43 and collected effort reduction and recall scores for SBLD when retrieving two clusters, and found that the added cluster increased median recall from to while the median effort reduction decreased from to . While the proportional increase in recall is larger than the decrease in effort reduction, this should in our view not be seen as an improvement: As previously mentioned, the failing logs in this set contain only two ground-truth relevant events and thus recall is expected to fluctuate greatly. Secondly, an effort reduction of implies that you still have to manually inspect 28% of the data, which in most information retrieval contexts is unacceptable. An unfortunate aspect of our analysis in this regard is that we do not account for event lengths: An abstracted event is treated as one atomic entity, but could in reality vary from a single line to a stack trace that spans several pages. A better measure of effort reduction should incorporate a notion of event length to better reflect the real-world effect of retrieving more events.
All in all, Test 43 exhibits a challenge that SBLD is not suited for: It asks SBLD to prioritize rare events that are exclusive to failing logs over events that frequently occur in failing logs but might occasionally occur in passing logs. The majority of interestingness measures supported by SBLD would prioritize the latter category of events. In a way, this might suggest that SBLD is not suited for finding outliers and rare events: Rather, it is useful for finding events that are characteristic for failures that have occurred several times - a "recurring suspect", if you will. An avenue for future research is to explore ways of letting the user combine a search for "recurring suspects" with the search for outliers.
6. Related Work
We distinguish two main lines of related work: First, there is other work aimed at automated analysis of log files, i.e., our problem domain, and second, there is other work that shares similarities with our technical approach, i.e., our solution domain.
Automated log analysis: Automated log analysis originates in system and network monitoring for security and administration (lin1990:error, 29, 30), and saw a revival in recent years due to the needs of modern software development, CE and DevOps (Hilton2017, 2, 1, 4, 5, 3, 31).
A considerable amount of research has focused on automated log parsing or log abstraction, which aims to reduce and organize log data by recognizing latent structures or templates in the events in a log (zhu2019:tools, 32, 33). He et al. analyze the quality of these log parsers and conclude that many of them are not accurate or efficient enough for parsing the logs of modern software systems (he2018:automated, 34). In contrast to these automated approaches, our study uses a handcrafted log abstracter developed by Cisco Norway.
Anomaly detection has traditionally been used for intrusion detection and computer security (liao2013:intrusion, 35, 36, 37). Application-level anomaly detection has been investigated for troubleshooting (chen2004:failure, 38, 39), and to assess compliance with service-level agreements (banerjee2010:logbased, 40, 41, 42). Gunter et al. present an infrastructure for troubleshooting of large distributed systems, by first (distributively) summarizing high volume event streams before submitting those summaries to a centralized anomaly detector. This helps them achieve the fidelity needed for detailed troubleshooting, without suffering from the overhead that such detailed instrumentation would bring (Gunter2007, 43). Deeplog by Du et al. enables execution-path and performance anomaly detection in system logs by training a Long Short-Term Memory neural network of the system’s expected behavior from the logs, and using that model to flag events and parameter values in the logs that deviate from the model’s expectations (Du2017, 44). Similarly, LogRobust by Zhang et al. performs anomaly detection using a bi-LSTM neural network but also detects events that are likely evolved versions of previously seen events, making the learned model more robust to updates in the target logging infrastructure (zhang2019:robust, 39).
In earlier work, we use log clustering to reduce the effort needed to process a backlog of failing CE logs by grouping those logs that failed for similar reasons (rosenberg2018:use, 45, 46). They build on earlier research that uses log clustering to identify problems in system logs (Lin2016, 47, 48). Common to these approaches is how the contrast between passing and failing logs is used to improve accuracy, which is closely related to how SBLD highlights failure-relevant events.
Nagarash et al. (nagaraj:2012, 49) explore the use of dependency networks to exploit the contrast between two sets of logs, one with good and one with bad performance, to help developers understand which component(s) likely contain the root cause of performance issues.
An often-occurring challenge is the need to (re)construct an interpretable model of a system’s execution. To this end, several authors investigate the combination of log analysis with (static) source code analysis, where they try to (partially) match events in logs to log statements in the code, and then use these statements to reconstruct a path through the source code to help determine what happened in a failed execution (Xu2009, 50, 51, 52, 53). Gadler et al. employ Hidden Markov Models to create a model of a system’s usage patterns from logged events (gadler2017:mining, 54), while Pettinato et al. model and analyze the behavior of a complex telescope system using Latent Dirichlet Allocation (pettinato2019:log, 55).
Other researchers have analyzed the logs for successful and failing builds, to warn for anti-patterns and decay (vassallo2019:automated, 56), give build repair hints (Vassallo2018, 57), and automatically repair build scripts (hassan2018:hirebuild, 58, 59). Opposite to our work, these techniques exploit the overlap in build systems used by many projects to mine patterns that hint at decay or help repair a failing build, whereas we exploit the contrast with passing runs for the same project to highlight failure-relevant events.
Fault Localization: As mentioned, our approach was inspired by Spectrum-Based Fault Localization (SBFL), where the fault-proneness of a statement is computed as a function of the number of times that the statement was executed in a failing test case, combined with the number of times that the statement was skipped in a passing test case (Jones2002, 6, 14, 7, 8, 17). This more or less directly translates to the inclusion or exclusion of events in failing, resp. passing logs, where the difference is that SBLD adds clustering of the results to enable step-wise presentation of results to the user.
A recent survey of Software Fault Localization includes the SBFL literature up to 2014 (Wong2016, 9). De Souza et. all extend this with SBFL work up to to 2017, and add an overview of seminal work on automated debugging from 1950 to 1977 (deSouza2017, 60). By reflecting on the information-theoretic foundations of fault localization, Perez proposes the DDU metric, which can be used to evaluate test suites and predict their diagnostic performance when used in SBFL (Perez2018, 61). One avenue for future work is exploring how a metric like this can be adapted to our context, and see if helps to explain what happened with test 43.
A recent evaluation of pure SBFL on large-scale software systems found that it under-performs in these situations (only 33-40% of the bugs are identified with the top 10 of ranked results (heiden2019:evaluation, 62). The authors discuss several directions beyond pure SBFL, such as combining it with dynamic program analysis techniques, including additional text analysis/IR techniques (Wang2015a, 63), mutation based fault localization, and using SBFL in an interactive feedback-based process, such as whyline-debugging (ko2008:debugging, 64). Pure SBFL is closely related to the Spectrum-Based Log Diagnosis proposed here, so we may see similar challenges (in fact, test 43 may already show some of this). Of the proposed directions to go beyond pure SBFL, both the inclusion of additional text analysis/IR techniques, and the application of Spectrum-Based Log Diagnosis in an interactive feedback-based process are plausible avenues to extend our approach. Closely related to the latter option, de Souza et al. (deSouza2018b, 65) assess guidance and filtering strategies to contextualize the fault localization process. Their results suggest that contextualization by guidance and filtering can improve the effectiveness of SBFL, by classifying more actual bugs in the top ranked results.
7. Threats to Validity
Construct Validity: The signatures that provide our ground truth were devised to determine whether a given log in its entirety showed symptoms of a known error. As discussed in Section 4.1, we have used these signatures to detect events that give sufficient evidence for a symptom, but there may be other events that could be useful to the user that are not part of our ground truth. We also assume that the logs exhibit exactly the failures described by the signature expression. In reality, the logs could contain symptoms of multiple failures beyond the ones described by the signature.
Furthermore, we currently do not distinguish between events that consist of single line of text, or events that contain a multi-line stack-trace, although these clearly represent different comprehension efforts. This threat could be addressed by tracking the length of the event contents, and using it to further improve the accuracy of our effort reduction measure.
The choice of clustering algorithm and parameters affects the events retrieved, but our investigation currently only considers HAC with complete linkage. While we chose complete linkage to favor compact clusters, outliers in the dataset could cause unfavorable clustering outcomes. Furthermore, using the uncorrected sample standard deviation as threshold criterion may be too lenient if the variance in the scores is high. This threat could be addressed by investigate alternative cluster algorithm and parameter choices.
Moreover, as for the majority of log analysis frameworks, the performance of SBLD strongly depends on the quality of log abstraction. An error in the abstraction will directly propagate to SBLD: For example, if abstraction fails to identify two concrete events as being instances of the same generic event, their aggregated frequencies will be smaller and consequently treated as less interesting by SBLD. Similarly, the accuracy will suffer if two events that represent distinct generic events are treated as instances of the same generic event. Future work could investigate alternative log abstraction approaches.
Internal Validity: While our heatmaps illustrate the interaction between additional data and SBLD performance, they are not sufficient to prove a causal relationship between performance and added data. Our statistical comparisons suggests that a strategy of maximizing data is generally preferable, but they are not sufficient for discussing the respective contribution of failing or passing logs.
External Validity: This investigation is concerned with a single dataset from one industrial partner. Studies using additional datasets from other contexts is needed to assess the generalizability of SBLD to other domains. Moreover, while SBLD is made to help users diagnose problems that are not already well understood, we are assessing it on a dataset of known problems. It could be that these errors, being known, are of a kind that are generally easier to identify than most errors. Studying SBLD in-situ over time and directly assessing whether end users found it helpful in diagnosis would better indicate the generalizability of our approach.
8. Concluding Remarks
Contributions: This paper presents and evaluates Spectrum-Based Log Diagnosis (SBLD), a method for automatically identifying segments of failing logs that are likely to help users diagnose failures. Our empirical investigation of SBLD addresses the following questions: (i) How well does SBLD reduce the effort needed to identify all failure-relevant events in the log for a failing run? (ii) How is the performance of SBLD affected by available data? (iii) How does SBLD compare to searching for simple textual patterns that often occur in failure-relevant events?
Results: In response to (i), we find that SBLD generally retrieves the failure-relevant events in a compact manner that effectively reduces the effort needed to identify failure-relevant events. In response to (ii), we find that SBLD benefits from addition data, especially more logs from successful runs. SBLD also benefits from additional logs from failing runs if there is a proportional amount of successful runs in the set. We also find that the effect of added data is most pronounced when going from little data to some data rather than from some data to maximal data. In response to (iii), we find that SBLD achieves roughly the same effort reduction as traditional search-based methods but obtains slightly lower recall. We trace the likely cause of this discrepancy on recall to a prominent part of our dataset, whose ground truth emphasizes rare events. A lesson learned in this regard is that SBLD is not suited for finding statistical outliers but rather recurring suspects that characterize the observed failures. Furthermore, the investigation highlights that traditional pattern-based search and SBLD can complement each other nicely: Users can resort to SBLD if they are unhappy with what the pattern-based searches turn up, and SBLD is an excellent method for finding characteristic textual patterns that can form the basis of automated failure identification methods.
Conclusions: We conclude that SBLD shows promise as a method diagnosing failing runs, that its performance is positively affected by additional data, but that it does not outperform textual search on the dataset considered.
Future work: We see the following directions for future work: (a) investigate SBLD’s performance on other datasets, to better assess generalizability, (b) explore the impact of alternative log abstraction mechanisms, (c) explore ways of combining SBLD with outlier detection, to accommodate different user needs, (d) adapt the Perez’ DDU metric to our context and see if it can help predict diagnostic efficiency, (e) experiment with extensions of pure SBLD that include additional text analysis/IR techniques, or apply it in an interactive feedback-based process (f) rigorously assess (extensions of) SBLD in in-situ experiments.
Acknowledgements.
We thank Marius Liaaen and Thomas Nornes of Cisco Systems Norway for help with obtaining and understanding the dataset, for developing the log abstraction mechanisms and for extensive discussions. This work is supported by the Sponsor Research Council of Norway https://www.rcn.no through the Certus SFI (Grant ##203461/030). The empirical evaluation was performed on resources provided by uninett sigma2, the national infrastructure for high performance computing and data storage in Norway.References
- (1) Eero Laukkanen, Juha Itkonen and Casper Lassenius “Problems, Causes and Solutions When Adopting Continuous Delivery - A Systematic Literature Review” In Information and Software Technology 82, 2017, pp. 55–79 DOI: 10.1016/j.infsof.2016.10.001
- (2) Michael Hilton, Nicholas Nelson, Timothy Tunnell, Darko Marinov and Danny Dig “Trade-Offs in Continuous Integration: Assurance, Security, and Flexibility” In European Software Engineering Conference and ACM SIGSOFT Symposium on the Foundations of Software Engineering (ESEC/FSE) New York, New York, USA: ACM, 2017, pp. 197–207 DOI: 10.1145/3106237.3106270
- (3) Mojtaba Shahin, Muhammad Ali Babar and Liming Zhu “Continuous Integration, Delivery and Deployment: A Systematic Review on Approaches, Tools, Challenges and Practices” In IEEE Access 5, 2017, pp. 3909–3943 DOI: 10.1109/ACCESS.2017.2685629
- (4) Adam Debbiche, Mikael Dienér and Richard Berntsson Svensson “Challenges When Adopting Continuous Integration: A Case Study” In International Conference on Product-Focused Software Process Improvement (PROFES) 8892, LNCS Springer, 2014, pp. 17–32 DOI: 10.1007/978-3-319-13835-0_2
- (5) Helena Holmstrom Olsson, Hiva Alahyari and Jan Bosch “Climbing the Stairway to Heaven - A Mulitiple-Case Study Exploring Barriers in the Transition from Agile Development towards Continuous Deployment of Software” In Euromicro Conference on Software Engineering and Advanced Applications IEEE, 2012, pp. 392–399 DOI: 10.1109/SEAA.2012.54
- (6) James A. Jones, Mary Jean Harrold and John Stasko “Visualization of Test Information to Assist Fault Localization” In IEEE/ACM International Conference on Software Engineering (ICSE), 2002, pp. 467 DOI: 10.1145/581339.581397
- (7) Rui Abreu, Peter Zoeteweij and Arjan J.C. van Gemund “On the Accuracy of Spectrum-Based Fault Localization” In Testing: Academic and Industrial Conference Practice and Research Techniques (TAICPART) IEEE, 2007, pp. 89–98 DOI: 10.1109/TAIC.PART.2007.13
- (8) Rui Abreu, Peter Zoeteweij, Rob Golsteijn and Arjan J C van Gemund “A Practical Evaluation of Spectrum-Based Fault Localization” In Journal of Systems and Software 82.11 Elsevier, 2009, pp. 1780–1792 DOI: 10.1016/j.jss.2009.06.035
- (9) W. Wong, Ruizhi Gao, Yihao Li, Rui Abreu and Franz Wotawa “A Survey on Software Fault Localization” In IEEE Transactions on Software Engineering 42.8, 2016 DOI: 10.1109/TSE.2016.2521368
- (10) Shin. Yoo, Xiaoyuan Xie, Fei-Ching Kuo, Tsong Yueh Chen and Mark Harman “No Pot of Gold at the End of Program Spectrum Rainbow: Greatest Risk Evaluation Formula Does Not Exist”, 2014
- (11) M. Renieres and S.. Reiss “Fault Localization with Nearest Neighbor Queries” In IEEE/ACM International Conference on Automated Software Engineering (ASE), 2003, pp. 30–39 DOI: 10.1109/ASE.2003.1240292
- (12) James A. Jones, Mary Jean Harrold and John Stasko “Visualization for Fault Localization” In ICSE Workshop on Software Visualization, 2001, pp. 5
- (13) Paul Jaccard “The Distribution of the Flora in the Alpine Zone” In New Phytologist 11.2, 1912, pp. 37–50 DOI: 10.1111/j.1469-8137.1912.tb05611.x
- (14) M.Y. Chen, Emre Kiciman, Eugene Fratkin, Armando Fox and Eric Brewer “Pinpoint: Problem Determination in Large, Dynamic Internet Services” In IEEE/IFIP International Conference on Dependable Systems and Networks (DSN) IEEE, 2002, pp. 595–604 DOI: 10.1109/DSN.2002.1029005
- (15) Akira Ochiai “Zoogeographical Studies on the Soleoid Fishes Found in Japan and Its Neighhouring Regions-II” In Nippon Suisan Gakkaishi 22.9, 1957, pp. 526–530 DOI: 10.2331/suisan.22.526
- (16) Rui Abreu, Peter Zoeteweij and Arjan Van Gemund “An Evaluation of Similarity Coefficients for Software Fault Localization” In Pacific Rim International Symposium on Dependable Computing (PRDC) IEEE, 2006, pp. 39–46 DOI: 10.1109/PRDC.2006.18
- (17) Lee Naish, Hua Jie Lee and Kotagiri Ramamohanarao “A Model for Spectra-Based Software Diagnosis” In ACM Transactions on Software Engineering and Methodology 20.3, 2011, pp. 1–32 DOI: 10.1145/2000791.2000795
- (18) Alberto González-Sánchez “Automatic Error Detection Techniques Based on Dynamic Invariants”, 2007
- (19) W. Wong, Vidroha Debroy, Ruizhi Gao and Yihao Li “The DStar Method for Effective Software Fault Localization” In IEEE Transactions on Reliability 63.1, 2014, pp. 290–308 DOI: 10.1109/TR.2013.2285319
- (20) W. Wong, Yu Qi, Lei Zhao and Kai-Yuan Cai “Effective Fault Localization Using Code Coverage” In Annual International Computer Software and Applications Conference (COMPSAC) 1 IEEE, 2007, pp. 449–456 DOI: 10.1109/COMPSAC.2007.109
- (21) W. Wong, Vidroha Debroy and Byoungju Choi “A Family of Code Coverage-Based Heuristics for Effective Fault Localization” In Journal of Systems and Software 83.2, 2010, pp. 188–208 DOI: 10.1016/j.jss.2009.09.037
- (22) Stanisław Kulczyński “Die Pflanzenassoziationen Der Pieninen” In Bulletin International de l’Academie Polonaise des Sciences et des Lettres, Classe des Sciences Mathematiques et Naturelles, B (Sciences Naturelles) II, 1927, pp. 57–203
- (23) Christopher D Manning, Prabhakar Raghavan and Hinrich Schütze “Introduction to Information Retrieval” Cambridge University Press, 2008
- (24) Pauli Virtanen et al. “SciPy 1.0: Fundamental Algorithms for Scientific Computing in Python” In Nature Methods 17, 2020, pp. 261–272 DOI: 10.1038/s41592-019-0686-2
- (25) Frank Wilcoxon “Individual Comparisons by Ranking Methods” In Biometrics Bulletin 1.6, 1945, pp. 80–83 DOI: 10.2307/3001968
- (26) John W. Pratt “Remarks on Zeros and Ties in the Wilcoxon Signed Rank Procedures” In Journal of the American Statistical Association 54.287, 1959, pp. 655 DOI: 10.2307/2282543
- (27) Sture Holm “A Simple Sequentially Rejective Multiple Test Procedure” In Scandinavian Journal of Statistics 6.2, 1979, pp. 65–70
- (28) András Vargha and Harold D. Delaney “A Critique and Improvement of the CL Common Language Effect Size Statistics of McGraw and Wong” In Journal of Educational and Behavioral Statistics 25.2, 2000, pp. 101–132 DOI: 10.3102/10769986025002101
- (29) T.-T.Y. Lin and D.P. Siewiorek “Error Log Analysis: Statistical Modeling and Heuristic Trend Analysis” In IEEE Transactions on Reliability 39.4, 1990, pp. 419–432 DOI: 10.1109/24.58720
- (30) Adam Oliner and Jon Stearley “What Supercomputers Say: A Study of Five System Logs” In IEEE/IFIP International Conference on Dependable Systems and Networks (DSN), 2007, pp. 575–584 DOI: 10.1109/DSN.2007.103
- (31) Jeanderson Candido, Maurício Aniche and Arie van Deursen “Contemporary Software Monitoring: A Systematic Literature Review”, 2019 arXiv:1912.05878
- (32) Jieming Zhu, Shilin He, Jinyang Liu, Pinjia He, Qi Xie, Zibin Zheng and Michael R. Lyu “Tools and Benchmarks for Automated Log Parsing” In IEEE/ACM International Conference on Software Engineering: Software Engineering in Practice (ICSE-SEIP) Montreal, QC, Canada: IEEE, 2019, pp. 121–130 DOI: 10.1109/ICSE-SEIP.2019.00021
- (33) Diana El-Masri, Fabio Petrillo, Yann-Gaël Guéhéneuc, Abdelwahab Hamou-Lhadj and Anas Bouziane “A Systematic Literature Review on Automated Log Abstraction Techniques” In Information and Software Technology 122, 2020, pp. 106276 DOI: 10.1016/j.infsof.2020.106276
- (34) Pinjia He, Jieming Zhu, Shilin He, Jian Li and Michael R. Lyu “Towards Automated Log Parsing for Large-Scale Log Data Analysis” In IEEE Transactions on Dependable and Secure Computing 15.6, 2018, pp. 931–944 DOI: 10.1109/TDSC.2017.2762673
- (35) H.-J. Liao, C.-H. Richard Lin, Y.-C. Lin and K.-Y. Tung “Intrusion Detection System: A Comprehensive Review” In Journal of Network and Computer Applications 36.1, 2013, pp. 16–24 DOI: 10.1016/j.jnca.2012.09.004
- (36) A.A. Ramaki and R.E. Atani “A Survey of IT Early Warning Systems: Architectures, Challenges, and Solutions” In Security and Communication Networks 9.17, 2016, pp. 4751–4776 DOI: 10.1002/sec.1647
- (37) A.A. Ramaki, A. Rasoolzadegan and A.G. Bafghi “A Systematic Mapping Study on Intrusion Alert Analysis in Intrusion Detection Systems” In ACM Computing Surveys 51.3, 2018 DOI: 10.1145/3184898
- (38) M. Chen, A.X. Zheng, J. Lloyd, M.I. Jordan and E. Brewer “Failure Diagnosis Using Decision Trees” In International Conference on Autonomic Computing, 2004, pp. 36–43 DOI: 10.1109/ICAC.2004.1301345
- (39) Xu Zhang et al. “Robust Log-Based Anomaly Detection on Unstable Log Data” In European Software Engineering Conference and ACM SIGSOFT Symposium on the Foundations of Software Engineering (ESEC/FSE), ESEC/FSE 2019 New York, NY, USA: Association for Computing Machinery, 2019, pp. 807–817 DOI: 10.1145/3338906.3338931
- (40) Sean Banerjee, Hema Srikanth and Bojan Cukic “Log-Based Reliability Analysis of Software as a Service (SaaS)” In IEEE International Symposium on Software Reliability Engineering (ISSRE), 2010, pp. 239–248 DOI: 10.1109/ISSRE.2010.46
- (41) Shilin He, Qingwei Lin, Jian-guang Lou, Hongyu Zhang, Michael R Lyu and Dongmei Zhang “Identifying Impactful Service System Problems via Log Analysis” In European Software Engineering Conference and ACM SIGSOFT Symposium on the Foundations of Software Engineering (ESEC/FSE) New York, New York, USA: ACM Press, 2018, pp. 60–70 DOI: 10.1145/3236024.3236083
- (42) C. Sauvanaud, M. Kaâniche, K. Kanoun, K. Lazri and G. Da Silva Silvestre “Anomaly Detection and Diagnosis for Cloud Services: Practical Experiments and Lessons Learned” In Journal of Systems and Software 139, 2018, pp. 84–106 DOI: 10.1016/j.jss.2018.01.039
- (43) Dan Gunter, Brian L. Tierney, Aaron Brown, Martin Swany, John Bresnahan and Jennifer M. Schopf “Log Summarization and Anomaly Detection for Troubleshooting Distributed Systems” In IEEE/ACM International Workshop on Grid Computing, 2007, pp. 226–234 DOI: 10.1109/GRID.2007.4354137
- (44) Min Du, Feifei Li, Guineng Zheng and Vivek Srikumar “DeepLog: Anomaly Detection and Diagnosis from System Logs through Deep Learning.” In SIGSAC Conference on Computer and Communications Security (CCS) New York, New York, USA: ACM Press, 2017, pp. 1285–1298 DOI: 10.1145/3133956.3134015
- (45) Carl Martin Rosenberg and Leon Moonen “On the Use of Automated Log Clustering to Support Effort Reduction in Continuous Engineering” In Asia-Pacific Software Engineering Conference (APSEC), 2018, pp. 179–188 DOI: 10.1109/APSEC.2018.00032
- (46) Carl Martin Rosenberg and Leon Moonen “Improving Problem Identification via Automated Log Clustering Using Dimensionality Reduction” In International Symposium on Empirical Software Engineering and Measurement (ESEM) ACM, 2018, pp. Article No. 16 DOI: 10.1145/3239235.3239248
- (47) Qingwei Lin, Hongyu Zhang, Jian-Guang Lou, Yu Zhang and Xuewei Chen “Log Clustering Based Problem Identification for Online Service Systems” In IEEE/ACM International Conference on Software Engineering: Software Engineering in Practice (ICSE-SEIP) New York, NY, USA: ACM, 2016, pp. 102–111 DOI: 10.1145/2889160.2889232
- (48) Weiyi Shang, Zhen Ming Jiang, Hadi Hemmati, Brain Adams, Ahmed E. Hassan and Patrick Martin “Assisting Developers of Big Data Analytics Applications When Deploying on Hadoop Clouds” In IEEE/ACM International Conference on Software Engineering (ICSE) IEEE, 2013 DOI: 10.1109/ICSE.2013.6606586
- (49) Karthik Nagaraj, Charles Killian and Jennifer Neville “Structured Comparative Analysis of Systems Logs to Diagnose Performance Problems” In USENIX Symposium on Networked Systems Design and Implementation (NSDI), 2012, pp. 353–366
- (50) Wei Xu, Ling Huang, Armando Fox, David Patterson and Michael I. Jordan “Detecting Large-Scale System Problems by Mining Console Logs” In ACM SIGOPS Symposium on Operating Systems Principles (SOSP) ACM, 2009, pp. 117–132 DOI: 10.1145/1629575.1629587
- (51) Ding Yuan, Haohui Mai, Weiwei Xiong, Lin Tan, Yuanyuan Zhou and Shankar Pasupathy “SherLog: Error Diagnosis by Connecting Clues from Run-Time Logs” In Architectural Support for Programming Languages and Operating Systems (ASPLOS), 2010, pp. 143 DOI: 10.1145/1736020.1736038
- (52) Xu Zhao, Yongle Zhang, David Lion, Muhammad Faizan Ullah, Yu Luo, Ding Yuan and Michael Stumm “Lprof: A Non-Intrusive Request Flow Profiler for Distributed Systems” In 11th {}USENIX Symposium on Operating Systems Design and Implementation ({}OSDI 14), 2014, pp. 629–644
- (53) Daan Schipper, Maurıcio Aniche and Arie van Deursen “Tracing Back Log Data to Its Log Statement: From Research to Practice” In IEEE/ACM International Conference on Mining Software Repositories (MSR), 2019, pp. 545–549 DOI: 10.1109/MSR.2019.00081
- (54) Daniele Gadler, Michael Mairegger, Andrea Janes and Barbara Russo “Mining Logs to Model the Use of a System” In Proceedings of the 11th ACM/IEEE International Symposium on Empirical Software Engineering and Measurement, ESEM ’17 Markham, Ontario, Canada: IEEE Press, 2017, pp. 334–343 DOI: 10.1109/ESEM.2017.47
- (55) Michele Pettinato, Juan Pablo Gil, Patricio Galeas and Barbara Russo “Log Mining to Re-Construct System Behavior: An Exploratory Study on a Large Telescope System” In Information and Software Technology 114, 2019, pp. 121–136 DOI: 10.1016/j.infsof.2019.06.011
- (56) Carmine Vassallo “Automated Reporting of Anti-Patterns and Decay in Continuous Integration” In IEEE/ACM International Conference on Software Engineering (ICSE), 2019, pp. 105–115
- (57) Carmine Vassallo, Sebastian Proksch, Timothy Zemp and Harald C Gall “Un-Break My Build: Assisting Developers with Build Repair Hints” In IEEE International Conference on Program Comprehension (ICPC), 2018, pp. 41–51 DOI: 10.1145/3196321.3196350
- (58) Foyzul Hassan and Xiaoyin Wang “HireBuild: An Automatic Approach to History-Driven Repair of Build Scripts” In IEEE/ACM International Conference on Software Engineering (ICSE) Gothenburg, Sweden: ACM Press, 2018, pp. 1078–1089 DOI: 10.1145/3180155.3180181
- (59) Daniel Tarlow, Subhodeep Moitra, Andrew Rice, Zimin Chen, Pierre-Antoine Manzagol, Charles Sutton and Edward Aftandilian “Learning to Fix Build Errors with Graph2Diff Neural Networks”, 2019
- (60) Higor A. de Souza, Marcos L. Chaim and Fabio Kon “Spectrum-Based Software Fault Localization: A Survey of Techniques, Advances, and Challenges”, 2017
- (61) Alexandre Campos Perez “Spectrum-Based Diagnosis: Measurements, Improvements and Applications”, 2018
- (62) Simon Heiden, Lars Grunske, Timo Kehrer, Fabian Keller, Andre Hoorn, Antonio Filieri and David Lo “An Evaluation of Pure Spectrum-Based Fault Localization Techniques for Large-Scale Software Systems” In Software: Practice and Experience 49.8, 2019, pp. 1197–1224 DOI: 10.1002/spe.2703
- (63) Qianqian Wang, Chris Parnin and Alessandro Orso “Evaluating the Usefulness of IR-Based Fault Localization Techniques” In International Symposium on Software Testing and Analysis (ISSTA) New York, New York, USA: ACM Press, 2015, pp. 1–11 DOI: 10.1145/2771783.2771797
- (64) Amy J. Ko and Brad A. Myers “Debugging Reinvented: Asking and Answering Why and Why Not Questions about Program Behavior” In IEEE/ACM International Conference on Software Engineering (ICSE) Leipzig, Germany: Association for Computing Machinery, 2008, pp. 301–310 DOI: 10.1145/1368088.1368130
- (65) Higor A. de Souza, Danilo Mutti, Marcos L. Chaim and Fabio Kon “Contextualizing Spectrum-Based Fault Localization” In Information and Software Technology 94.October 2016, 2018, pp. 245–261 DOI: 10.1016/j.infsof.2017.10.014