Measurement of Ehrlich-Schwoebel barrier contribution to
the self-organized formation of ordered surface patterns on Ge(001)
Abstract
Normal incidence 1 keV Ar+ ion bombardment leads to amorphization and ultrasmoothing of Ge at room temperature, but at elevated temperatures the Ge surface remains crystalline and is unstable to the formation of self-organized nanoscale patterns of ordered pyramid-shaped pits. The physical phenomenon distinguishing the high temperature patterning from room temperature ultrasmoothing is believed to be a surface instability due to the Ehrlich-Schwoebel barrier for diffusing vacancies and adatoms, which is not present on the amorphous material. This real-time GISAXS study compares smoothing of a pre-patterned Ge sample at room temperature with patterning of an initially flat Ge sample at an elevated temperature. In both experiments, when the nanoscale structures are relatively small in height, the average kinetics can be explained by a linear theory. The linear theory coefficients, indicating surface stability or instability, were extracted for both experiments. A comparison between the two measurements allows estimation of the contribution of the Ehrlich-Schwoebel barrier to the self-organized formation of ordered nanoscale patterns on crystalline Ge surfaces.
Elemental semiconductor surfaces bombarded by a broad ion beam at normal incidence are ultrasmoothed Moseler et al. (2005); Madi et al. (2009) at room temperature. For high polar angle ion bombardment, self-organized nanoscale ripple patterns are observed at room temperature Teichmann et al. (2013); Perkinson et al. (2013); Anzenberg et al. (2012); Madi et al. (2011). However, the surface is amorphized, and the pattern formation is due to instabilities related to the curvature dependence of sputter erosion Sigmund (1973); Bradley and Harper (1988), and to impact-induced mass redistribution Carter and Vishnyakov (1996), both of which occur together with a stabilizing process or processes such as surface diffusion or surface confined viscous flow Bradley and Harper (1988); Carter and Vishnyakov (1996); Umbach et al. (2001). In contrast, during normal-incidence ion bombardment above the corresponding recrystallation temperature, ordered, faceted patterns are known to form spontaneously along crystal directions on elemental or compound semiconductors Ou et al. (2013, 2015). The crystalline pattern formation at elevated temperatures is believed to be due mainly due to the surface instability caused by the Ehrlich-Schwoebel (ES) barrier Ou et al. (2015).
In this work, we use real-time experiments with sample temperatures above and below the recrystalliation temperature of Ge to quantitatively measure the ES barrier’s contribution to the self-organized pattern formation during 1 keV Ar+ bombardment of Ge. The high temperature sample, which was initially flat, was bombarded at a temperature of 300∘C, leading to self-organized pattern formation of ordered pyramid-shaped pits with four-fold symmetry. On the other hand, normal incidence ion bombardment of a Ge surface at room temperature smooths it. This hinders X-ray studies by reducing the scattering intensities from the surface. Therefore, to achieve sufficient scattering intensities, the room temperature experiment was conducted by normal-incidence bombardment of a pre-patterned Ge sample.
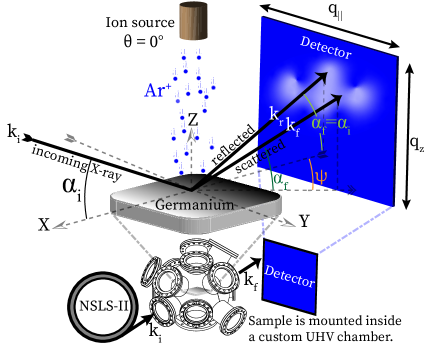
For the experiment, 500 m thick n-doped (Sb) Ge(001) wafers were cut into 1 1 cm2 pieces and cleaned with acetone, isopropyl alcohol, and methanol. Samples were firmly affixed to a stage by spot welding Ta strips at the two opposite corners. The water-cooled sample stage base supported a heater which in turn was directly beneath a thermocouple and the sample. For the high temperature bombardment experiment, the sample temperature was kept at 300∘C. Additionally, the sample stage was electrically isolated except for a wire leading out to an ampere meter in order to measure ion flux. The sample holder was mounted in a custom UHV chamber with mica X-ray windows and a base pressure of 5 Torr. For both experiments, samples were bombarded with a broad beam of 1 keV Ar+ ions, which was generated by a 3-cm graphite-grid ion source from Veeco Instruments Inc. placed at 0∘ ion incidence angle (). The ion beam flux was measured to be 1 1015 ions cm-2s-1 at the operating chamber pressure of 2 Torr. The final fluences were 1.1 1017 ions cm-2 for the room temperature smoothing and 2.4 1018 ions cm-2 for the high temperature patterning.
Real-time X-ray scattering experiments were performed at the Coherent Hard X-ray (CHX) beamline at the National Synchrotron Light Source-II (NSLS-II) of Brookhaven National Laboratory. The photon energy of 9.65 keV was selected with a flux of approximately 5 photon s-1 and beam dimensions 10 10 m2. Experiments used an Eiger-X 4M detector (Dectris) with 75 m pixel size, which was located 10.3 m from the sample. The incident X-ray angle was 0.39∘, which is slightly above the critical angle of total external reflection for Germanium of 0.25∘. The scattered intensity was recorded as a function of the exit angle and using the 2D detector, as shown in Fig. 1. The change in X-ray wavevector can be calculated from those angles:
| (1) |
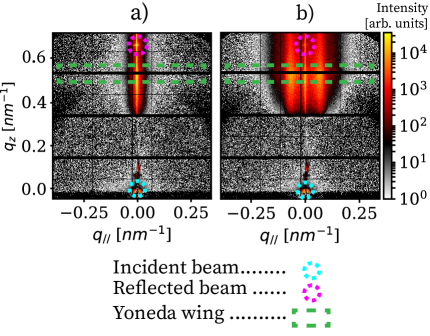
Since is small, the horizontal component (parallel to the surface) can be approximated as simply and the vertical component as (perpendicular to the surface). In the analysis of this paper, we will primarily be interested in the scattering along the Yoneda wing, which is particularly sensitive to surface structure. Example scattering patterns recorded on the area detector are shown in Fig. 2.
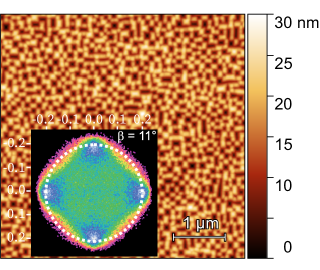
A post facto AFM image confirms the formation of ordered faceted patterns on the high temperature sample as seen in Fig. 3. To explain the patterning phenomenon, Ou et al. used the following continuum equation Ou et al. (2015) in their simulations, which well reproduced the experimental observations of ordered pyramidal pit patterns on Ge:
| (2) |
where is the constant erosion rate of the flat Ge surface, is the curvature dependent sputter rate, is the surface current resulting from the ballistic mass redistribution, and represents the surface current due to diffusion. is the isotropic Herring-Mullins (HM) surface diffusion. is the non-linear ‘conserved Kadar-Parisi- Zhang’ coefficient. , which has the ES barrier coefficient and the parameter (the angle of the facets are given by ), represents the anisotropic current that incorporates both the anisotropy of the ES barrier itself and step edge diffusion. The last term is stochastic noise.
When slopes are small, such as in the early stages of patterning of an initially-flat sample or in the slightly later stages of smoothing an initially patterned surface, the nonlinear terms of Eq. 2 can be neglected and the equation reduces to a linear form, which is then Fourier transformed Bradley and Harper (1988); Madi et al. (2011):
| (3) |
where is the Fourier transform of the surface height , is the amplification factor or dispersion relation, and is the Fourier transform of a stochastic noise. The amplification factor can be determined experimentally by measuring the -averaged height-height structure factor evolution Madi et al. (2011); Norris et al. (2017):
| (4) | |||||
where is the magnitude of the stochastic noise: . The amplification factor differentiates surface stability or instability; a positive drives exponential amplification of modes of wavevector resulting in surface instability, while a negative damps fluctuations and stabilizes modes of wavevector .
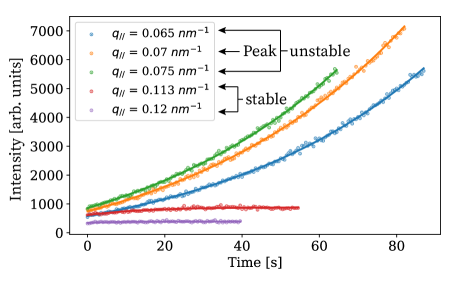
To determine , the -averaged intensities were first computed by averaging 10 detector pixels in the direction ( = 0.004 nm-1) and 70 pixels in the direction ( = 0.028 nm-1). The temporal evolution of the scattered intensity from each wavenumber bin was then fitted with a function of the form , as in Eq. 4, with , and being independent fit parameters for each bin. The time scales over which the linear theory is valid differ from one bin to another since structural evolution happens faster at smaller length scales. In Fig. 4, the intensity fits are shown for selected in high temperature patterning. For each wavenumber of interest, was computed to determine optimum time scales over which the fits were performed. Near the peak wavenumber, there is an exponential growth, indicating surface instability. On the other hand, the measured for room temperature bombardment are all negative, showing surface stability at all wavenumbers.
The amplification factor is usually taken to have a formMadi et al. (2011):
| (5) |
where is a coefficient of curvature-dependent surface evolution, incorporating the curvature-dependent sputter erosion (the term in Eq. 2), lateral mass redistribution (the term), and, in the case of a crystalline surface, the linear part of the ES term . The coefficient (the term in the case of high temperature patterning according to Eq. 2) is a measure of surface diffusion and/or surface confined viscous flow.
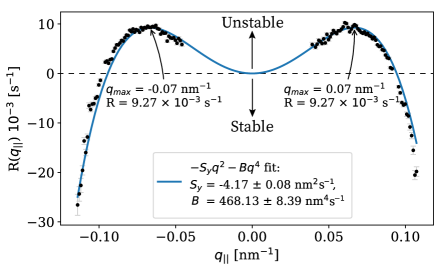
Figure 5(a) shows that the R() values in the high temperature experiment were well fitted with Eq. 5. The values at the lowest were excluded because of the overlap of the reflected beam with the diffuse scattering. Additionally, the behavior is symmetric between positive and negative values. The fitted values are = -4.17 0.08 nm2s-1 and = 468.1 8.4 nm4s-1. In linear theory, the wavenumber of most rapid growth, , is: . In other words, the developing structures had an initial average length scale of 90 nm, which is comparable to the length scales in Fig. 3, though some coarsening had taken place by the time of the post-facto image, resulting in a slightly larger period of the patterns.
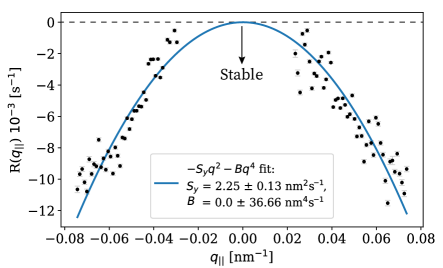
For the room temperature smoothing experiment, the pre-patterned Ge sample was bombarded beforehand and had well-developed faceted patterns with four-fold symmetry, similar to the final result of the high-temperature experiment as shown in Fig. 3. After 10 seconds of bombardment, amorphization had occurred and decrease in x-ray intensity indicates that the large nanoscale structures had been significantly suppressed. Then, the scattering intensities from the pre-patterned sample started to decay at exponential rates, which were well fitted by the linear theory model, yielding . The measured values in the room temperature experiment were then fitted with Eq. 5 as shown in Fig. 5(b).
The results for the two samples are tabulated in Table 1. The room temperature curvature-dependent term = 2.25 0.13 nm2s-1 has opposite sign compared to . This difference in sign is expected due to the instability in the high temperature experiment leading to the formation of patterns versus the surface stability and smoothing in the room temperature experiment.
As noted above, the coefficient in Eq. 5 includes curvature dependent sputtering , lateral mass redistribution, in the high temperature patterning case, it also includes surface instability due to the presence of the ES barrier term. Since the incident ion and most recoil energies are far above thermal energies, we expect that contributions from sputter erosion and lateral mass redistribution are relatively independent of temperature, even through the change in bombarded material from amorphous to crystalline with increasing temperature. However the ES barrier term only exists in the high temperature patterning case. Therefore, subtraction of the curvature-dependent term measured at the room temperature smoothing from the curvature-dependent term at high temperature patterning gives the ES contribution to the curvature-dependent term: = = -6.42 0.15 nm.
It is worth noting that the erosive and redistributive contributions to can be estimated following the general approaches of Bobes et al. Bobes et al. (2012) and Hofsäss Hofsäss et al. (2014) using SDTrimSP Mutzke et al. (2019) binary collision approximation simulations in conjunction with the erosive formalism of Bradley and Harper Bradley and Harper (1988) and the redistributive formulism of Carter and Vishnyakov Carter and Vishnyakov (1996). These give an erosive contribution nm2/s and a redistributive contribution nm2/s, for a total nm2/s. A different approach to calculating the curvature coefficient Norris (2014) using the PyCraters Python framework Norris (2017) for crater function analysis on the SDTrimSP results also gives nm2/s. Both of these values are significantly smaller than the measured value of 2.25 nm2/s, but estimates of the parameters entering theory must be considered approximate.
Turning to the smoothening term , high wavenumbers play an important role since it multiplies , unlike the case for which multiplies and can be determined reliably by values at low wavenumbers. The large uncertainty in the experimental value of can therefore be explained by the fact that smoothing causes limited scattering intensities at high wavenumbers. In contrast, has a relatively small uncertainty due to a wider range of accessible wavenumbers.
In the room temperature experiment, is believed to be due primarily to ion-induced surface viscous flowUmbach et al. (2001). It is generally believed that ion-induced diffusion and any thermal relaxation are much smaller at room temperature. Because the surface remains crystalline during high temperature nanopatterning , on the other hand, is presumably due to surface diffusion, which could be a combination of thermal and/or ion-induced. As far as we know, there is no compelling rationale suggesting that a pure ion-induced surface diffusion should be much larger on a crystalline surface than on an amorphous surface. Therefore it appears that the large value of relative to is because of thermal relaxation processes.
| [nm] | [nm] | [nm-1] | |
| RT : 30∘C | 2.25 0.13 | 0.0 36.7 | — |
| HT: 300∘C | -4.17 0.08 | 468.1 8.4 | 0.07 |
| Subtraction | -6.42 0.15 |
In summary, the ES barrier contribution to the curvature-dependent patterning of Ge was determined by subtracting the measured curvature-dependent term for room temperature smoothing from that of high temperature patterning. Compared to the erosive and lateral mass redistribution contributions to the curvature-dependent term, the magnitude of the ES barrier term is considerably larger in magnitude. Within the context of the continuum equation Eq. 2, the ES barrier contribution is primarily responsible for the instability of the crystalline Ge surface. Development of a theoretical formalism linking the measured ES barrier kinetic term to the size of the ES barrier energy in the self-organized ion beam nanopatterning would be a very interesting direction of future research and allow comparison with the existing ES barrier measurement in Ge(001) homoepitaxyShin and Aziz (2007).
This material is based on work partly supported at BU by the National Science Foundation (NSF) under Grant No. DMR-1709380. X.Z. and R.H. were supported by the U.S. Department of Energy (DOE) Office of Science under Grant No. DE-SC0017802. Experiments were performed at the Coherent Hard X-ray (CHX) beamline at National Synchrotron Light Source II (NSLS-II), a U.S. Department of Energy (DOE) Office of Science User Facility operated for the DOE Office of Science by Brookhaven National Laboratory under Contract No. DE-SC0012704. We thank Glenn Thayer and Heitor Mourato of the Boston University Scientific Instrumentation Facility for design and construction of the sample holder.
References
- Moseler et al. (2005) M. Moseler, P. Gumbsch, C. Casiraghi, A. C. Ferrari, and J. Robertson, Science 309, 1545 (2005).
- Madi et al. (2009) C. S. Madi, H. B. George, and M. J. Aziz, Journal of Physics: Condensed Matter 21, 224010 (2009).
- Teichmann et al. (2013) M. Teichmann, J. Lorbeer, B. Ziberi, F. Frost, and B. Rauschenbach, New Journal of Physics 15, 103029 (2013).
- Perkinson et al. (2013) J. C. Perkinson, C. S. Madi, and M. J. Aziz, Journal of Vacuum Science & Technology A: Vacuum, Surfaces, and Films 31, 021405 (2013).
- Anzenberg et al. (2012) E. Anzenberg, J. C. Perkinson, C. S. Madi, M. J. Aziz, and K. F. Ludwig Jr, Physical Review B 86, 245412 (2012).
- Madi et al. (2011) C. S. Madi, E. Anzenberg, K. F. Ludwig Jr, and M. J. Aziz, Physical Review Letters 106, 066101 (2011).
- Sigmund (1973) P. Sigmund, Journal of Materials Science 8, 1545 (1973).
- Bradley and Harper (1988) R. M. Bradley and J. M. Harper, Journal of Vacuum Science & Technology A: Vacuum, Surfaces, and Films 6, 2390 (1988).
- Carter and Vishnyakov (1996) G. Carter and V. Vishnyakov, Physical Review B 54, 17647 (1996).
- Umbach et al. (2001) C. C. Umbach, R. L. Headrick, and K.-C. Chang, Physical review letters 87, 246104 (2001).
- Ou et al. (2013) X. Ou, A. Keller, M. Helm, J. Fassbender, and S. Facsko, Physical review letters 111, 016101 (2013).
- Ou et al. (2015) X. Ou, K.-H. Heinig, R. Hübner, J. Grenzer, X. Wang, M. Helm, J. Fassbender, and S. Facsko, Nanoscale 7, 18928 (2015).
- Norris et al. (2017) S. A. Norris, J. C. Perkinson, M. Mokhtarzadeh, E. Anzenberg, M. J. Aziz, and K. F. Ludwig, Scientific reports 7, 2016 (2017).
- Bobes et al. (2012) O. Bobes, K. Zhang, and H. Hofsäss, Physical Review B 86, 235414 (2012).
- Hofsäss et al. (2014) H. Hofsäss, K. Zhang, and A. Mutzke, Applied Surface Science 310, 134 (2014).
- Mutzke et al. (2019) A. Mutzke, R. Schneider, W. Eckstein, R. Dohmen, K. Schmid, U. v. Toussaint, and G. Badelow, “SDTrimSP Version 6.03,” (2019).
- Norris (2014) S. A. Norris, arXiv preprint arXiv:1410.8489 (2014).
- Norris (2017) S. A. Norris, “Pycraters,” https://github.com/scott-norris-math/pycraters (2017).
- Shin and Aziz (2007) B. Shin and M. J. Aziz, Physical Review B 76, 165408 (2007).