Engineering room-temperature multiferroicity in Bi and Fe codoped BaTiO3
Abstract
Fe doping into BaTiO3, stabilizes the paraelectric hexagonal phase in place of the ferroelectric tetragonal one [P. Pal et al. Phys. Rev. B, 101, 064409 (2020) PPal (2020)]. We show that simultaneous doping of Bi along with Fe into BaTiO3 effectively enhances the magnetoelectric (ME) multiferroic response (both ferromagnetism and ferroelectricity) at room-temperature, through careful tuning of Fe valency along with the controlled-recovery of ferroelectric-tetragonal phase. We also report systematic increase in large dielectric constant values as well as reduction in loss tangent values with relatively moderate temperature variation of dielectric constant around room-temperature with increasing Bi doping content in Ba1-xBixTi0.90Fe0.10O3 (0x0.10), which makes the higher Bi-Fe codoped sample (x=0.08) promising for the use as room-temperature high- dielectric material. Interestingly, x=0.08 (Bi-Fe codoped) sample is not only found to be ferroelectrically (20 times) and ferromagnetically (6 times) stronger than x=0 (only Fe-doped) at room temperature, but also observed to be better insulating (larger bandgap) with indirect signatures of larger ME coupling as indicated from anomalous reduction of magnetic coercive field with decreasing temperature. Thus, room-temperature ME multiferroicity has been engineered in Bi and Fe codoped BTO (BaTiO3) compounds.
I Introduction
Room-temperature ME multiferroic materials are extremely promising for future technological applications NAHill (2000); DKhomskii (2009). In this regard, efforts toward turning BaTiO3 (a strong proper ferroelectric RECohen (1992)) into multiferroic material by Fe BXu (2009); PPal (2020) (or other transition metals like Mn YHLin (2009), Co LBLuo (2009) etc.) doping has attracted a lot of attention. However, the observed multiferroicity in Fe-doped BTO is seen to be of mixed phase kind where the ferromagnetism arises from the majority paraelectric-hexagonal phase and weak ferroelectricity due to a minority tetragonal phase PPal (2020). Thus, in such a case the ME coupling is naturally supposed to be weak due to the independent origin of two ferroic orders at two different structural units. So, the necessity is to stabilize the tetragonal phase, even in this magnetically Fe-doped BTO compound, such that both ferroelectricity and ferromagnetism can emerge from the same tetragonal phase, which may lead to better ME coupling along with pronounced ferroelectricity. It is important to note that for a material to be a potential room-temperature multiferroic, it is desirable to have (a) a strong ferroelectric polarization, (b) a high ferromagnetic remanent moment, (c) a low leakage-current density (i.e. highly insulating) along with (d) ME coupling between the two ferroic-orders NASpaldin (2019).
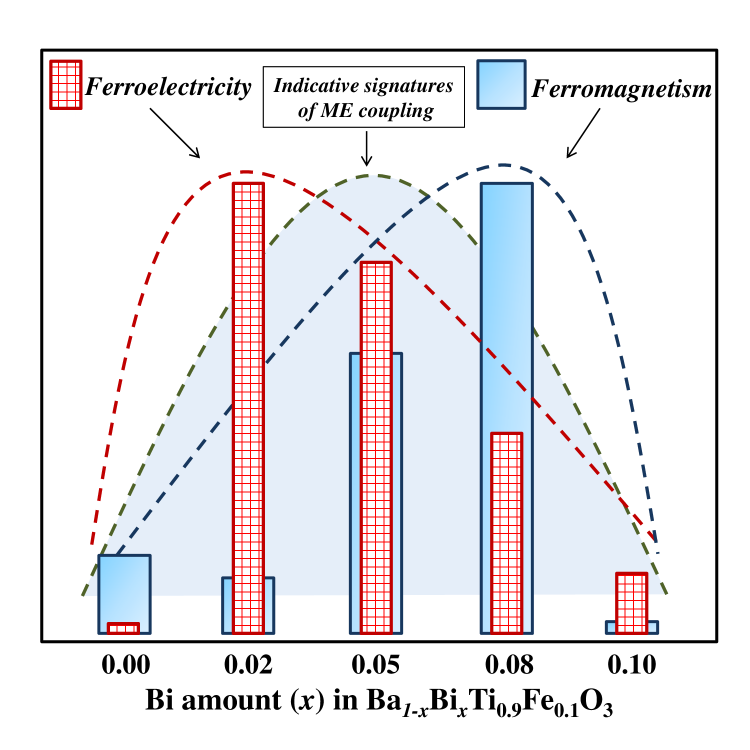
With these goals, we examine polycrystalline Ba1-xBixTi0.90Fe0.10O3 compounds (0x0.10) and show that with increasing Bi doping content not only the paraelectric-hexagonal phase of x=0 (only Fe-doped BTO) gets destabilized (with concomitant recovery of ferroelectric-tetragonal phase), but also there is a surprising and significant enhancement of room-temperature ferromagnetism. Interestingly, we find that the observed ferroelectricity is strongest around x=0.02 and ferromagnetism around x=0.08, while the intermediate x=0.05 shows indirect signature of most robust ME-coupling (see Fig.1).
II Experimental details
All phase pure (related to BTO hexagonal and tetragonal phases only) polycrystalline samples which were prepared via solid state reactions (for details refer to ref.PPal (2020)) were characterized using XRD and Raman measurements. Dielectric and magnetic measurements were performed using a Keysight E4980A LCR meter and SQUID-VSM respectively. Electron Paramagnetic Resonance (EPR) measurements were carried out using Bruker spectrometer. Intrinsic ferroelectric properties have been investigated using ferroelectric PUND (Positive Up Negative Down) and temperature dependent pyroelectric measurements PPal (2020). XANES and XPS measurements were carried out at P-65 beamline in PETRA-III synchrotron source, DESY, Hamburg, Germany and using an in-house PHI 5000 Versaprobe-II spectrometer respectively, while the diffused reflectance spectra were acquired using a Cary 5000 UV-Visible near-infrared spectrophotometer.
III Results and discussions
III.1 Tuning of room-temperature ferroelectricity
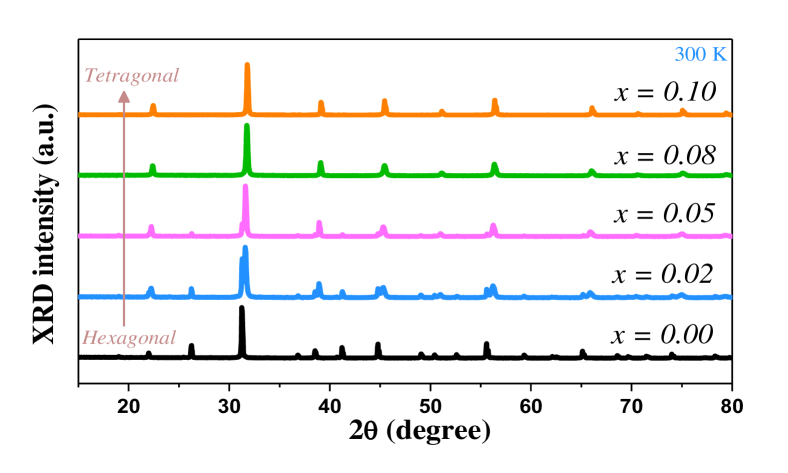
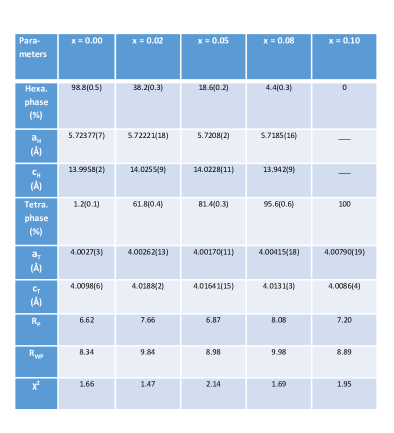
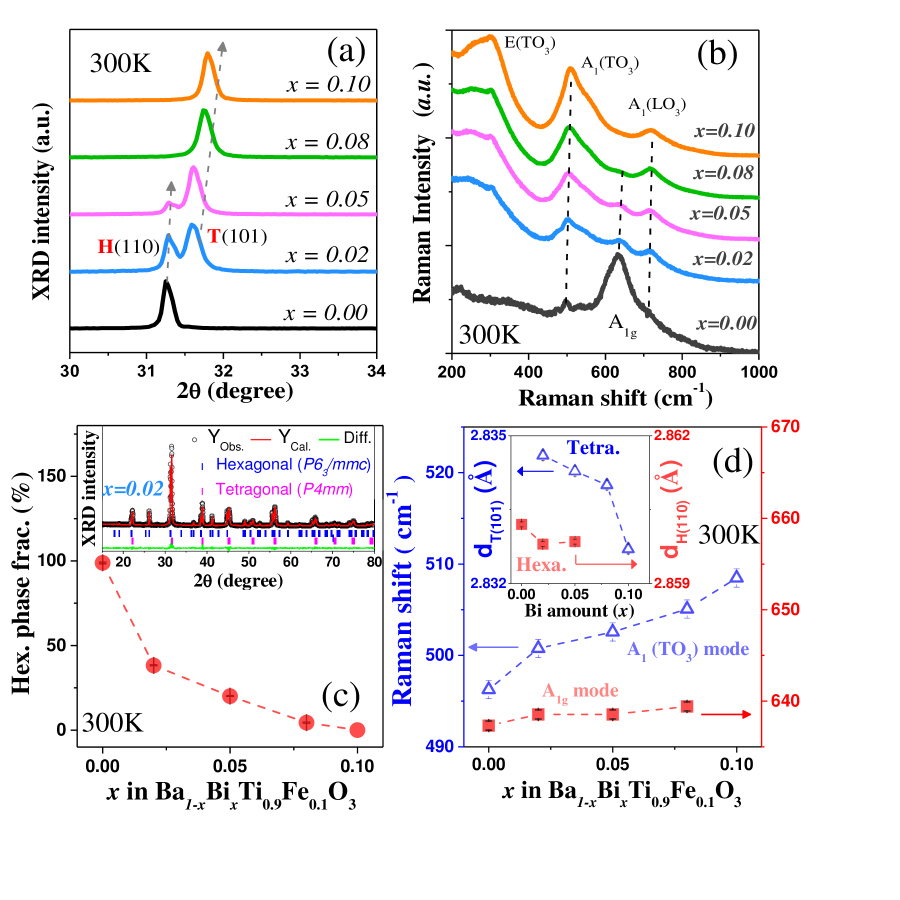
Fig.2(a) covers the 2 range in XRD spectrum which includes the strongest diffraction peaks from the hexagonal [H(110)] and the tetragonal [T(101)] BTO phases [also, note Fig. 6 of the supplementary material section below]. While x=0 crystallizes in the hexagonal phase, with increasing x, the tetragonal phase gets fully recovered as observed from the systematic increase in tetragonal T(101) peak intensity and concomitant decrease in hexagonal H(110) peak intensity DHKim (2016). The XRD observations of tetragonal phase recovery are further validated from Raman spectroscopy as shown in Fig.2(b), where clear evolution of tetragonal Raman modes from the majority hexagonal phase with increasing Bi concentration has been observed CHPerry (1965); HaMNguyen (2011). The amount of hexagonal [shown in Fig.2(c)] and tetragonal phase [shown in Fig.3(b)] fractions present in each of these samples are determined from Rietveld refinement of their room-temperature XRD spectra incorporating both hexagonal (P63/mmc) and tetragonal (P4mm) phases [an example is shown in the inset of Fig.2(c) for x=0.02, for further details note Fig. 7 of supplementary section below]. It is interesting to note that there is strong shifting of the tetragonal T(101) XRD peak to higher angles with Bi doping, however, such is not the case for the hexagonal H(110) as shown in Fig.2(a). Similarly, no significant change in dH(110) [spacing between H(110) planes] is observed beyond x=0.02, whereas dT(101) systematically gets reduced with increasing Bi doping concentration, as shown in the inset to Fig.2(d). The reduction of dT(101) is driven by the substitution of Ba2+ ions by relatively smaller Bi3+ ions. Further, we note the monotonic shifting of the tetragonal Raman A1(TO3) mode towards higher energy with Bi doping, which is, however, not quite prominent in case of the hexagonal Raman A1g mode as shown in Fig.2(d). Thus, both XRD and Raman analyses suggest a maximum doping percentage of Bi at the Ba site of the hexagonal BTO.

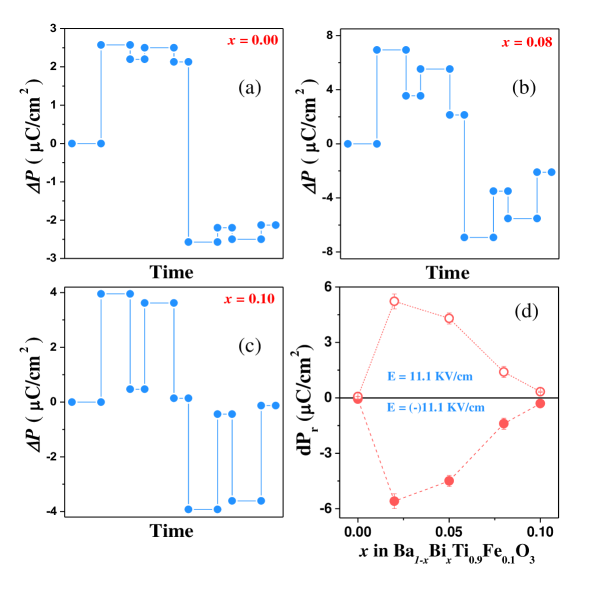
Next, to study the intrinsic ferroelectric properties, we have employed the PUND BRajeswaran (2012); ARChaudhuri (2010) technique (for details see ref.PPal (2020)). In Fig.3(a) we see that from x=0 there is a sudden increase in the ferroelectric polarization value for x=0.02 and then it continues to decrease up to x=0.10 [also, refer to Fig. 8 of the supplementary material below]. However, such nonmonotonic trend of polarization-change can not be understood from the monotonic evolution of tetragonal phase fraction (%) as seen in Fig.3(b). To investigate such a behavior, we have calculated the sample tetragonality (c/a), which is shown in Fig.3(c). Here, we note that the tetragonality, which is found to be maximum for x=0.02, exhibits the same trend as observed for polarization change in Fig.3(a). Therefore, the tetragonality, measure of the amount of Ti-off centric distortion in the corresponding TiO6 cage RECohen (1992) (see Fig. 12 of the supplementary material below), overrides the amount of tetragonal phase percentage present in regards to the observed ferroelectricity in these systems PPal (2020). Such observations were further validated from temperature dependent pyrocurrent measurements (see Fig. 9 and note the discussions in subsection-C of the supplementary material below).
| Sample | Dielectric | Loss (D) | Avg. TCϵ |
|---|---|---|---|
| constant (r) | (ppm/K) | ||
| 300K | 300 K | at (30025)K | |
| SiO2 | 3.7 | 0.0015 | … |
| SrTiO3 | 285 | 0.006 | -2400 |
| BaTiO3 | 1626 | 0.015 | -799 408% |
| x=0 | 37 | 0.027 | -541 8% |
| x=0.05 | 177 | 0.019 | 2358 17% |
| x=0.08 | 785 | 0.008 | 2262 14% |
Now, to have a holistic view, we have plotted the remanent polarization value (dPr) versus sample tolerance factor (which can strongly influence structural instabilities of such perovskite oxides ZLi (2016)) as shown in Fig.3(d), using Fe and Ti valencies determined from the Fe-K edge XANES and XPS spectroscopic studies PPal (2020) (for details, refer to subsections E-G and note Fig. 10 and Fig. 11 of the supplementary material below). Interestingly, there is a window of tolerance factor around which ferroelectric response is optimum in these systems, useful for achieving optimized multiferroic response.
III.2 Bi-Fe codoped BTO: promising as high- dielectric
Interestingly, we find systematic increase in large dielectric constant values as well as reduction in loss tangent values with increasing Bi doping content [see Fig.3(e)], which makes the higher Bi-Fe codoped system (x=0.08) promising for the use as room-temperature high- dielectric material since, it exhibits a unique combination of often contradicted physical properties i.e. very large dielectric constant, extremely low dielectric loss and moderate temperature dependence of dielectric constant values around room-temperature [TCϵ = (1/r) (r/T)] (see table-1) DChoudhury (2010); AIKingon2000 (2000). While undoped BaTiO3 also exhibits a very high dielectric constant and low loss values, but the corresponding TCϵ value changes a lot within 50 K temperature window around room-temperature rendering it unsuitable as a high- dielectric material. Interestingly, the dielectric response of x=0.08 (i.e. higher dielectric constant value, comparable loss and TCϵ values) seems better compared to SrTiO3, very well-known as a high- dielectric material KEisenbeiser (2000).
III.3 Tuning of room-temperature ferromagnetic properties
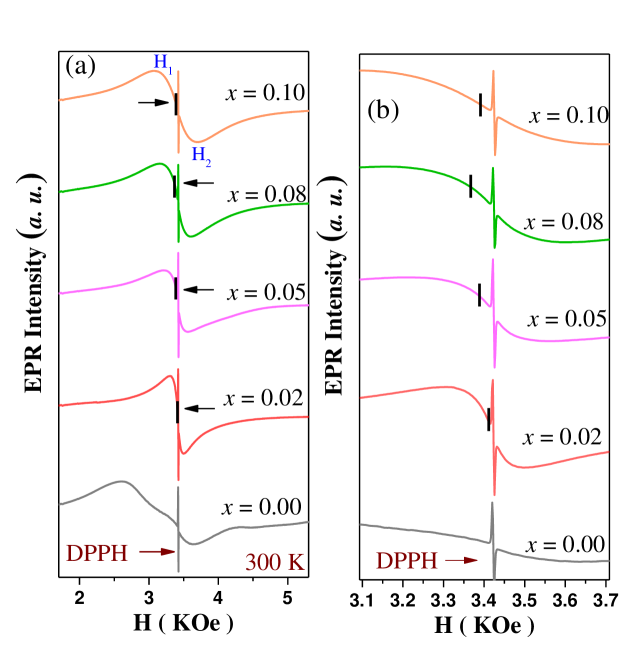
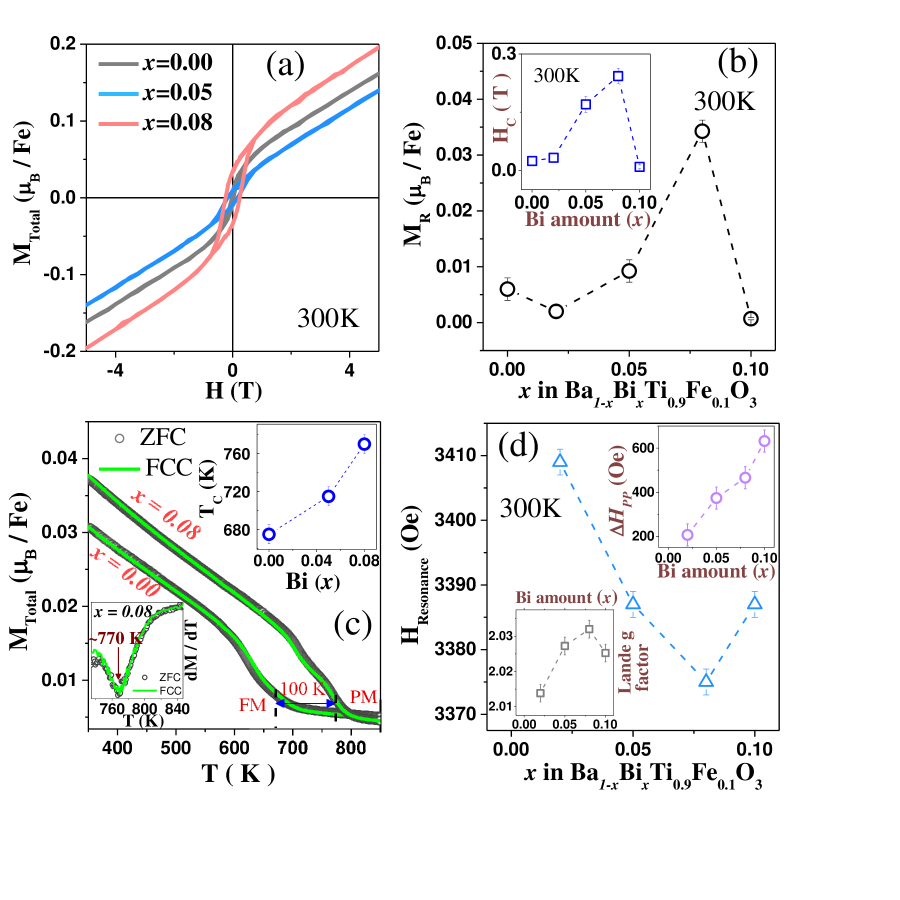
To investigate the magnetic properties, first we discuss the room-temperature MH data as shown in Fig.4(a), which exhibit finite ferromagnetic loops, however do not saturate, indicating presence of some paramagnetic contributions DKarmakar (2007). Thus, we consider the intrinsic ferromagnetic remanent moment (MR) which is seen to monotonically increase from x=0 up to x=0.08 (having 6 times enhanced magnetization) and then decreases for x=0.10 as shown in Fig.4(b). Such a non-monotonic trend is also reflected even in case of coercive field [see inset to Fig.4(b)]. Temperature dependent magnetization measurements display clear ferromagnetic to paramagnetic phase transition and the Curie temperature (TC) [as estimated from dM/dT vs. T plot, shown in the bottom inset to Fig.4(c)] is found to increase systematically with Bi doping concentration as shown in Fig.4(c) and its top inset. To further investigate the above trend of magnetization in the microscopic scale, we employ EPR spectroscopy, which is shown in Fig. 15 (also, note subsection-J) of the supplementary material section, where we see marked changes in line-shape with Bi doping. First, we have determined peak-to-peak line width (HPP) [see top inset of Fig.4(d)], which increases monotonically with Bi doping, indicating increasing Fe-Fe exchange interaction SDBhame (2005); TChakraborty (2011). Subsequently, we see that the resonance magnetic field monotonically decreases up to x=0.08 and then slightly increases for x=0.10. Such observations strongly indicate that the strength of ferromagnetic interaction gets enhanced up to x=0.08, followed by a reduction for x=0.10, possibly due to some antiferromagnetic interaction JGutierrez (2000); SDBhame (2005). Even, the Lande g-factor for all these compounds, as shown in the bottom inset of Fig.4(d), shows similar trend like the remanent magnetization value. Such enhancement of ferromagnetism, however, can not be understood from the frame work of increasing oxygen vacancy content TChakraborty (2011) or increasing hexagonal phase fractions, as both are simultaneously and monotonically reduced with increasing Bi doping concentration PPal (2020). Such trends of magnetic response cannot be understood from the possible presence of any extrinsic contributions, like from BiFeO3, Fe2O3 or Fe3O4 related impurity phases, which, however, could not be detected through detailed XRD analyses, as discussed in the subsection-M of the supplementary material (also, note references JLu (2010); ASTeja (2009); YIshikawa (1957); SAkimoto (1957)). These results suggest an alternative source of ferromagnetism for higher x members beyond the hexagonal BTO phase, that can likely be the tetragonal BTO phase (Fe4+-O-Fe3+, FM superexchange interaction), as beyond some doping limit both Bi and Fe tend to go into the tetragonal phase (for schematic visualization of superexchange, see sub-section I and note Fig. 14 and Fig. 13 of the supplementary material below).
III.4 Enhanced room-temperature multiferroicity in Bi-Fe codoped BTO
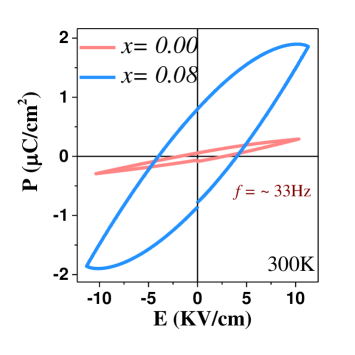
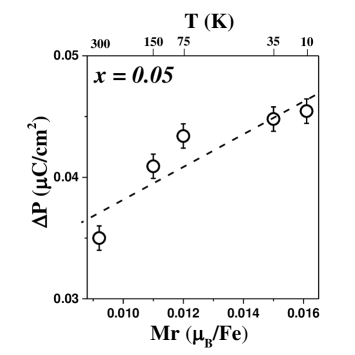
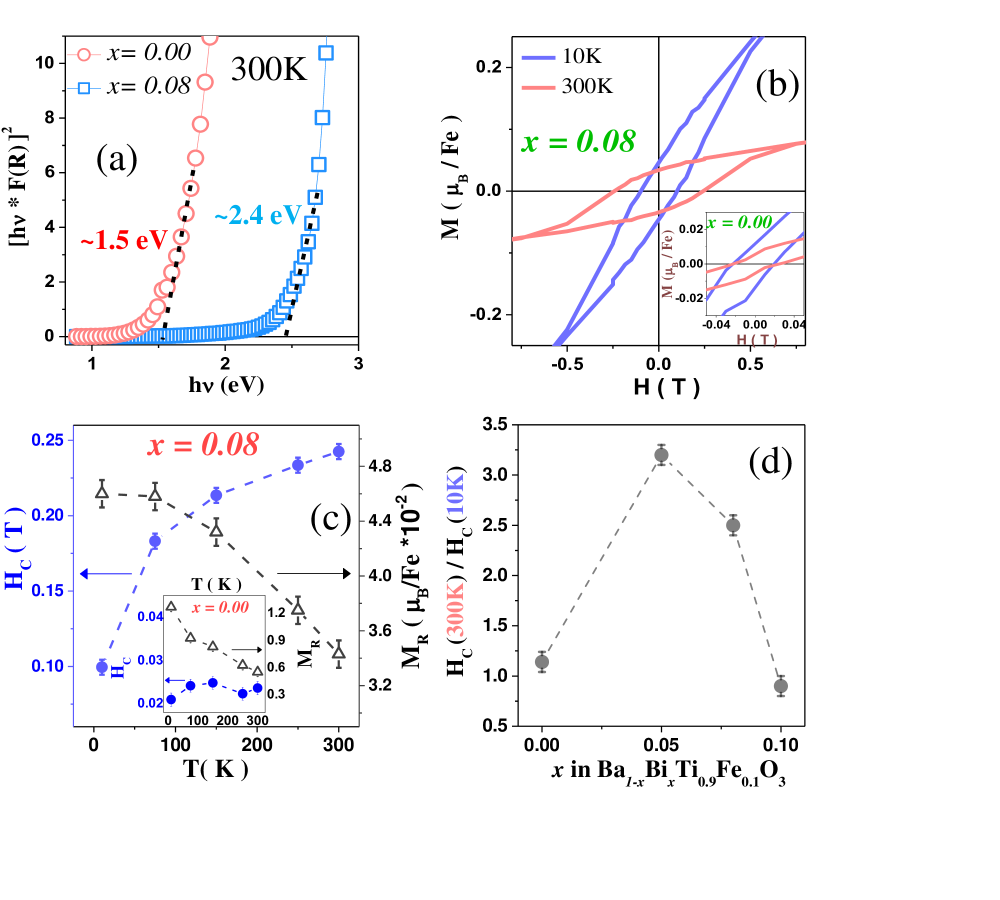
The x=0.08 compound, in addition to possessing 20 times enhanced ferroelectric remanent polarization value compared to that of x=0 (also, evident from their room-temperature PE loops, shown in Fig. 16 of the supplementary material below), is also more insulating than x=0 (the optical bandgap of x=0.08 is greater than that of x=0 as determined from diffused reflectance spectroscopy measurements) as shown in Fig.5(a). Therefore, x=0.08 (Bi-Fe codoped BTO) which is found to have much enhanced ferroelectric, ferromagnetic and insulating properties at room-temperature compared to x=0 (only Fe-doped BTO), is more suitable as a better multiferroic. Fig.5(b) and its inset show isothermal MH plots of x=0.08 and x=0 respectively. The difference in 300 K and 10 K MH curves is more prominent in the former than the later. Variations of their extracted coercive fields (HC) and remanent magnetizations (MR) are shown in Fig.5(c) and its inset. Here, we note that though MR increases on decreasing temperature like an usual ferromagnet XHHuang (2008); VMarkovich (2010); SPatankar (2010), however, the coercive field shows opposite trend. Even, such surprising behavior is stronger in x=0.08 than x=0. It is important to note that such unusual trend of coercive field with temperature has been used as an indicative (indirect) measure of the ME coupling strength in many related ME multiferroic systems NWang (2005); TJPark (2010); BAhmmad (2016). The presence of ME coupling in these compounds also becomes evident from the correlation of the ferroelectric polarization and the spontaneous magnetization at various temperatures, as shown in Fig. 17 of the supplementary material below, similar to that observed in the ME multiferroic 0.9BiFeO3-0.1BaTiO3 system ASingh (2008). Thus, such anomalous temperature dependent variations of magnetic coercivity in our Bi-Fe codoped compounds is likely governed by the competition between magnetocrystalline anisotropy and ME coupling NWang (2005); REFayling (1978); BRuette (2004). The ratio of HC at 300 K to HC at 10 K (the factor of reduction of coercive field), can, thus, be used as an indicative marker for the strength of ME coupling [which is plotted in Fig.5(d)], which, for this series, becomes the strongest for x=0.05 composition, possibly driven by the right appropriate mix of simultaneously large ferroelectric polarization and ferromagnetic moment value, likely within the same tetragonal phase.
IV Summary
In summary, we have investigated room-temperature multiferroic properties of Ba1-xBixTi0.90Fe0.10O3 (0 x 0.10) compounds. By codoping Bi and Fe into BaTiO3, we completely recover the ferroelectric tetragonal phase in the magnetically doped BTO compounds. However, the role of sample tetragonality on the recovered ferroelectricity is found to be stronger. Both macro- and microscopic measurements reveal that intrinsic ferromagnetic property gets enhanced up to x=0.08 with Bi doping, which is followed up by a reduction for x=0.10 due to increased antiferromagnetic interaction. Interestingly, in this series of compounds, though x=0.02 shows highest ferroelectric polarization and x=0.08 shows largest magnetic moment, however, the signature of ME coupling, as indicated from anomalous change of magnetic coercive field with temperature, seems to be strongest in the intermediate x=0.05 due to the simultaneous presence of both ferroelectricity and ferromagnetism in significant amount and likely within the same tetragonal phase. However, it would be interesting to further probe such ME coupling present in these compounds by some direct measurement technique. Thus, simultaneous Bi-Fe codoped BTO compounds around the compositions x=0.05 to x=0.08 are found to exhibit better room-temperature ME multiferroic properties compared to only Fe doped BTO as shown in Fig.1.
V Acknowledgement
We acknowledge the use of XPS under the DST-FIST (India) facility in the Department of Physics, IIT Kharagpur for this work. PP would like to acknowledge the financial support from MHRD, India. DC would like to acknowledge SERB, DST, India (project file no. ECR/2016/000019) and BRNS, DAE (sanction number 37(3)/20/23/2016-BRNS) for financial support. DT would like to acknowledge financial support by DST under the India@DESY collaboration.
References
- (1)
- NAHill (2000) Nicola A. Hill, J. Phys. Chem. B 104, 6694 (2000).
- DKhomskii (2009) D. Khomskii, Physics 2, 20 (2009).
- RECohen (1992) R. E. Cohen, Nature 358, 136 (1992).
- BXu (2009) B. Xu, K. B. Yin, J. Lin, Y. D. Xia, X. G. Wan, J. Yin, X. J. Bai, J. Du, and Z. G. Liu, Phys. Rev. B 79, 134109 (2009).
- PPal (2020) P. Pal, K. Rudrapal, S. Mahana, S. Yadav, T. Paramanik, S. Mishra, K. Singh, G. Sheet, D. Topwal, A. R. Chaudhuri, and D. Choudhury, Phys. Rev. B 101, 064409 (2020).
- YHLin (2009) Y. H. Lin, J. Yuan, S. Zhang, Y. Zhang, J. Liu, Y. Wang, and C. W. Nan, Appl. Phys. Lett. 95, 033105 (2009).
- LBLuo (2009) L. B. Luo, Y. G. Zhao, H. F. Tian, J. J. Yang, J. Q. Li, J. J. Ding, B. He, S. Q. Wei, and C. Gao, Phys. Rev. B 79, 115210 (2009).
- NASpaldin (2019) N. A. Spaldin, and R.Ramesh, Nat. Mater. 18, 203 (2019).
- DHKim (2016) D. H. Kim, and B. W. Lee, J. Korean Phys. Soc. 68, 574 (2016).
- CHPerry (1965) C. H. Perry, and D. B. Hall, Phys. Rev. Lett. 15, 700 (1965).
- HaMNguyen (2011) H. M. Nguyen, N. V. Dang, P. Y. Chuang, T. D. Thanh, C. W. Hu, T. Y. Chen, V. D. Lam, C. H. Lee, and L. V. Hong, Appl. Phys. Lett. 99, 202501 (2011).
- BRajeswaran (2012) B. Rajeswaran, D. I. Khomskii, A. K. Zvezdin, C. N. R. Rao, and A. Sundaresan, Phys. Rev. B 86, 214409 (2012).
- ARChaudhuri (2010) A. R. Chaudhuri, and S. B. Krupanidhi, Solid State Commun. 150, 660 (2010).
- DChoudhury (2010) D. Choudhury, A. Venimadhav, C. Kakarla, Kris T. Delaney, P. Sujatha Devi, P. Mondal, R. Nirmala, J. Gopalakrishnan, N. A. Spaldin, U. V. Waghmare, and D. D. Sarma, Appl. Phys. Lett. 96, 162903 (2010).
- ZLi (2016) Z. Li, M. Yang, J. S. Park, S. H. Wei, J. J. Berry, and K. Zhu, Chem. Mater. 28, 284 (2016).
- AIKingon2000 (2000) A. I. Kingon, J. P. Maria, and S. K. Streiffer, Nature(London) 406, 1032 (2000).
- KEisenbeiser (2000) K. Eisenbeiser, J. M. Finder, Z. Yu, J. Ramdani, J. A. Curless, J. A. Hallmark, R. Droopad, W. J. Ooms, L. Salem, S. Bradshaw, and C. D. Overgaard, Appl. Phys. Lett. 76, 1324 (2000).
- DKarmakar (2007) D. Karmakar, S. K. Mandal, R. M. Kadam, P. L. Paulose, A. K. Rajarajan, T. K. Nath, A. K. Das, I. Dasgupta, and G. P. Das, Phys. Rev. B. 75, 144404 (2007).
- TChakraborty (2011) T. Chakraborty, S. Ray, and M.Itoh, Phys. Rev. B 83, 144407 (2011).
- SDBhame (2005) S. D. Bhame, V. L. J. Joly, and P. A. Joy, Phys. Rev. B. 72, 054426 (2005).
- JGutierrez (2000) J. Gutiérrez, A. Peña, J. M. Barandiarán, J. L. Pizarro, T. Hernández, L. Lezama, M. Insausti, and T. Rojo, Phys. Rev. B. 61, 9028 (2000).
- JLu (2010) J. Lu, A. Günther, F. Schrettle, F. Mayr, S. Krohns, P. Lunkenheimer, A. Pimenov, V. D. Travkin, A. A. Mukhin, and A. Loidl, Eur. Phys. J. B 75, 451 (2010).
- ASTeja (2009) A. S. Teja, and P. Y. Koh, Prog. Cryst. Growth Charact. Mater. 55, 22 (2009).
- YIshikawa (1957) Y. Ishikawa, and S.-i. Akimoto, J. Phys. Soc. Jpn. 13, 1298 (1957).
- SAkimoto (1957) S. Akimoto, T. Katsura, and M. J. Yoshida, J. Geomagn. Geoelectr. 9, 165 (1957).
- XHHuang (2008) X. H. Huang, J. F. Ding, G. Q. Zhang, Y. Hou, Y. P. Yao, and X. G. Li, Phys. Rev. B 78, 224408 (2008).
- VMarkovich (2010) V. Markovich, I. Fita, A. Wisniewski, D. Mogilyansky, R. Puzniak, L. Titelman, C. Martin, and G. Gorodetsky, Phys. Rev. B. 81, 094428 (2010).
- SPatankar (2010) S. Patankar, S. K. Pandey, V. R. Reddy, A. Gupta, A. Banerjee, and P. Chaddah, EPL 90, 57007 (2010).
- BAhmmad (2016) B. Ahmmad, M. Z. Islam, A. Billah, and M. A. Basith, J. Phys. D:Appl. Phys. 49, 095001 (2016).
- TJPark (2010) T. J. Park, G. C. Papaefthymiou, A. J. Viescas, Y. Lee, H. Zhou, and S. S. Wong, Phys. Rev. B. 82, 024431 (2010).
- NWang (2005) N. Wang, J. Cheng, A. Pyatakov, A. K. Zvezdin, J. F. Li, D. Viehland, and T. Wu, Phys. Rev. B. 72, 104434 (2005).
- REFayling (1978) R. E. Fayling, J. Appl. Phys. 49, 1823 (1978).
- BRuette (2004) B. Ruette, S. Zvyagin, A. P. Pyatakov, A. Bush, J. F. Li, V. I. Belotelov, A. K. Zvezdin, and D. Viehland, Phys. Rev. B. 69, 064114 (2004).
- ASingh (2008) A. Singh, V. Pandey, R. K. Kotnala, and D. Pandey, Phys. Rev. Lett. 101, 247602 (2008).
VI Supplementary Material
VI.1 Room-temperature high-resolution XRD spectra (refer to Fig. 6)
VI.2 Details of Rietveld refinement (refer to Fig. 7)
VI.3 Switching of intrinsic ferroelectric remanent polarization as obtained from PUND measurements at room-temperature (refer to Fig. 8)
VI.4 Temperature dependent pyroelectric current measurements (refer to Fig. 9)
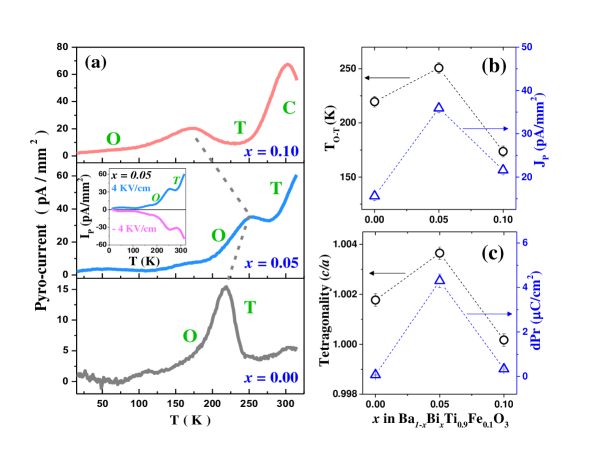
In pyroelectric measurements, samples were first cooled down to 10 K from 315 K under the presence of applied poling-electric field of 4 KV/cm. Then, the electric field was switched off and the electrodes were short-circuited for sufficient time to get rid of any residual surface charge effects. Sample was then heated to room-temperature at a rate of 10 K/min and temperature dependent pyroelectric current data was recorded. Here, in Fig. 9(a) we see that x=0.00 shows ferroelectric-orthorhombic (O) to ferroelectric-tetragonal (T) phase transitions at T 218 K during heating due to the presence of minority ferroelectric tetragonal phase. Now, if we track down this transition for x=0.05 and x=0.10 (shown by the black dashed line) and note down the change in transition temperature (T) as well as pyro-current-density (IP) at that point, we see non-monotonic response (they become maximum for x=0.05 and then again decrease) as shown in Fig. 9(b). Such behavior is, however, readily understood when we compare the remanent polarization values (which corresponds to the pyrocurrent density) and room-temperature tetragonality [which decides the magnitude of orthorhombic to tetragonal phase transition temperature (T)] of these three compounds as shown in Fig. 9(c). It is also interesting to note that the pyro-response in these compounds gets switched on the reversal of applied poling electric field as shown in the inset of Fig. 9(a), which further confirms the intrinsic nature of the observed ferroelectricity in these compounds.
VI.5 Room-temperature Fe K-edge XANES spectra of Ba1-xBixTi0.90Fe0.10O3, 0x0.10 (refer to Fig. 10)
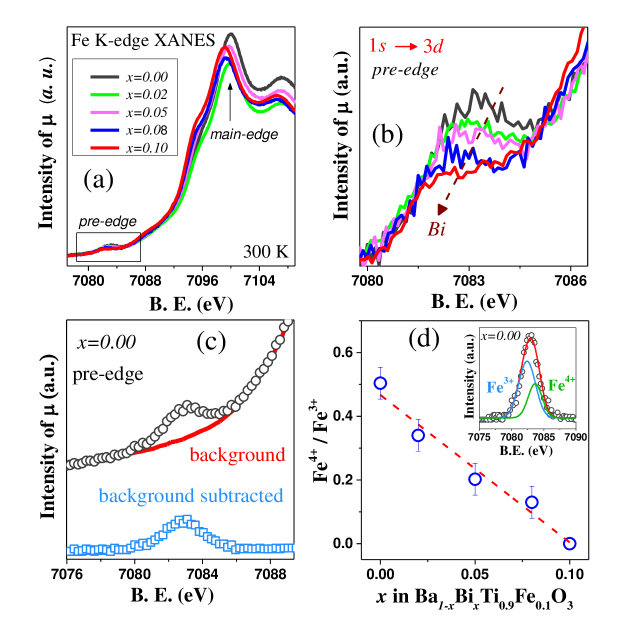
Fe K-edge XANES spectra can be subdivided into two regions; pre-edge region [1s 3d excitation, see Fig. 10(b)] and main edge region (1s 4p excitation). Both features are observed to shift towards lower energy with increasing Bi doping content, which is an indication that Fe valence state steadily decreases from nominal 4+ to 3+. As all these samples are associated with oxygen-vacancies to some extent, there also remains Fe3+. So, to quantify a nominal Fe3+ to Fe3+ ratio, we investigate the pre-edge peak region. The tentative amounts of nominal Fe3+ in these samples are calculated from the background subtraction [see Fig. 10(b)] and subsequent deconvolution of the pre-edge peak into Fe3+ and Fe3+ contributions as shown in the inset to Fig. 10(d).
VI.6 Room-temperature Ti-2p core level XPS spectra of Ba1-xBixTi0.90Fe0.10O3, 0x0.10 (refer to Fig. 11)
VI.7 Tolerance factor calculations of Ba1-xBixTi0.90Fe0.10O3, 0x0.10
Goldschmidt’s tolerance factor which provides an effective and simple way of investigating structural phase stabilities of ABO3 kind of perovskite, can be quantified through the knowledge of ionic radii for a particular coordination number and valence information. Here, we have determined the tolerance factor of all Bi and Fe codoped BTO compounds using Fe valence states derived from XANES and Ti valence state from XPS studies. We have also noted that Ba and Bi remains in their usual valences as observed in XPS (not shown here). The formula for Goldschmidt’s tolerance (GT) factor is given by
| (1) |
Where rA, and rB are ionic radii of the A and B site cations , while rO is that of oxygen anion. Now, as A and B site cations (Ba and Ti) are simultaneously doped by other cations (Bi and Fe), we may rewrite the above equation for the determination of tolerance factor of the compound Ba1-xBixTi0.90Fe0.1-y3+Fey4+O3 (Fe remains in both 3+ and 4+ states).
| (2) |
Where x is the Bi doping concentration and y is the Fe4+ content which is determined from XANES study [see Fig. 10(d)]. We have used the Shanon table for the information of ionic radii of the following ions; Ba2+(XII) = 1.61 Å, Bi3+(XII) = 1.45 Å, Ti4+(VI) = 0.605 Å, Fe3+(VI) = 0.645 Å, Fe4+(VI) = 0.585 Åand O2-(VI) = 1.4 Å, where the bracketed number denotes the corresponding coordination number.
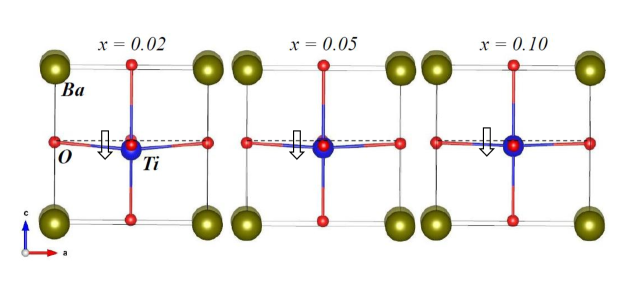
VI.8 Schematic visualization of octahedral distortion of Ba1-xBixTi0.90Fe0.10O3, 0x0.10 (refer to Fig. 12)
VI.9 Schematic representation of the magnetic superexchange interactions in Bi-Fe dual doped BTO compounds (refer to Fig. 13 and Fig. 14)
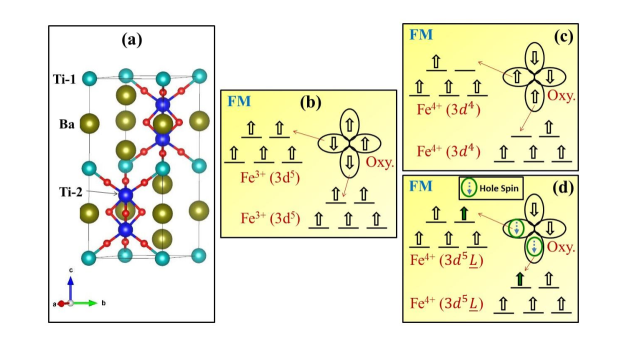
Hexagonal BTO has two different Ti sites as shown in the following Fig. 13(a). Fe ions can substitute both type of Ti ions. Now, the interaction between Fe-1 (Fe replacing Ti-1) and Fe-2 (Fe replacing Ti-2) as well as between Fe-1 ions are very weak and give rise to large paramagnetic background. But interestingly, the interaction between Fe-2 ions are strong ferromagnetic with a Curie temperature of TC600 K. The superexchange interactions possible to give rise ferromagnetism in the hexagonal phase are shown in Fig. 13(b) and (c). Again, two Fe-2 ions show strong tendency to cluster and can have interaction through direct overlap of atomic orbitals.
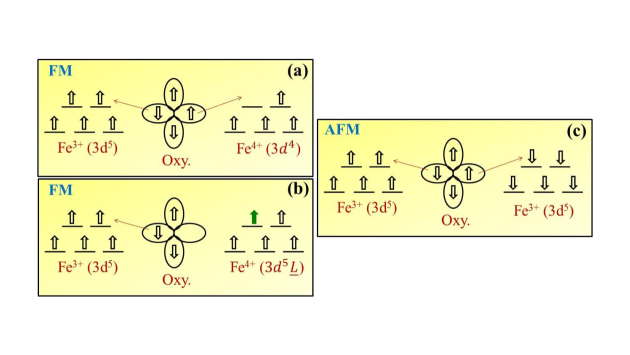
Whereas on the contrary, in the tetragonal BTO phase, the possible exchange that can give rise to ferromagnetism is 1800 superexchange between Fe3+ and Fe4+ ions as shown in Fig. 14(a). As there is only one type of Ti sites in the tetragonal BTO, Fe ions without nearest neighbor other Fe ions can give rise to paramagnetism. Hence, the amount of paramagnetic background in the higher Bi doped samples where majority is tetragonal phase, is smaller than that of the lower or without Bi doped samples, where hexagonality is more. Also, as 1800 ferromagnetic superexchange interaction is much stronger than the corresponding 900 ferromagnetic exchange, higher Bi doped sample exhibits larger magnetic moment as well as higher ferromagnetic TC. However, for x=0.10 where all Fe seems to be in 3+ (3d5) state, major 1800 super exchange interaction is antiferromagnetic as shown in Fig. 14(b). Hence, beyond x=0.08, there is a drop in the magnetic moment for x=0.10 compound.
VI.10 Room-temperature Electron Paramagnetic Resonance (EPR) spectra of Ba1-xBixTi0.90Fe0.10O3, 0x0.10 (refer to Fig. 15)
The following room-temperature EPR spectra shows that while x=0.00 is composed of a broad asymmetric line, possibly consisting of two or more spectra, the rest of the doped compounds rather exhibit more clean and symmetric spectra. Here, the position of resonance magnetic field is calculated by HRes.=(H1+H2)/2, where H1 and H2 are magnetic field values of the maximum and minimum intensity points of the corresponding resonance spectrum. We see that from x=0.02 as Bi doping concentration is increased resonance field value decreases up to x=0.08, and then again increases slightly for x=0.10 as indicated in the following Fig. 15.
VI.11 Room temperature P vs. E loops (refer to Fig. 16)
VI.12 Correlation of ferroelectric polarization and ferromagnetic remanent moment (refer to Fig. 17)
The evidence of magnetoelectric coupling in these Bi-Fe codoped BTO samples is clear from the following plot of polarization vs. remanent magnetization, where we see that there is a correlation between these two ferroic-orders by same way as previously shown in A. Singh et al. Phys. Rev. Lett. 101, 247602 (2008), on a similar kind of 0.9BiFeO3-0.1BaTiO3 system. Here, the temperature dependent polarization is deduced by integrating the pyrocurrent vs. temperature data (shown in Fig. 9) [P=(dt/dT)(JP dT), in our case dt/dT was 0.1 sec/K] and remanent magnetization was obtained from isothermal MH measurements at those corresponding temperatures. Thus, these Bi-Fe doped BTO compounds are promising for room-temperature magnetoelectric-multiferroicity.
VI.13 Role of extrinsic effects on the observed magnetism
Contributions from extrinsic impurity phases to the observed magnetic response have often been observed in dilute magnetic semiconductor systems. Here, we have, thus, tried to analyze any possible magnetic contributions from possible impurity phases (like BiFeO3, Fe2O3, FeTiO3 and Fe3O4) in our Bi-Fe co-doped BTO samples. Notably, from room-temperature high-resolution x-ray diffraction (XRD) and micro-Raman spectroscopy we could not detect any impurity phases in our Bi-Fe dual doped BTO compounds. Further, as detailed below, the trend observed in our magnetic data cannot be understood from the presence of trace quantities of any such possible impurity phases, which could have gone undetected in our detailed structural investigations.
BiFeO3: It has a paramagnetic to antiferromagnetic phase transition temperature at TN 645 K. From our results, we see that x=0.00 (BaTi0.9Fe0.1O3) has a transition temperature TC 675 K, but as there is no Bi ion in these compound, there cannot be any role of BiFeO3 to the observed magnetic response. Further, for higher Bi doped sample such as x=0.08 (Ba0.92Bi0.08Ti0.9Fe0.1O3) TC is 770 K, much higher than that of BiFeO3. So, the contribution of BiFeO3 in the Bi-Fe dual doped BTO compounds is further ruled out.
Fe2O3 or Fe3O4:Fe2O3 (hematite) has a Neel temperature 950 K, which is much higher than the observed magnetic transition in our samples, so its contribution to the observed magnetic response can be ruled out. Fe3O4 has a paramagnetic to ferromagnetic phase transition around 850 K, which again is much higher than the highest transition temperature (770 K) observed for x=0.08 (Ba0.92Bi0.08Ti0.9Fe0.1O3) in our Bi-Fe dual doped BTO system. Thus, any contribution of Fe3O4 impurity phase to the observed magnetic response can also be ruled out.
Fe2O3-FeTiO3 solid solution (Ti doped Fe2O3): While both Fe2O3 and FeTiO3 are antiferromagnetic (TN 65 K for FeTiO3), in their solid solution yFe2O3–(1-y)FeTiO3, as y (Fe2O3) content is varied, the magnetization value goes through a maximum value in the composition range between y=0.20 to y=0.30. The corresponding ferrimagnetic transition temperatures for y=0.20 and 0.30 compositions is in the 250 K - 350 K range. In the Bi-Fe dual-doped BaTiO3 series, while the magnetization value peaks around x=0.08 composition, the corresponding magnetic transition temperature is much higher (770 K), which cannot be accounted using an impurity magnetic phase arising from a solid-solution between Fe2O3 and FeTiO3.
Fe3O4 –FeTi2O4 solid solution: In Fe3O4 –FeTi2O4 (FeFe2-xTixO4) solid solution, with decreasing Ti concentration, both Curie temperature as well as saturation magnetization monotonically increases. This is clearly inconsistent with the non-monotonic dependence of magnetization value observed with progressive Bi doping in our samples.