pnasresearcharticle \leadauthorKeefer \significancestatementThe capabilities of modern x–ray sources have substantially increased the temporal and spectral resolutions for the observation of elementary molecular events. Theoretically, it has been demonstrated that these unique features can be exploited to probe vibronic coherences that emerge when molecules pass through conical intersections. Here, we demonstrate this technique for the photorelaxation of the RNA-nucleobase uracil after UV excitation. The generated coherence maps reveal the path of the nuclear wavepacket on the excited state surface in the vicinity of the conical intersection. This information is directly accessible from the spectroscopically recorded signal. Being transferrable to other molecules, these coherence maps will provide detailed visualizations of non-adiabatic passages in the future. \authorcontributionsD.K. and S.M. designed the project. D.K. performed quantum dynamics, and calculated the polarizability, signals and Wigner spectrograms. T.S. computed the non-adiabatic couplings. D.K. and S.M. analyzed and interpreted the results, and wrote the manuscript with critical input from T.S. and R.d-V.R. All authors were involved in the scientific discussion of the results and the paper. \authordeclarationThe authors declare no conflict of interest. \correspondingauthor1To whom correspondence should be addressed. E-mail: smukamel@uci.edu
Visualizing Conical Intersection Passages via Vibronic Coherence Maps Generated by Stimulated Ultrafast X–Ray Raman Signals
Abstract
The rates and outcomes of virtually all photophysical and photochemical processes are determined by Conical Intersections. These are regions of degeneracy between electronic states on the nuclear landscape of molecules where electrons and nuclei evolve on comparable timescales and become strongly coupled, enabling radiationless relaxation channels upon optical excitation. Due to their ultrafast nature and vast complexity, monitoring Conical Intersections experimentally is an open challenge. We present a simulation study on the ultrafast photorelaxation of uracil, which demonstrates a new window into Conical Intersections obtained by recording the transient wavepacket coherence during this passage with an x–ray free electron laser pulse. We report two major findings. First, we find that the vibronic coherence at the conical intersection lives for several hundred femtoseconds and can be measured during this entire time. Second, the time-dependent energy splitting landscape of the participating vibrational and electronic states is directly extracted from Wigner spectrograms of the signal. These offer a novel physical picture of the quantum Conical Intersection pathways through visualizing their transient vibronic coherence distributions. The path of a nuclear wavepacket around the Conical Intersection is directly mapped by the proposed experiment.
keywords:
x–ray stimulated raman conical intersections vibronic coherences ultrafast dynamicsThis manuscript was compiled on
The absorption of visible or ultraviolet photons, be it naturally or through artificial light fields, brings molecules into an electronically excited state. Through a variety of mechanisms, the excess energy is either re-emitted though fluorescence, dissipated to some environment, or processed in a photochemical reaction. Ultrafast and radiationless relaxation mechanisms back to the electronic ground state are enabled by Conical intersections (1, 2). These are ubiquitous regions on the excited state nuclear landscape of molecules, where the energies of two or more states become degenerate. The electronic and nuclear degrees of freedom are then strongly coupled, leading to the breakdown of the adiabatic Born-Oppenheimer picture. Upon optical excitation, an evolving nuclear wavepacket (WP) can cross into a lower electronic state, if CoIns are within reach. Prominent examples where this process principally determines the outcome of a photochemical process include the primary event of vision (3), and the ability of nucleobases as the building blocks of the genetic code to repair the damage of UV radiation (4).
The existence of CoIns is widely accepted based on simulations, yet has so far eluded direct experimental observation. Indirect experimental evidence for CoIns is usually based on the observation of ultrafast internal conversion rates via electronic state population dynamics (3, 5, 6). Different approaches for visualizing CoIns introduced recently include Coulomb Explosion Imaging (7), multidimensional approaches (8, 9) or Ultrafast Electron Diffraction (10). The decisive impact of CoIns on textbook examples of ultrafast dynamics, like the ring-opening of 1,3–cyclohexadiene (11), has been revealed with unprecedented precision. A novel access to CoIn detection has been enabled recently by the emergence of coherent XUV and x–ray sources (12, 13, 14, 15, 16, 17, 18). Their unique temporal and spectral profiles can access faster timescales and wider energy windows for spectroscopic measurements (19).
Here, we show how free electron lasers can be used to monitor CoIn dynamics of the RNA-nucleobase uracil in great detail. A hybrid combination of phase-controlled attosecond (as) and fs x–ray pulses is used to probe the non-adiabatic passage via a stimulated Raman process. A vibronic coherence is generated at the CoIn, which shows up in the signal and its phase at specific Raman shifts, and offers a novel window into the quantum dynamics at these points. The recorded signal reveals the time-resolved distribution of energy splittings of the vibronic states, which provides unique fingerprints of the CoIn pathway. The resulting ultrafast vibronic coherence maps reflect the exact electron/nuclear eigenstates and are independent of any basis set. Spatially localized nuclear WPs offer a sensitive probe for the energetic topology variation across the CoIn. This spectroscopic access to the WP coherence at the CoIn reveals surprising features, with implications for the observation and control of CoIn processes.
X–Ray TRUECARS Signal of the Uracil Conical Intersection
To spectroscopically monitor the uracil CoIn passage, we use the TRUECARS technique (12) that employs a stimulated Raman process induced by a hybrid narrowband and a broadband x–ray pulse. Originally introduced for an ideal model system (12), here we use a realistic ab-initio molecular Hamiltonian, which we describe in the following.
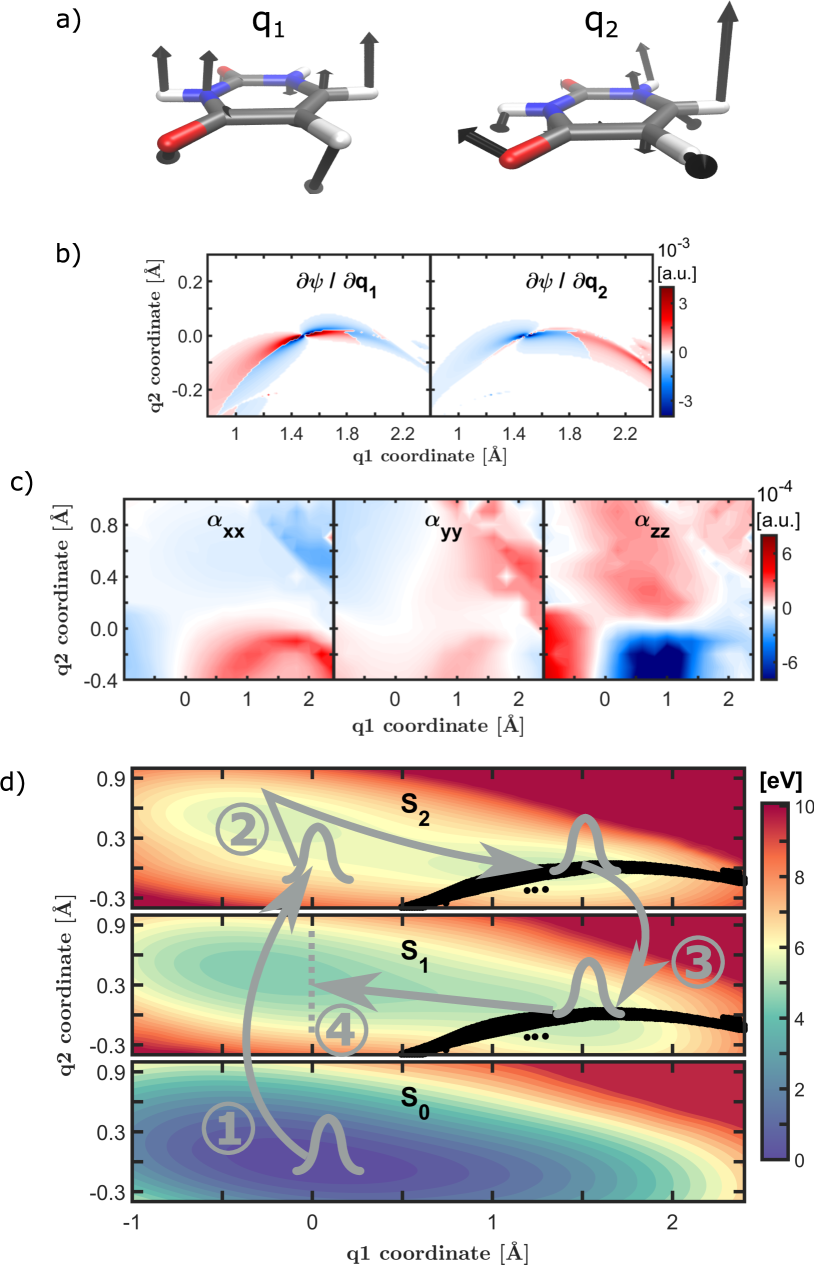
The two nuclear degrees of freedom that span the relevant coordinate space (Fig. 1a)) have been constructed from structures that were found to be important in uracil S2 photorelaxation (20, 21), and have originally been described in (20). The first coordinate describes the motion from the Franck-Condon (FC) to the CoIn, and is mainly an out–of–plain motion of the initially planar ring structure. The second coordinate represents the motion from the FC to a local energetic minimum in the S2 state, and describes the bending of one Hydrogen atom out of the ring plane. The excited state potential energy surfaces in this 2D nuclear space are displayed in Fig. 1d), and have been shown to reproduce experimental kinetic rates following optical excitation (20, 21). This reduced-dimensional space has been verified by higher-dimensional treatments (20). The non-adiabatic couplings that are necessary to simulate the passage of the nuclear WP through the CoIn are displayed in Fig 1b). They exhibit a smooth variation with nuclear coordinates, with the characteristic sign change due to the switching of electronic character of the adiabatic states. With the PESs and the NACs, nuclear WP simulations were launched by exactly solving the time dependent Schrödinger equation (TDSE) for our effective Hamiltonian. The full protocol is given in the method section. The nuclear dynamics is launched using a 34 fs full width at half maximum (FWHM) Gaussian laser pump in resonance with the S0 S2 transition, as was done experimentally (21). The path of the WP is drawn in Fig. 1d). After excitation to the S2 state, and following a free S2 evolution period, the WP reaches the CoIn around 100 fs. Here, a vibronic coherence between the S2 and S1 electronic state is created due to the nuclear WP relaxing through the CoIn. Both electronic states are now populated, and the overlap integral of the S2 and the S1 nuclear WP becomes finite. This coherence is probed by the TRUECARS signal. The WP parts that reach the S1 state evolve away from the CoIn toward the energetic minimum. There, it is absorbed by using a Butterworth filter (22), preventing the WP from oscillating through the S1 minimum and evolving back to the CoIn region. Our coordinate space is tailored to describe the S2 evolution, and does not accurately capture WP evolution in the S1 far from the CoIn, as other nuclear degrees of freedom start to become important. For example the exit-channel for the WP to further CoIns with the S0 state is not included. Back-evolution of the WP to the CoIn region should therefore lead to artifacts in the coherence, and absorbing the WP in the S1 minimum should describe reality more accurately.
The obtained enters the expression for the frequency-dispersed TRUECARS signal (12) of the S2 S1 transition
| (1) | ||||
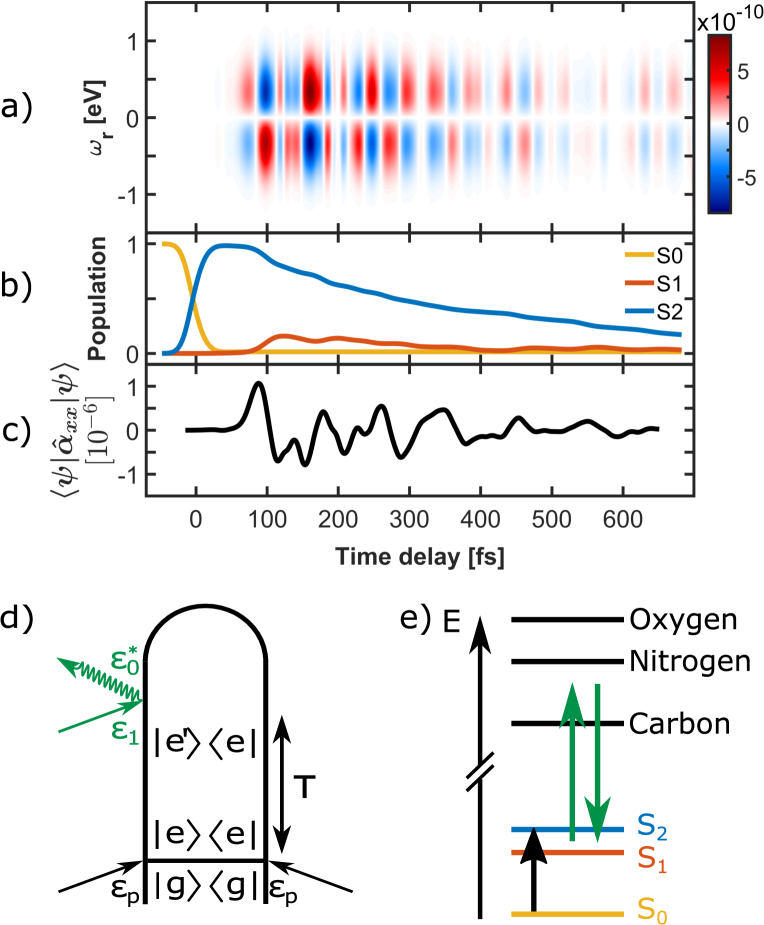
and are the broadband 2 fs and narrowband 500 as x–ray fields, is the electronic polarizability operator, stands for the imaginary part, and is the delay between the optical pump and the x–ray probe fields. Applied to the S2/S1 intersection, the loop diagram and level scheme of the signal are drawn in Fig. 2. An optical UV pump pulse creates a population in the S2 state. Following a free evolution period, a coherence between S2 and S1 (denoted and in Fig. 2d)) is created at the CoIn. This coherence is probed at the instantaneous time T by the hybrid x–ray pulse configuration. As sketched in Fig. 2e), they are tuned to be off–resonant with any valence–to–core transition, and their wavelength is at 354 eV between the Carbon and Nitrogen core absorption edges.
The time-dependent polarizability in Eq. (1) is the relevant material quantity that results from the wavepacket dynamics. In matrix form, it reads
| (2) |
The diagonal elements and are the S2 and S1 electronic state polarizabilities, and the off-diagonal elements are the transition polarizabilities between them. All elements are operators in the nuclear space. When taking the imaginary part in equation (1), population terms do not contribute to the signal, and and can be set to zero. This is an important feature of TRUECARS, that makes it a background-free probe of vibronic coherences that in our model only exist in the CoIn vicinity. Since the electronic state populations are larger than the coherence by around three orders of magnitude, the latter would be masked in more conventional transient Raman probing schemes. The hybrid narrowband/broadband x–ray pulse configuration used in TRUECARS provides the necessary temporal and spectral profiles to capture the energy splitting of the S1 S2 superposition, and the time resolution to resolve the ultrafast coherences. This is not accessible with visible pulses.
Each element of is a second-rank tensor with x, y and z Cartesian components in the molecular frame:
| (3) |
Depending on the orientation of the molecule and the pulse configuration, a certain component of Eq. 3 is selected. In general, each component of can be calculated according to (23, 24):
| (4) |
Here, and are the Cartesian and components of the dipole operator in the molecular frame. The summation is over all core-hole states , is the energy difference between valence state and the core state , and = 354 eV is the carrier frequency of the probe field taken between the carbon and nitrogen K-edges (see Fig. 1). Considering an off-resonant x–ray core process between valences states and , the summation in eq. 4 should be over all core-hole states . The key quantities in this equation are the transition dipole moments between valence and core states, where is the -component of the dipole operator. In this work, we calculated all Cartesian components of the dipole moments between the valence S1 and S2 states on the multireference level of quantum chemistry (see methods) by including 80 core-hole states. Uracil has 8 non-Hydrogen atoms, and we included the first 10 core-hole states of each atom. Dipole moments were calculated at the 2D nuclear coordinate space on 270 grid points, with subsequent interpolation of the surfaces to the grid for WP simulations. Exemplary S2/S1 transition polarizability surfaces at are drawn in Fig. 1c). They show a pronounced structure along the nuclear coordinates, and the change of electronic character is clearly visible at the CoIn seam.
The TRUECARS signal of the S2 S1 transition displayed in Fig. 2 exhibits some striking features. At the CoIn, a vibronic coherence is created and time-dependent material quantity, i.e. the polarizability expectation value according to Eq. 2, becomes finite as well. A signal shows up and remains visible for several hundred fs, until the vibronic coherence decays. This long-lived vibronic coherence is due to the delocalized nature of the quantum nuclear WP on the S2 surface. Tails of the WP continue to reach the CoIn, and even with an instant exit-channel for the WP in the S1 state, the coherence survives for several hundred fs. This has profound implications for the observation and control of quantum events at CoIns. The vibronic coherence, that determines the outcome of the photophysical process, is long-lived and its monitoring will require longer temporal windows rather than precise timings for molecules like uracil. Note that Fig. 1 shows the signal with the component of the polarizability, which would require oriented molecules. However, the signal can be measured for other orientations as well.
The Time-Resolved Vibronic Frequency Map across the Conical Intersection
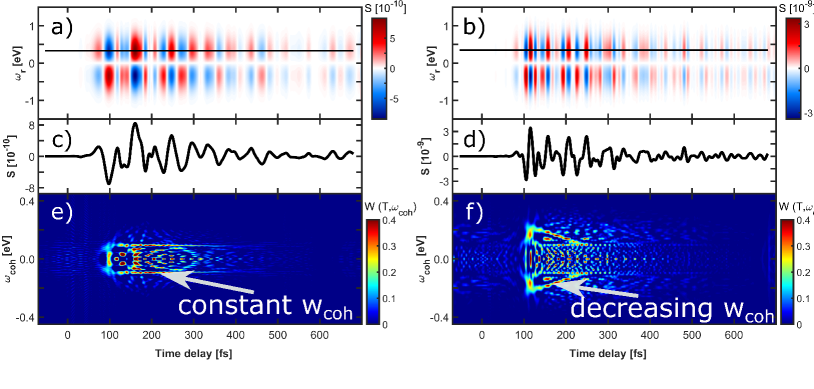
The signal depicted in Fig. 2a) exhibits temporal Stokes and Anti-Stokes oscillations between positive (red) and negative (blue) values. This is because the contributing vibronic states have different frequencies, and the dynamical phase evolution is contained in the signal. To display the time dependent frequency map, we show in Fig. 4 the Wigner spectrogram of a temporal trace of the signal (Fig. 4b) at a fixed Raman shift :
| (5) |
The 0 to 0.2 eV frequency window spanned by represents the potential energy splitting of the CoIn where the vibronic coherence is located. The main 0.1 eV feature (marked with the white arrow in Fig. 4e)) exhibits no temporal variation of . The contributions visible in the Wigner spectrogram map the vibronic frequencies that contribute to the coherence. Unlike in classical simulations, the complete set of eigenstates is time–independent in our effective Hamiltonian. At all times, the quantum nuclear WP can be expressed as a superposition of the vibronic eigenstates, where usually many them contribute. The Wigner spectrogram reveals the dominating contributions to the coherence. Stated differently: When the nuclei are treated as classical, the system has a well-defined, time–dependent energy splitting which vanishes at the conical intersection. In the quantum treatment, this is replaced by a distribution of energy splittings given by the wavepacket frequencies. The average of that distribution serves as the effective splitting.
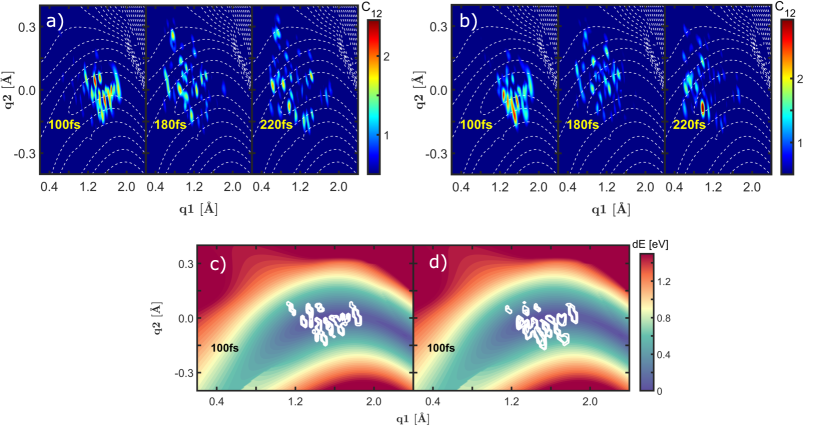
To extend this analysis even further, we had reduced the a 34 fs FWHM optical Gaussian pump to 20 fs, as shown in the right column of Fig. 4. The WP is now more localized in the S2 PES, which strongly influences the coherence. While there is no change in the Raman shift of the signal, the temporal oscillations are now much faster, so that the frequency regime covered by the vibronic coherence is broader in Fig. 4f). More importantly, the energy position of the main feature (marked with the white arrow) does vary with time. Starting at around 0.2 eV at 100 fs, the coherence evolves to lower frequencies until around 250 fs, where it eventually decays. This spectrogram directly maps the distribution of vibronic excitations along the CoIn path, as revealed by the WP coherence, and illustrated in Fig. 5. Representative snapshots of the normalized WP coherence at 100 fs, 180 fs and 220 fs are shown in Fig. 5. For the 34 fs pump, the coherence is indeed initially mainly located at energy splittings between 0 eV and 0.2 eV, and delocalizes with time. The position and spread of the coherence in the nuclear phase space is determined by the WPs in S2 and S1 . A delocalized coherence does not mean it is lost or has dispersed, it is simply spread over a larger region on the PES. In this context, decoherence means that the coherence magnitude, integrated over the nuclear degrees of freedom, decays. This is independent of whether the coherence is local (e.g. at the CoIn), or spread over a larger region.
Using the 20 fs pump (Fig. 4b), d) and f), the main initial coherence at 100 fs is at higher frequencies. After a short delocalization period, the coherence again becomes localized at 220 fs, and shows lower frequencies than at 100 fs. This again corresponds to the position of the vibronic coherence in the nuclear space, depicted in Fig. 5. In Fig. 5a) and b), the WP overlap is drawn as the colored contour plot, while the S2 S1 energy difference is represented by the isolines. This shows the more local coherence of the 20 fs pump WP in contrast to the 34 fs one at 100 fs and 220 fs propagation time. To better identify the range of energy splitting which is spanned by the coherence, and that this corresponds to the main feature in the Wigner spectrograms in Figs. 4e) and f), the plotting scheme is inverted in Fig. 5c) and d). Here, the WP overlap is drawn in isolines, while the S2 S1 energy splitting is shown with a colored contour plot. The snapshots at 100 fs are shown for both probing schemes, and it can be seen that the WP overlap is located at higher energy splittings in Fig. 5d) (20 fs pump) than in Fig. 5c) (34 fs pump). The transient pathway of the vibronic WP coherence is directly accessible from the recorded signal. While we used an adiabatic basis here, the WP simulations in the 2D nuclear space of our 2D model Hamiltonian are exact, and therefore independent of the electronic basis. Thanks to the quantum treatment of the nuclei, the time-resolved frequency map in the Wigner spectrogram is an experimental observable, independent of the basis set used, and reveals the exact vibronic state landscape across the CoIn path.
Summary
Our study offers a novel window into ultrafast non-adiabatic transitions at CoIns. The frequency, phase and duration of the vibronic coherence, created by the quantum nuclear WP evolution, is monitored in real time. Contrary to the common picture of precisely timed CoIn events, the coherence remains visible for several hundred fs. This is due to the delocalized nature of the quantum nuclear WP in the S2 state after photoexcitation, where small tails consecutively reach the CoIn. The coherence that is built decays due to the S1 WP evolving away from the CoIn toward the minimum, but it is constantly rebuilt by other parts arriving at the CoIn in the S2 state. Localized nuclear WPs provide a sensitive scan of the frequency landscape surrounding the CoIn. The magnitude and range of the energy splitting of the participating adiabatic vibronic states can be read directly from the signal. No further theoretical input is necessary to access this information from the signal. Uracil photorelaxation is experimentally accessible, and all quantities are produced at the fully ab-initio level. The presented Wigner spectrograms offer a novel physical picture of CoIn processes by picturing them through the complex coherence distributions rather than a change in absorption lines or a single vanishing energetic gap.
The off-resonant probing scheme employed here with respect to core excitations renders the signal ubiquitous and translatable to other molecules with a non-vanishing dipole transition between a CoIn valence state and other core-hole states. Monitoring the vibronic coherence provides a unique window how the outcome of ultrafast photophysical processes are decided. This insight is also beneficial for developing approaches for controlling photochemical reactions by modulating this coherence (26, 27, 28). An important step towards phase-controlled XUV/x–ray pulses, that are necessary to record the stimulated Raman signal, was made very recently (29), and our proposed experiment lies within the capabilities of state of the art x–ray sources (30, 31). Altogether, the reported novel spectroscopic maps of CoIn passages provide direct access to the quantum WP pathways in CoIn passages, which opens the door for a deeper understanding and better control of these ubiquitous processes.
Quantum Chemistry
The computation of the PESs and dipole moments for the adiabatic states was described in Ref. (20). This was done at the CASSCF/MRCIS level, using an active space of 12 electrons in 9 orbitals (5 , one Oxygen lone pair, and 3 orbitals). For the present study, we had recalculated the NACs taking into account the phase of the electronic wavefunction. This was done at the CASSCF level and the same (12/9) active space, using the program package MOLPRO (32). A wavefunction file was created containing the selected active space. Using a fine spacing around the CoIn, this wavefunction file was read in for all other NAC calculations, to guarantee that the sign of the electronic wavefunction remains the same in all structures. The resulting NACs are shown in Fig. 1b).
To compute the polarizabilities in Eq. 4, the same active space and level of theory was used with the 6-311G* basis set (33, 34) to calculate 80 core-hole states. Uracil has 8 non-Hydrogen atoms, and we included the first 10 core-hole states of each atom. Dipole moments between the valence S1 and S2 states to these core states were calculated at the 2D nuclear coordinate space on 270 grid points, with subsequent interpolation of the surfaces to the 256x256 grid for WP simulations. Within one calculation, first the valence states were calculated using the (12/9) active space. Then, the lowest energy orbital in the active space was rotated for an s-Orbital of one of the C, N or O cores. This orbital was then frozen, single occupation in this orbital was enforced, and the first 10 excited states were calculated. Afterwards, the spatial components of the dipole operator were calculated between the two valence and 10 core states. This results in a total data set of dipole moments.
Wavepacket Simulations
To model the photophysics of uracil, nuclear WP simulations were performed by solving the TDSE
| (6) | ||||
with the kinetic energy operator of the nuclei in internal coordinates , the potential energy operator , and the light-matter interaction in the dipole approximation with the dipole operator and the electric field . Our model Hamiltonian space has two nuclear degrees of freedom and three electronic states. The WP simulation setup has been described and used in Ref. (20).
All quantities are represented on a two-dimensional 256x256 spatial grid. The two nuclear coordinates and are selected from molecular structures that are known to play an important role in uracil S2 photorelaxation: The FC, a local S2 minimum, and the optimized conical intersection to the S1 state. is the normalized displacement vector that points from the FC to the CoIn. is the displacement vector from FC to the local S2 minimum, which is then orthonormalized to S1 . (20) Numerical propagation using the adiabatic PES basis and a nuclear grid is performed by integrating the TDSE according to
| (7) |
The evolution operator is expanded in a Chebyshev series according to Ref. (35), using a time step of 2 a.u. . The kinetic energy operator in internal coordinates and is set up according to the G-Matrix formalism (36) as described in Ref. (37).
| (8) |
with the G-Matrix computed via its inverse elements
| (9) |
i.e. via finite differences by displacement of the Cartesian molecular geometry along the internal coordinates. In case of the uracil coordinates described above, the G-Matrix elements are a.u., a.u., and the kinetic coupling a.u. .
A Butterworth filter (22) was employed in the electronic S1 state, which absorbs the parts of the WP that reach the S1 minimum. The filter was of "right-pass" type (absorbing all parts on the lef side of the border), and placed at Å with an order of 100 (22). This was done to create an exit channel for the WP, which otherwise would move back to the CoIn region after being relaxed from there
We gratefully acknowledge the support of the U.S. Department of Energy, Office of Science, Office of Basic Energy Sciences under Award DE-FG02-04ER15571, and of the National Science Foundation through Grant No. CHE-1953045. S.M was supported by the DOE grant. D.K. gratefully acknowledges support from the Alexander von Humboldt foundation through the Feodor Lynen program, and from the continued support of the Dr. Klaus Römer foundation. We thank Bing Gu, Stefano Cavaletto and Jérémy Rouxel for clarifying and helpful technical discussions, and Markus Kowalewski for providing his QDng quantum dynamics code.
References
- (1) DR Yarkony, Diabolical conical intersections. \JournalTitleReviews of Modern Physics 68, 985–1013 (1996).
- (2) W Domcke, DR Yarkony, H Köppel, Conical Intersections, Advanced Series in Physical Chemistry. (WORLD SCIENTIFIC) Vol. 17, pp. i–xiii (2011).
- (3) D Polli, et al., Conical intersection dynamics of the primary photoisomerization event in vision. \JournalTitleNature 467, 440–443 (2010).
- (4) T Schultz, et al., Efficient Deactivation of a Model Base Pair via Excited-State Hydrogen Transfer. \JournalTitleScience 306, 1765–1768 (2004).
- (5) BK McFarland, et al., Ultrafast X-ray Auger probing of photoexcited molecular dynamics. \JournalTitleNature Communications 5, 1–7 (2014).
- (6) MCE Galbraith, et al., Few-femtosecond passage of conical intersections in the benzene cation. \JournalTitleNature Communications 8, 1018 (2017).
- (7) ME Corrales, J González-Vázquez, R de Nalda, L Bañares, Coulomb Explosion Imaging for the Visualization of a Conical Intersection. \JournalTitleThe Journal of Physical Chemistry Letters 10, 138–143 (2019).
- (8) TAA Oliver, GR Fleming, Following Coupled Electronic-Nuclear Motion through Conical Intersections in the Ultrafast Relaxation of -Apo-8‘-carotenal. \JournalTitleThe Journal of Physical Chemistry B 119, 11428–11441 (2015).
- (9) EC Wu, et al., Two-dimensional electronic-vibrational spectroscopic study of conical intersection dynamics: an experimental and electronic structure study. \JournalTitlePhysical Chemistry Chemical Physics 21, 14153–14163 (2019).
- (10) J Yang, et al., Imaging CF 3 I conical intersection and photodissociation dynamics with ultrafast electron diffraction. \JournalTitleScience 361, 64–67 (2018).
- (11) TJA Wolf, et al., The photochemical ring-opening of 1,3-cyclohexadiene imaged by ultrafast electron diffraction. \JournalTitleNature Chemistry 11, 504–509 (2019).
- (12) M Kowalewski, K Bennett, KE Dorfman, S Mukamel, Catching Conical Intersections in the Act: Monitoring Transient Electronic Coherences by Attosecond Stimulated X-Ray Raman Signals. \JournalTitlePhysical Review Letters 115, 193003 (2015).
- (13) SP Neville, et al., Beyond structure: ultrafast X-ray absorption spectroscopy as a probe of non-adiabatic wavepacket dynamics. \JournalTitleFaraday Discussions 194, 117–145 (2016).
- (14) AR Attar, et al., Femtosecond x-ray spectroscopy of an electrocyclic ring-opening reaction. \JournalTitleScience 356, 54–59 (2017).
- (15) SP Neville, M Chergui, A Stolow, MS Schuurman, Ultrafast X-Ray Spectroscopy of Conical Intersections. \JournalTitlePhysical Review Letters 120, 243001 (2018).
- (16) A von Conta, et al., Conical-intersection dynamics and ground-state chemistry probed by extreme-ultraviolet time-resolved photoelectron spectroscopy. \JournalTitleNature Communications 9, 3162 (2018).
- (17) Y Kobayashi, KF Chang, T Zeng, DM Neumark, SR Leone, Direct mapping of curve-crossing dynamics in IBr by attosecond transient absorption spectroscopy. \JournalTitleScience 364, 79–83 (2019).
- (18) H Timmers, et al., Disentangling conical intersection and coherent molecular dynamics in methyl bromide with attosecond transient absorption spectroscopy. \JournalTitleNature Communications 10, 3133 (2019).
- (19) L Young, et al., Roadmap of ultrafast x-ray atomic and molecular physics. \JournalTitleJournal of Physics B: Atomic, Molecular and Optical Physics 51, 032003 (2018).
- (20) D Keefer, S Thallmair, S Matsika, R de Vivie-Riedle, Controlling Photorelaxation in Uracil with Shaped Laser Pulses: A Theoretical Assessment. \JournalTitleJournal of the American Chemical Society 139, 5061–5066 (2017).
- (21) S Matsika, M Spanner, M Kotur, TC Weinacht, Ultrafast Relaxation Dynamics of Uracil Probed via Strong Field Dissociative Ionization. \JournalTitleThe Journal of Physical Chemistry A 117, 12796–12801 (2013).
- (22) Stephen Butterworth, On the Theory of Filter Amplifiers. \JournalTitleExperimental Wireless and the Wireless Engineer 7, 536–541 (1930).
- (23) W Kiefer, DA Long, eds., Non-Linear Raman Spectroscopy and Its Chemical Aplications. (Springer Netherlands, Dordrecht), (1982).
- (24) J Olsen, P Jørgensen, Linear and nonlinear response functions for an exact state and for an MCSCF state. \JournalTitleThe Journal of Chemical Physics 82, 3235–3264 (1985).
- (25) S Mukamel, S Rahav, Ultrafast Nonlinear Optical Signals Viewed from the Molecule’s Perspective. \JournalTitleAdv. Atom. Mol. Opt. Phys. 59, 223–263 (2010).
- (26) P von den Hoff, S Thallmair, M Kowalewski, R Siemering, R de Vivie-Riedle, Optimal control theory – closing the gap between theory and experiment. \JournalTitlePhysical Chemistry Chemical Physics 14, 14460 (2012).
- (27) C Arnold, O Vendrell, R Welsch, R Santra, Control of Nuclear Dynamics through Conical Intersections and Electronic Coherences. \JournalTitlePhysical Review Letters 120, 123001 (2018).
- (28) M Richter, et al., Ultrafast imaging of laser-controlled non-adiabatic dynamics in NO 2 from time-resolved photoelectron emission. \JournalTitlePhysical Chemistry Chemical Physics 21, 10038–10051 (2019).
- (29) A Wituschek, et al., Tracking attosecond electronic coherences using phase-manipulated extreme ultraviolet pulses. \JournalTitleNature Communications 11, 883 (2020).
- (30) A Marinelli, et al., High-intensity double-pulse X-ray free-electron laser. \JournalTitleNature Communications 6, 6369 (2015).
- (31) C Pellegrini, A Marinelli, S Reiche, The physics of x-ray free-electron lasers. \JournalTitleReviews of Modern Physics 88, 015006 (2016).
- (32) HJ Werner, et al., MOLPRO, version 2019.2, a package of ab initio programs (2019).
- (33) R Krishnan, JS Binkley, R Seeger, JA Pople, Self-consistent molecular orbital methods. XX. A basis set for correlated wave functions. \JournalTitleThe Journal of Chemical Physics 72, 650–654 (1980).
- (34) T Clark, J Chandrasekhar, GW Spitznagel, PVR Schleyer, Efficient diffuse function-augmented basis sets for anion calculations. III. The 3-21+G basis set for first-row elements, Li-F. \JournalTitleJournal of Computational Chemistry 4, 294–301 (1983).
- (35) H Tal-Ezer, R Kosloff, An accurate and efficient scheme for propagating the time dependent Schrödinger equation. \JournalTitleThe Journal of Chemical Physics 81, 3967–3971 (1984).
- (36) PH Berens, KR Wilson, Molecular dynamics and spectra. I. Diatomic rotation and vibration. \JournalTitleThe Journal of Chemical Physics 74, 4872–4882 (1981).
- (37) S Thallmair, MK Roos, R de Vivie-Riedle, Design of specially adapted reactive coordinates to economically compute potential and kinetic energy operators including geometry relaxation. \JournalTitleThe Journal of Chemical Physics 144, 234104 (2016).