Simple, compact, high-resolution monochromatic x-ray source for characterization of x-ray calorimeter arrays
Abstract
X-ray calorimeters routinely achieve very high spectral resolution, typically a few eV full width at half maximum (FWHM). Measurements of calorimeter line shapes are usually dominated by the natural linewidth of most laboratory calibration sources. This compounds the data acquisition time necessary to statistically sample the instrumental line broadening, and can add systematic uncertainty if the intrinsic line shape of the source is not well known. To address these issues, we have built a simple, compact monochromatic x-ray source using channel cut crystals. A commercial x-ray tube illuminates a pair of channel cut crystals which are aligned in a dispersive configuration to select the K line of the x-ray tube anode material. The entire device, including x-ray tube, can be easily hand carried by one person and may be positioned manually or using a mechanical translation stage. The output monochromatic beam provides a collimated image of the anode spot with magnification of unity in the dispersion direction (typically 100-200 m for the x-ray tubes used here), and is unfocused in the cross-dispersion direction, so that the source image in the detector plane appears as a line. We measured output count rates as high as 10 count/s/pixel for the Hitomi Soft X-ray Spectrometer, which had 819 m square pixels. We implemented different monochromator designs for energies of 5.4 keV (one design) and 8.0 keV (two designs) which have effective theoretical FWHM energy resolution of 0.125, 0.197, and 0.086 eV, respectively; these are well-suited for optimal calibration measurements of state-of-the art x-ray calorimeters. We measured an upper limit for the energy resolution of our Cr K monochromator of 0.7 eV FWHM at 5.4 keV, consistent with the theoretical prediction of 0.125 eV.
I Introduction
X-ray calorimeters have been developed over the last 30 years with the aim of providing high-resolution, high-efficiency imaging spectroscopy for astrophysics and other applications Moseley, Mather, and McCammon (1984). The Hitomi Soft X-ray Spectrometer (SXS), a production space flight spectrometer with a 36 pixel array of Si thermistor sensors with HgTe x-ray absorbers, achieved better than 5 eV full width at half maximum (FWHM) resolution at 6 keV in ground testingEckart et al. (2018) and 5 eV on orbitLeutenegger et al. (2018), and detectors based on Transition Edge Sensors (TES) as well as Metallic Magnetic Calorimeters (MMC) have achieved better than 2 eV resolution at 6 keV and better than 1 eV below 2 keVSmith et al. (2012); Porst et al. (2014); Lee et al. (2015); Doriese et al. (2017); Kempf et al. (2018); Durkin et al. (2019). Typical calorimeter pixels range in size from of order 0.01 to 1 mm2, depending on the application.
The spectral response of x-ray calorimeter detectors is dominated by a Gaussian broadening that is often characterized using Mn K x-rays from a radioactive 55Fe source, which has a large advantage in terms of ease of use. The measured spectrum is a convolution of the intrinsic line shape of Mn K with the Gaussian core response of the detector. The intrinsic line shape of Mn K is highly complex, and is typically modeled using a 8 Lorentzian empirical deconvolutionHölzer et al. (1997); Hölzer (2004). Since the Lorentzian components have line widths of 2 eV, the intrinsic width of the complex is a significant fraction of the measured broadening for state-of-the-art calorimeters. This adds considerably to the integration time required to measure the intrinsic line width to the desired statistical precision given a fixed incident flux. This loss of experimental efficiency could be recovered with a sufficiently monochromatic x-ray source, which would return the maximum statistical precision achievable for the number of counts collected. Furthermore, characterization of non-Gaussian components of the detector response (from fluorescent escape photons, electron loss, and effects of incomplete thermalization)Eckart et al. (2018, 2019) also requires a monochromatic x-ray source to avoid confusion between the intrinsic source spectrum and non-Gaussian components.
Thus, there is a clear need for monochromatic sources for characterization of x-ray calorimeters. High performance monochromators for experiments at synchrotron facilities are well-developed, but travel to such facilities is prohibitive for the day-to-day activities of a cryogenic physics laboratory. Thus we have built a series of small, portable monochromators using commercial table-top x-ray generators combined with channel cut crystals, and we have used these monochromators to characterize a number of x-ray calorimeter devices.
II Design
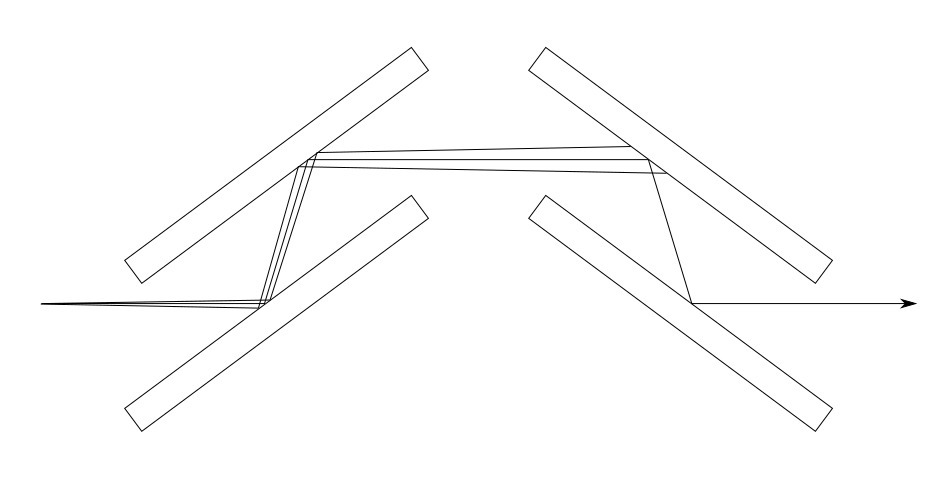
The scheme used in our monochromators is due to DuMond, who first proposed a four reflection monochromator in the (+1,-1,-1,+1) configurationDuMond (1937), as illustrated in Figure 1, although it was not implemented at the time due to insufficient flux produced by x-ray generators. The main advantage of such a multiple reflection scheme is the suppression of reflectivity in the wings of the crystal rocking curve. A secondary advantage is the preservation of the original beam propagation direction. This design also has the interesting property that the output beam produces a collimated image of the x-ray generator spot in the dispersion direction with magnification of unity.
Subsequently Beaumont & Hart and Bartels designed four reflection monochromators for synchrotron beams Beaumont and Hart (1974); Bartels (1983). Hart simplified the alignment problem by using channels cut in monolithic crystals to provide pairs of aligned reflecting surfaces. The most important remaining degree of freedom in the alignment is the angle between the two channel cut crystals in the dispersion plane, which determines the energy passed by the monochromator.
Such designs have been commonly implemented to take advantage of the bright x-rays of synchrotron beamlines; however, because x-ray calorimeter arrays are typically designed to handle only relatively low count rates (e.g. count/s/pixel for the Hitomi SXS), we can achieve acceptable output flux using a commercial air-cooled 50 W x-ray generator.
To unambiguously characterize the performance of x-ray calorimeters, it is desirable to have a very monochromatic source with no flux in the line wings. Even a four reflection monochromator design achieves this, although marginal decreases in FWHM can be achieved with more reflections, at the cost of some throughput. The number of reflections in a given crystal design can be chosen by changing the ratio of channel length to channel width for a given Bragg angle such that
| (1) |
where is the channel length, is the channel width, is the Bragg angle, and is the number of reflections per crystal in the design, with constrained to be an integer. In this article, we use the notation to denote the total number of reflections while calling attention to the symmetry in the optical design. All of our design implementations discussed in this article are for 4+4 or 6+6 reflection systems.
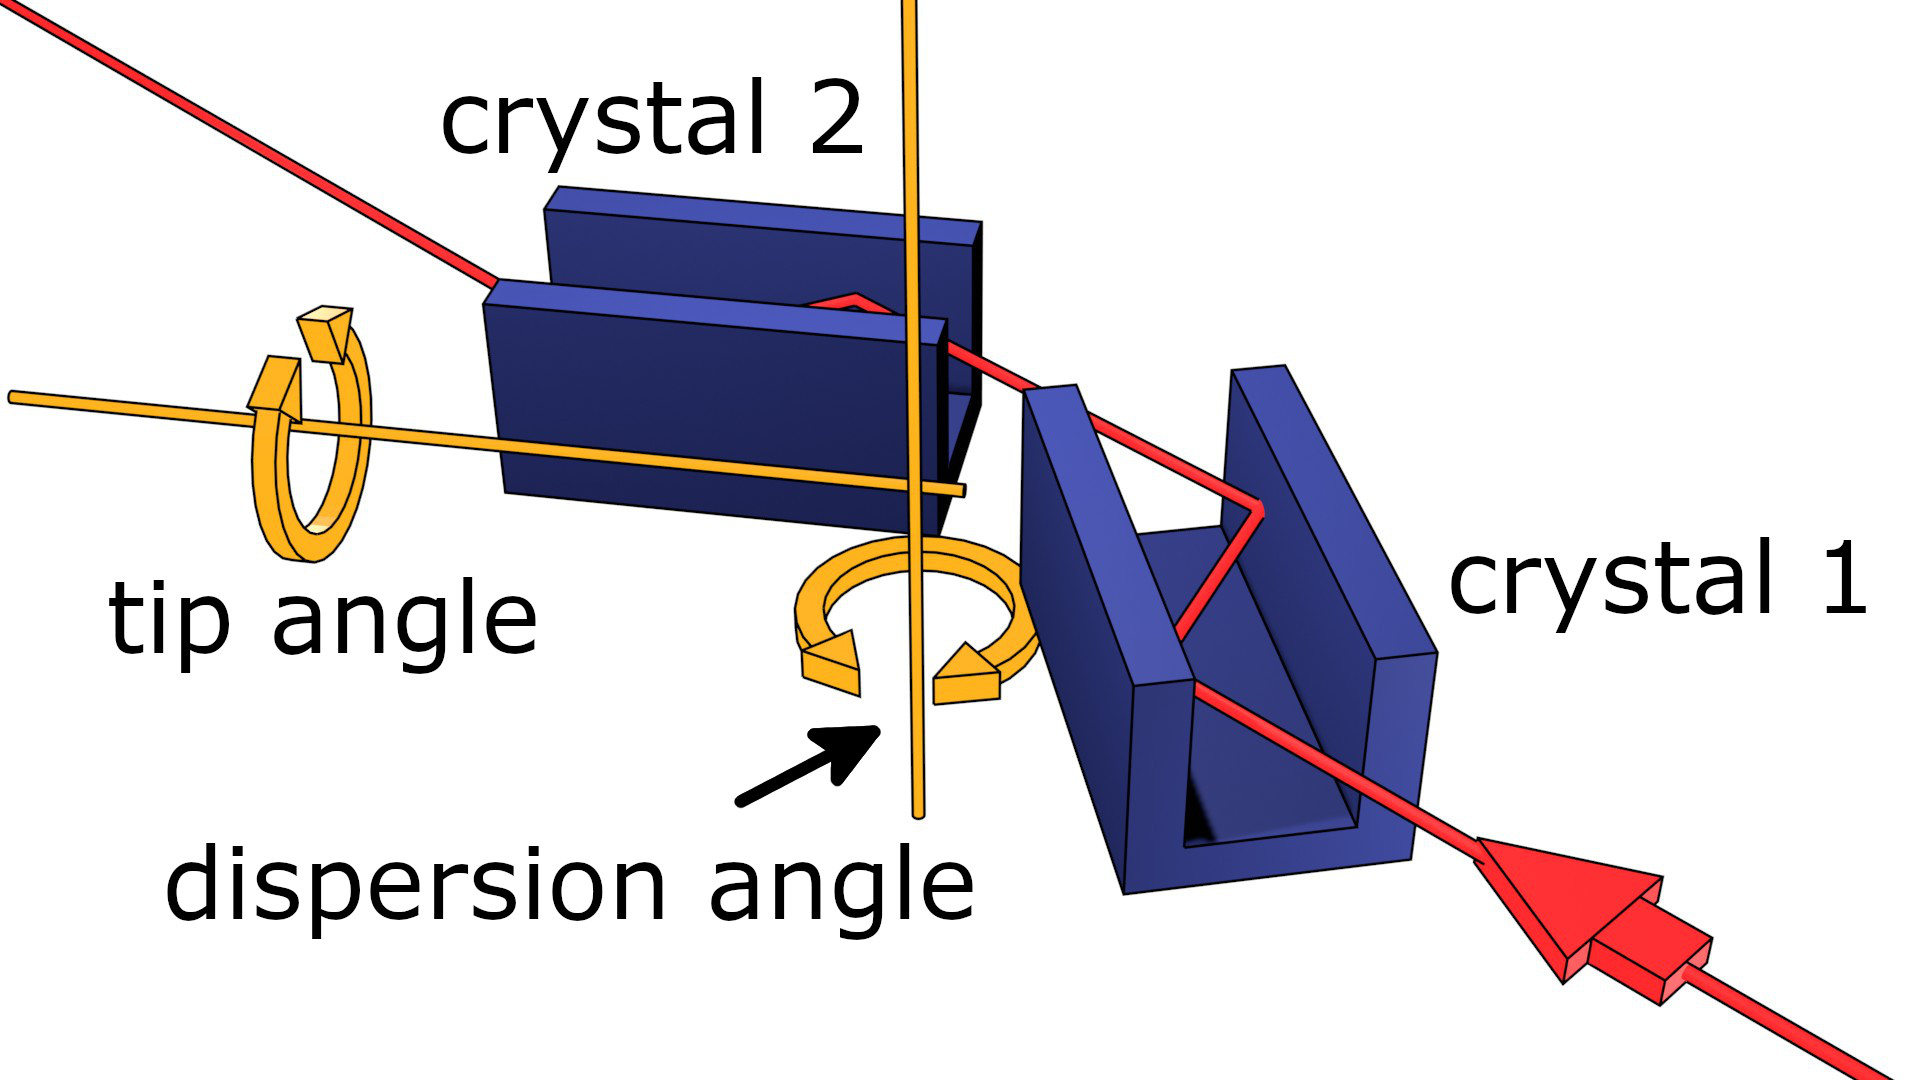
We designed the monochromators to be simple and compact, using commercially available parts to the extent possible. All alignment stages are operated by hand, and the number of degrees of freedom has been minimized to five: cross dispersion translation and dispersion angle for each crystal; and the relative tip angle of the two crystals. In Fig. 2, we show an illustration of a 2+2 reflection channel cut crystal monochromator concept, indicating the path of the beam, as well as the axes for adjustment of the dispersion angle and relative tip angle of the second (downstream) crystal.
III Implementation
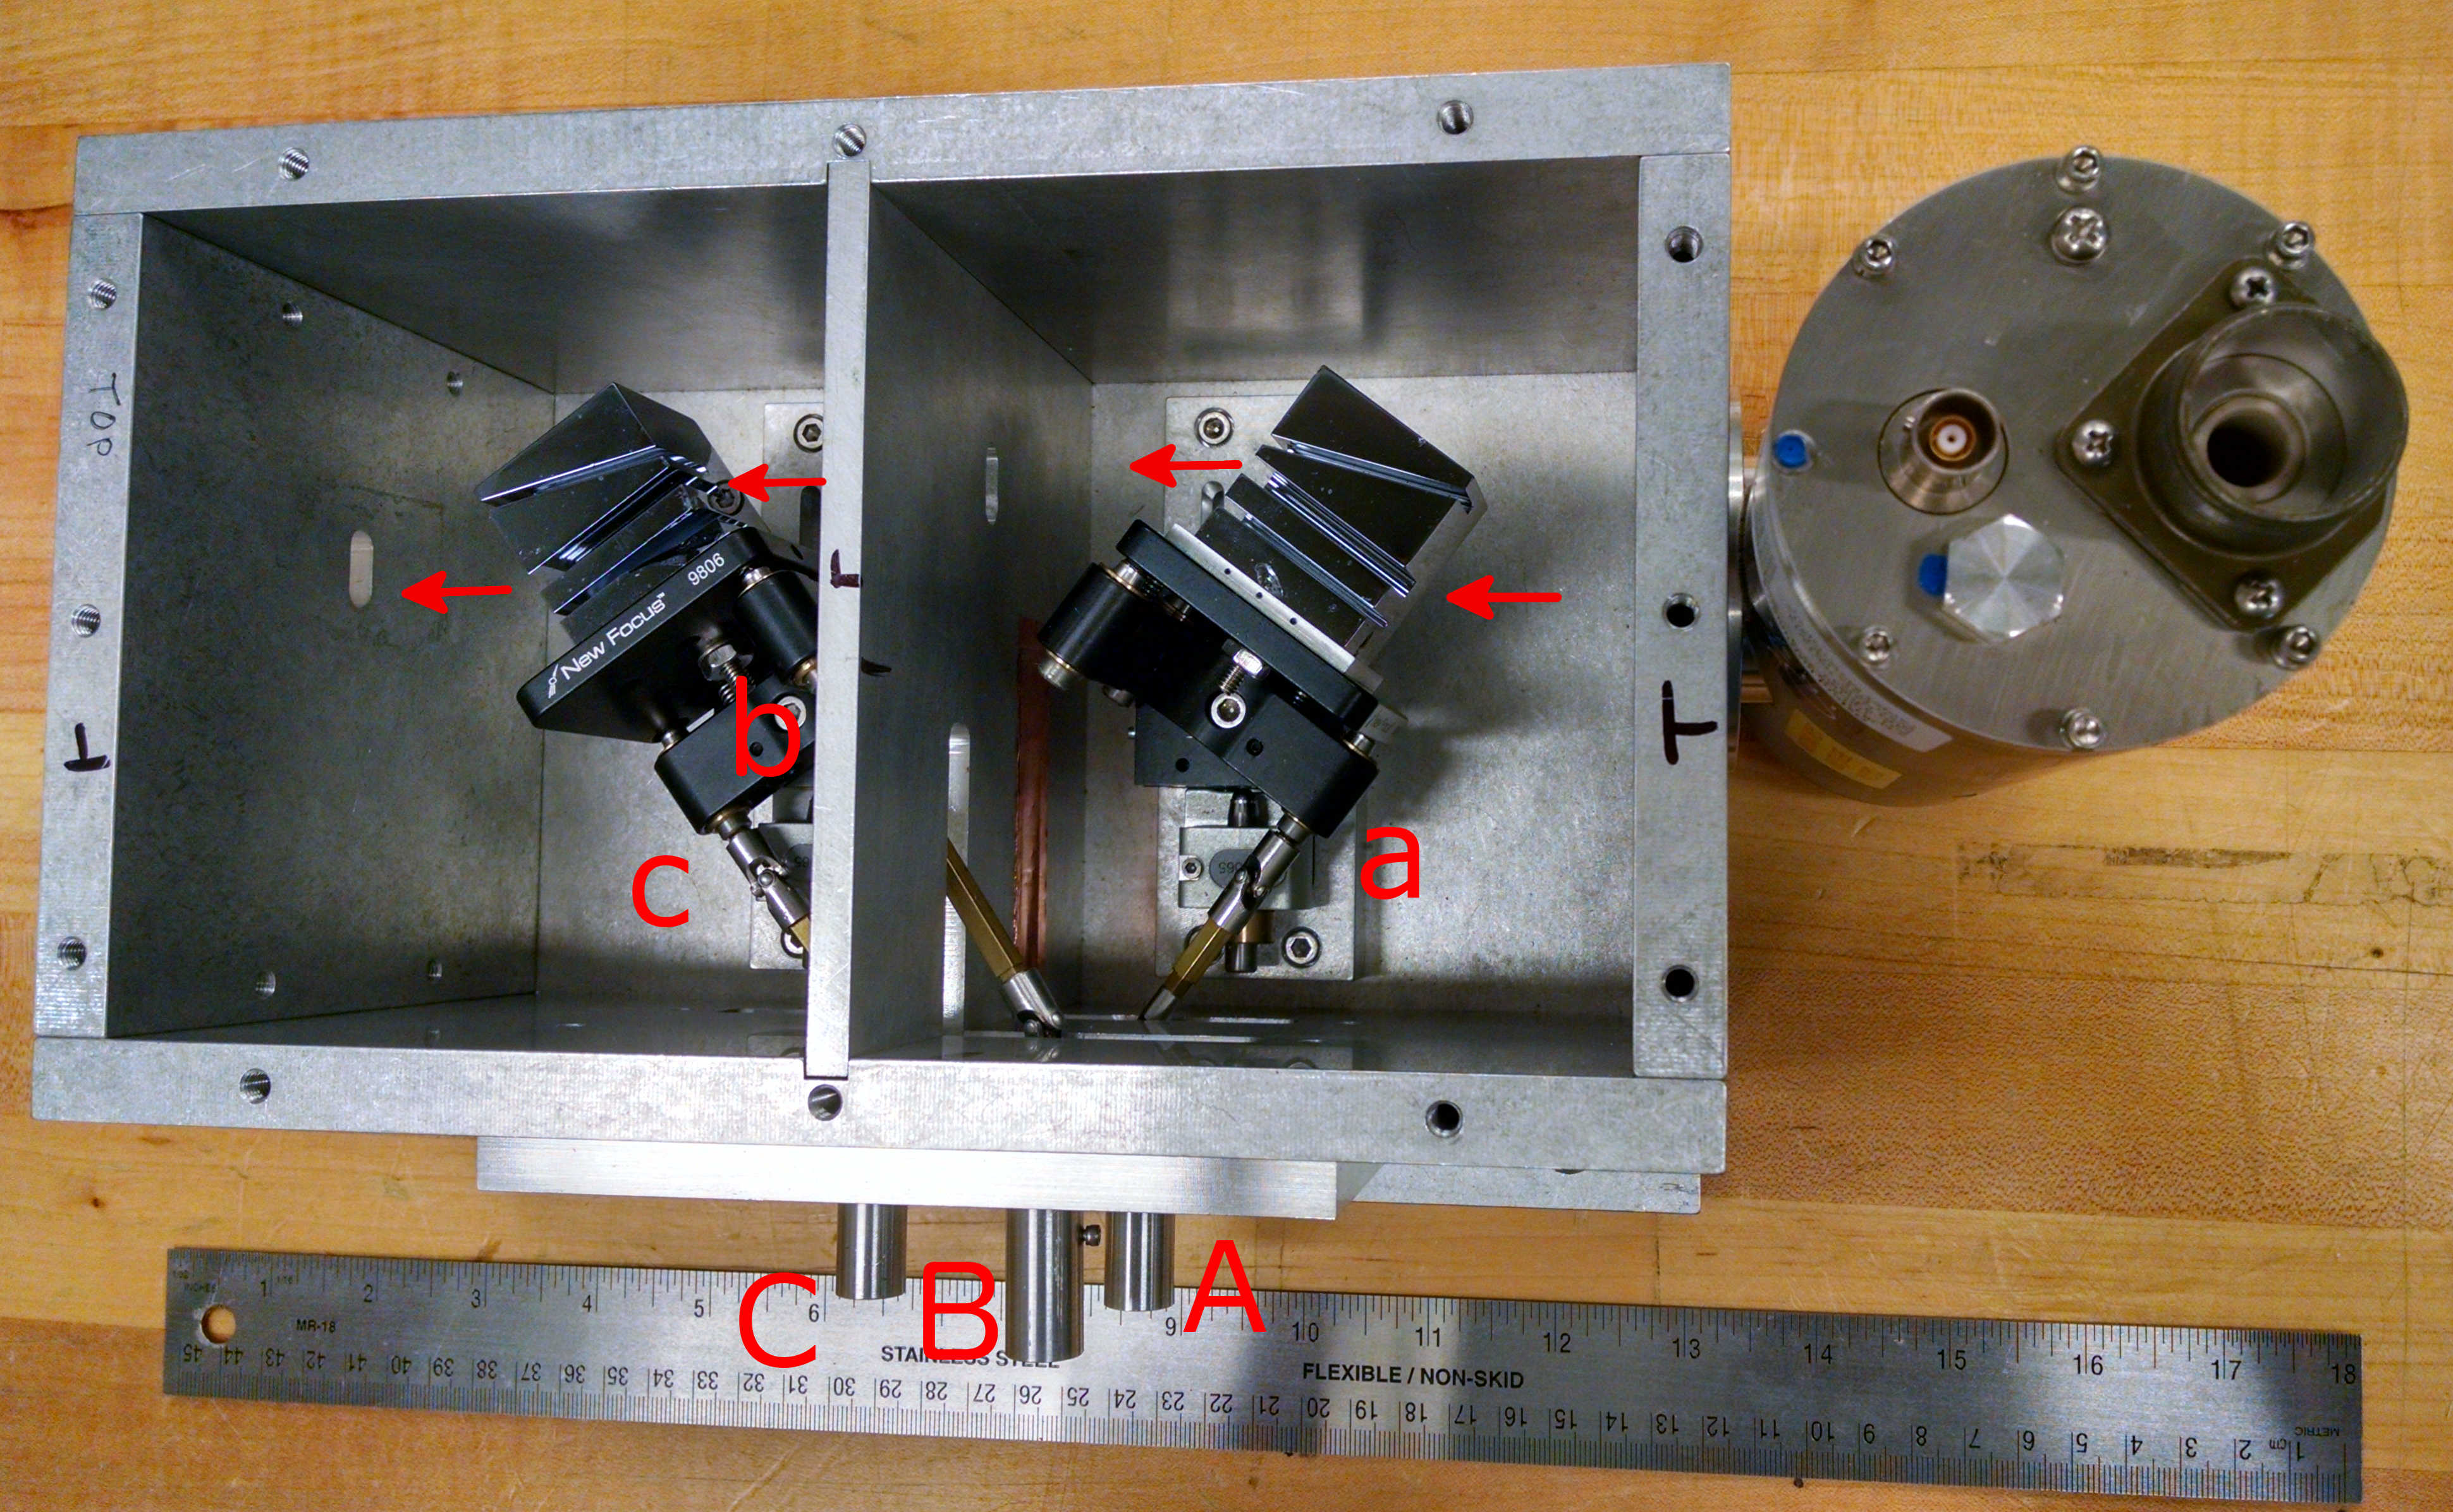
In Figure 3 we show one of our DuMond-Hart-Bartels (DHB) monochromators. A 0.5 in. thick aluminum enclosure provides stable mechanical support for the two channel cut crystals, which are mounted on commercial mirror mount stages, which are in turn mounted on commercial one-dimensional linear positioning stages. An Oxford111Oxford Instruments X-ray Technology, Scotts Valley, CA 95066, USA Jupiter 5000 series x-ray tube is mounted at the entrance aperture of the enclosure. Three shafts allow external manipulation of the dispersion angle of each crystal, as well as the relative tip angle of the second crystal. The one-dimensional linear positioning stages are needed only for initial coarse adjustment, and can be accessed by removing the walls of the enclosure from the base plate. The internal plate and back plate absorb any scattered x-rays, allowing photons to travel only along the intended beam path.
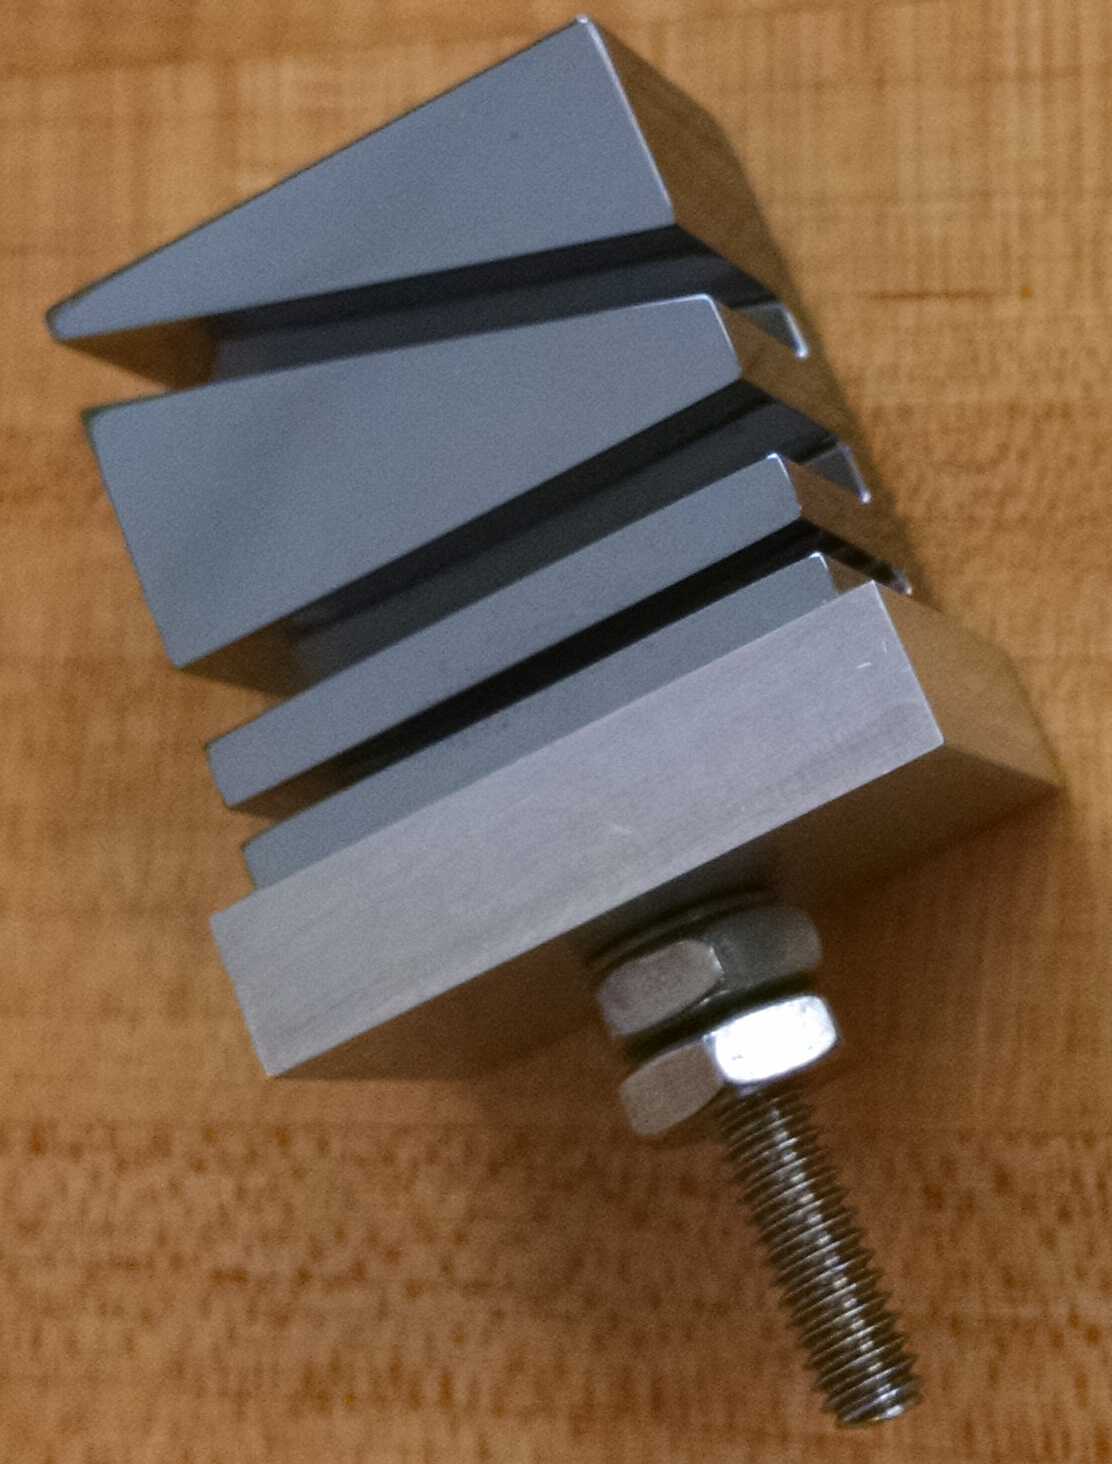
In Figure 4 we show one of the crystals used in our monochromators after it has been bonded to its substrate. The strain relief channel is visible closest to the bond. The crystals are supplied by Crystal Scientific222Crystal Scientific (UK) Ltd, Middle Barton, Whittingham, Alnwick, Northumberland, NE66 4SU, United Kingdom, and their manufacturing specifications typically guarantee surface orientation tolerances to within , spatial tolerances to within mm, and rocking curve FWHM tolerance to within 0.1 arcsec of the theoretical value.
In Table 1 we give the dimensions of the crystals used in our monochromators. The ratio of channel width to length is chosen to allow potential use of the full channel width for the design energy using Equation 1, with the exception of the Cr K 6+6 reflection monochromator, for which we repurposed crystals designed for a 4+4 reflection Cu K monochromator, taking advantage of the fact that the width-to-length ratio is similar for those two designs, so that almost the full width of the channel is usable. The widths were chosen to allow illumination of a significant part of a calorimeter array with the collimated image (in the dispersion direction) of an x-ray generator filling the full width of the channel; although the x-ray generators used here had much smaller spot sizes (see § V.2.1), in the future we plan to retrofit x-ray generators with larger spot sizes.
| Line | crystal | Number of | Bragg angle | ||
|---|---|---|---|---|---|
| reflections | (mm) | (mm) | (degrees) | ||
| Cr K | Si (220) | 6+6 | 31.8 | 3.2 | 36.60128 |
| Cu K | Si (220) | 4+4 | 31.8 | 3.2 | 23.65103 |
| Cu K | Si (400) | 4+4 | 52.3 | 9.0 | 34.56447 |
III.1 Alignment
The crystals are aligned using a straightforward procedure. The first crystal (closest to the x-ray tube) is installed and coarsely aligned using a ruler and protractor, while the second crystal is not yet installed. A photon-counting x-ray detector with comparatively large area such as a silicon drift detector or proportional counter is positioned at the expected location of the output beam, coarsely measured using a ruler. The x-ray generator is turned on, and the first crystal reflection angle is varied until the maximum intensity is achieved. Then the generator is turned off, and the second crystal is installed and coarsely aligned. The x-ray detector is placed at the beam exit of the second crystal. The x-ray generator is turned on again, and the output intensity is maximized by varying the second crystal reflection angle, corresponding to the bright K peak of the x-ray generator anode material. This step is very sensitive to the exact angle of the second crystal. While measuring and maximizing the intensity, it should be possible to find a second, smaller (local) maximum corresponding to K at a slightly steeper reflection angle. Finally, the relative tip angle of the second crystal is adjusted, again by maximizing the intensity. The count rate is much less sensitive to this last degree of freedom, but optimizing the relative tip of the two crystals is important to maximize the monochromaticity of the exit beam along the cross-dispersion direction.
Alignment of a newly-assembled monochromator typically takes several hours, while realigning a monochromator that is close to the correct alignment takes about an hour. We have verified the short-term alignment stability, for example, before and after positioning the monochromator housing for measurement campaigns. We have not explored the long term alignment stability rigorously, but we believe that realignment is rarely needed, if ever. The maintenance of alignment is verified by remeasuring the count rate of the monochromator for the same x-ray tube settings, and checking that it is consistent with the value obtained during the previous alignment.
III.2 Mounting
As will be discussed in § V.2.1, the output beam of the monochromator in the dispersion direction is a collimated image of the x-ray source spot, which is smaller than many calorimeter pixels for typical commercial microfocus x-ray generators, while the beam diverges in the cross-dispersion direction, so that the image on a calorimeter array is a thin line, and only a single column (or row) of such a detector array can be illuminated at one time. To align the monochromator beam to the detector array, and to allow illumination of all pixels, we mounted the entire apparatus (monochromator housing with x-ray tube) on a motorized linear stage. The beam position can then be periodically cycled, allowing illumination of the full array over the course of an experiment.
IV Theoretical performance
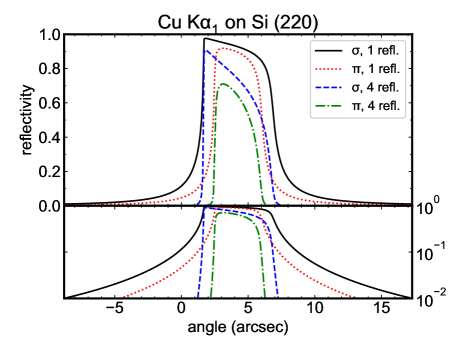
We used the web tool GID_SLStepanov et al. (1998),333Please see this URL for access to GID_SL: http://x-server.gmca.aps.anl.gov/GID_sl.html to calculate single reflection rocking curves for relevant x-ray energies and crystal planes. Here is the offset of the incident ray with respect to the nominal Bragg angle. Rocking curves were calculated for both and polarization, which had to be considered separately; the results we derive for each polarization are averaged to obtain results for unpolarized light, where appropriate. We assumed symmetric Bragg diffraction from perfect crystals.
For each polarization, the rocking curves for reflections (with a positive whole number) from a single channel cut crystal were obtained by multiplying the single crystal rocking curves to the power:
| (2) |
The rocking curves are shown for both polarizations in Figure 5 for one and four reflections from Cu K Si (220).
The rocking curves give the reflectivity as a function of reflection angle with respect to the nominal Bragg angle at the specified energy; note that the actual peak reflectivity is slightly offset from the nominal Bragg angle as expected from theory. This rocking curve is really a one-dimensional version of what can more generally be described as a two-dimensional function of both energy and angle, . In the case of a rocking curve as presented in Figure 5, the incident energy is fixed and no other energies are considered. To incorporate the effect of other nearby incident energies we displace the rocking curve using a relation derived by dividing the Bragg equation by its derivative:
| (3) |
so that
| (4) |
We can thus write the reflectivity as a function of energy and angle in terms of the reflectivity as a function of angle at the nominal energy:
| (5) |
where
| (6) |
is the offset angle with respect to the nominal Bragg angle for a given offset energy when evaluated against the geometric reference of the nominal Bragg angle of . The reflectivity of the DHB -reflection monochromator is obtained by multiplying the reflectivity for a single channel cut crystal with reflections by itself, but with the second reflectivity having the opposite signs in the displacement of angle as a function of energy displacement:
| (7) |
To get the transmitted line shape, we integrate the product of the reflectivity and the incident x-ray source flux over incident angles:
| (8) |
where is the observed flux per unit energy emerging from the monochromator, and is the incident flux per unit energy per unit angle. If we assume that the source emits uniformly over incident angle, as for an X-ray tube, we have
| (9) |
where
| (10) |
is the angular acceptance. In the approximation that the incident spectral shape is flat (which is valid for either a continuum, or for a monochromator tuned to the peak of a spectral line that is much broader than the rocking curve), the effective line shape of the monochromator is given by . Note that is effectively a cross-correlation of the rocking curve with its mirror image in , with the lag set by the dispersion from the Bragg equation.
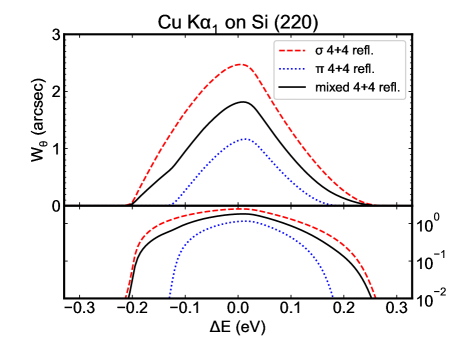
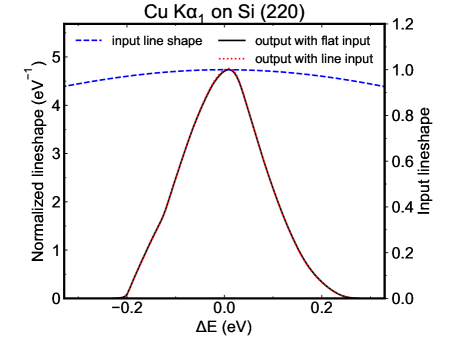
In Figure 6 we show calculations of for a 4+4 reflection Si (220) monochromator for the peak energy of Cu K. We average for and polarizations to obtain for an unpolarized source. In Figure 7, we show the effect of the Cu K line shape on the output line shape of the monochromator. Since the input fluorescence line is much broader than the monochromator bandpass, is a good approximation for the true output line shape of the monochromator.
We can also compare the relative efficiency of a DHB monochromator by integrating over both energy and angle to obtain the energy-angular acceptance, or simply acceptance:
| (11) |
Physically, the acceptance accounts for the throughput efficiency of a given energy resolution monochromator due to the rejection of energies outside the bandpass as well as incident angles outside the rocking curve for the accepted energies. The efficiency of a DHB monochromator thus scales with the square of the energy resolution (inversely with the square of the resolving power).
In Table 2 we give the results of our calculations for the FWHM energy resolution and acceptance for the 4+4 Cu K Si (220) monochromator, as well as for two other configurations we implemented: a 6+6 reflection Cr K Si(220) monochromator, and a 4+4 reflection Cu K Si(400) monochromator. We evaluated the formal FWHM energy resolution of the line shape as well as the effective FWHM energy resolution when the line shape is convolved with a 1 eV FWHM Gaussian :
| (12) |
Here is the FWHM of the convolution of the monochromator output with . The formal FWHM energy resolution is evaluated according to the formal definition of a full width at half maximum: the values of where the profile has half the strength of the peak value are found and then differenced to find the full width. The effective FWHM energy resolution is the value that has to be subtracted in quadrature from an uncorrected calorimeter energy resolution measured with a monochromator in order to obtain the true calorimeter energy resolution. The effective FWHM energy resolution is a figure of merit that more accurately describes the performance of the monochromator in a realistic scenario, such as a measurement of the FWHM energy resolution of calorimeter pixels. The effective FWHM is typically slightly smaller than the formal FWHM. The reason for this difference arises from the fact that convolution is more sensitive to the standard deviation, for which FWHM is not an ideal proxy for a non-Gaussian line shape. We also evaluated the effective FWHM with a range of Gaussian FWHMs, and found that it does not change much as long as the Gaussian FWHM is significantly larger than the monochromator FWHM.
| Line | crystal | N. refl. | |||||
| (FWHM, eV) | (eV arcsec) | ||||||
| form. | eff. | mixed | |||||
| Cr K | Si (220) | 6+6 | 0.143 | 0.125 | 0.208 | 7.5e-5 | 0.104 |
| Cu K | Si (220) | 4+4 | 0.201 | 0.197 | 0.584 | 0.182 | 0.383 |
| Cu K | Si (400) | 4+4 | 0.093 | 0.086 | 0.140 | 3.4e-3 | 0.072 |
V Measured performance
V.1 Single crystal reflectivity
To verify the performance of individual crystals, we measured the reflectivity using a collimated monochromatic x-ray source. The source consisted of a water-cooled rotating anode x-ray generator with a Cu target illuminating a single channel cut crystal similar to those used in our DHB monochromators (hereafter referred to as the source crystal, to avoid confusion with the sample crystals being characterized). The x-ray generator was operated with -30 kV cathode bias voltage and 100 mA cathode emission current. We estimate that the x-ray source spot size is 300 m. The source crystal was placed at a distance of 2.6 m from the source, with the channel oriented vertically so that the dispersion direction is horizontal. An exit slit with width 100 m and height 1 mm was placed at a distance of 0.4 m from the source crystal, and 3 m from the source. The source crystal was configured at an angle of 23.65∘ relative to the beam path to provide four reflections of Cu K at 8047.78 eV. The beam divergence is set by the source spot size and exit slit width in comparison with their 3 m separation. Adding the source spot size and exit slit width in quadrature, we estimate an effective slit size of 316 m and thus a divergence in the dispersion direction of 0.105 milliradian. Using Equation 3, we find that this corresponds to an energy width of 1.93 eV. This is comparable to the FWHM of Cu K, so we expect both the natural line shape and the slit width to contribute to the source line shape.
The sample crystal was mounted on a goniometer allowing rotation of the crystal along the dispersion direction, and the reflected x-rays were measured with a Xe-filled proportional counter. The distance from the source exit slit to the goniometer was 25 cm, and the distance from the goniometer to the proportional counter was 25 cm. The raw flux of Cu K passing through the slit was measured by moving the sample out of the beam path and moving the proportional counter to the location of the unreflected beam. The experimental setup is the same as described in Figure 2 of Mori et al. (2018), with the exception that the Si-PIN diode x-ray detector was replaced with the proportional counter, and the x-ray detector was not positioned at twice the goniometer angle, but rather at the correct position to intercept the reflected beam from the sample crystal, which is displaced parallel to the incident beam path.
We measured the reflected flux as a function of goniometer angle and displacement of the sample crystal along the channel direction. To understand how to interpret these measurements, we need to further develop the theory discussed in § IV. The source and sample crystal act effectively as a DHB monochromator; however, we must now account for the fact that the source and sample crystals may be different. We still need to satisfy the Bragg equation for both crystals, so following Equation 3, we have
| (13) |
Here we use subscripts A and B to refer to the source and sample crystals, respectively. The change in the goniometer angle is the sum of the change in the two crystal reflection angles: . Thus
| (14) |
If we denote the input flux from the x-ray generator as a function of energy and angle as , and if we again assume that the input line width is much broader than the line width passed by the two crystals, then the flux observed as a function of goniometer angle is
| (15) |
where the superscript AB indicates that the acceptance is evaluated for the reflectometer two-crystal system of the source and sample crystals, and where the energy is that allowed by the choice of goniometer angle. Here is calculated as in Equation 11, but accounting for the heterogeneity of the source and sample crystal:
| (16) |
Here we use the abbreviated notation , with , to refer to for the source and sample crystals, respectively. Note that near line center, the slit setting is irrelevant, as the bandpass of the source-sample crystal system is much narrower than the slit width. However, as the goniometer is scanned, the slits do set the bounds of the scan angle where significant flux can be detected.
The flux collected by the x-ray detector with no sample crystal present is given by
| (17) |
The angular integration limits are set by the effective slit width. In analogy with Eq. 10, we define the non-dispersive angular acceptance
| (18) |
Note that in principle is still a function of energy, but since the rocking curve shape does not change much for a small change in energy, it is effectively a constant. Again using A to refer to the source crystal, we then have
| (19) |
where we have converted the angular integration limits into equivalent energy integration limits. We have again assumed a uniform angular distribution for emission from the source.
Using Eqs. 15 and 19, the ratio of the flux observed with the sample crystal in and out is
| (20) |
This is still not useful without knowledge of the line shape from the x-ray generator. Since we can scan the goniometer angle with the sample crystal installed, which is equivalent to scanning the energy passed by the system, we can thus effectively integrate the observed ratio over energy:
| (21) |
Because the same integration limits imposed by the slits apply to both integrals over the source spectrum, the integrated spectrum terms cancel. Finally, note that for both and , we must again evaluate them for both polarizations and average them to get the unpolarized values. We use the rocking curves discussed in Section IV to calculate theoretical values of for comparison to our measurement data.
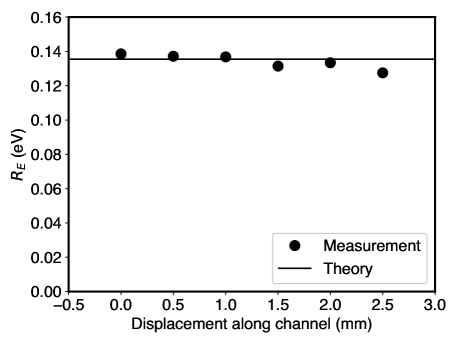
Results representative of our measurements are shown in Figures 8 and 9. The first pair of crystals we used were Si (220) crystals with a mm wide channel. These were bonded to Al substrates with Henkel444Henkel Corporation Aerospace, 2850 Willow Pass Road, Bay Point, CA 94565, USA Loctite Hysol 9309 epoxy. We found that the reflectivity matches the prediction (Fig. 8). We repeated the procedure for a pair of Si (400) crystals with a mm wide channel. We found that the reflectivity was significantly less than the prediction. We suspected strain due to the epoxy bond was responsible, so we removed the epoxy and rebonded the crystals to the substrates using beeswax. We remeasured the reflectivity and found that it was only slightly less than predicted (Fig. 9). It is not clear why the Si (400) crystals showed strain when bonded with epoxy while the Si (220) crystals did not. This difference may be related to the relative width of the channels or to details of the epoxy bonding procedure for each crystal pair; however, beeswax gives good results and is much easier to unbond and rebond, so we recommend its use for the current application.
We note that the reduced reflectivity of the strained crystals would significantly reduce the output flux from the full monochromator. It is thus essential to achieve a sufficiently strain-free bond between the crystals and their substrates, and prudent to validate the reflectivity of individual crystals before assembling the full monochromator.
V.2 Performance of full monochromator
We tested three different monochromator configurations and measured the count rate in each configuration incident on an Amptek555Amptek Inc., 14 DeAngelo Drive, Bedford, MA 01730, USA XR-100CR Si-PIN detector with 13 mm2 area positioned at the exit aperture of the monochromator box. We list the count rates in Table 3. We also give count rates per angle in the cross dispersion direction, using an estimated cross dispersion capture angle of 16.0 mrad for our experiment configuration. The beam is collimated in the dispersion direction.
We note that the ratio of theoretical for the two Cu K monochromators is 5.3, while the ratio of count rates observed is 12.0 (after correcting for the different emission current in the two experiments). It is not clear where this factor-of-two discrepancy in efficiency originates; the reflectivity reduction below theory shown in Figure 9 is about 10%, so that a 20% reduction in efficiency with respect to theory would be expected for the full monochromator.
| configuration | rate | rate | ||||
|---|---|---|---|---|---|---|
| Line | crystal | reflections | (c/s) | (c/s/mrad) | (kV) | (mA) |
| Cr K | Si (220) | 6+6 | 179 | 11.2 | 15 | 1 |
| Cu K | Si (220) | 4+4 | 921 | 57.6 | 20 | 0.7 |
| Cu K | Si (400) | 4+4 | 110 | 6.9 | 20 | 1 |
V.2.1 Beam width
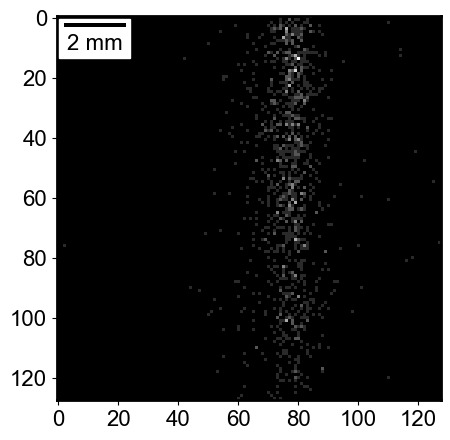
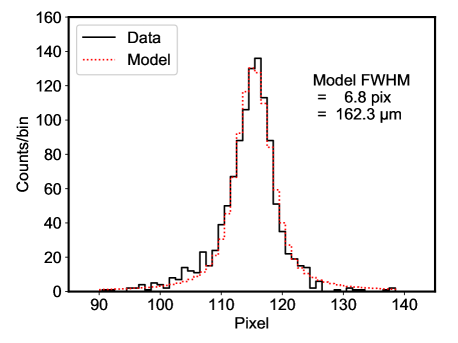
The optical design of the monochromator produces a collimated image of the anode spot in the dispersion direction, and a radially diverging beam in the cross-dispersion direction. To characterize the beam width in the dispersion direction, we imaged the Cr K Si (220) monochromator with a Princeton PI-SX:512 CCD. The x-ray tube was operated with anode bias voltage kV and emission current mA. The CCD has 24 m 24 m pixels, allowing measurement of the beam size with good resolution. It was operated at 1 MHz readout rate and with an exposure time of 1 s, so that individual x-ray events could be counted, resulting in a frame time of 1.26 s and an out-of-time event fraction of 21%. The frame transfer direction was oriented parallel to the cross-dispersion axis of the monochromator, so that the frame streak from out-of-time events runs in the same direction as the source image. Cosmic ray events were identified and removed based on both pulse height and charge distribution pattern. The image is shown in Figure 10, and a histogram of the image in the dispersion direction is shown in in Figure 11. We fit the histogram with a Voigt function, obtaining a FWHM of 6.8 pixels, or 162 m.
The manufacturer reported a measurement for the anode spot size of the Cr anode x-ray generator (serial number 59695) of m FWHM in the direction we aligned with the dispersion axis of the monochromator. The manufacturer’s measurement was conducted at operating conditions of kV and mA. The anode spot size is expected to change somewhat as a function of x-ray tube operating parameters, with spot size increasing with increased emission current, and decreasing as anode voltage increases. The FWHM of the DHB rocking curve for Cr K on Si (220) is 8 arcsec, which corresponds to 24 m at the measurement distance of 60 cm between the crystal and CCD. The correction due to angular divergence is thus almost negligible when added in quadrature with the anode spot size. We conclude that the measured beam width is consistent with the expectation of a collimated image of the anode spot, given the systematic uncertainty associated with the different tube operating conditions.
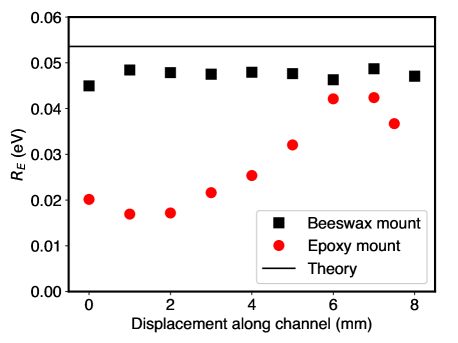
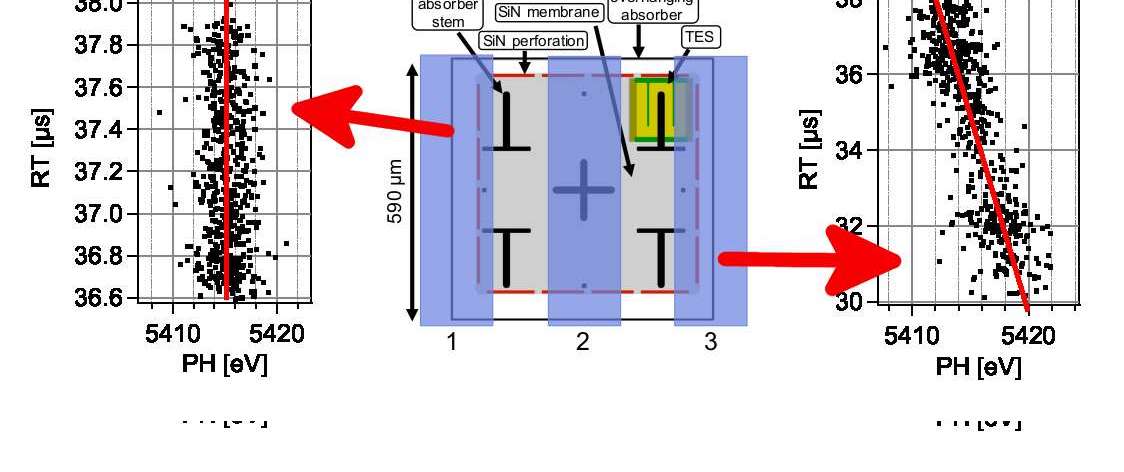
A beam width of 160 m is smaller than the pixels of many calorimeter arrays, although arrays with smaller pixels have been fabricated. One possible application of a narrow beam monochromator is in tests for an undesired position dependent response. One example of this is shown in Eckart et al. (2013), who used the narrow beam of the monochromator to probe position dependent response in a TES array developed for the Micro-X sounding rocket missionAdams et al. (2020). The results of this test are summarized in Figure 12.
V.2.2 Energy resolution
It is difficult to directly measure the energy resolution of a DHB monochromator of the design discussed in this article, since the output x-ray flux is low by design, and furthermore the resolving power of a spectrometer used to measure the energy resolution of the monochromator must be comparable to the monochromator itself.
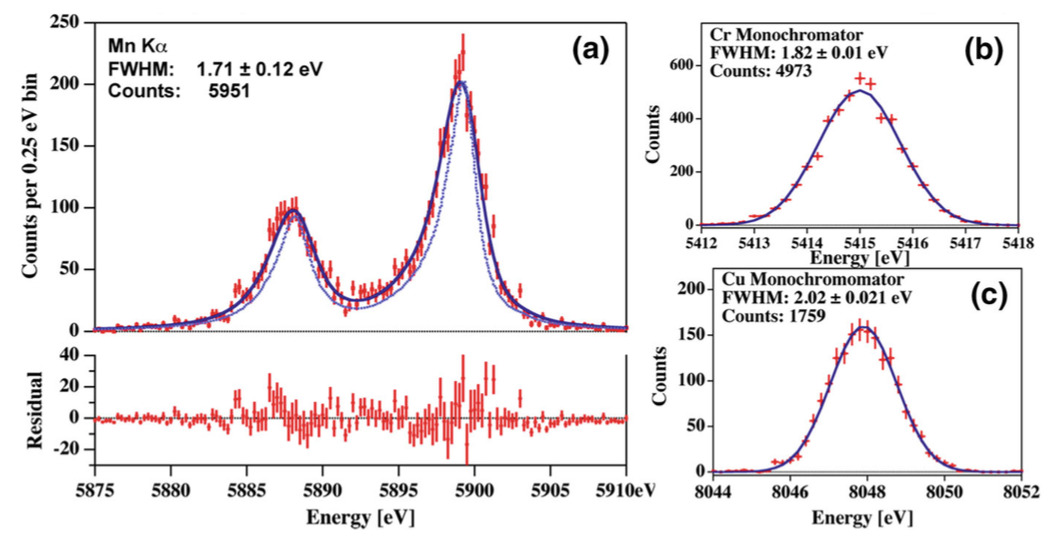
Porst et al. (2014) have measured the energy resolution of an MMC using an 55Fe source, as well as our portable DHB monochromators (reproduced in Figure 13). We can use this to estimate experimental constraints on the resolution of the Cr K Si (220) monochromator, since the resolution at Mn K and Cr K should be similar. The measured detector energy resolution from Mn K after deconvolving the natural line shapeHölzer et al. (1997) is 1.71 0.12 eV, while the Gaussian FWHM when illuminated by the Cr K monochromator is 1.82 0.01 eV, with no deconvolution. If we correct to this by subtracting the theoretical 0.125 eV FWHM of the monochromator in quadrature, we obtain 1.81 0.01 eV. In either case, the resolution is consistent within 1 with that measured using the 55Fe source. Formally, the measured energy resolution of the monochromator obtained by differencing the 55Fe and Cr K measurements in quadrature and propagating the measurement uncertainty is = 0.6 0.3 eV. However, this is of questionable validity, since the propagated uncertainty on the energy resolution depends inversely on the best fit energy resolution itself, which is clearly very uncertain. If we instead neglect the relatively small uncertainty on the measurement with the monochromator, and use the 1 upper and lower bounds of the Mn K measurement to derive the bounds on the monochromator resolution, we obtain an upper limit of 0.9 eV FWHM. This is consistent with the theoretical resolution of 0.125 eV. We cannot use the MMC measurements presented in Figure 13c using the Cu K Si (400) monochromator in a similar way, both because the energy resolution at Cu K is expected to be different from that at Mn K, and because the detector operating conditions had changed for this exposure due to a difference in the laboratory noise environment.
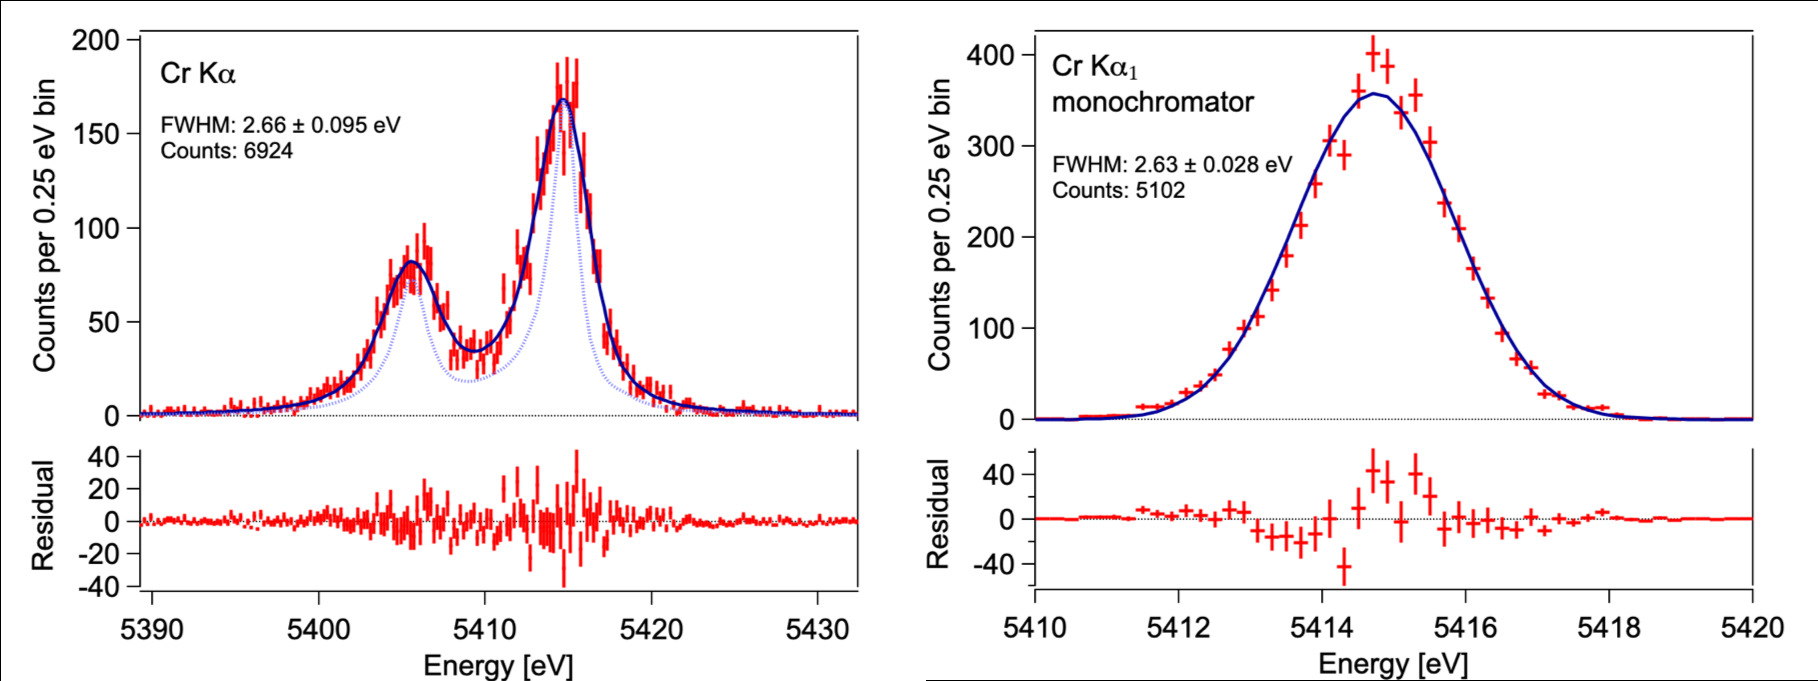
We also used a TES microcalorimeter to measure the energy resolution of the monochromator. The detector was from a prototype Large Pixel ArraySmith et al. (2016) for the Athena X-ray Integral Field Unit (X-IFU)Barret et al. (2018); Pajot et al. (2018). We obtained x-ray spectra from a Cr K fluorescent source and the Cr K monochromator, providing a comparison at the same incident energy. The measurements were performed consecutively on the same day with identical detector and cryogenic operating condition setpoints. The noise environment was stable. The results are presented in Figure 14. Just as in our measurements using the MMC, we find that these two measurements are consistent at the 1 level, and the inferred upper limit to the FWHM energy resolution of the monochromator is 0.7 eV, consistent with the theoretical resolution of 0.125 eV.
In both of the experiments described in this section, the reported error estimates are derived only from propagation of statistical uncertainties in fits to the data. The measurements are fully consistent with the theoretical prediction within the uncertainties. A more stringent measurement of the monochromator energy resolution is desirable, given ever-improving calorimeter energy resolutions, but will be challenging to achieve.
V.2.3 Polarization
The Cr K 6+6 reflection Si 220 monochromator is theoretically predicted to be 99.96% -polarized, i.e., with the electric field in the dispersion direction. This makes it potentially of interest as a monochromatic calibration source for x-ray polarimeters.
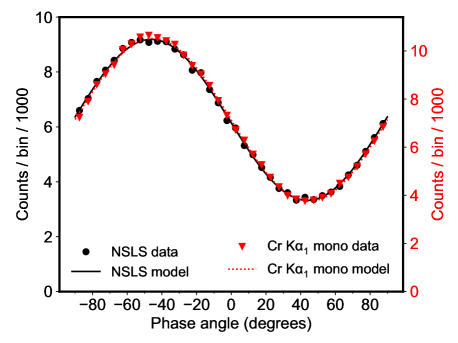
We measured the polarization of this monochromator to be 99 1 % (statistical) using a micropattern Time Projection Chamber (TPC) polarimeter Iwakiri et al. (2016), which obtains polarization information by analyzing the angle of the track created by the initial photoelectron. The polarimeter was calibrated using beamline X19-A at the National Synchrotron Light Source (NSLS), which has a calculated polarization of 98%. In Figure 15 we show the number of events collected per phase angle bin in the TPC for both the synchrotron calibration and our measurement of the Cr K 6+6 reflection Si 220 monochromator. The data are modeled with a sine plus a constant baseline. The ratio of the sine amplitude to the constant baseline is known as the modulation factor, and is proportional to the degree of polarization.
The polarization measurement of the monochromator may have some additional experimental errors that we estimate to be comparable to or smaller than the statistical uncertainty. The response of the polarimeter varies both with energy and, to a lesser extent, with position in the active area. We believe that the energy and position of the beams for the two measurements were sufficiently similar that these errors are small compared to the statistical uncertainties. There may also be an error in the assumed synchrotron polarization of 98%, which is derived from a ray-tracing calculationYang, Penner-Hahn, and Stefan (1990), but has not been experimentally verified. Regardless of any possible systematic errors, our measurements are compatible with the theoretical prediction at the 1 level.
VI Summary
We have reported on the design and construction of simple, portable x-ray monochromators intended for calibration of high-resolution x-ray calorimeters. The typical FWHM energy resolution of our designs is 0.1-0.2 eV, and the output count rate may be as high as 500 counts/s/mm2 at the monochromator exit aperture for typical operating conditions. The illumination pattern is a narrow strip with width corresponding to the x-ray tube spot size, 100-200 m for the monochromators we have implemented.
Future work includes the development of further monochromators for different fixed energies, including Ti K, Fe K, and Au L and ; implementation of computer-controlled, motorized positioning for the crystals; and use of bright, water cooled x-ray generators with large anode spots, together with broad channels cut in the crystals. The latter is particularly important for the Athena X-IFU and other instruments featuring large arrays of calorimeter pixels, so that much or all of the array may be simultaneously illuminated, allowing for more efficient use of limited calibration time. Many of these features have been implemented and are undergoing performance testing in our laboratory.
Acknowledgements.
We thank two anonymous referees for providing insightful comments that significantly helped the clarity and presentation of this article. We thank T. Okajima for use of the x-ray reflectometer, and members of the GSFC x-ray calorimeter research groups for the results presented in Figures 12-14. This work was supported by NASA’s Astrophysics Division. Part of this work was performed under the auspices of the U.S. Department of Energy by Lawrence Livermore National Laboratory under Contract DE-AC52-07NA27344.Data Availability Statement
The data that support the findings of this study are available from the corresponding author upon reasonable request.
References
- Moseley, Mather, and McCammon (1984) S. H. Moseley, J. C. Mather, and D. McCammon, “Thermal detectors as x-ray spectrometers,” Journal of Applied Physics 56, 1257–1262 (1984).
- Eckart et al. (2018) M. E. Eckart, J. S. Adams, K. R. Boyce, G. V. Brown, M. P. Chiao, R. Fujimoto, D. Haas, J.-W. den Herder, A. Hoshino, Y. Ishisaki, C. A. Kilbourne, S. Kitamoto, M. A. Leutenegger, D. McCammon, K. Mitsuda, F. S. Porter, K. Sato, M. Sawada, H. Seta, G. A. Sneiderman, A. E. Szymkowiak, Y. Takei, M. S. Tashiro, M. Tsujimoto, C. P. de Vries, T. Watanabe, S. Yamada, and N. Y. Yamasaki, “Ground calibration of the Astro-H (Hitomi) soft x-ray spectrometer,” Journal of Astronomical Telescopes, Instruments, and Systems 4, 021406 (2018).
- Leutenegger et al. (2018) M. A. Leutenegger, M. Audard, K. R. Boyce, G. V. Brown, M. P. Chiao, M. E. Eckart, R. Fujimoto, A. Furuzawa, M. Guainazzi, D. Haas, T. Hayashi, J.-W. den Herder, R. Iizuka, M. Ishida, Y. Ishisaki, N. Kikuchi, C. A. Kilbourne, S. Koyama, S. Kurashima, Y. Maeda, M. Markevitch, D. McCammon, K. Mitsuda, H. Mori, N. Nakaniwa, T. Okajima, S. Paltani, R. Petre, F. S. Porter, K. Sato, T. Sato, M. Sawada, P. J. Serlemitsos, H. Seta, G. Sneiderman, Y. Soong, S. Sugita, A. E. Szymkowiak, Y. Takei, M. Tashiro, Y. Tawara, M. Tsujimoto, C. P. de Vries, T. Watanabe, S. Yamada, and N. Yamasaki, “In-flight verification of the calibration and performance of the ASTRO-H (Hitomi) Soft X-ray Spectrometer,” Journal of Astronomical Telescopes, Instruments, and Systems 4, 021407 (2018).
- Smith et al. (2012) S. J. Smith, J. S. Adams, C. N. Bailey, S. R. Band ler, J. A. Chervenak, M. E. Eckart, F. M. Finkbeiner, R. L. Kelley, C. A. Kilbourne, F. S. Porter, and J. E. Sadleir, “Small Pitch Transition-Edge Sensors with Broadband High Spectral Resolution for Solar Physics,” Journal of Low Temperature Physics 167, 168–175 (2012).
- Porst et al. (2014) J.-P. Porst, S. R. Bandler, J. S. Adams, M. A. Balvin, S. E. Busch, M. E. Eckart, R. L. Kelley, C. A. Kilbourne, S. J. Lee, P. C. Nagler, F. S. Porter, J. E. Sadleir, G. M. Seidel, S. J. Smith, and T. R. Stevenson, “Characterization and Performance of Magnetic Calorimeters for Applications in X-ray Spectroscopy,” Journal of Low Temperature Physics 176, 617–623 (2014).
- Lee et al. (2015) S. J. Lee, J. S. Adams, S. R. Bandler, J. A. Chervenak, M. E. Eckart, F. M. Finkbeiner, R. L. Kelley, C. A. Kilbourne, F. S. Porter, J. E. Sadleir, S. J. Smith, and E. J. Wassell, “Fine pitch transition-edge sensor X-ray microcalorimeters with sub-eV energy resolution at 1.5 keV,” Applied Physics Letters 107, 223503 (2015).
- Doriese et al. (2017) W. B. Doriese, P. Abbamonte, B. K. Alpert, D. A. Bennett, E. V. Denison, Y. Fang, D. A. Fischer, C. P. Fitzgerald, J. W. Fowler, J. D. Gard, J. P. Hays-Wehle, G. C. Hilton, C. Jaye, J. L. McChesney, L. Miaja-Avila, K. M. Morgan, Y. I. Joe, G. C. O’Neil, C. D. Reintsema, F. Rodolakis, D. R. Schmidt, H. Tatsuno, J. Uhlig, L. R. Vale, J. N. Ullom, and D. S. Swetz, “A practical superconducting-microcalorimeter X-ray spectrometer for beamline and laboratory science,” Review of Scientific Instruments 88, 053108 (2017).
- Kempf et al. (2018) S. Kempf, A. Fleischmann, L. Gastaldo, and C. Enss, “Physics and applications of metallic magnetic calorimeters,” Journal of Low Temperature Physics 193, 365–379 (2018).
- Durkin et al. (2019) M. Durkin, J. S. Adams, S. R. Bandler, J. A. Chervenak, S. Chaudhuri, C. S. Dawson, E. V. Denison, W. B. Doriese, S. M. Duff, F. M. Finkbeiner, C. T. FitzGerald, J. W. Fowler, J. D. Gard, G. C. Hilton, K. D. Irwin, Y. I. Joe, R. L. Kelley, C. A. Kilbourne, A. R. Miniussi, K. M. Morgan, G. C. O’Neil, C. G. Pappas, F. S. Porter, C. D. Reintsema, D. A. Rudman, K. Sakai, S. J. Smith, R. W. Stevens, D. S. Swetz, P. Szypryt, J. N. Ullom, L. R. Vale, N. A. Wakeham, J. C. Weber, and B. A. Young, “Demonstration of Athena X-IFU Compatible 40-Row Time-Division-Multiplexed Readout,” IEEE Transactions on Applied Superconductivity 29, 2101005 (2019).
- Hölzer et al. (1997) G. Hölzer, M. Fritsch, M. Deutsch, J. Härtwig, and E. Förster, “K1,2 and K1,3 x-ray emission lines of the 3d transition metals,” Phys. Rev. A 56, 4554–4568 (1997).
- Hölzer (2004) G. Hölzer, Private Communcation to F.S. Porter (2004).
- Eckart et al. (2019) M. E. Eckart, J. S. Adams, S. R. Bandler, S. Beaumont, J. A. Chervenak, A. M. Datesman, F. M. Finkbeiner, R. Hummatov, R. L. Kelley, C. A. Kilbourne, M. A. Leutenegger, A. R. Miniussi, S. J. Moseley, F. S. Porter, J. E. Sadleir, K. Sakai, S. J. Smith, N. A. Wakeham, and E. J. Wassell, “Extended Line Spread Function of TES Microcalorimeters With Au/Bi Absorbers,” IEEE Transactions on Applied Superconductivity 29, 2903420 (2019).
- DuMond (1937) J. W. M. DuMond, “Theory of the use of more than two successive x-ray crystal reflections to obtain increased resolving power,” Phys. Rev. 52, 872–883 (1937).
- Beaumont and Hart (1974) J. H. Beaumont and M. Hart, “Multiple Bragg reflection monochromators for synchrotron x radiation,” Journal of Physics E Scientific Instruments 7, 823–829 (1974).
- Bartels (1983) W. J. Bartels, “Characterization of thin layers on perfect crystals with a multipurpose high resolution x-ray diffractometer,” Journal of Vacuum Science Technology B: Microelectronics and Nanometer Structures 1, 338–345 (1983).
- Note (1) Oxford Instruments X-ray Technology, Scotts Valley, CA 95066, USA.
- Note (2) Crystal Scientific (UK) Ltd, Middle Barton, Whittingham, Alnwick, Northumberland, NE66 4SU, United Kingdom.
- Stepanov et al. (1998) S. A. Stepanov, E. A. Kondrashkina, R. Köhler, D. V. Novikov, G. Materlik, and S. M. Durbin, “Dynamical x-ray diffraction of multilayers and superlattices: Recursion matrix extension to grazing angles,” Phys. Rev. B 57, 4829–4841 (1998).
- Note (3) Please see this URL for access to GID_SL: http://x-server.gmca.aps.anl.gov/GID_sl.html.
- Mori et al. (2018) H. Mori, T. Okajima, W. W. Zhang, K.-W. Chan, R. Koenecke, J. R. Mazzarella, A. Numata, L. G. Olsen, R. E. Riveros, and M. Yukita, “Reflective coatings for the future x-ray mirror substrates,” in Proc. SPIE, Vol. 10699 (2018) pp. 1012 – 1019.
- Note (4) Henkel Corporation Aerospace, 2850 Willow Pass Road, Bay Point, CA 94565, USA.
- Note (5) Amptek Inc., 14 DeAngelo Drive, Bedford, MA 01730, USA.
- Eckart et al. (2013) M. E. Eckart, J. S. Adams, S. R. Bandler, S. E. Busch, J. A. Chervenak, A. J. Ewin, F. M. Finkbeiner, R. L. Kelley, C. A. Kilbourne, F. S. Porter, J.-P. Porst, J. E. Sadleir, S. J. Smith, E. J. Wassell, and E. Figueroa-Feliciano, “Development of TES Microcalorimeter Arrays for the Micro-X Sounding Rocket Experiment,” IEEE Transactions on Applied Superconductivity 23, 2101705 (2013).
- Adams et al. (2020) J. S. Adams, R. Baker, S. R. Bandler, N. Bastidon, M. E. Danowski, W. B. Doriese, M. E. Eckart, E. Figueroa-Feliciano, D. C. Goldfinger, S. N. T. Heine, G. C. Hilton, A. J. F. Hubbard, R. L. Kelley, C. A. Kilbourne, R. E. Manzagol-Harwood, D. McCammon, T. Okajima, F. S. Porter, C. D. Reintsema, P. Serlemitsos, S. J. Smith, J. N. Ullom, and P. Wikus, “First operation of TES microcalorimeters in space with the micro-x sounding rocket,” Journal of Low Temperature Physics 199, 1062–1071 (2020).
- Smith et al. (2016) S. J. Smith, J. S. Adams, S. R. Bandler, G. L. Betancourt-Martinez, J. A. Chervenak, M. P. Chiao, M. E. Eckart, F. M. Finkbeiner, R. L. Kelley, C. A. Kilbourne, A. R. Miniussi, F. S. Porter, J. E. Sadleir, K. Sakai, N. A. Wakeham, E. J. Wassell, W. Yoon, D. A. Bennett, W. B. Doriese, J. W. Fowler, G. C. Hilton, K. M. Morgan, C. G. Pappas, C. N. Reintsema, D. S. Swetz, J. N. Ullom, K. D. Irwin, H. Akamatsu, L. Gottardi, R. den Hartog, B. D. Jackson, J. van der Kuur, D. Barret, and P. Peille, “Transition-edge sensor pixel parameter design of the microcalorimeter array for the x-ray integral field unit on Athena,” in Proc. SPIE, Vol. 9905 (2016) pp. 772 – 790.
- Barret et al. (2018) D. Barret, T. Lam Trong, J.-W. den Herder, L. Piro, M. Cappi, J. Houvelin, R. Kelley, J. M. Mas-Hesse, K. Mitsuda, S. Paltani, G. Rauw, A. Rozanska, J. Wilms, S. Bandler, M. Barbera, X. Barcons, E. Bozzo, M. T. Ceballos, I. Charles, E. Costantini, A. Decourchelle, R. den Hartog, L. Duband, J.-M. Duval, F. Fiore, F. Gatti, A. Goldwurm, B. Jackson, P. Jonker, C. Kilbourne, C. Macculi, M. Mendez, S. Molendi, P. Orleanski, F. Pajot, E. Pointecouteau, F. Porter, G. W. Pratt, D. Prêle, L. Ravera, K. Sato, J. Schaye, K. Shinozaki, T. Thibert, L. Valenziano, V. Valette, J. Vink, N. Webb, M. Wise, N. Yamasaki, F. Douchin, J.-M. Mesnager, B. Pontet, A. Pradines, G. Branduardi-Raymont, E. Bulbul, M. Dadina, S. Ettori, A. Finoguenov, Y. Fukazawa, A. Janiuk, J. Kaastra, P. Mazzotta, J. Miller, G. Miniutti, Y. Naze, F. Nicastro, S. Scioritino, A. Simonescu, J. M. Torrejon, B. Frezouls, H. Geoffray, P. Peille, C. Aicardi, J. André, C. Daniel, A. Clénet, C. Etcheverry, E. Gloaguen, G. Hervet, A. Jolly, A. Ledot, I. Paillet, R. Schmisser, B. Vella, J.-C. Damery, K. Boyce, M. Dipirro, S. Lotti, D. Schwander, S. Smith, B.-J. Van Leeuwen, H. van Weers, N. Clerc, B. Cobo, T. Dauser, C. Kirsch, E. Cucchetti, M. Eckart, P. Ferrando, and L. Natalucci, “The ATHENA X-ray Integral Field Unit (X-IFU),” in Proc. SPIE, Vol. 10699 (2018) pp. 324–328.
- Pajot et al. (2018) F. Pajot, D. Barret, J.-W. den Herder, M. Barbera, N. Webb, K. Mitsuda, S. Paltani, C. Kilbourne, M. Cappi, F. Douchin, J. Wilms, L. Piro, L. Valenziano, . Gregor Rauw, R. Kelley, T. Lam-Trong, J. Huovelin, J. M. Mas-Hesse, A. Rozanska, H. Geoffray, R. Den Hartog, C. Macculi, J.-M. Mesnager, and P. Peille, “High resolution imaging X-ray spectroscopy: the X-IFU instrument on Athena,” in 42nd COSPAR Scientific Assembly (2018).
- Iwakiri et al. (2016) W. B. Iwakiri, J. K. Black, R. Cole, T. Enoto, A. Hayato, J. E. Hill, K. Jahoda, P. Kaaret, T. Kitaguchi, M. Kubota, H. Marlowe, R. McCurdy, Y. Takeuchi, and T. Tamagawa, “Performance of the PRAXyS X-ray polarimeter,” Nuclear Instruments and Methods in Physics Research A 838, 89–95 (2016).
- Yang, Penner-Hahn, and Stefan (1990) C. Y. Yang, J. E. Penner-Hahn, and P. M. Stefan, “NSLS X-19A beamline performance for X-ray absorption measurements,” Nuclear Instruments and Methods in Physics Research A 291, 157–161 (1990).