Disc fragmentation and oligarchic growth of protostellar systems in low-metallicity gas clouds
Abstract
We study low-metallicity star formation with a set of high-resolution hydrodynamics simulations for various gas metallicities over a wide range –. Our simulations follow non-equilibrium chemistry and radiative cooling by adopting realistic elemental abundance and dust size distribution. We examine the condition for the fragmentation of collapsing clouds (cloud fragmentation; CF) and of accretion discs (disc fragmentation; DF). We find that CF is suppressed due to rapid gas heating accompanied with molecular hydrogen formation even with efficient dust cooling for metallicities . Instead, DF occurs in almost all runs regardless of metallicity. We also find that, in the accretion discs, the growth of the protostellar systems is overall oligarchic. The primary protostar grows through the accretion of gas, and secondary protostars form through the interaction of spiral arms or the break-up of a rapidly rotating protostar. Despite vigorous fragmentation, a large fraction of secondary protostars are destroyed through mergers or tidal disruption events. For a few hundred years after the first adiabatic core formation, only several protostars survive in the disc, and the total mass of protostars is –.
keywords:
galaxies: evolution — ISM: abundances — stars: formation — stars: low-mass — stars: Population III — stars: Population II1 INTRODUCTION
The standard cosmological model (cold dark matter model) predicts that the cosmic structure forms hierarchically from small to large systems (e.g. Audouze & Silk, 1995). According to the model, the first generation of metal-free (Population III; Pop III) stars form in low-mass dark matter halos (minihalos) with – at redshift – (Yoshida et al. 2003). The second generation of metal-poor (Population II; Pop II) stars form from interstellar gas that is chemically enriched by the first supernovae (SNe). Pop III/II stars play an important role in the early phase of galaxy formation. Massive stars can emit ultraviolet (UV) photons and suppress star formation, whereas their SN explosions can enrich the interstellar medium (ISM) with metals/grains that can enhance gas cooling and star formation. The stellar mass is crucial to determine the rate of UV emission and the total mass of synthesized heavy elements, but the characteristic mass of Pop III and Pop II stars is poorly known.
Observations of long-lived stars give constraints on the lower bound of the initial mass functions (IMFs) of Pop III/II stars because only stars with masses smaller than can survive over 10 Gyr until the present day. So far, no stars with carbon abundances or iron abundances have been observed (Yoon et al., 2016, 2018; Placco et al., 2018),111The abundance ratio of an element A to B is conventionally written as where is the absolute abundance of A, and is the number abundance of A relative to hydrogen nuclei. Throughout this paper, we use the solar abundance of Asplund et al. (2009). which may suggest that the transition of the typical stellar mass occurs from massive Pop III to Pop II stars.
Motivated by the recent observations, researchers have proposed theoretical models of low-mass, low-metallicity star formation. The fragmentation of gas is a key physical process to reduce the mass scale of finally forming stars. Chiaki et al. (2016, hereafter C16) found that there are two distinctive modes of fragmentation: the fragmentation of collapsing clouds (cloud fragmentation; CF) and of accretion discs (disc fragmentation; DF), and that these modes occur in two different phases of star formation.
In the first phase, called the collapsing phase, an interstellar gas cloud contracts in a run-away manner through its self-gravity. Linear analyses show that, for the gas following an equation of state (EOS) with a polytropic index , perturbations on a spherically collapsing cloud grow unstably, and filamentary structures develop for (Hanawa & Matsumoto, 2000; Lai, 2000). When density fluctuations on the filaments grow sufficiently, multiple clumps appear on the filamentary cloud, leading CF (Tsuribe & Omukai, 2006). It has been suggested that gas cooling through dust thermal emission is the important cooling process even with very low metallicities (Omukai, 2000; Schneider et al., 2003; Omukai et al., 2005; Dopcke et al., 2011; Safranek-Shrader et al., 2014; Smith et al., 2015).
After the gas in the cloud center becomes optically thick, it can no longer collapse because of inefficient cooling but grows by accreting mass through an accretion disc. This second phase of star formation is called the accretion phase. In general, the accretion disc is gravitationally unstable, and thus DF occurs (Clark et al., 2011; Greif et al., 2012; Hosokawa et al., 2016).
So far, theoreticians have mostly focused on CF in the collapsing phase. In hydrodynamics simulations, time-stepping is severely limited by the so-called Courant conditions in very dense protostellar regions. It is costly to follow the long-term evolution of over yr in the accretion phase up to the point when the majority of protostars reach their zero-age main-sequence (ZAMS). With a semi-analytic -disc model, Tanaka & Omukai (2014) showed that DF is an important physical mechanism for the formation of low-mass stars with metallicities –. More recently, with increasing computational power, several authors successfully follow the evolution of protostellar systems in low-metallicity accretion discs. They report that low-mass secondary protostars with masses – form both in primordial discs (Clark et al., 2011; Greif et al., 2012; Susa et al., 2014; Hirano & Bromm, 2017; Inoue & Yoshida, 2020) and in low-metallicity discs with – (Machida & Nakamura, 2015; Chiaki et al., 2016; Chon, Omukai, & Schneider, 2021).
Interestingly, binary systems with iron abundances (a proxy of metallicities) are discovered with recent stellar radial velocity measurements (Arentsen et al., 2019). Schlaufman et al. (2018) report an ultra metal-poor star binary, 2MASS J180820025104378 with a metallicity . From its small binary separation (0.2 au), we can speculate that such a system can form through DF because the typical separation of fragments for CF is au (Chiaki et al., 2016) while that for DF is au (Machida & Nakamura, 2015; Greif et al., 2012).
There still remain technical limitations in numerical simulations of disc evolution. In order to follow the long-term evolution of the accretion phase, researchers often employ the following two technical methods. In the first method, called the sink particle method, dense regions are replaced with Lagrangian particles. The mass of a sink particle is estimated from the amount of gas accreted into a sphere with a certain accretion radius. In the second method, a stiff EOS is assumed in dense regions to prevent further contraction of gas (Machida & Nakamura, 2015; Hirano & Bromm, 2017). With the sink particle technique, recent numerical studies have successfully followed the entire evolution of accretion discs (Fukushima et al., 2020; Sugimura et al., 2020), but further complicated modelling is required to reproduce the following processes that control the multiplicity of protostars (e.g. Wollenberg et al., 2020). Mergers of protostars can efficiently reduce the number of protostars (e.g., Susa, 2019). A rapidly rotating protostar acquiring angular momentum from accreted gas can eventually break up into two protostars (Lyttleton, 1953; Chandrasekhar, 1962, 1965; Eriguchi et al., 1982). With the stiff EOS method, although we can follow only – yr of the evolution even with currently available computational resources (Greif et al., 2012; Machida & Nakamura, 2015; Hirano & Bromm, 2017), this method can accurately reproduce the relevant physical processes, such as mergers and the break-up of protostars.
In our previous work (C16), we performed a series of numerical simulations of low-metallicity star formation within cosmological minihalos by adopting a stiff EOS technique. We found that two distinct modes of fragmentation (CF and DF) occur for different initial conditions. However, in C16, with the smoothed particle hydrodynamics (SPH) scheme, the local Jeans length was only marginally resolved by 10 smoothing lengths. It is known that, if a contracting gas cloud is not sufficiently resolved, spurious fragmentation may occur (Truelove et al., 1997, 1998). In addition, we followed the disc evolution only up to 50 years after the first adiabatic core formation. Although CF occurs along dense thin filaments in some runs, the filaments and fragments are quickly accreted onto the most massive protostar. In order to determine whether the filaments and fragments are disrupted or not, it is necessary to follow the longer evolution of the protostellar systems.
In this work, we run simulations of collapsing gas clouds and accretion discs for two cosmological MHs with a wide range of gas metallicities –. As C16, we adopt metal and dust abundances and the dust size distribution obtained from nucleosynthesis and nucleation models for a Pop III SN (Umeda & Nomoto, 2002; Nozawa et al., 2007). Our numerical model considers all relevant radiative cooling processes and chemical reactions together with grain chemistry. Compared to C16, we perform higher-resolution simulations to follow the fragmentation of clouds and accretion discs more accurately. Also, we follow the evolution of protostellar systems for a longer time of over a few hundred years using a similar stiff EOS technique. The structure of the paper is as follows. In Section 2, we describe our numerical method and chemical models. Section 3 shows the results of the simulations. We discuss the limitations of our simulations in Section 4 and conclude this paper in Section 5.
2 Numerical models
We perform simulations using a moving-mesh/-body code arepo (Springel, 2010). We use two small-mass halos (minihalos; MHs) extracted from a parent cosmological simulation of Hirano et al. (2014). We add heavy elements in the gas and follow their condensation until the gas density reaches . Instead of using sink particles, we assume a stiff EOS in dense regions to prevent further collapse and density increase.
| Halo | |||||
|---|---|---|---|---|---|
| [pc] | [] | [] | [] | ||
| A | |||||
| B |
Note — is the formation redshifts. and are the virial radius and mass, respectively. and are the virial mass of the dark matter and baryon components, respectively.
| Halo | ||||||||||
|---|---|---|---|---|---|---|---|---|---|---|
| [yr] | [] | [] | [K] | [] | [] | [K] | ||||
| A | 400 | 3 | 3 | 0.521 | 278 | |||||
| 200 | 3 | 3 | 0.567 | 466 | ||||||
| 200 | 7 | 3 | 1.03 | 696 | ||||||
| 200 | 5 | 3 | 1.41 | 855 | ||||||
| 200 | 13 | 3 | 2.60 | 1287 | ||||||
| B | 200 | 2 | 2 | 1.42 | 862 | |||||
| 100 | 10 | 4 | 1.88 | 1647 | ||||||
| 100 | 9 | 3 | 1.49 | 1408 | ||||||
| 100 | 4 | 1 | 5.62 | 3416 | ||||||
| 100 | 26 | 5 | 3.77 | 2620 |
Note — is the disc mass at the time . is the average mass accretion rate onto the discs during . The temperature of the accreted gas onto the discs is calculated from . is the total number of protostars including destroyed ones during . and are the number and the total mass of protostars surviving at the time . is the average mass accretion rate during . The temperature of the accreted gas onto the protostars is calculated from .
2.1 Simulation setup


The parent cosmological simulation of Hirano et al. (2014) is carried out with SPH/-body simulation code gadget-2 (Springel, 2005). The simulation box size is comoving Mpc, and the standard CDM cosmology is adopted (Komatsu et al., 2011). The regions of star-forming gas clouds are zoomed-in progressively, and the resulting DM and gas particle masses are and , respectively.
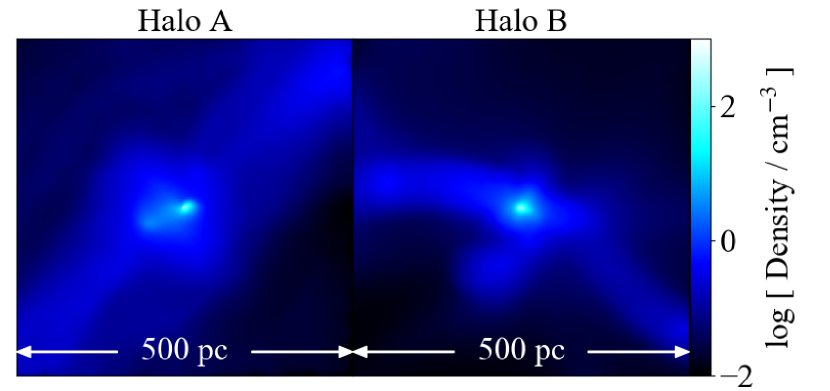
A total of MHs are identified, out of which we choose two distinctive ones hereafter called Halo A and B.222 Halo A is the same as the one used in Chiaki & Yoshida (2015). Halo A and B are the same as MH3 and MH1 in C16, respectively. In C16, we showed that the density structure and fragmentation property depends not only on metallicity but also on the collapsing timescale of clouds. Halo A and B have respectively longest and shortest collapsing timescales and among 100 MHs investigated in Hirano et al. (2014), where is the -folding time for the growth of density for an isothermal cloud.333We show the collapse timescale in units of instead of the commonly used free-fall time because is more appropriate for a cloud with pressure support. We summarize the properties of Halo A and B in Table 1. Halo A collapses at redshift , and the total mass within the virial radius pc is . Halo B forms at redshift 20.46, and its virial radius and mass are pc and , respectively. At the formation epoch, we cut out a cubic region around each MH with a side length of 1.15 kpc with periodic boundaries. Since the average and maximum gas densities in the boxes are and , respectively, the dynamical timescale in the cloud center is shorter than the average by two orders of magnitude. Hence the dynamics at the box boundaries does not affect the cloud collapse.
To mimick a cloud enriched by a Pop III SN, we consider the elemental abundance ratio and dust size distribution taken from a Pop III SN model of Nozawa et al. (2007) (see Section 2.5). We inject metals and grains uniformly in the entire simulation box for simplicity. Note that metal abundances have deviation of dex at – pc from the center of enriched clouds as recent cosmological simulations have shown (Smith et al., 2015; Chiaki & Wise, 2019; Chiaki et al., 2020).
In arepo, gravitational force is calculated with a tree method. The gravitational softening length for dark matter particles is fixed to 1.14 pc in all our simulations. For the gas component, each computational cell is defined by the Voronoi diagram. The physical quantities of a gas cell are calculated with a finite-volume method and updated with the fluxes across the cell boundaries. The gravity softening length of a gas cell is , where is the effective cell radius, and and are mass and density of a cell , respectively.
During the early collapsing phase, the local Jeans length progressively decreases. It is known that spurious fragmentation occurs if the Jeans length is not sufficiently resolved (Truelove et al., 1997, 1998). To avoid this, we impose the so-called Jeans criterion for cell refinement so that a local Jeans length is always resolved by more than 32 cells. A cell which violates the criterion is divided into two cells. Inversely, to reduce the computational cost, we derefine gas cells with . A cell which satisfies the criterion is just removed, and Voronoi mesh is reconstructed with remaining mesh-generating points. At a density , the minimum size and mass of a gas cell become au and (0.03 Earth masses), respectively.
Note that the self-gravity of gas is smoothed out at the length beyond the radius of a gas cell (), and this might affect the calculation of gravitational potential. In particular, in the dense cores where we impose a stiff EOS (Section 2.3), the number of gas cells are further reduced due to derefinement, which might cause errors in the resulting morphology or orbital motion of protostars.
2.2 Chemistry and cooling
We solve all relevant chemical reactions and radiative cooling/chemical heating processes in a self-consistent manner. We here use a chemistry/cooling library grackle for the usage in general hydro-codes (Smith et al., 2017). 444https://grackle.readthedocs.io/. In Chiaki & Wise (2019), we have developed this library by supplying with metal/dust chemistry together with the growth of dust grains (grain growth) through accretion of gas-phase metal molecules onto grains. It includes large chemical reaction networks of 100 reactions of 38 gas-phase species: , , , , , , , , , , , , , , , C+, C, CH, CH2, CO+, CO, CO2, O+, O, OH+, OH, H2O+, H2O, H3O+, O, O2, Mg, Al, Si, SiO, SiO2, S, and Fe, and 10 grain species: metallic silicon (Si), metallic iron (Fe), forsterite (Mg2SiO4), enstatite (MgSiO3), magnetite (Fe3O4), amorphous carbon (C), silica (SiO2), magnesia (MgO), troilite (FeS), and alumina (Al2O3) with their compositions in the parentheses. For the cells with densities , we do not update the abundances of the chemical species.
Our chemistry model includes the collisional ionization/recombination of H, D, He, C and O. It also includes the formation of H2 through the H--process (Peebles & Dicke, 1968; Hirasawa, Aizu, & Taketani, 1969), H process (Saslaw & Zipoy, 1967) and three-body reactions (Palla, Salpeter, & Stahler, 1983). We consider chemical heating and cooling associated with H2 formation and destruction through the release and absorption of the binding energy of 4.48 eV per molecule, following the formulation of Hollenbach & McKee (1979). Our radiative cooling model considers ro-vibrational transition line cooling of H2 and HD as well as rotational cooling of CO, OH and H2O (Neufeld & Kaufman, 1993; Neufeld et al., 1995; Omukai et al., 2010). We also calculate the rates of continuum cooling due to dust thermal emission (Chiaki et al., 2015) and collisionally induced emission (CIE) from H2 molecules (Yoshida et al., 2006).
As the fraction of H2 molecules increases, the specific heat ratio for the adiabatic gas varies from to the value for the molecular gas. At temperatures higher than K, degrees of freedom of the thermal motion of gas particles are partially converted to vibrational degrees of freedom of molecules. We use a fitting function of as
| (1) |
where (Landau & Lifshitz, 1980). Then, we calculate as
| (2) |
where is the number density of a species , and for atoms, ions and electrons. We only consider the contribution of primordial species because the number fraction of other species are negligible (at most for O atoms). The mass fraction of each chemical species is treated as a passive scalar. The advection of all chemical species is calculated from fluxes across each cell interface.
We consider all relevant dust physics: gas cooling from dust thermal emission, H2 formation on grain surfaces, grain growth and photon absorption. The rates of these processes depend on the size distribution of grains. We can obtain these rates from the mass fraction of grains integrated over size under the following two approximations valid in molecular clouds. First, the growth rate of grains does not depend on the grain radius when grain charge can be ignored (Nozawa et al., 2012). Second, the number density of grain seeds is constant in molecular clouds, where the formation/destruction of grains is negligible (Hirashita & Omukai, 2009). Under the approximation, we obtain
| (3) |
where is the ’th momentum of the initial size distribution normalized to the unity (Kozasa & Hasegawa, 1987). With this equation, we can derive the size increment from the mass fraction of the grain. The initial values (–3) and are given by our Pop III SN model. This method gives the exact solution of under the above approximations in each gas cell, but advection may cause an error due to the mixing of grains with different size distributions between adjacent cells. We have confirmed that the result of three-dimensional simulations with our chemistry solver is consistent with one-zone calculations (Appendix B of Chiaki & Wise, 2019).
The dust temperature is calculated from the balance between the rate of collisional heat transfer from hot gas to cold grains
| (4) |
and the rate of dust thermal emission
| (5) |
of the -th grain species with radius , where is the thermal velocity of gas, is the Stephan-Boltzmann constant, is the Planck-mean of the grain absorption coefficient, and is the escape fraction of continuum radiation. We calculate the rate of gas cooling as .
2.3 Stiff EOS
The computational timestep decreases with increasing density. To follow the evolution of an accretion disc after optically-thick cores (protostars) form at densities , we prevent density increase by adopting a stiff EOS technique. We force the gas to follow a polytropic EOS at densities above instead of solving chemistry/cooling. We set
| (6) |
so that increases gradually from the adiabatic index 1.4 of the molecular gas to 4.0. The choice of the value 4.0 is motivated from a particular EOS that reproduces the mass-radius relation of protostars (Machida & Nakamura, 2015). Hereafter we call a region with densities as a “protostar”.555 In reality, at higher densities –, gas thermal energy is partly consumed to H2 dissociation. This chemical gas cooling induces second collapse until all H2 molecules are consumed. At that time the gas again collapses adiabatically and a hydrostatic core forms. The core hosted by the first core is defined as a protostar (Larson, 1969).
Here, we use the time to measure the evolution of a protostellar system. The origin of is the time when the maximum density among gas cells first reaches . We terminate our simulations at – yr depending on the runs (see Table 2). We follow longer evolution for larger metallicity and for Halo A because its accretion timescale is longer than Halo B.
2.4 Cloud fragmentation vs. Disk fragmentation
We can expect that the two fragmentation modes, CF and DF, occur in our simulations as we found in C16. To discriminate one from the other, we estimate the orbital rotational velocity of each protostar with respect to the center of the mass of the system, , in units of Kepler velocity at the formation time of a protostar, where is the total mass of protostars, and is the distance between the protostar to the center of mass of the protostellar system. Generally, CF occurs in a cloud envelope with (Hirano et al., 2014) while DF occurs in a rotationally supported disc with . Therefore, we regard that the protostar forms through CF if or DF otherwise.
2.5 Initial metal/dust properties
We adopt realistic metal/dust properties (abundances of heavy elements and grain species and dust size distribution) taken from nucleosynthesis and nucleation models of a Pop III SN (Umeda & Nomoto, 2002; Nozawa et al., 2007). We assume a progenitor mass motivated by recent simulations. The local maximum of Pop III stellar mass distribution is at (Susa et al., 2014; Hirano et al., 2014). Also, the elemental abundance ratios of metal-poor stars best fit with progenitor models with – (Ishigaki et al., 2018).
Fig. 2a shows the abundances of heavy elements in total of the gas and solid phases. This model reproduces the enhancement of elements such as O, Mg, and Si, of EMP stars although is higher than the typical value of EMP stars (). In this model, the oxygen abundance relative to iron is . We expect that radiative cooling by O-bearing molecules OH and H2O affect the cloud fragmentation as suggested by C16. From the relative abundance of carbon to iron , the stars will be classified to C-normal stars by a definition of C-enhanced metal-poor (CEMP) stars (; Aoki et al., 2007).
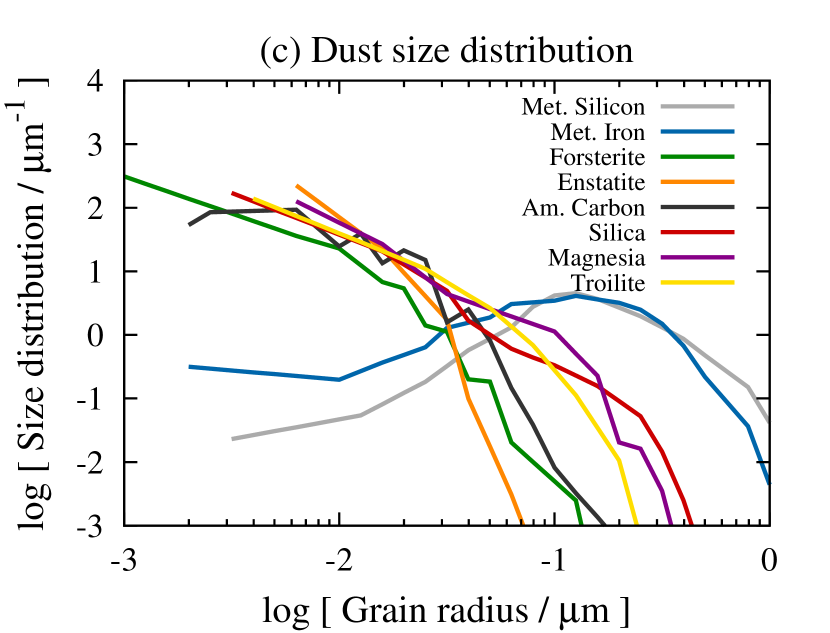
Fig. 2b and c show the initial abundances and size distribution of grain species, respectively, in our progenitor model. Typically, grains form in the expanding ejecta a few hundred days after the SN explosion (Nozawa et al., 2003). All refractory elements such as Mg, Si, and Fe are locked up into grains as in the local ISM. At yr after the explosion, reverse shocks start propagating backwards into ejecta. Between the forward and reverse shocks, high energy ions sputter the newly forming grains, and the mass fraction of metals locked up into grains decreases. The efficiency of grain destruction depends on the ambient gas density (Nozawa et al., 2007; Bianchi & Schneider, 2007). We here consider the grain destruction model with because the typical gas density of an H ii region created by a progenitor Pop III star is – (Kitayama et al., 2004; Whalen et al., 2004, 2008). The dust-to-metal mass ratio is smaller in this model (3.95%) than in the local ISM % (Pollack et al., 1994).
The absolute amount of metals is given by the total mass fraction of all elements heavier than He. For a metallicity , the carbon and iron abundances in our progenitor model are
| (7) | |||||
| (8) | |||||
The abundance of an element is calculated as
| (9) |
where and are mass of and metals ejected from the SN, respectively, and is molecular weight of element ( and ). We assume the primordial hydrogen mass fraction and give metallicities in units of solar metallicity .
Hereafter, our runs with different halos and metallicities are described as the combination of ids of halos {HA, HB} and metallicities {Z0, Z-6, Z-5, Z-4, Z-3}. For example, the run HAZ-4 indicates the run for Halo A and a metallicity .
3 Results
3.1 Overview
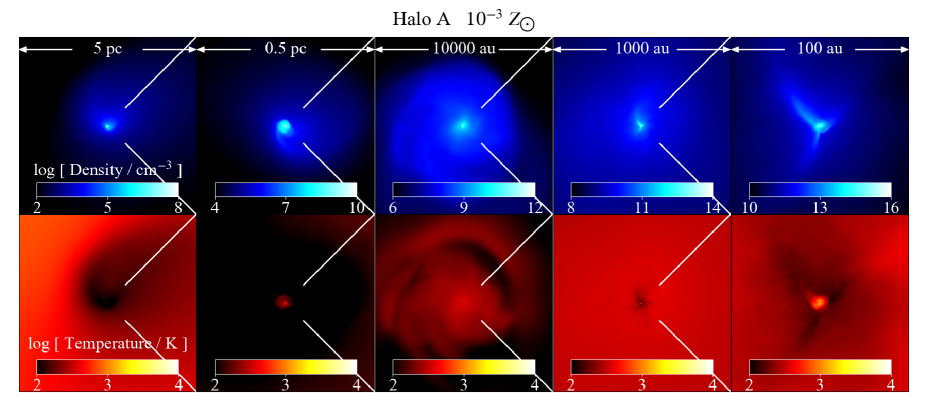
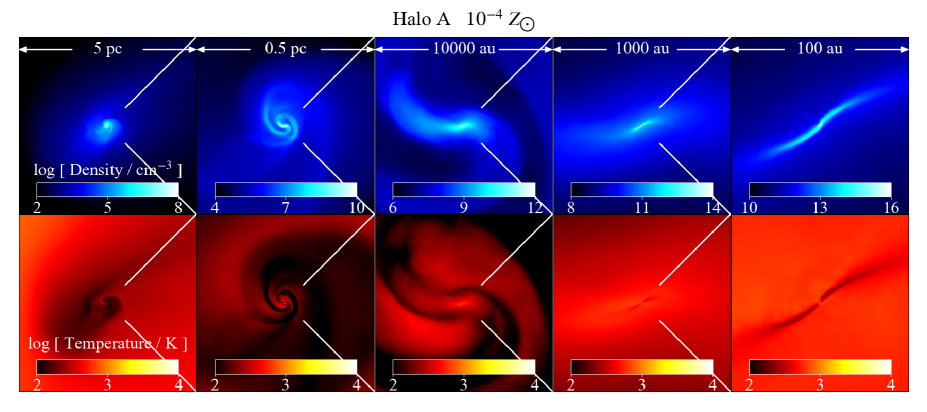
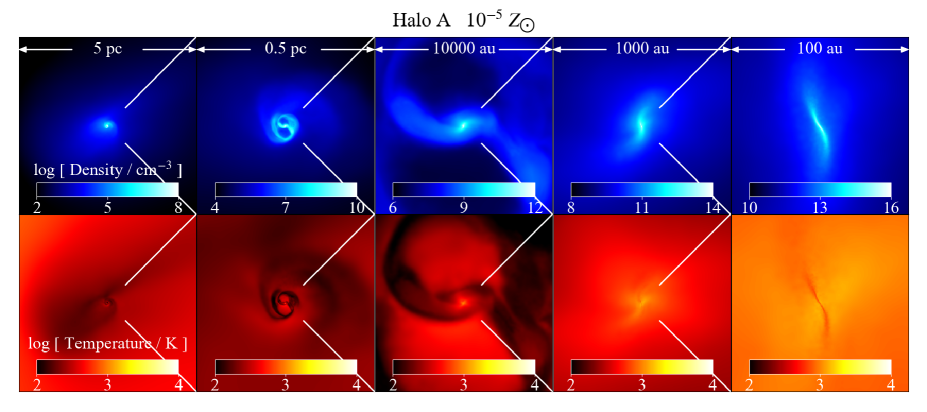
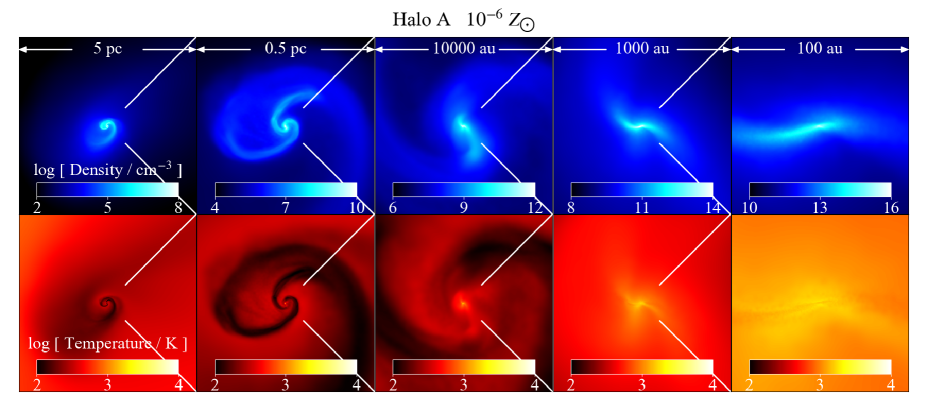
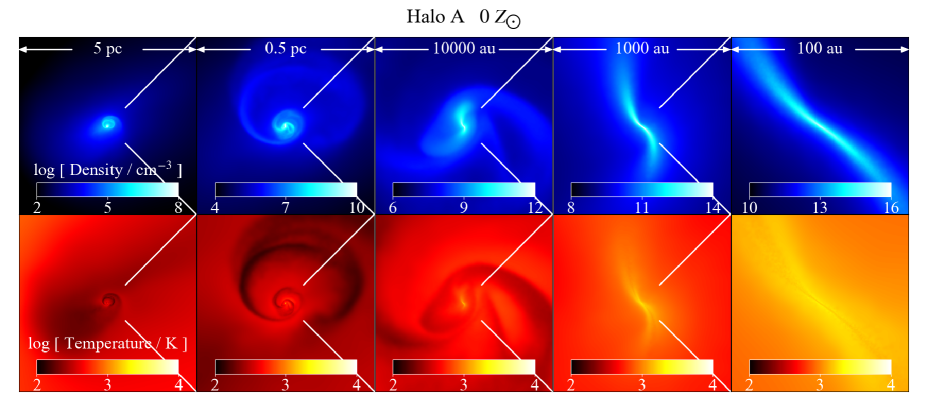
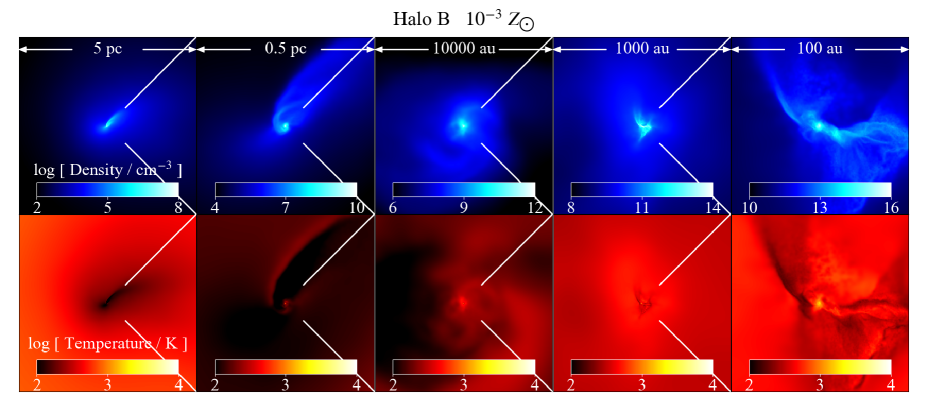
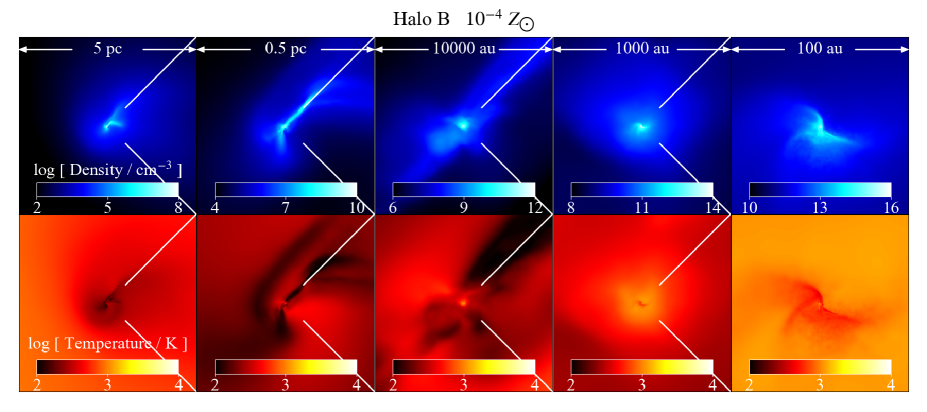
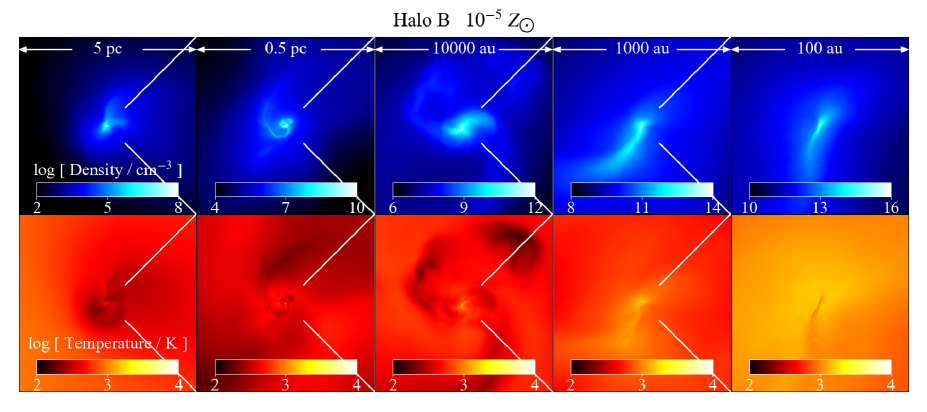
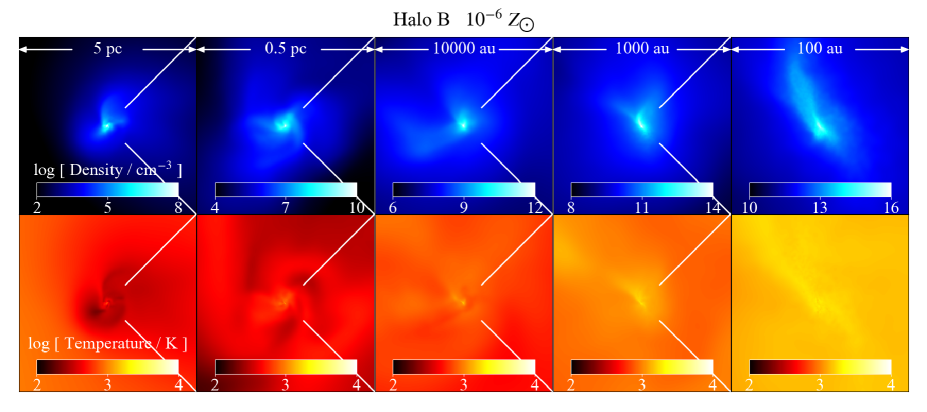
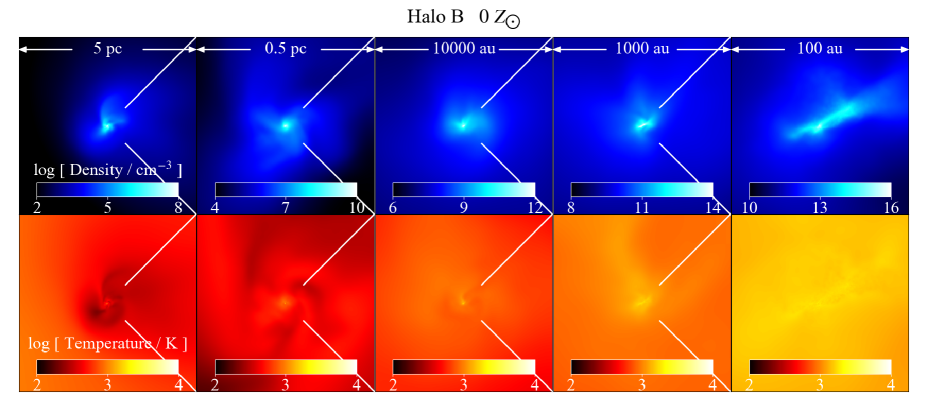
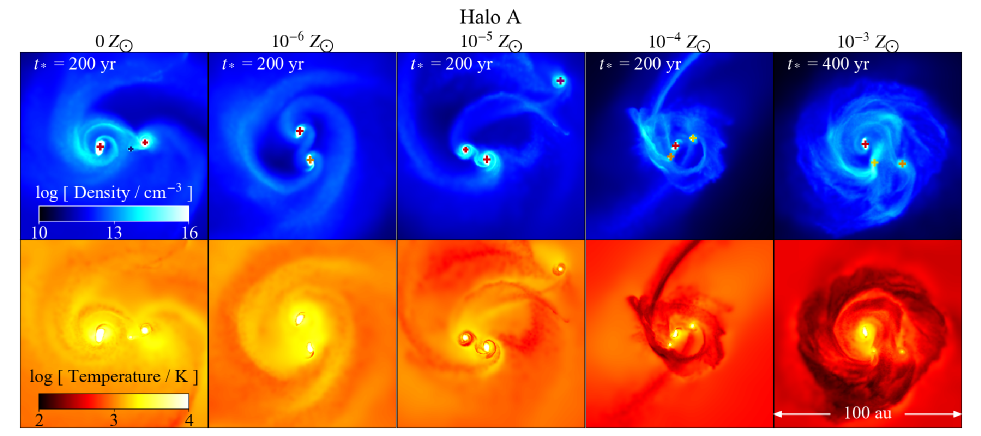
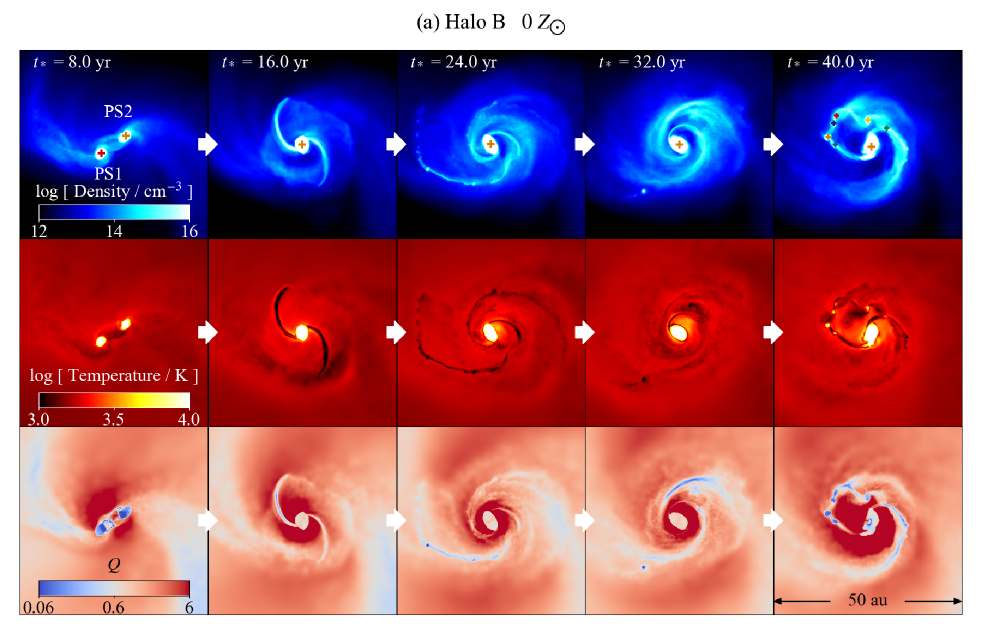
It has been conventionally accepted that dust cooling induces CF, and low-mass stars can form through competitive accretion among the fragments at metallicities (e.g., Omukai, 2000). Figs. 3 and 4 show the density-weighted projections of density and temperature when first reaches for Halo A and B, respectively. dust cooling induces CF for , but the fragments are accreted by the central most massive protostar within 50 yr. For and , even with efficient dust cooling, CF does not occur. At extremely low metallicities of and , dense filaments form and fragment within yr owing to H2 cooling, in a different manner from the conventional notion. Although H2 cooling is less efficient than dust cooling, the filaments can become sufficiently massive to be unstable because the accretion rate is larger () in the hotter gas ( K) than in a cool, metal-poor gas. However, the fragments on the filaments are accreted onto the primary protostar within yr. This suggests that CF is a “transitional” event, and does not determine the final state of the cloud core.
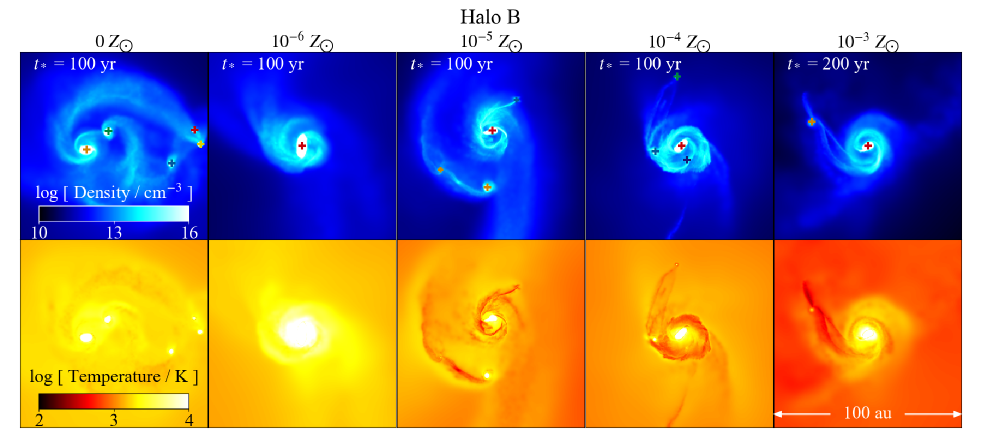
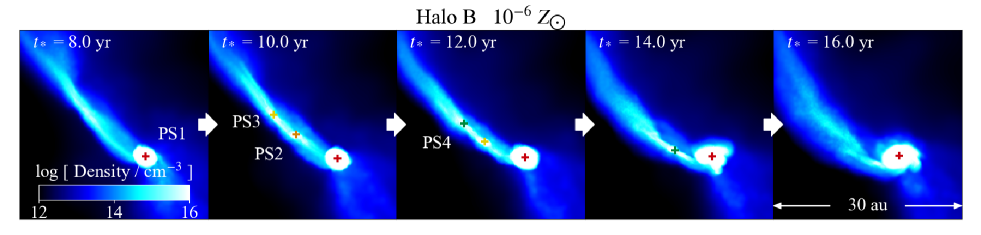
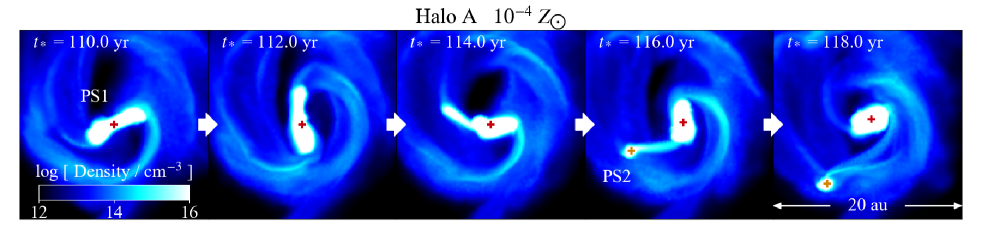
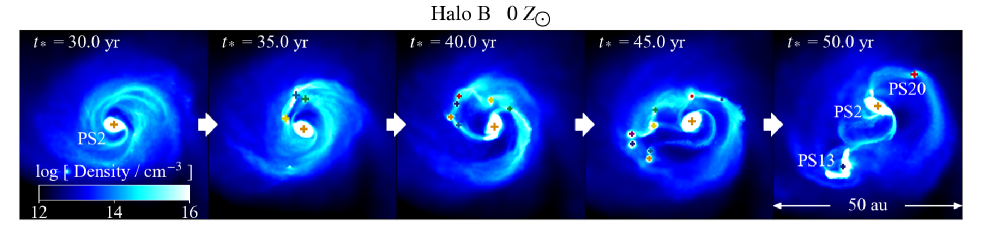
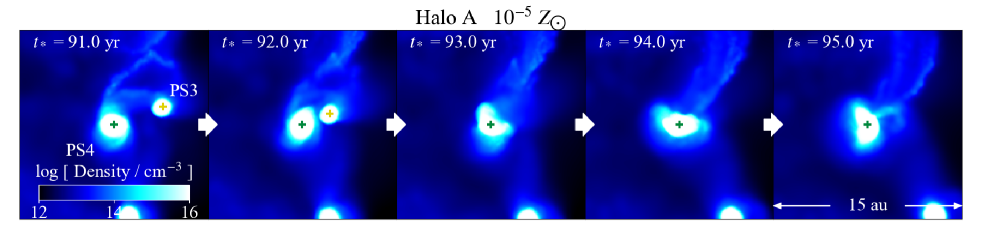
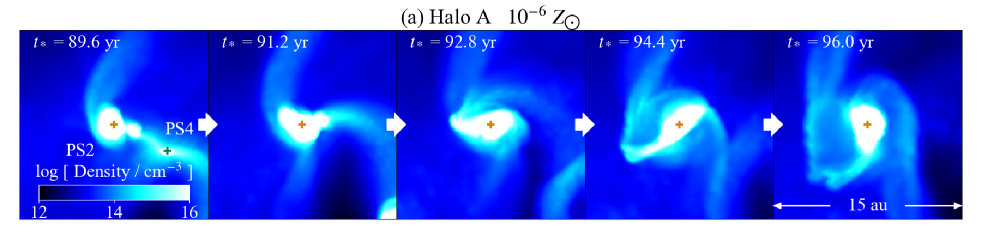
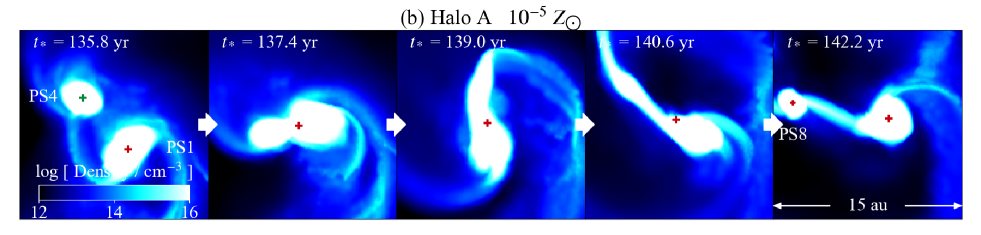
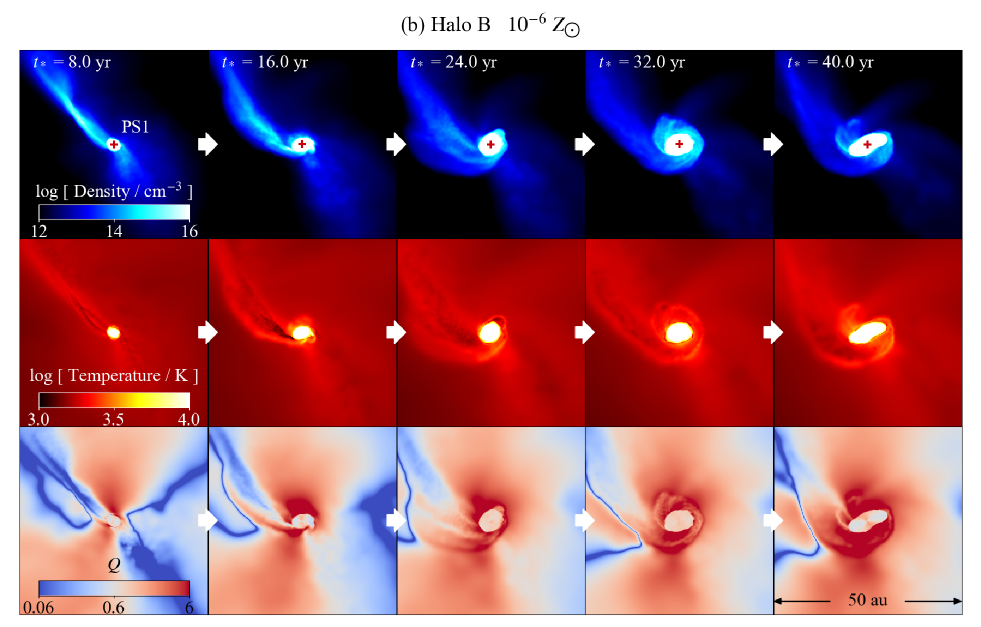
Figs. 5 and 6 show the density-weighted projections of density and temperature when we terminate the simulations at the time after the formatiothe first protostar for Halo A and B, respectively. In all runs but for HBZ-6, accretion discs form at yr, when the sufficient amount of ambient gas is accreted onto the cores. In the sufficiently massive discs, DF eventually occurs as seen in Figs. 5 and 6. We find that DF is the main process of fragmentation regardless of metallicity.
In the discs, as many as 26 protostars form, some of which are destroyed within a few 100 yr. The primary protostar grows through gas accretion while secondary protostars form through the break-up of their parent protostar after it strongly deforms by the centrifugal force, or through the interaction of spiral arms around a massive protostar. Some protostars are destroyed through merger with another protostar. When we terminate our simulations at 100–400 yr after primary protostar formation, 1–5 protostars survive. Table 2 shows the total mass of protostellar system . The mass is – depending on the mass accretion rate and metallicity (Section 3.3).
3.2 Collapsing phase
In this section, we examine the thermal evolution of our clouds in more detail, and then define the condition under which CF occurs.
3.2.1 Thermal evolution
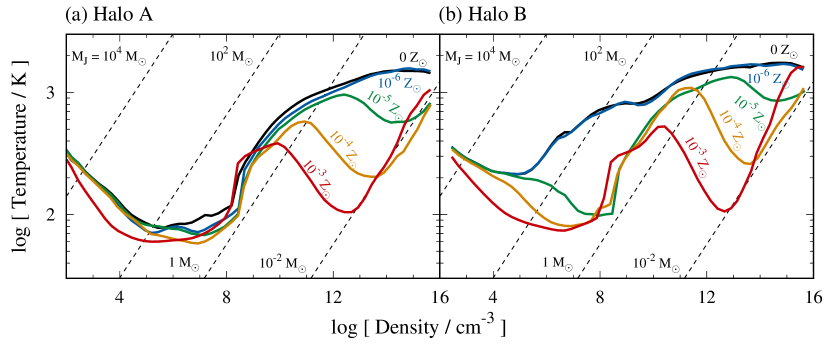
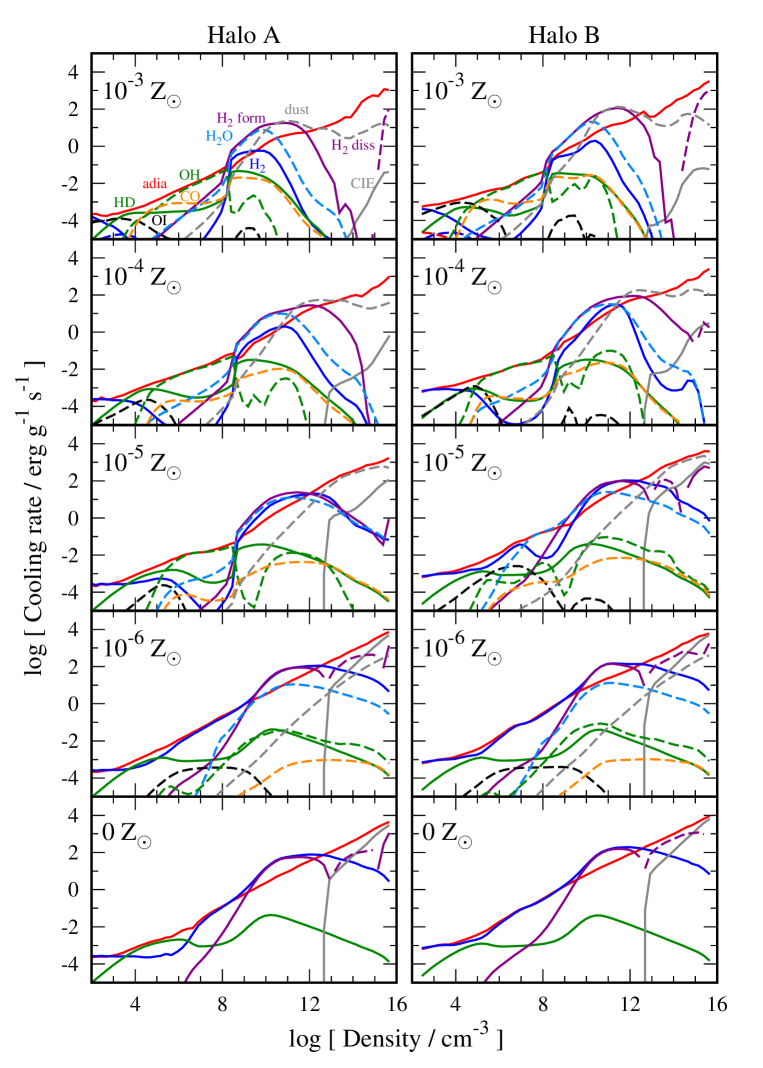
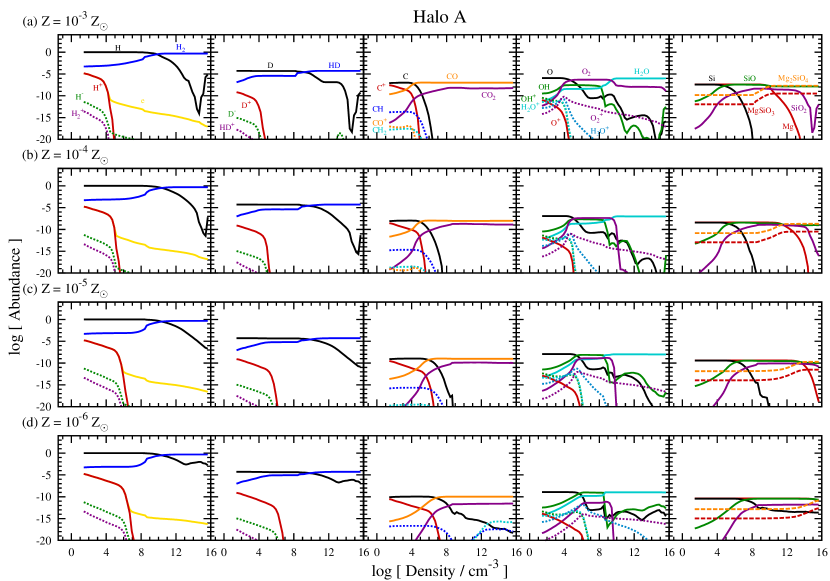
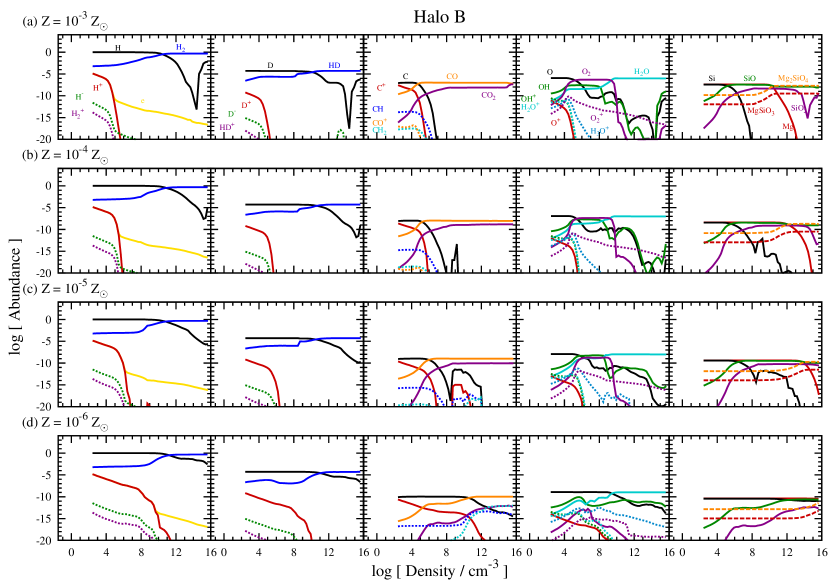
A gas cloud collapses and condenses toward the center of the gravitational potential generated by the host dark matter halo. Since cloud deformation and fragmentation are controlled by the thermal evolution of the gas, we first discuss cooling/heating processes and chemical evolution in our clouds. Figs. 7 and 8 show the evolution of the temperature and cooling rates as a function of the average density in the cloud core. Figs. 9 and 10 show the evolution of spieces abundances for Halo A and B, respectively. The temperature evolution is different between the two MHs even with the same metallicity. Since the collapsing timescale is longer for Halo A than for Halo B by a factor of two, the gas temperature is lower with the smaller compressional heating rate. The evolution of chemical species abundances does not significantly differ between the two halos with a fixed metallicity (see Figs 9 and 10) but the thermal evolution notably or significantly differs between the runs with different gas metallicities.
The overall thermal evolution can be described as follows. At low densities , the gas temperature increases adiabatically, because any cooling process does not work efficiently. The hydrogen molecule fraction increases up to through the H--process as
catalyzed by free electrons. Then, the gas temperature declines through hydrogen molecular cooling. The molecular fraction increases as metallicity increases because of more efficient molecular formation on grain surfaces. In models where the temperature drops below 150 K, HD molecules form through the reaction
and rotational transition line cooling of HD molecules becomes important.
Metal atoms/ions or molecules also contribute to gas cooling for metallicities . With a metallicity , fine-structure cooling of O i and rotational transition line cooling of CO become dominant at – and –, respectively. Since O is dominant over C () in our progenitor model, C i and C ii fine-structure cooling is inefficient. For metallicities above , OH molecules form through
and OH cooling becomes dominant. With these molecular cooling, gas temperature reaches the temperature of the cosmic microwave background (CMB), 44 K and 59 K for Halo A and B, respectively, and temperature floor appears in Fig. 7. The nearly isothermal evolution induces cloud deformation (Tsuribe & Omukai, 2006; Sugimura et al., 2017). The second and third columns of Fig. 3 shows dense (–) and cool ( K) spiral arms.
The cloud deformation ceases at density , where efficient gas heating occurs due to the release of binding energy along with hydrogen molecule formation through three-body reactions:
The gas cloud again collapses stably against deformation, and quasi-spherical hydrostatic cores form (the forth column of Figs. 3 and 4). The ambient gas is accreted onto the core, and thus the mass and density of the core can continue to increase.
At , silicate grains start growing by accreting Mg atoms, SiO molecules, and H2O molecules in the gas phase. Grain growth proceeds until all Mg atoms are eventually depleted (see Figs. 9 and 10). The grain radius most rapidly increases at densities . This is consistent with the results of one-zone calculations (see fig. 8 of Chiaki et al., 2015) and a simple estimate of from the balance between the growth and dynamical timescales:
| (10) |
As the grain radius monotonically increases, the mass fraction of grains to its constituent elements increases (Eq. 3). The upper limit of the increment of the grain radius does not depend on the metallicity because it is determined by the initial mass fraction of grains with respect to its available constituent elements. For the dominant species, forsterite (Mg2SiO4), the initial mass fractions of grains and Mg to metals are and , respectively. The integrated momenta of the size distribution are (, , ) = (, , ). From Eq. (3), when all Mg is depleted. For metalliciteis , reaches this value. For , Mg is partly accreted onto the grains, and and for Halo A and B, respectively, at a density . The gas cooling rate due to dust thermal emission is enhanced by grain growth, and the temperature decreases for metallicities above . Dust cooling enhances cloud deformation, and the filamentary structure develops (the fifth column of Figs. 3 and 4). At , the gas and grains are thermally coupled, and the gas becomes optically thick in continuum. Then, the temperature increases approximately adiabatically (Eqs. 4 and 5). In this region, the gas hardly collapses, and a hydrostatic core (protostar) forms.
3.2.2 Fragmentation of clouds
We identify protostars forming through CF in each run, following the criterion described in Section 2.4. CF does not occur for metallicities – even though dust cooling is efficient at densities – (Fig. 7). This can be explained as follows: H2 formation heating once stabilizes the contracting gas at densities – (Fig. 7). The cloud core becomes spherical when the dust cooling begins to operate, and the timescale for deformation is longer than the collapse timescale as found by Tsuribe & Omukai (2008) and C16. Although we use the same cloud as C16, we obtain the different outcome. For Halo B (MH1 in C16) with a metallicity , CF does not occur in this work, but CF does occur in C16. This is due to the numerical resolution as we shall discuss in more detail in Section 4.3.
For HBZ-3, cloud deformation is enhanced by dust cooling, and knotty filamentary structures develop in a manner termed “filament fragmentation” in C16. The whole filaments are accreted onto PS1 by yr, before the density perturbations grow gravitationally. Similarly, for HAZ0 and HBZ-6, filament fragmentation is promoted at yr by the combined effect of H2 cooling and the high initial accretion rate (), yielding six and four protostars, respectively. For HAZ0 and HBZ-6, of the protostars is and , respectively. This indicates that fragmentation occurs before the formation of an accretion disc in these runs. We find that protostars can form through CF, but all or most of them are accreted onto PS1 within a few yr in the subsequent accretion phase.
3.3 Accretion phase
3.3.1 Accretion discs
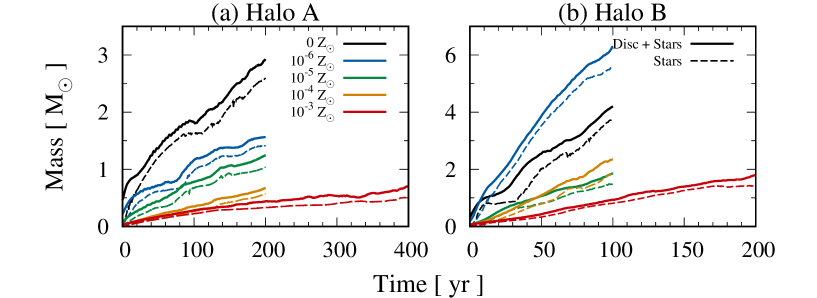
In all cases, a rotationally supported disc forms quickly after PS1 accretes a sufficient amount of gas with finite angular momentum (Figs. 5 and 6). In this study, we define a circumstellar disc as the region with densities . Table 2 lists the disc mass and the mass accretion rate . is the effective temperature of the accreted gas onto the disc calculated as (Shu, 1977). In Fig. 11, the solid curves show the total mass of the disc and protostars (in the regions with densities ), and the dashed curves show the total mass of protostars with densities . The difference of the solid curves and the dashed curves indicates the disc mass as a function of time. In each halo, decreases roughly monotonically with increasing metallicity. The temperature represents the temperature at and decreases owing largely to dust cooling (Fig. 7). The accretion rate decreases with decreasing temperature, which is a consequence of the quasi-static condition set by the balance between gravitational force and pressure gradient. The relationship between and metallicity is opposite for HBZ0 and HBZ-6. For HBZ0, two nearly equal-mass protostars merge just after PS1 formation ( yr). The protostars are disrupted, and a fraction of their material is stripped off into the ISM. Since the ambient gas acquires angular momentum, the accretion rate is suppressed (see Appendix A.2 for detail). The accretion rate for Halo B is generally larger than Halo A because the collapse timescale of the cloud itself is shorter.
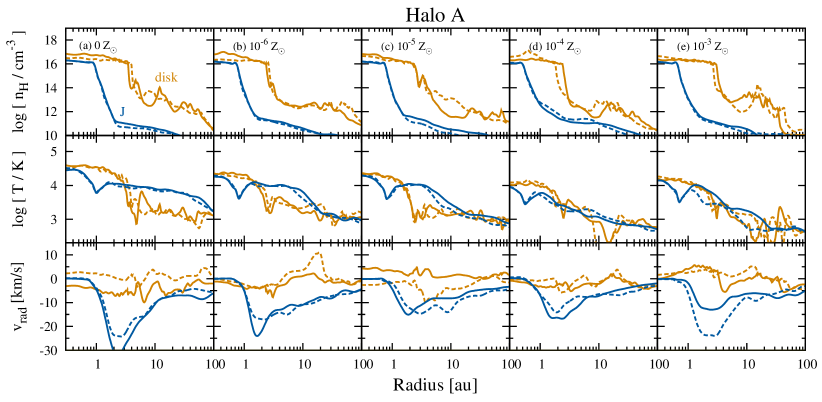
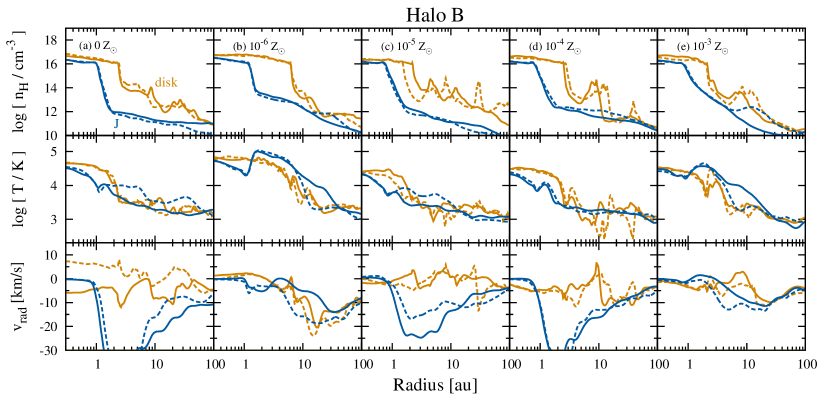
Figs. 12 and 13 show the profiles of density, temperature, and radial velocity as a function of distance from the center of mass of the most massive, primary protostar. To see the three-dimensional properties of the accretion flow, we show the profiles in opposite directions (solid and dashed curves) along the two axes parallel and perpendicular to the angular momentum vector (blue and orange curves, respectivley). We calculate total angular momentum as , where is the displacement from the center of mass, and is the relative velocity to the mass-weighted mean velocity among cells with densities . Outside the protostar ( au), the density suddenly declines down to on the disc plane (orange curves) and along the rotational axis (blue curves). The orange curves show the density plateau in the disc (– au). Along the rotational axis (blue curves), rapid gas accretion occurs with infall velocity km/s because the centrifugal force barrier does not work. Since the infall velocity exceeds the local sound speed, accretion shocks form, and the temperature increases to above K. For HBZ-6, the disc size is smaller than the other models, and the gas is accreted onto the protostar in a nearly spherical manner as we discuss in detail in Appendix A.2. Because of rapid gas accretion, the gas temperature around the protostar rises up to K due to compressional heating.
3.3.2 Fragmentation of discs
We find that DF occurs, and multiple protostellar systems form in all our runs but for HBZ-6 (Figs. 5 and 6). We identify candidate protostars by employing a friends-of-friends (FOF) algorithm with the threshold density and a linking length . We count the candidates with mass more than () as protostars. Hereafter, the protostar born in the ’th order is dubbed as PS in each run.
Table 2 shows that as many as 26 protostars form until the time when we terminate the simulations. Most of the protostars are destroyed, and only several protostars remain in the accretion discs at . The mass evolution of the protostellar systems shows the oligarchic growth. This is consistent with the results of earlier works investigating the evolution of primordial protostellar discs (Clark et al., 2011; Stacy et al., 2012; Greif et al., 2012; Susa, 2019). Susa (2019) derived an empirical relationship between the number of protostars and elapsed time as
| (11) |
from earlier studies, where is the time scaled by the threshold density above which the gas is assumed to be adiabatic. With and – yr in this study, the predicted number of fragments is 4–6, which is consistent with our simulation results in both the metal-free and metal-poor cases.
Most protostars form in dense spiral arms around the most massive protostar. The protostars lose their angular momentum from the non-axisymmetric structure. Then, they migrate toward PS1 in the manner of Type I migration as reported in Greif et al. (2012) and Hosokawa et al. (2016). The migration time scale is comparable to the free-fall time yr in the region with density . The life time of the protostars which merge with PS1 in our simulations is found to be typically – yr (see Appendix A). Since this is comparable to the free-fall timescale, we conclude that the protostars undergo Type I migration (also see Chon & Hosokawa, 2019; Liao & Turk, 2019) and merge with the central protostar.
3.3.3 Mass evolution of protostars
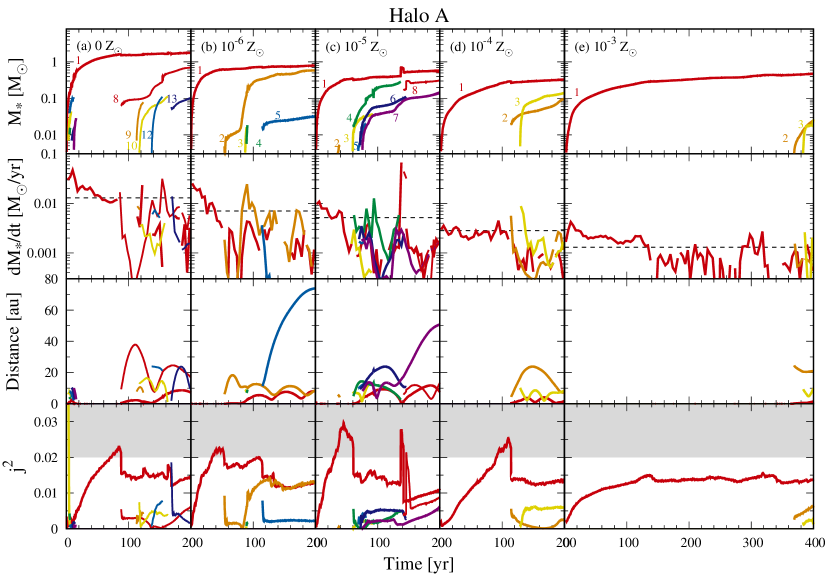
The dashed curves of Fig. 11 show the evolution of the total mass of protostars , which monotonically increases through gas accretion. Table 2 shows at the time and the average mass accretion rate onto the protostars from to . For Halo A, the total mass becomes – at 200–400 yr after PS1 formation. The values correspond to the mass accretion rates –. The accretion rate corresponds to the effective temperature – K calculated with a simple scaling . The mass accretion rate decreases with the increasing metallicity because molecular and dust cooling reduces the gas temperature around the protostars. For Halo B, the total mass is – at 100–200 yr after PS1 formation, corresponding to the mass accretion rates – and similarly evaluated temperatures – K. The mass accretion rate for Halo A is lower than that for Halo B with a fixed metallicity because the gravitational potential of MHs, , is shallower for Halo A () than for Halo B (). Also, the gas in Halo A rotates more rapidly than Halo B and thus the centrifugal force effectively prevents the collapse and accretion. The rotation velocity of a cloud with mass and density is parametrized as
| (12) |
In this equation, is the rotational energy, where , and are angular velocity, momentum of inertia and total angular momentum, respectively, and is the gravitational energy. The parameter of Halo A is larger than of Halo B by a factor of seven.
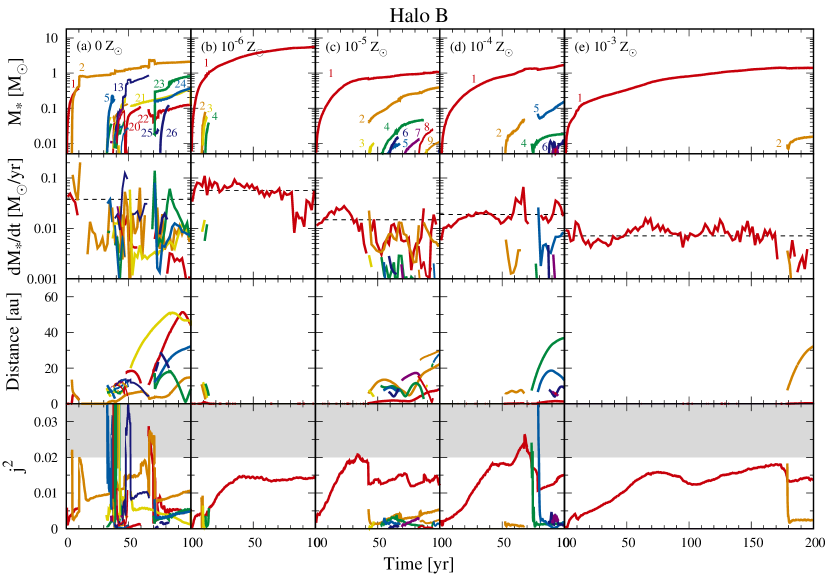
Figs. 14 and 15 show the evolution of mass, accretion rate, distance from the center of mass and the angular momentum of each protostar for Halo A and B, respectively. Every protostar accretes the mass at the nearly constant rate around the average accretion rate shown in Table 2 (black dashed lines). All protostars are bound in the gravitational potential of the disc, and remain within au from the center of mass of the system. Several researchers reported that some protostars are ejected from a disc through -body interactions (Clark et al., 2011; Greif et al., 2012). We do not see this slingshot effect in our simulations for a few 100 yr of the disc evolution. The protostars also accrete angular momentum, and the pamameter
| (13) |
of protostars increases initially. The angular momentum of PS1 suddenly decreases when it is torn apart into two fragments by the centrifugal force (Section 3.4.1). After the spiral arms develop in the discs, evolves nearly constantly due to the transport of angular momentum through the non-axisymmetric structure.
3.4 Formation/destruction processes of protostars
We find that protostars form explosively within the first yr but most of them are destroyed for yr. In this section, we discuss the formation/destruction processes of protostars on accretion discs and estimate the criterion for each process. We show some examples of the processes in Appendix A.
3.4.1 Formation processes of protostars
The formation of protostars is classified into the following three processes:
(i) Gravitational contraction
In all runs, the primary protostar, PS1, forms through gravitational contraction and grows mostly through gas accretion from filaments before accretion discs appear. PS1 continues to be the most massive protostar until the simulation is terminated (see red curves in Figs. 14 and 15) in all runs but for HBZ0 where PS2 eventually becomes the most massive one. For very low metallicities , several subsequent protostars also form through gravitational contraction. H2 cooling induces the deformation of cloud cores, and dense filaments form, where the secondary protostars form due to gravitational instabilities within yr.
(ii) Break-up of rapidly rotating protostars
In eight out of ten runs (all but for HAZ-3 and HBZ-6), after PS1 sufficiently accretes mass and angular momentum, it breaks up into two protostars when the centrifugal force overcomes the gravitational force. Until we terminate the simulation, protostars forming through break-up mostly survive because their initial orbital angular velocity is comparable to the escape velocity of the primary protostar. The protostars forming in this way become eventually as the second most massive protostars.
The criterion for break-up can be expressed by the critical angular momentum. As in Eriguchi et al. (1982), we introduce a dimensionless parameter (Eq. 13), which is the same order as (Eq. 12). The lower panels of Figs. 14 and 15 show the evolution of . Until the break-up occurs, of PS1 constantly increases along with mass accretion. We find that the break-up criterion is
| (14) |
with the critical value that we empirically determine. The grey shades in Figs. 14 and 15 indicate the region with . In our simulations, of PS1 reaches around and breaks up in all cases except for HAZ-3 and HBZ-6, where no protostars form through the break-up process.
We estimate the lower-limit of the initial of a cloud with a density , above which the break-up of protostars occurs after the gas density increases up to a density . Assuming the conservation of angular momentum in the region containing a mass , we can derive the critical value of as
| (15) |
The range of of MHs are 0.1–1 (Hirano et al., 2014), which suggests that protostars forming in MHs can generally fragment through break-up. We note that, in actual protostellar discs, angular momentum is transported through non-axisymmetric structures, and then larger would be necessary for break-up so that the protostars can obtain sufficient rotational energy larger than .
(iii) Interaction of spiral arms
There is yet another mode of protostar formation through the interaction of spiral arms in an accretion disc. The gas at the colliding interface between two spiral arms is compressed and becomes gravitationally unstable. Takahashi et al. (2016) and Inoue & Yoshida (2018) found that a spiral arm is unstable to fragment when its minimum Toomre parameter, , is below 0.6, where is the epicyclic frequency, and is the gas surface density. In this work, we also confirm that fragmentation occurs when
| (16) |
after spiral arms interact as discussed in Appendix A.
3.4.2 Destruction processes of protostars
Although at most 26 protostars form in an accretion disc in the first few hundred years, only 2–5 protostars survive after the destruction processes of protostars. This suggests that the destruction process of protostars plays an important role in the evolution of protostellar systems. The destruction of protostars is classified into the following three processes:
(i) Dissolution into ISM
Some protostars dissolve into ISM. They are born with very small masses . These protostars lose their mass because they are inefficiently self-gravitated. We should note that some protostars just become not to satisfy our mass criterion for a protostar . We do not follow further hydrodynamic evolution of such protostars.
(ii) Mergers with another member protostar
Some protostars are destroyed through the interaction with another protostar. The interaction can be divided into two categories: mergers (MER) and tidal disruption events (TDEs). We define the criterion of MER and TDE by comparing the impact parameter of an approaching protostar and the radius of a target protostar. For a protostar PS approaching a protostar PS, we calculate the impact parameter from the position and velocity of PS relative to PS from the snapshot taken just before the collision. Then, we calculate the radius along the major axis of PS by approximating its shape to be an ellipsoid. We define the criteria for MER and TDE as
| (17) |
It has been believed that a TDE occurs when a protostar approaches another protostar within the tidal radius , where and are the mass of PS and PS, respectively (Rees, 1988). However, we find that TDEs occur even when (Appendix A). Since the masses of the colliding protostars are comparable (), both protostars deform with each other’s tidal force. The cross-section for the interaction can become effectively larger than in the case with a large mass ratio () often assumed by the classical theory of TDEs, where only a smaller protostar deforms.
(iii) Tidal disruption events
Some protostars are destroyed through TDEs when they collide with each other in an off-set manner. In some TDEs, a new protostar forms in dense tidal tails (Appendix A).
4 Discussion
4.1 Final mass of metal-free/metal-poor stars
In this work, we follow the evolution of accretion discs for – yr, and find that the protostars grow up to –. Fig. 11 shows the protostellar systems still accrete the gas and grow in mass. In principle, it is necessary to follow the disc and protostellar evolution for over yr until the protostars reach ZAMS, in order to determine the mass and the number of stars forming in the system. Further fragmentation and gas accretion onto protostars will be halted by the radiative feedback when the primary protostar grows up to and starts emitting ultraviolet photons (Hosokawa et al., 2016; Fukushima et al., 2020; Sugimura et al., 2020). If (a part of) protostars remain low-mass (), they will be observed as extremely metal-poor stars. If they can grow up to and if the number of protostars does not significantly increase, massive metal-poor binaries or clusters will form, which can explain the origin of gravitational waves recently detected by LIGO/VIRGO because the mass-loss rate of metal-free and metal-poor stars is small in their main sequence, and most of their mass can contract into black holes (Abbott et al., 2016). To explicitly see the final fate of the protostellar system, we require another numerical strategy to follow the longer-term evolution of accretion discs, such as the sink particle technique. This technique requires some modeling to describe the interaction of sinks. This work can supply realistic models of the mergers and TDEs between sinks.
4.2 Initial metal/dust models
The accretion rate decreases with the increasing dust cooling rate, which depends on the abundance and size distribution of dust grains. In this work we fix the initial metal and dust properties for a Pop III SN model with a progenitor mass and an ambient gas density . With a simple semi-analytic model, Chiaki et al. (2015) found that the thermal evolution of clouds depends on progenitor models. For , the growth of carbon grains also enhances the dust cooling rate because the elemental abundance ratio of carbon to oxygen is larger than for more massive progenitor mass. With increasing , depletion efficiency of metals onto grains decreases because of the increasing rate of sputtering by reverse shocks. The critical metallicity above which dust cooling can operate increases for than in the case without grain destruction by an order of magnitude. To statistically investigate the mass spectrum of Pop II stars, we need to consider the realistic frequency of and .
This work can apply to the formation of metal-poor stars with peculiar elemental abundance patterns, such as CEMP stars (Beers & Christlieb, 2005). Also for clouds with different elemental abundances, we can discuss the condition for CF/DF on the analogy of this work. In our recent work (Chiaki et al., 2020), we followed the collapse of gas clouds with C-enhanced elemental abundance ratios until the formation of the primary protostar. We employed a “faint SN” model, where Fe-rich innermost layers fall back into a central SN remnant, and relatively C-enhanced gas is ejected (Umeda & Nomoto, 2003). The enrichment from faint SNe is one of the scenarios that can explain the formation of CEMP stars. We found that the cloud core fragments due to rapid gas cooling from amorphous carbon grains for the lowest progenitor mass (). For more massive progenitor mass ( and ), the clouds collapse stably even with efficient dust cooling because of H2 formation heating. Interestingly, for , we found that spiral arms develop around the primary protostar, where the Toomre parameter is below the critical value 0.6. This suggests that DF would occur if we follow the longer-term evolution of the arms.
In this work, we have assumed the elemental abundance of a single Pop III SN model. Multiple Pop III and Pop II progenitors can contribute to metal enrichment of a halo. Hartwig et al. (2018) shows that C-normal stars with are likely to form in clouds enriched by multiple progenitors. To compare with simulation results with the large samples of observed EMP stars, we are required to consider multiply enriched gas clouds.
4.3 Numerical resolution
We have imposed the resolution criterion where the local Jeans length is resolved by 32 cells. It is smaller than other simulations of Pop III/II star formation (Greif et al., 2012; Smith et al., 2015; Chiaki & Wise, 2019). In this section, we see whether the cloud morphology, which significantly affects the fragmentation property, converges or not with our resolution criterion. We also aim to compare the present work with our previous work (C16), where we used the same initial conditions and chemistry/cooling models but imposed milder resolution criterion ().
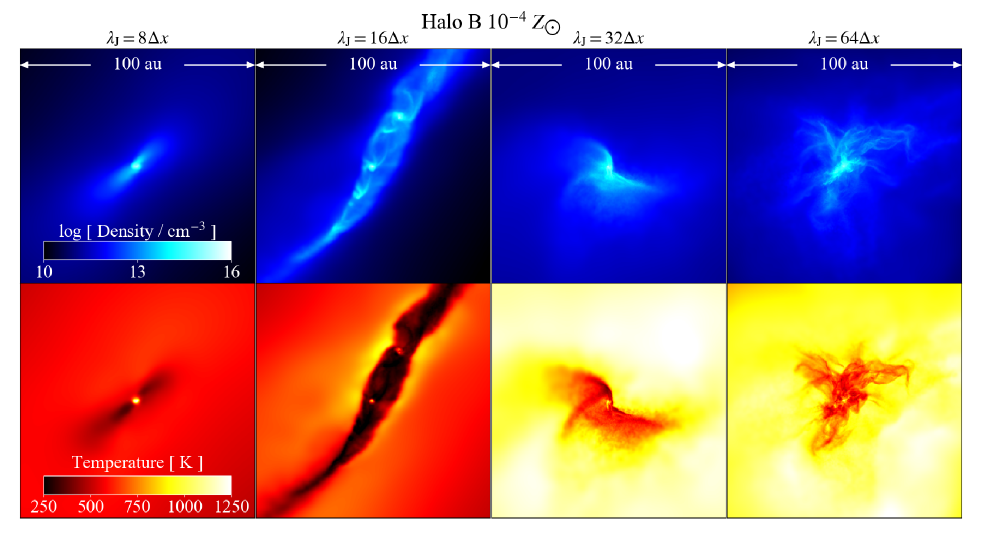
Fig. 16 shows the projections of density and temperature of the clouds for HBZ-4 with criteria , , and . The shape of the clouds depends on resolution. With higher resolution, turbulence is resolved at smaller spatial scales. For the lowest resolution, , the cloud collapses in an almost spherical manner. For intermediate resolutions, and , the cloud shape deviates from the spherical form. For the highest resolution, , small filaments with a size of au appear around the central dense protostar.
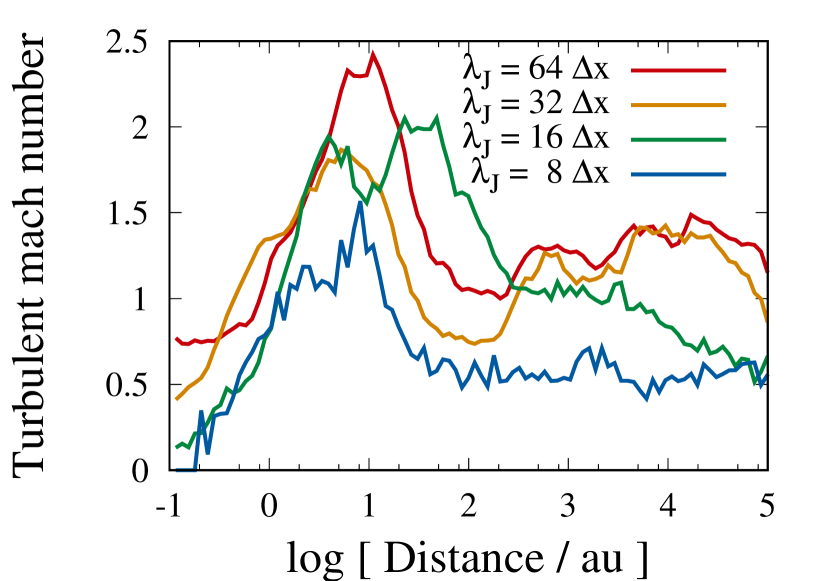
Fig. 17 shows the radial profile of turbulent mach number . Following Higashi, Susa, & Chiaki (2021), we estimate the turbulent velocity by taking the mass-weighted root-mean-square of
| (18) |
of a cell to subtract the bulk motion including mean velocity , radial velocity and rotational velocity in each of 100 logarithmic bins from a radius 0.1 au to 1 pc. The amplitude of turbulence is monotonically larger for higher resolution at scales au, because the numerical diffusion is smaller.
Interestingly, for , a dense filamentary structure appears at a scale au (Fig. 16). This cloud morphology is consistent with the result of C16 (see their figure 5). At this scale, turbulence is amplified up to (the green curve in Fig. 17). The scale may be a “resonant” scale of turbulent amplification for this resolution. Fig. 16 shows that the filament is defined by accretion shocks with a density and a temperature K, corresponding to the Jeans length of au. This indicates that the turbulence is powered by the accretion shocks.
Although the cloud morphology still does not converge at the scales au for , we use this criterion to follow the long-term evolution of accretion discs with the present computational power.
4.4 Effect of the chimistry model on break-up
We find that several protostars form through the break-up of the primary protostar, but the density structure in protostars may affect their hydrodynamic evolution. In this study, we impose the stiff EOS, and the density is almost uniform at densities above because of the intense pressure (Figs. 12 and 13). In reality, the specific heat ratio is at densities with gas cooling accompanied by the destruction of H2 formation while at (Omukai, 2000). Since the density is proportional to , a less-dense envelope should extend around the core, which might suppress the break-up. However, Boss & Bodenheimer (1979) found that a rotating isothermal cloud deforms into an array-like shape and fragment into two blobs. Greif et al. (2012) reported that break-up occurs in primordial clouds with a realistic chemistry model. We argue that the break-up still occurs with a realistic chemistry model although its frequency might be suppressed by the density structure in cloud cores. We will investigate the effect of the critical density on the break-up process in the forthcoming paper.
5 Summary and conclusion
It has been conventionally postulated that the typical mass scale becomes smaller from Pop III to Pop II stars because additional cooling from dust thermal emission induces CF as metallicity increases. In this study, we find that CF does not occur in most runs because of rapid gas heating associated with H2 molecular formation. Although CF occurs in several runs, fragments are rapidly accreted onto the primary protostar. Instead, the dominant mode of fragmentation is DF regardless of metallicities. At most 26 protostars form through gas accretion or break-up, but most of them merge with each other or destroyed through TDEs. At the endpoint of our simulations, only several protostars remain in the systems. We also find that oligarchic evolution of the protostars occurs; low-mass protostars orbit around the central massive star or around a massive binary.
The mass distribution and multiplicity of the stars are determined only after the gas accretion and fragmentation are halted. This occurs when the mass of the most massive protostar(s) exceeds , and its radiative feedback is effective (Hosokawa et al., 2016). Whether low-mass or high-mass stars form depends on the strength and the timing of the radiative feedback. In future works, we will employ advanced numerical techniques, such as sink particles (see Fukushima et al., 2020), and will follow the long-term evolution of low-metallicity protostars to uncover the entire picture of metal-free/metal-poor star formation.
ACKNOWLEDGMENTS
We thank T. Nozawa, who kindly gave us his SN model. The initial conditions in the simulations are provided by S. Hirano. We thank the fruitful discussion with K. Omukai, H. Susa and S. Higashi. GC is supported by Overseas Research Fellowships of the Japan Society for the Promotion of Science (JSPS) for Young Scientists. NY acknowledges support by SPPEXA through JST CREST JPMHCR1414. The numerical simulations and analyses in this work are carried out on XC40 in Yukawa Institute of Theoretical Physics (Kyoto University), and COMET in SDSC.
Data availability
The versions of grackle used in this work is available at https://github.com/genchiaki/grackle/tree/metal-dust-radiation. The data underlying this article will be shared on reasonable request to the authors.
References
- Abel et al. (2002) Abel, T., Bryan, G. L., & Norman, M. L. 2002, Science, 295, 93
- Abbott et al. (2016) Abbott B. P., et al., 2016, PhRvL, 116, 061102
- Abbott et al. (2017) Abbott, B. P., Abbott, R., Abbott, T. D., et al. 2017, ApJ, 848, L13
- Aoki et al. (2007) Aoki, W., Beers, T. C., Christlieb, N., et al. 2007, ApJ, 655, 492
- Arentsen et al. (2019) Arentsen A., Starkenburg E., Shetrone M. D., Venn K. A., Depagne É., McConnachie A. W., 2019, A&A, 621, A108
- Asplund et al. (2009) Asplund, M., Grevesse, N., Sauval, A. J., & Scott, P. 2009, ARA&A, 47, 481
- Audouze & Silk (1995) Audouze, J., & Silk, J. 1995, ApJ, 451, L49
- Barrow et al. (2018) Barrow, K. S. S., Wise, J. H., Aykutalp, A., et al. 2018, MNRAS, 474, 2617
- Beers & Christlieb (2005) Beers, T. C., & Christlieb, N. 2005, ARA&A, 43, 531
- Bianchi & Schneider (2007) Bianchi, S., & Schneider, R. 2007, MNRAS, 378, 973
- Boss & Bodenheimer (1979) Boss A. P., Bodenheimer P., 1979, ApJ, 234, 289. doi:10.1086/157497
- Bovino et al. (2016) Bovino, S., Grassi, T., Schleicher, D. R. G., & Banerjee, R. 2016, ApJ, 832, 154
- Bromm et al. (1999) Bromm, V., Coppi, P. S., & Larson, R. B. 1999, ApJ, 527, L5
- Clark et al. (2011) Clark, P. C., Glover, S. C. O., Smith, R. J., et al. 2011, Science, 331, 1040
- Chandrasekhar (1962) Chandrasekhar, S. 1962, ApJ, 136, 1048
- Chandrasekhar (1965) Chandrasekhar, S. 1965, ApJ, 142, 890 111
- Chiaki et al. (2015) Chiaki, G., Marassi, S., Nozawa, T., et al. 2015, MNRAS, 446, 2659
- Chiaki & Yoshida (2015) Chiaki, G., & Yoshida, N. 2015, MNRAS, 451, 3955
- Chiaki et al. (2016) Chiaki, G., Yoshida, N., & Hirano, S. 2016, MNRAS, 463, 2781
- Chiaki et al. (2018) Chiaki, G., Susa, H., & Hirano, S. 2018, MNRAS, 475, 4378
- Chiaki & Wise (2019) Chiaki, G., & Wise, J. H. 2019, MNRAS, 482, 3933
- Chiaki et al. (2020) Chiaki G., Wise J. H., Marassi S., Schneider R., Limongi M., Chieffi A., 2020, arXiv, arXiv:2007.06657
- Chon & Hosokawa (2019) Chon S., Hosokawa T., 2019, MNRAS, 488, 2658
- Chon, Omukai, & Schneider (2021) Chon S., Omukai K., Schneider R., 2021, arXiv, arXiv:2103.04997
- Dopcke et al. (2011) Dopcke, G., Glover, S. C. O., Clark, P. C., & Klessen, R. S. 2011, ApJ, 729, L3
- Eriguchi et al. (1982) Eriguchi, Y., Hachisu, I., & Sugimoto, D. 1982, Progress of Theoretical Physics, 67, 1068
- Federrath et al. (2011) Federrath C., Sur S., Schleicher D. R. G., Banerjee R., Klessen R. S., 2011, ApJ, 731, 62. doi:10.1088/0004-637X/731/1/62
- Fukushima et al. (2020) Fukushima H., Hosokawa T., Chiaki G., Omukai K., Yoshida N., Kuiper R., 2020, MNRAS, 497, 829
- Grassi et al. (2017) Grassi, T., Bovino, S., Haugbølle, T., & Schleicher, D. R. G. 2017, MNRAS, 466, 1259
- Greif et al. (2012) Greif, T. H., Bromm, V., Clark, P. C., et al. 2012, MNRAS, 424, 399
- Hartwig et al. (2018) Hartwig, T., Yoshida, N., Magg, M., et al. 2018, MNRAS, 478, 1795
- Hanawa & Matsumoto (2000) Hanawa, T., & Matsumoto, T. 2000, PASJ, 52, 241
- Higashi, Susa, & Chiaki (2021) Higashi S., Susa H., Chiaki G., 2021, arXiv, arXiv:2105.07701
- Hirasawa, Aizu, & Taketani (1969) Hirasawa T., Aizu K., Taketani M., 1969, PThPh, 41, 835. doi:10.1143/PTP.41.835
- Hirano et al. (2014) Hirano, S., Hosokawa, T., Yoshida, N., et al. 2014, ApJ, 781, 60
- Hirano et al. (2015) Hirano, S., Hosokawa, T., Yoshida, N., Omukai, K., & Yorke, H. W. 2015, MNRAS, 448, 568
- Hirashita & Omukai (2009) Hirashita H., Omukai K., 2009, MNRAS, 399, 1795. doi:10.1111/j.1365-2966.2009.15410.x
- Hirano & Bromm (2017) Hirano, S., & Bromm, V. 2017, MNRAS, 470, 898
- Hosokawa et al. (2016) Hosokawa, T., Hirano, S., Kuiper, R., et al. 2016, ApJ, 824, 119
- Hollenbach & McKee (1979) Hollenbach, D., & McKee, C. F. 1979, ApJS, 41, 555
- Inoue & Yoshida (2018) Inoue, S., & Yoshida, N. 2018, MNRAS, 474, 3466
- Inoue & Yoshida (2020) Inoue S., Yoshida N., 2020, MNRAS, 491, L24
- Inutsuka & Miyama (1997) Inutsuka, S.-I., & Miyama, S. M. 1997, ApJ, 480, 681
- Ishigaki et al. (2018) Ishigaki M. N., Tominaga N., Kobayashi C., Nomoto K., 2018, ApJ, 857, 46
- Kitayama et al. (2004) Kitayama, T., Yoshida, N., Susa, H., & Umemura, M. 2004, ApJ, 613, 631
- Kolmogorov (1941) Kolmogorov A. N., 1941, DoSSR, 32, 16
- Komatsu et al. (2011) Komatsu, E., Smith, K. M., Dunkley, J., et al. 2011, ApJS, 192, 18
- Kozasa & Hasegawa (1987) Kozasa, T., & Hasegawa, H. 1987, Progress of Theoretical Physics, 77, 1402
- Lai (2000) Lai, D. 2000, ApJ, 540, 946
- Landau & Lifshitz (1980) Landau L. D., Lifshitz E. M., 1980, stph.book
- Larson (1969) Larson, R. B. 1969, MNRAS, 145, 271
- Liao & Turk (2019) Liao W.-T., Turk M., 2019, arXiv, arXiv:1911.00610
- Lyttleton (1953) Lyttleton, R. A. 1953, Cambridge: University Press, —c1953,
- Machida & Nakamura (2015) Machida, M. N., & Nakamura, T. 2015, MNRAS, 448, 1405
- Nagasawa (1987) Nagasawa, M. 1987, Progress of Theoretical Physics, 77, 635
- Neufeld & Kaufman (1993) Neufeld, D. A., & Kaufman, M. J. 1993, ApJ, 418, 263
- Neufeld et al. (1995) Neufeld, D. A., Lepp, S., & Melnick, G. J. 1995, ApJS, 100, 132
- Nozawa et al. (2003) Nozawa, T., Kozasa, T., Umeda, H., Maeda, K., & Nomoto, K. 2003, ApJ, 598, 785
- Nozawa et al. (2007) Nozawa, T., Kozasa, T., Habe, A., et al. 2007, ApJ, 666, 955
- Nozawa et al. (2012) Nozawa, T., Kozasa, T., & Nomoto, K. 2012, ApJ, 756, L35
- Omukai (2000) Omukai, K. 2000, ApJ, 534, 809
- Omukai et al. (2005) Omukai, K., Tsuribe, T., Schneider, R., & Ferrara, A. 2005, ApJ, 626, 627
- Omukai et al. (2010) Omukai, K., Hosokawa, T., & Yoshida, N. 2010, ApJ, 722, 1793
- Palla, Salpeter, & Stahler (1983) Palla F., Salpeter E. E., Stahler S. W., 1983, ApJ, 271, 632. doi:10.1086/161231
- Peebles & Dicke (1968) Peebles P. J. E., Dicke R. H., 1968, ApJ, 154, 891. doi:10.1086/149811
- Placco et al. (2018) Placco, V. M., Beers, T. C., Santucci, R. M., et al. 2018, AJ, 155, 256
- Pollack et al. (1994) Pollack, J. B., Hollenbach, D., Beckwith, S., et al. 1994, ApJ, 421, 615
- Rees (1988) Rees M. J., 1988, Natur, 333, 523
- Safranek-Shrader et al. (2014) Safranek-Shrader, C., Milosavljević, M., & Bromm, V. 2014, MNRAS, 440, L76
- Saslaw & Zipoy (1967) Saslaw W. C., Zipoy D., 1967, Natur, 216, 976. doi:10.1038/216976a0
- Schlaufman et al. (2018) Schlaufman, K. C., Thompson, I. B., & Casey, A. R. 2018, ApJ, 867, 98
- Schneider et al. (2003) Schneider, R., Ferrara, A., Salvaterra, R., Omukai, K., & Bromm, V. 2003, Nature, 422, 869
- Shu (1977) Shu, F. H. 1977, ApJ, 214, 488
- Smith et al. (2015) Smith, B. D., Wise, J. H., O’Shea, B. W., Norman, M. L., & Khochfar, S. 2015, MNRAS, 452, 2822
- Smith et al. (2017) Smith, B. D., Bryan, G. L., Glover, S. C. O., et al. 2017, MNRAS, 466, 2217
- Springel (2005) Springel, V. 2005, MNRAS, 364, 1105
- Springel (2010) Springel, V. 2010, MNRAS, 401, 791
- Stacy et al. (2012) Stacy, A., Greif, T. H., & Bromm, V. 2012, MNRAS, 422, 290
- Sugimura et al. (2017) Sugimura, K., Mizuno, Y., Matsumoto, T., & Omukai, K. 2017, MNRAS, 469, 4022
- Sugimura et al. (2020) Sugimura K., Matsumoto T., Hosokawa T., Hirano S., Omukai K., 2020, ApJL, 892, L14
- Susa et al. (2014) Susa, H., Hasegawa, K., & Tominaga, N. 2014, ApJ, 792, 32
- Susa (2019) Susa H., 2019, ApJ, 877, 99
- Takahashi et al. (2016) Takahashi, S. Z., Tsukamoto, Y., & Inutsuka, S. 2016, MNRAS, 458, 3597
- Tanaka & Omukai (2014) Tanaka K. E. I., Omukai K., 2014, MNRAS, 439, 1884. doi:10.1093/mnras/stu069
- Tohline (2002) Tohline, J. E. 2002, ARA&A, 40, 349
- Truelove et al. (1997) Truelove, J. K., Klein, R. I., McKee, C. F., et al. 1997, ApJ, 489, L179
- Truelove et al. (1998) Truelove, J. K., Klein, R. I., McKee, C. F., et al. 1998, ApJ, 495, 821
- Tsuribe & Omukai (2006) Tsuribe, T., & Omukai, K. 2006, ApJ, 642, L61
- Tsuribe & Omukai (2008) Tsuribe, T., & Omukai, K. 2008, ApJ, 676, L45
- Umeda & Nomoto (2002) Umeda, H., & Nomoto, K. 2002, ApJ, 565, 385
- Umeda & Nomoto (2003) Umeda, H., & Nomoto, K. 2003, Nature, 422, 871
- Whalen et al. (2004) Whalen, D., Abel, T., & Norman, M. L. 2004, ApJ, 610, 14
- Whalen et al. (2008) Whalen, D., van Veelen, B., O’Shea, B. W., & Norman, M. L. 2008, ApJ, 682, 49
- Wollenberg et al. (2020) Wollenberg K. M. J., Glover S. C. O., Clark P. C., Klessen R. S., 2020, MNRAS, 494, 1871
- Yoshida et al. (2006) Yoshida, N., Omukai, K., Hernquist, L., & Abel, T. 2006, ApJ, 652, 6
- Yoshida, Omukai, & Hernquist (2008) Yoshida N., Omukai K., Hernquist L., 2008, Sci, 321, 669
- Yoon et al. (2016) Yoon, J., Beers, T. C., Placco, V. M., et al. 2016, ApJ, 833, 20
- Yoon et al. (2018) Yoon, J., Beers, T. C., Dietz, S., et al. 2018, arXiv:1806.04738
Appendix A Evolution of protostellar systems
| form | parent | dest. | |||||||||||
| [yr] | [yr] | [au] | [au] | [au] | [yr] | [] | |||||||
| 1 | 2.7 | GC | — | — | — | — | — | — | — | — | — | 0.471 | |
| 2 | 368.7 | INT | — | — | — | — | — | — | — | — | — | 0.025 | |
| 3 | 383.3 | INT | — | — | — | — | — | — | — | — | — | 0.026 | |
| 1 | 1.5 | GC | — | — | — | — | — | — | — | — | — | 0.328 | |
| 2 | 114.3 | BU | 1 | — | — | — | — | — | — | — | — | 0.097 | |
| 3 | 128.7 | INT | — | — | — | — | — | — | — | — | — | 0.142 | |
| 1 | 0.9 | GC | — | — | — | — | — | — | — | — | — | 0.584 | |
| 2 | 35.9 | INT | — | 39.1 | MER | 1 | 3.72 | 4.22 | 53.07 | 15.87 | 3.2 | ( 0.005) | |
| 3 | 59.7 | INT | — | 92.3 | MER | 4 | 0.13 | 1.05 | 3.39 | 1.57 | 32.6 | ( 0.037) | |
| 4 | 60.9 | BU | 1 | 137.1 | TDE | 1 | 3.82 | 2.03 | 1.44 | 2.30 | 76.2 | ( 0.283) | |
| 5 | 68.7 | INT | — | 80.9 | TDE | 4 | 1.16 | 0.74 | 3.73 | 1.15 | 12.2 | ( 0.020) | |
| 6 | 71.7 | INT | — | 145.7 | TDE | 8 | 3.03 | 1.51 | 1.63 | 1.78 | 74.0 | ( 0.110) | |
| 7 | 75.3 | INT | — | — | — | — | — | — | — | — | — | 0.140 | |
| 8 | 141.5 | BU | 1 | — | — | — | — | — | — | — | — | 0.309 | |
| 1 | 0.3 | GC | — | — | — | — | — | — | — | — | — | 0.795 | |
| 2 | 53.9 | BU | 1 | — | — | — | — | — | — | — | — | 0.580 | |
| 3 | 87.1 | INT | — | 89.5 | MER | 2 | 1.00 | 1.19 | 7.57 | 2.33 | 2.4 | ( 0.016) | |
| 4 | 89.3 | INT | — | 90.9 | TDE | 2 | 1.59 | 1.48 | 8.29 | 3.00 | 1.6 | ( 0.018) | |
| 5 | 114.9 | BU | 1 | — | — | — | — | — | — | — | — | 0.032 | |
| 0 | 1 | 0.3 | GC | — | — | — | — | — | — | — | — | — | 1.782 |
| 2 | 3.1 | GC | — | 3.3 | MER | 1 | 0.00 | 4.13 | 17.87 | 10.79 | 0.2 | ( 0.005) | |
| 3 | 3.3 | GC | — | 7.7 | MER | 1 | 0.61 | 1.27 | 4.51 | 2.10 | 4.4 | ( 0.044) | |
| 4 | 4.9 | GC | — | 6.3 | MER | 1 | 0.32 | 1.11 | 9.66 | 2.37 | 1.4 | ( 0.016) | |
| 5 | 4.9 | GC | — | 11.7 | MER | 1 | 0.87 | 1.39 | 2.96 | 1.99 | 6.8 | ( 0.107) | |
| 6 | 8.5 | GC | — | 13.5 | MER | 1 | 1.02 | 2.63 | 26.32 | 7.83 | 5.0 | ( 0.017) | |
| 7 | 11.9 | GC | — | 15.7 | MER | 1 | 1.36 | 2.14 | 17.50 | 5.55 | 3.8 | ( 0.029) | |
| 8 | 87.9 | BU | 1 | — | — | — | — | — | — | — | — | 0.712 | |
| 9 | 112.7 | INT | — | 123.5 | DIS | — | 5.26 | 4.01 | 20.30 | 10.93 | 10.8 | ( 0.078) | |
| 10 | 117.1 | INT | — | 163.1 | TDE | 1 | 5.64 | 4.16 | 15.11 | 10.29 | 46.0 | ( 0.110) | |
| 11 | 123.7 | GC | — | 123.9 | TDE | 1 | 0.49 | 4.11 | 20.36 | 11.23 | 0.2 | ( 0.077) | |
| 12 | 137.1 | INT | — | 154.1 | MER | 8 | 0.22 | 1.05 | 2.56 | 1.44 | 17.0 | ( 0.111) | |
| 13 | 168.5 | BU | 1 | — | — | — | — | — | — | — | — | 0.103 |
Note — (1) Metallicity . (2) ID of a protostar . (3) Formation time of protostars. (4) Formation paths of each protostar: gravitational contraction (GC), break-up of a parent protostar (BU), and interaction of spiral arms (INT). (5) ID of the parent protostar which breaks up. (6) Destruction time of protostars. (7) Destruction mechanism: merger (MER), tidal disruption event (TDE), and dissolution to the ambient gas (DIS). (8) ID of counterpart with which the protostar interacts. (9-12) Impact parameter , radius of major-axis , mass radio , and tidal radius of the impactor . (13) Life time of the protostar. (14) protostellar mass when it is destroyed with parentheses or when the simulation is terminated at without parentheses.
| form | parent | dest. | |||||||||||
| [yr] | [yr] | [au] | [au] | [au] | [yr] | [] | |||||||
| 1 | 0.7 | GC | — | — | — | — | — | — | — | — | — | 1.407 | |
| 2 | 178.9 | BU | 1 | — | — | — | — | — | — | — | — | 0.015 | |
| 1 | 1.3 | GC | — | — | — | — | — | — | — | — | — | 1.693 | |
| 2 | 52.3 | INT | — | 67.9 | MER | 1 | 5.96 | 6.46 | 28.11 | 19.63 | 15.6 | ( 0.044) | |
| 3 | 69.9 | GC | — | 70.1 | DIS | — | 0.00 | 5.20 | 280.10 | 34.00 | 0.2 | ( 0.005) | |
| 4 | 73.5 | BU | 1 | — | — | — | — | — | — | — | — | 0.018 | |
| 5 | 78.5 | BU | 1 | — | — | — | — | — | — | — | — | 0.156 | |
| 6 | 87.5 | INT | — | — | — | — | — | — | — | — | — | 0.012 | |
| 7 | 90.1 | INT | — | 95.1 | TDE | 1 | 5.83 | 4.21 | 328.25 | 29.06 | 5.0 | ( 0.005) | |
| 8 | 92.5 | INT | — | 93.5 | TDE | 1 | 5.85 | 3.74 | 287.93 | 24.68 | 1.0 | ( 0.005) | |
| 9 | 94.5 | BU | 1 | 94.7 | MER | 1 | 0.84 | 4.11 | 420.29 | 30.81 | 0.2 | ( 0.004) | |
| 1 | 0.5 | GC | — | — | — | — | — | — | — | — | — | 1.076 | |
| 2 | 42.5 | BU | 1 | — | — | — | — | — | — | — | — | 0.393 | |
| 3 | 42.7 | INT | — | 46.9 | TDE | 1 | 3.11 | 2.52 | 76.74 | 10.71 | 4.2 | ( 0.009) | |
| 4 | 52.3 | INT | — | 87.1 | TDE | 1 | 3.15 | 3.07 | 21.49 | 8.54 | 34.8 | ( 0.045) | |
| 5 | 54.5 | INT | — | 67.9 | TDE | 2 | 1.38 | 1.25 | 16.93 | 3.20 | 13.4 | ( 0.010) | |
| 6 | 58.7 | INT | — | 66.7 | TDE | 2 | 1.35 | 1.13 | 10.96 | 2.52 | 8.0 | ( 0.015) | |
| 7 | 69.3 | INT | — | 83.7 | TDE | 2 | 1.57 | 1.25 | 20.51 | 3.41 | 14.4 | ( 0.013) | |
| 8 | 82.3 | INT | — | 94.5 | MER | 1 | 1.64 | 3.78 | 41.05 | 13.03 | 12.2 | ( 0.025) | |
| 9 | 83.9 | INT | — | — | — | — | — | — | — | — | — | 0.011 | |
| 10 | 89.1 | BU | 1 | 89.7 | DIS | — | 4.44 | 3.14 | 317.30 | 21.45 | 0.6 | ( 0.003) | |
| 11 | 93.3 | GC | — | 94.5 | DIS | — | 11.55 | 3.78 | 330.92 | 26.12 | 1.2 | ( 0.003) | |
| 12 | 94.7 | GC | — | — | — | — | — | — | — | — | — | 0.005 | |
| 13 | 99.1 | BU | 1 | 99.5 | DIS | — | 4.46 | 3.59 | 196.66 | 20.86 | 0.4 | ( 0.005) | |
| 1 | 0.5 | GC | — | — | — | — | — | — | — | — | — | 5.615 | |
| 2 | 8.3 | GC | — | 11.7 | MER | 1 | 1.17 | 1.99 | 9.60 | 4.23 | 3.4 | ( 0.078) | |
| 3 | 9.5 | GC | — | 13.1 | MER | 1 | 1.80 | 2.55 | 15.96 | 6.43 | 3.6 | ( 0.057) | |
| 4 | 11.5 | GC | — | 14.5 | TDE | 1 | 2.62 | 2.24 | 25.98 | 6.65 | 3.0 | ( 0.039) | |
| 0 | 1 | 0.3 | GC | — | 10.3 | TDE | 2 | 3.70 | 2.06 | 1.15 | 2.15 | 10.0 | ( 0.365) |
| 2 | 4.3 | INT | — | — | — | — | — | — | — | — | — | 2.113 | |
| 3 | 32.1 | INT | — | 35.5 | TDE | 2 | 3.92 | 2.61 | 16.01 | 6.57 | 3.4 | ( 0.056) | |
| 4 | 32.5 | INT | — | 36.3 | MER | 7 | 0.76 | 0.77 | 0.32 | 1.25 | 3.8 | ( 0.036) | |
| 5 | 32.7 | INT | — | 39.1 | TDE | 2 | 3.42 | 2.97 | 5.89 | 5.36 | 6.4 | ( 0.167) | |
| 6 | 33.1 | BU | 5 | 33.3 | MER | 5 | 1.06 | 2.18 | 3.29 | 3.25 | 0.2 | ( 0.005) | |
| 7 | 35.9 | INT | — | 36.3 | MER | 4 | 0.76 | 0.86 | 3.08 | 1.25 | 0.4 | ( 0.012) | |
| 8 | 37.3 | BU | 5 | 40.9 | MER | 13 | 0.66 | 0.67 | 1.49 | 0.77 | 3.6 | ( 0.024) | |
| 9 | 37.5 | INT | — | 49.3 | TDE | 13 | 3.87 | 3.73 | 3.88 | 5.86 | 11.8 | ( 0.133) | |
| 10 | 37.5 | INT | — | 47.7 | TDE | 13 | 4.31 | 2.16 | 1.16 | 2.27 | 10.2 | ( 0.203) | |
| 11 | 38.1 | BU | 2 | 47.1 | MER | 10 | 2.05 | 2.51 | 3.24 | 3.71 | 9.0 | ( 0.045) | |
| 12 | 38.3 | INT | — | 45.5 | TDE | 9 | 1.88 | 0.90 | 2.77 | 1.26 | 7.2 | ( 0.031) | |
| 13 | 38.9 | INT | — | 66.5 | TDE | 2 | 5.71 | 2.80 | 1.71 | 3.35 | 27.6 | ( 0.855) | |
| 14 | 40.5 | INT | — | 45.3 | TDE | 13 | 1.24 | 1.05 | 0.98 | 1.03 | 4.8 | ( 0.097) | |
| 15 | 40.5 | INT | — | 49.3 | MER | 2 | 3.22 | 4.10 | 305.09 | 27.59 | 8.8 | ( 0.004) | |
| 16 | 41.1 | BU | 2 | 41.7 | TDE | 15 | 5.21 | 1.26 | 7.53 | 2.47 | 0.6 | ( 0.003) | |
| 17 | 42.1 | INT | — | 43.3 | TDE | 15 | 5.49 | 0.90 | 12.91 | 2.12 | 1.2 | ( 0.004) | |
| 18 | 42.7 | BU | 11 | 43.7 | TDE | 10 | 1.92 | 1.50 | 3.48 | 2.28 | 1.0 | ( 0.023) | |
| 19 | 43.9 | INT | — | 49.9 | MER | 2 | 3.48 | 4.10 | 48.15 | 14.91 | 6.0 | ( 0.027) | |
| 20 | 47.5 | INT | — | 59.9 | TDE | 2 | 4.84 | 4.33 | 12.93 | 10.16 | 12.4 | ( 0.109) | |
| 21 | 51.5 | INT | — | — | — | — | — | — | — | — | — | 0.352 | |
| 22 | 65.9 | INT | — | — | — | — | — | — | — | — | — | 0.126 | |
| 23 | 69.9 | INT | — | — | — | — | — | — | — | — | — | 0.815 | |
| 24 | 70.7 | BU | 2 | — | — | — | — | — | — | — | — | 0.365 | |
| 25 | 71.5 | INT | — | 73.9 | TDE | 22 | 1.50 | 0.94 | 2.54 | 1.28 | 2.4 | ( 0.022) | |
| 26 | 75.3 | INT | — | 82.5 | MER | 23 | 1.02 | 1.56 | 3.44 | 2.36 | 7.2 | ( 0.121) |
A.1 Formation/destruction of protostars
In this work, we find that multiple protostellar systems form in the accretion discs. The protostars are created and destroyed through several processes as summarized in Section 3.4. In this section, we describe concrete cases of the formation/destruction processes.
A.1.1 Formation of protostars
Tables 3 and 4 show the formation time and the formation path of each protostar in our simulations for Halo A and B, respectively. We find that protostars form through the following three processes: gravitational contraction (GC), the break-up of a protostar (BU), and the interaction of spiral arms (INT).
(i) Gravitational contraction
Fig. 19 shows the formation process of protostars through GC for HBZ-6. At , 9.5, and 11.5 yr, PS2, PS3, and PS4 form through the fragmentation of the filament (Section 3.2.2) at distances 10.9, 12.0, and 11.2 au from PS1, respectively. Linear analyses show that the most unstable wave number of perturbations on an isothermal filament is , where is the scale height, or an effective radius of the filament (Nagasawa, 1987; Inutsuka & Miyama, 1997). We can estimate the length-scale where fragmentation occurs to be au for and K. The initial separation between the secondary protostars and PS1 is comparable to this analytic estimate. This is also consistent with the findings of our previous study (C16).
(ii) Break-up of rapidly rotating protostars
Fig. 19 shows the process of BU for HAZ-4. Since PS1 forms in the filament, it has a bar-like shape from the beginning. After PS1 acquires sufficient angular momentum, third or higher-order perturbations grow, and PS1 deforms into a “dumb-bell-shape”.666More strictly, it is a Jacobi ellipsoid that can have a “dumb-bell-shape” (Eriguchi et al., 1982). Protostars in our simulations are more oblate with aspect ratios , below the Jacobi sequence. Further detailed modelling is needed to investigate a criterion for the break-up of such oblate objects (Tohline, 2002). The dumb-bell structure develops further and the protostar is eventually divided into two separate ones. In the classical theory of “fission”, an object breaks up into an equal-mass binary (Lyttleton, 1953). In our run HAZ-4, only 7% of mass is taken apart from the main body, which thus should be more appropriately characterized as “mass-shedding” suggested by Eriguchi et al. (1982).
Protostars forming through BU show interesting accretion histories, as shown in Figs 14 and 15 (see the orange curve in Fig. 14b as a notable example). Within yr after its formation, the secondary protostar accretes gas rapidly because it is still in a dense spiral arm. Then the secondary protostar is ejected to a few tens au away from the center, where the gas density is as low as , and thus the accretion rate becomes low. Since the initial ejection velocity is less than the escape velocity of the accretion disc, the protostar falls back into the dense region and orbits around PS1. The accretion rate increases again up to the value comparable to that of PS1.
(iii) Interaction of spiral arms
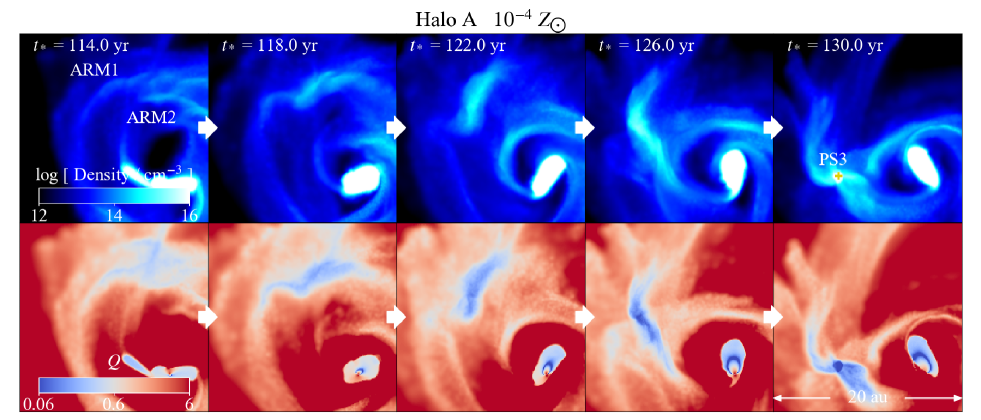
Fig. 20 shows the formation of a protostar through the process of INT for HAZ-4. The spiral arms ARM1 and ARM2 collide with each other and produce a dense blob. The blob eventually becomes self-gravitating, and a protostar PS3 forms at yr. To confirm the criterion for the fragmentation of spiral arms (Eq. 16; Takahashi et al., 2016; Inoue & Yoshida, 2018), we calculate the Toomre parameter in ARM1 and ARM2. The lower panels of Fig. 20 show that is initially around the critical value 0.6 on ARM1 and ARM2. After the two arms collide, becomes larger by an order of magnitude. Then, the minimum value of becomes below 0.6, and the dense region grows to a protostar PS3. DF through INT have been studied by Inoue & Yoshida (2020). They perform a detailed analysis of the time evolution of spiral arms using an analytic model and direct simulations to define the conditions for fragmentation.
A.1.2 Destruction of protostars
The destruction of protostars is an important process to regulate the number of protostars. Fig. 21 shows that, for HBZ0, more than 20 protostars form within 50 yr because of a high accretion rate ( at yr). Most of the protostars merge with the massive protostars PS2, PS13 and PS20, and only the three massive protostars survive at yr. We find the three characteristic destruction processes: dissolution of protostars into ISM (DIS) mergers (MER) and TDEs. Tables 3 and 4 show the destruction time and path of each protostar. We show examples of MER and TDE in this section.
(ii) Mergers with another member protostar
Fig. 22 shows that a protostar PS3 merges with PS4 at yr for HAZ-5. PS3 approaches PS4 with an impact parameter au. It is smaller than the radius of PS4 au. Through this near head-on collision, PS3 completely merges with PS4 (see Section 3.4.2).
(iii) Tidal disruption events
Some protostars are destroyed through TDEs. Fig. 23a shows a TDE of PS4 with PS2 at yr for HAZ-6. The impact parameter between them is au. It is larger than the radius of PS2 au, but smaller than the tidal radius au. During the collision, PS4 is strongly deformed by the tidal force of PS2, and dense arm-like structures form around PS2. The whole elongated structure is eventually accreted onto PS4. We also find a case where another protostar forms from the dense, deformed structure after TDEs. Fig. 23b shows a TDE of PS4 with PS1 and subsequent formation of PS8 for HAZ-5. PS4 approaches PS1 at yr with a large impact parameter au compared to the protostellar radius au. Just after the interaction, the specific angular momentum of PS1 becomes temporarily larger (corresponding to ) than the critical value 0.02 for break-up (see Fig. 14). Although the impact parameter is larger than the tidal radius (2.30 au), TDE occurs in this case (11th and 12th columns in Tables 3 and 4). Since the mass ratio between impacting and target protostars are comparable to the unity (), they deforms through each other’s tidal force, and the cross-section increases.
A.2 Case without fragmentation
DF occurs for HBZ0 but not for HBZ-6, although the thermal evolution is quite similar in these runs (Fig. 7). Fig. 24 shows the density, temperature, and Toomre parameter for HBZ0 and HBZ-6, respectively. For HBZ0, a secondary protostar PS2 form at yr and collides with PS1 at at yr. Since PS1 and PS2 have almost equal mass ( and , repsectively), the large amount of gas () is stripped off into the ambient medium after the offset collision. The gas is stretched up to au, and the temperature declines adiabatically in the elongated structure. Then unstable spiral arms with form (lower panels of Fig. 24a).
Contrastingly, for HBZ-6, gas accretion onto the primary PS1 occurs in an almost spherical manner (Fig. 13b). Although multiple protostars form along the filament and collide with PS1, these secondary protostars have small masses (, , and ) relative to PS1 ( at yr). The protostars collide with PS1 so quiescently that the material in the protostars does not scatter. Furthermore, since PS1 continues growing with a high accretion rate (), the circumstellar medium is warm (– K), and is less susceptible for the gravitational instability (Fig. 24b).