G107.0+9.0: A New Large Optically Bright, Radio and X-Ray Faint Galactic Supernova Remnant in Cepheus
Abstract
Wide-field H images of the Galactic plane have revealed a new supernova remnant (SNR) nearly three degrees in diameter centred at = 107.0, = +9.0. Deep and higher resolution H and [O III] 5007 Å images show dozens of H filaments along the remnant’s northern, western, and southwestern limbs, but few [O III] bright filaments. The nebula is well detected in the H Virginia Tech Spectral-Line Survey images, with many of its brighter filaments even visible on Digital Sky Survey images. Low-dispersion spectra of several filaments show either Balmer dominated, non-radiative filaments or the more common SNR radiative filaments with [S II]/H ratios above 0.5, consistent with shock-heated line emission. Emission line ratios suggest shock velocities ranging from km s-1 along its western limb to km s-1 along its northwestern boundary. While no associated X-ray emission is seen in ROSAT images, faint 1420 MHz radio emission appears coincident with its western and northern limbs. Based on an analysis of the remnant’s spatially resolved H and [O III] emissions, we estimate the remnant’s distance at kpc implying a physically large (dia. = pc) and old ( yr) SNR in its post-Sedov radiative phase of evolution expanding into a low density interstellar medium ( cm-3) and lying some pc above the Galactic plane.
keywords:
ISM: individual objects: G107.0+9.0, ISM: supernova remnant - shock waves - optical1 Introduction
Of the nearly 300 Galactic supernova remnants (SNRs) currently identified, the overwhelming majority were discovered through radio observations based on the characteristic nonthermal radio emission associated with shocked gas (Downes, 1971; Chevalier, 1977; Green, 1984, 2004, 2019). Although less than half of Galactic SNRs show any appreciable optical emission, optical studies of SNRs are useful for measuring shock and expansion velocities, ISM abundances, and the kinematics of metal-rich ejecta in the youngest remnants. In some cases, a remnant’s optical emission can also help define its overall size and morphology. This is especially true for some radio weak SNRs which nonetheless exhibit significant optical emission (Boumis et al., 2009; Stupar & Parker, 2012; Neustadt et al., 2017; Stupar et al., 2018; How et al., 2018; Fesen et al., 2019).
The line ratio of I([S II])/I(H) has proven to be a successful observational tool for identifying optical nebulae as SNRs in both Galactic and extragalactic settings (Blair et al., 1981; Dopita et al., 1984; Fesen et al., 1985; Leonidaki et al., 2013; Long, 2017). Using this line ratio criterium, several new Galactic SNRs have been optically discovered in the last two decades (e.g., Stupar et al. 2007; Fesen & Milisavljevic 2010) along with dozens of additional SNR candidates (Stupar et al., 2008; Stupar & Parker, 2011; Boumis et al., 2009; Alikakos et al., 2012; Sabin et al., 2013). Although the optical emissions of many known and suspected Galactic remnants are faint and fragmentary (Stupar et al., 2007; Stupar & Parker, 2011), a few situated well off the Galactic plane have been found to exhibit large and extensive optical emission shells such as SNR G70.0-21.5 (Boumis et al., 2002; Fesen et al., 2015).
Here we report on the identification of another large and high Galactic latitude SNR through its optical emission. Its discovery was prompted by Yuan & Liu (2013) who in their search for faint planetary nebulae called attention to a large, circular emission feature visible in the deep Milky Way H survey of Virginia Tech Spectral-Line Survey (VTSS; Dennison et al. 1998; Finkbeiner 2003). They suggested that this nebula at Galactic coordinates , might be an unrecognized SNR.
Many of the nebula’s brightest filaments are visible on Digitized Palomar Sky Survey (DSS1 and DSS2) images. These include several filaments along it western and southwestern limbs plus a thin filament along its northern limb. Even an [O III] 4959, 5007 Å bright filament along the northwestern limb is easily visible in the blue DSS images.
While there is no known SNR at this location in a recently updated catalogue of Galactic SNRs (Green, 2019) or in a listing of high-energy known or suspected SNRs (Safi-Harb et al., 2013), the presence of so many filamentary features suggested to us the likely presence of a large yet unknown SNR situated well off the Galactic plane despite a lack of reported coincident low-frequency radio emission.
In this paper, we present evidence that this nebula, G107.0+9.0, is a previously unrecognized Galactic SNR based on its optical emission properties and structure as determined from wide and narrow H, [O III] and [S II] images plus low-dispersion, long-slit spectra. Our imaging data and spectra are described in 2, with results presented in 3. The general properties of this new SNR including its shock velocities, distance, size and age are discussed in 4, with our conclusions summarized in 5.
2 Observations
Wide-field, low-resolution H images of the region around the G107.0+9.0 nebula were obtained as part of the MDW Hydrogen-Alpha Survey111https://www.mdwskysurvey.org in November 2017. This survey uses a 130 mm telescope at the New Mexico Skies Observatory, with a FLI ProLine 16803 CCD and a 3 nm filter centered on H. This telescope-camera system has a field-of-view (FOV) of approximately with a pixel size of . Each field was observed with 12 1200 s exposures.
Additional wide-field H, [O III] and [S II] images were obtained using two different setups. An Apogee U16M CCD attached to a 0.37 m telescope located in southern France at the Remote Observatories Southern Alps (ROSA) facility was used with 5 nm H and [S II] filters to provide images with a FOV . Wide-field images were also obtained using a Nikon F/2.0 200 mm focal length lens in front of an pixel SBIG STL6303e CCD yielding a scale of pixel-1 and a FOV of degrees. A series of s and s exposures were obtained through 3 nm [O III] and 5 nm H narrow passband filters, respectively.
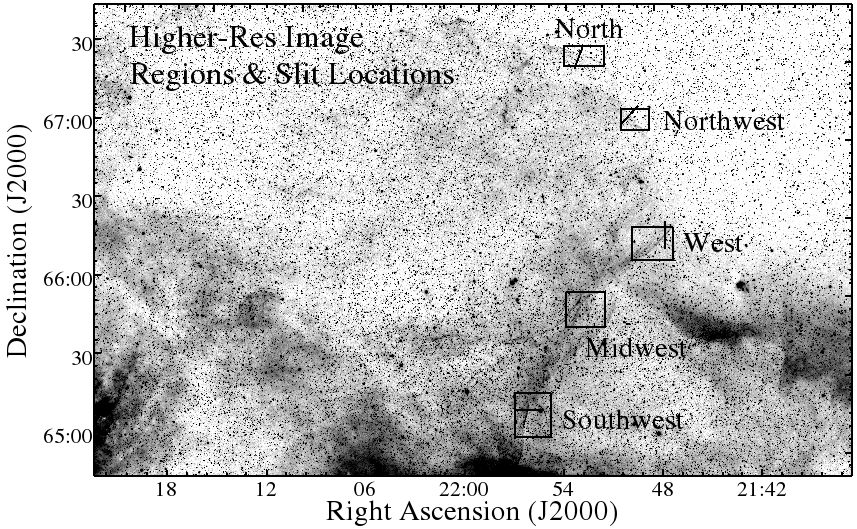
Follow-up, higher-resolution images were obtained in September and October 2019 with the 2.4m Hiltner telescope at the MDM Observatory at Kitt Peak, Arizona using the Ohio State Multi-Object Spectrograph (OSMOS; Martini et al. 2011) in direct imaging mode. OSMOS uses a 4k 4k CCD providing an effective FOV of . With on-chip binning, this yielded an image scale of pixel-1.
A series of 8 nm wide H + [N II] and [O III] filter images using this set-up were taken with three exposures of either 900 s or 1200 s for each of five regions of G109.0+9.0. (Note: We will sometimes refer to these H + [N II] images as simply H images since this nebula’s [N II] lines are typically weak.) These include two northern and northwestern regions plus three regions along the remnant’s filament rich western limb.
Based on these images, low-dispersion optical spectra of five filaments in the remnant’s northern, western and southern regions were subsequently obtained again with the MDM 2.4m Hiltner telescope using OSMOS now in spectroscopic mode. Using a blue VPH grism (R = 1600) and a 1.2 arcsec wide slit, exposures of s and s were taken of covering 4000–6900 Å with a spectral resolution of 1.2 Å pixel-1 and a FWHM = 3.5 Å. Slit orientations varied as a function of filament morphology and position angle. Spectra were extracted from regions clean of appreciable emission along each of the slits. Because two spectra taken of a bright SW filament showed nearly identical line emissions, we present the spectra only of one of these.
MDM images and spectra were reduced using the OSMOS reduction pipelines222https://github.com/jrthorstensen/thorosmos in Astropy. Spectra were further reduced using PYRAF333PYRAF is a product of the Space Telescope Science Institute, which is operated by AURA for NASA. and L.A. Cosmic (van Dokkum, 2001) to remove cosmic rays and calibrated using a HgNe lamp and spectroscopic standard stars (Oke, 1974; Massey & Gronwall, 1990).
3 Results
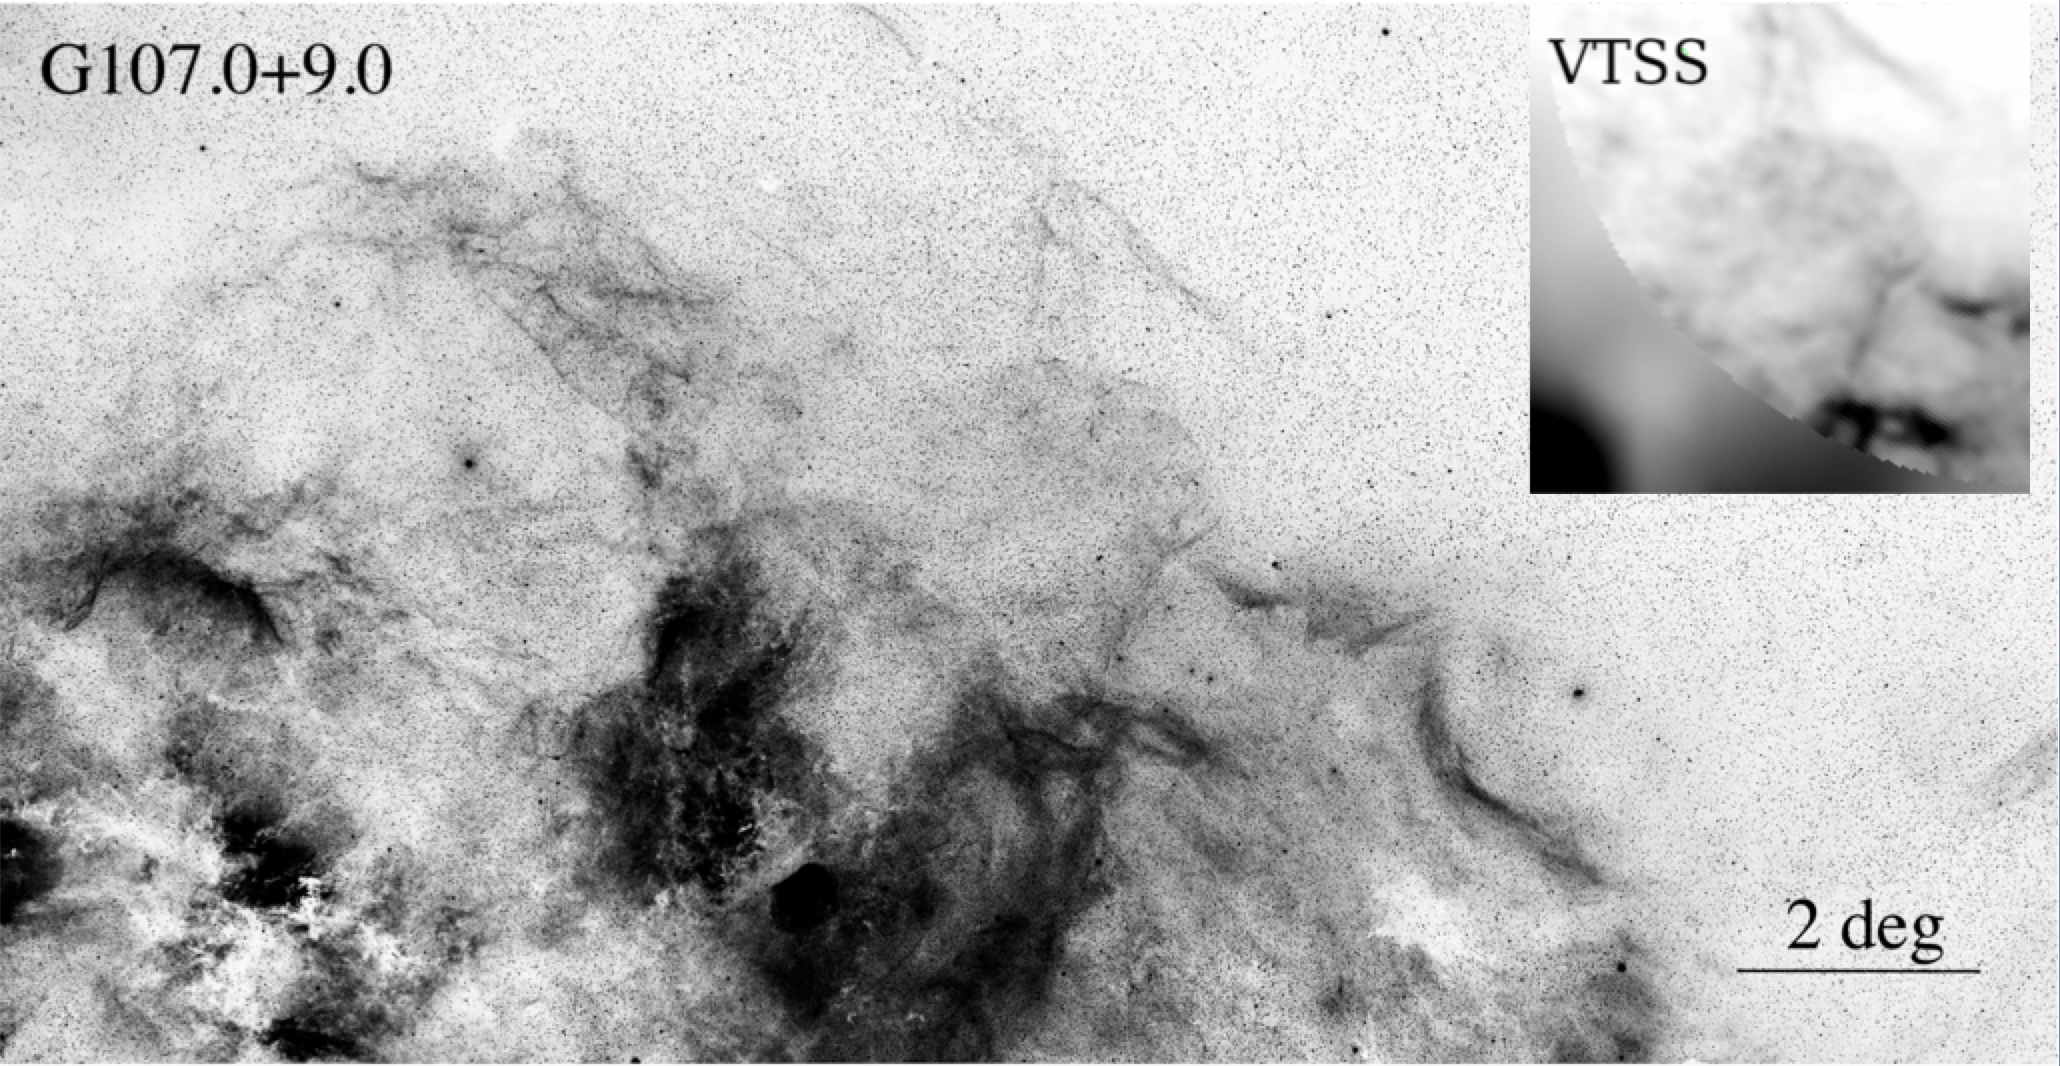
In order to place G107.0+9.0 (hereafter also referred to as simply G107) in context relative to other nebulosities along and several degrees above the Galactic plane, Figure 1 shows an approximately composite image made from some twenty MDW images. The G107.0+9.0 nebulosity appears as a nearly emission filled spherical nebula situated almost three degrees above much brighter Galactic emission nebulae to its south and several degrees west of the large emission shell centred on the bright K0 III star, iota Cephei. While the VTSS H image insert in Figure 1 suggests G107’s structure is nearly completely spherical toward the east, its extent to the south is uncertain due to coincident bright H II region emissions to its south and southeast.
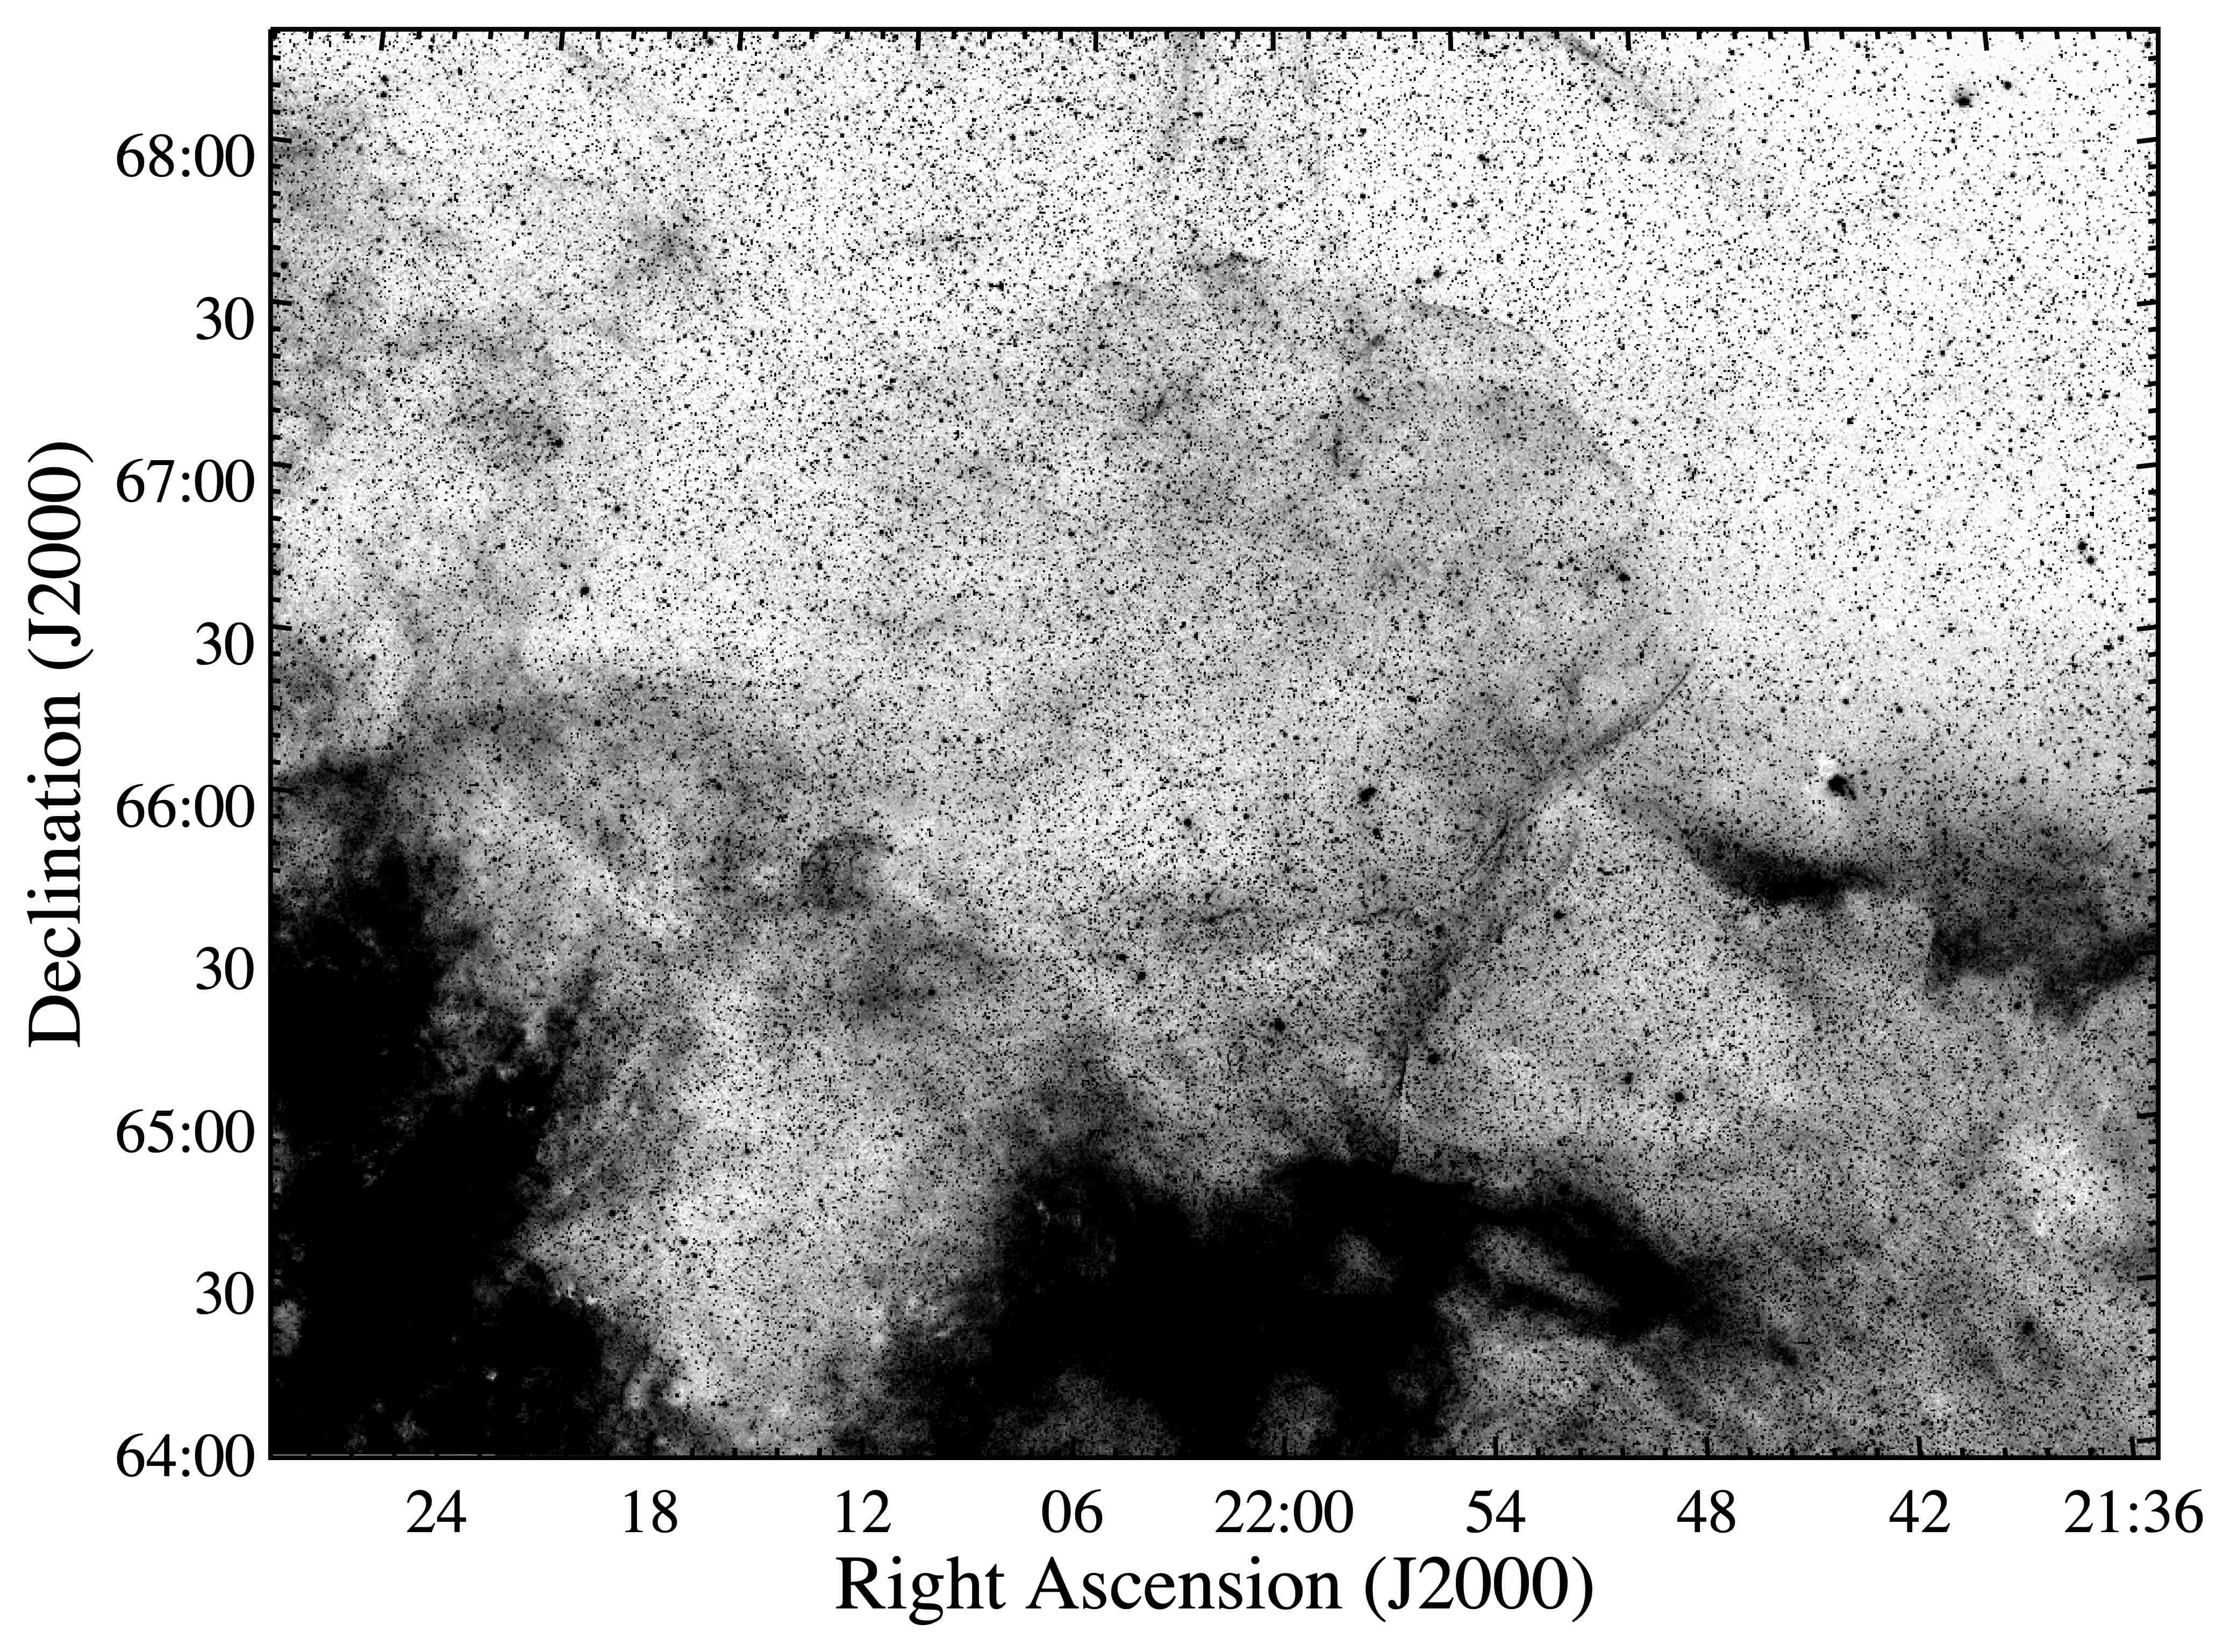
Greater detail can be seen in Figure 2 which shows a degree composite MDW H survey image. While the VTSS survey image suggested a fairly complete circular emission structure especially along G107’s eastern limb, both data sets detect a rather large nebula 2.8 degrees in diameter roughly centered at RA (J2000) = , Dec (J2000) = 66 corresponding to Galactic coordinates of degrees.
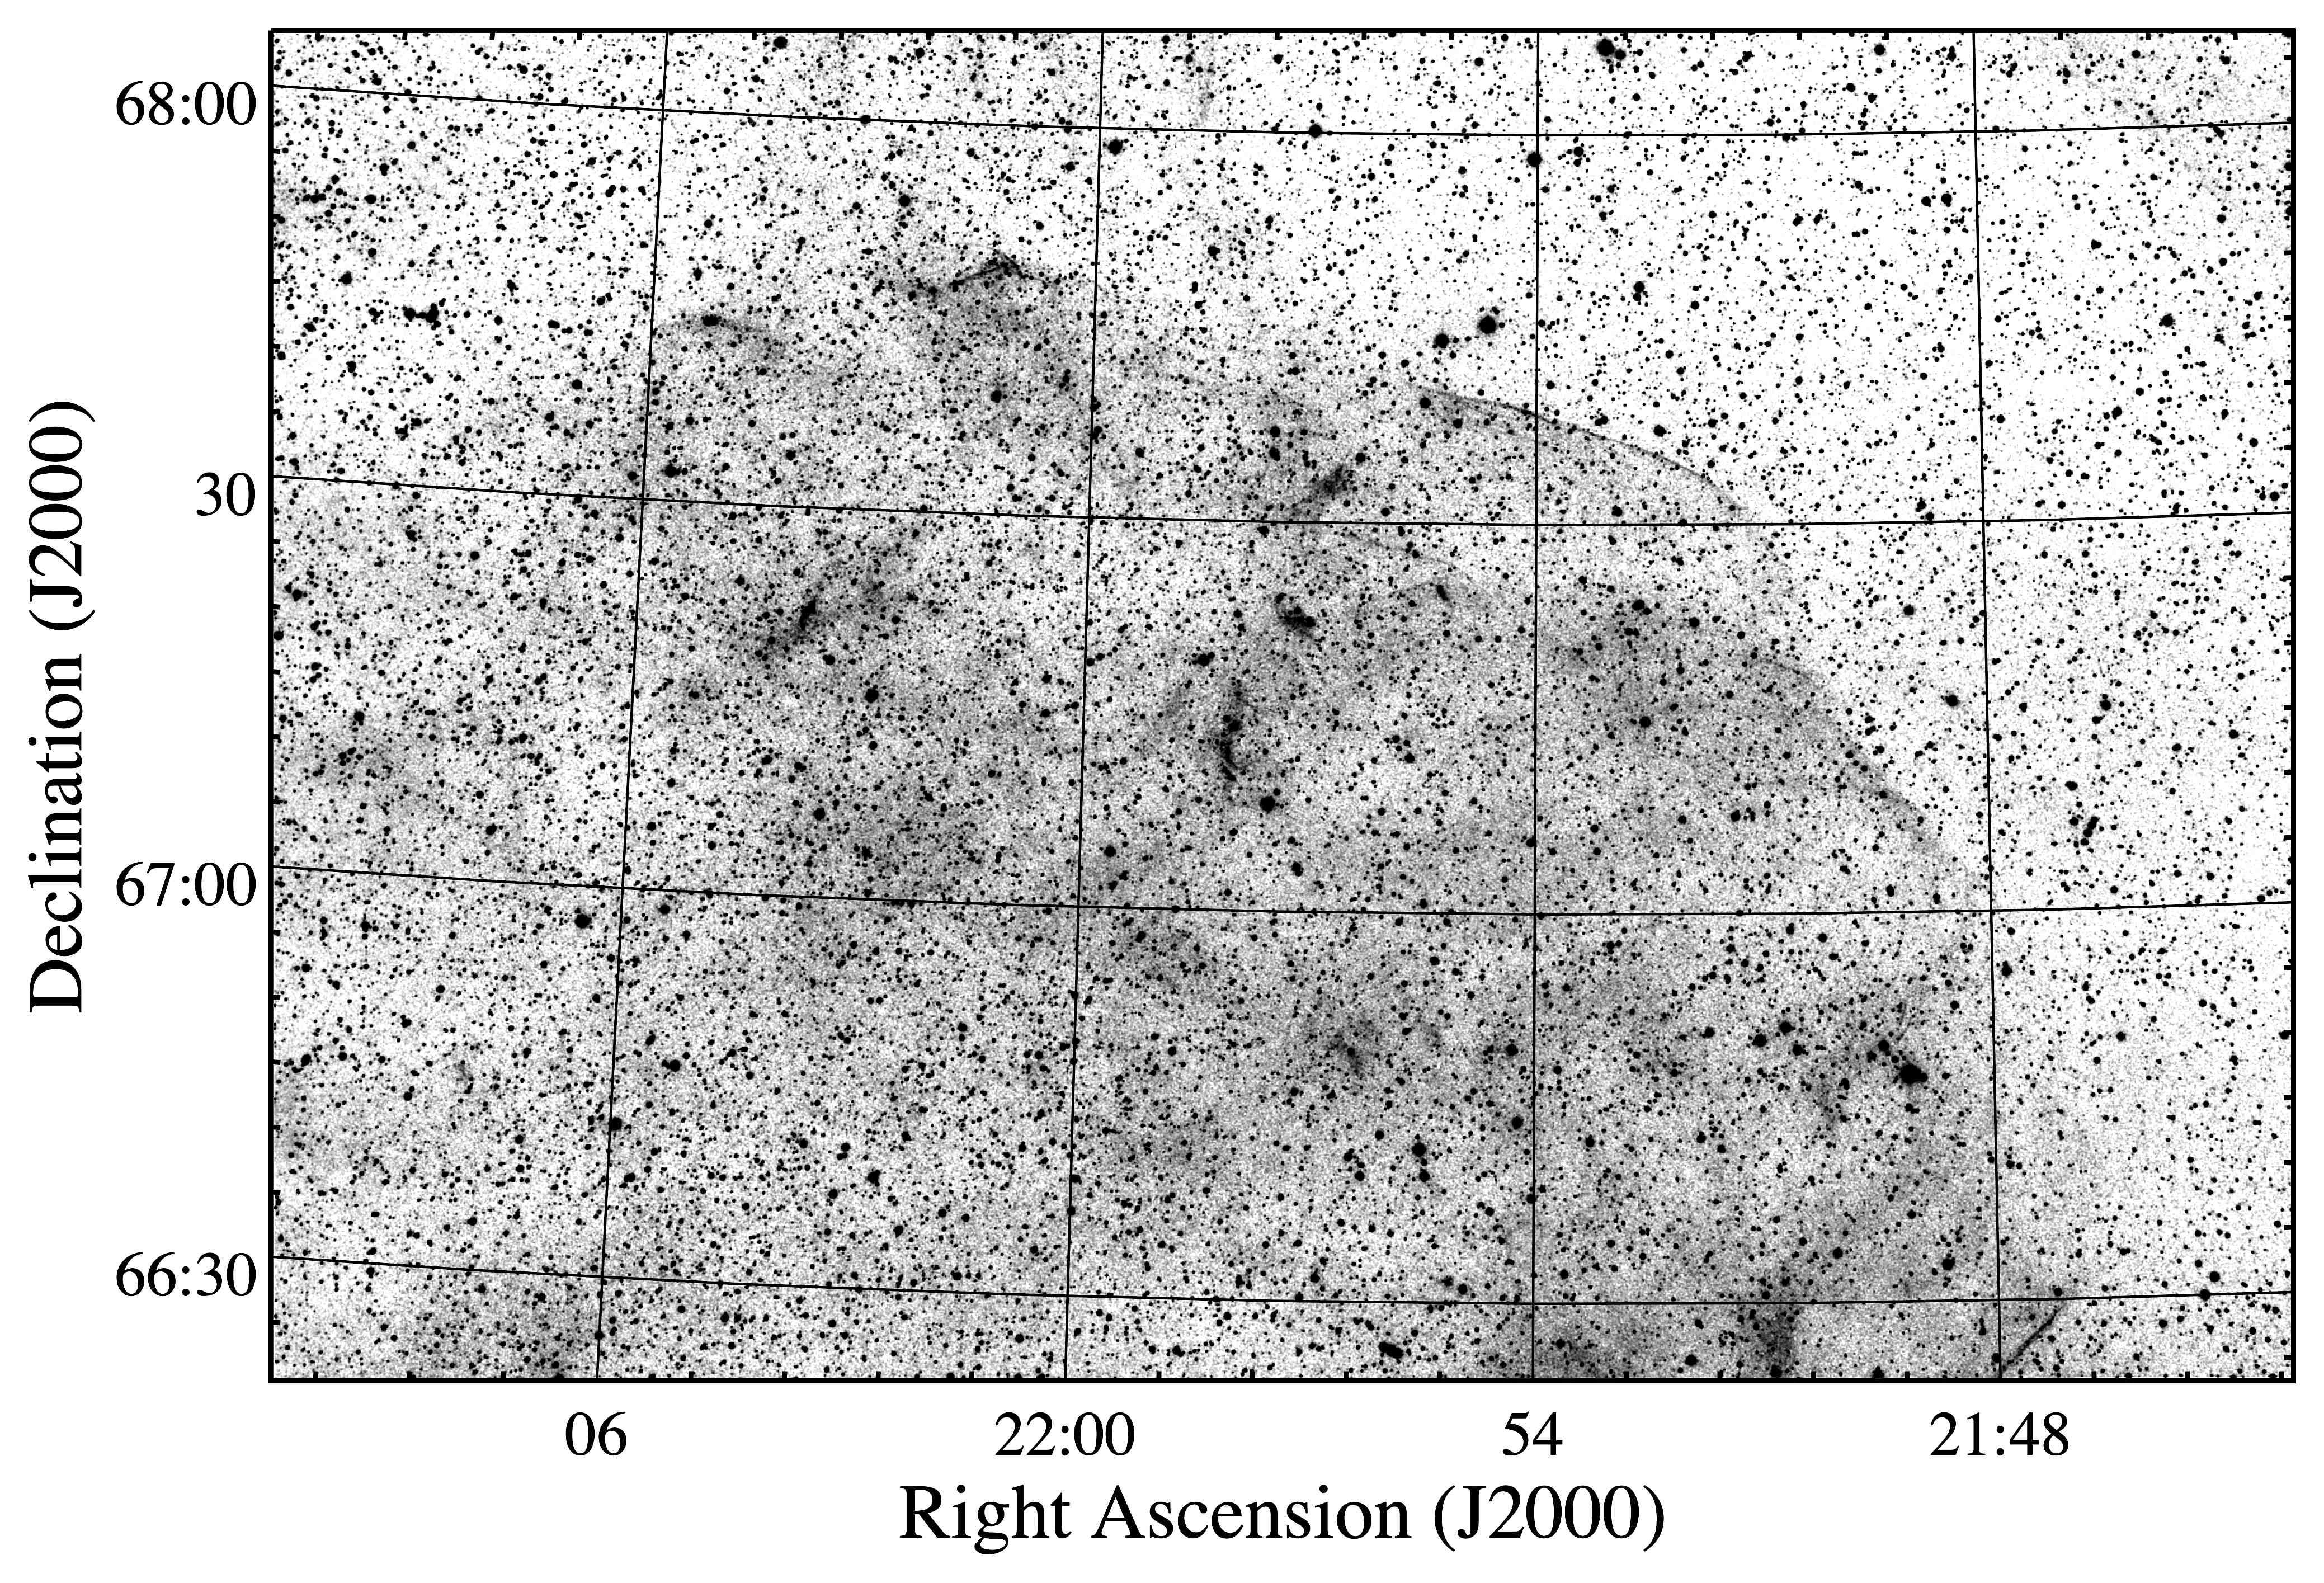
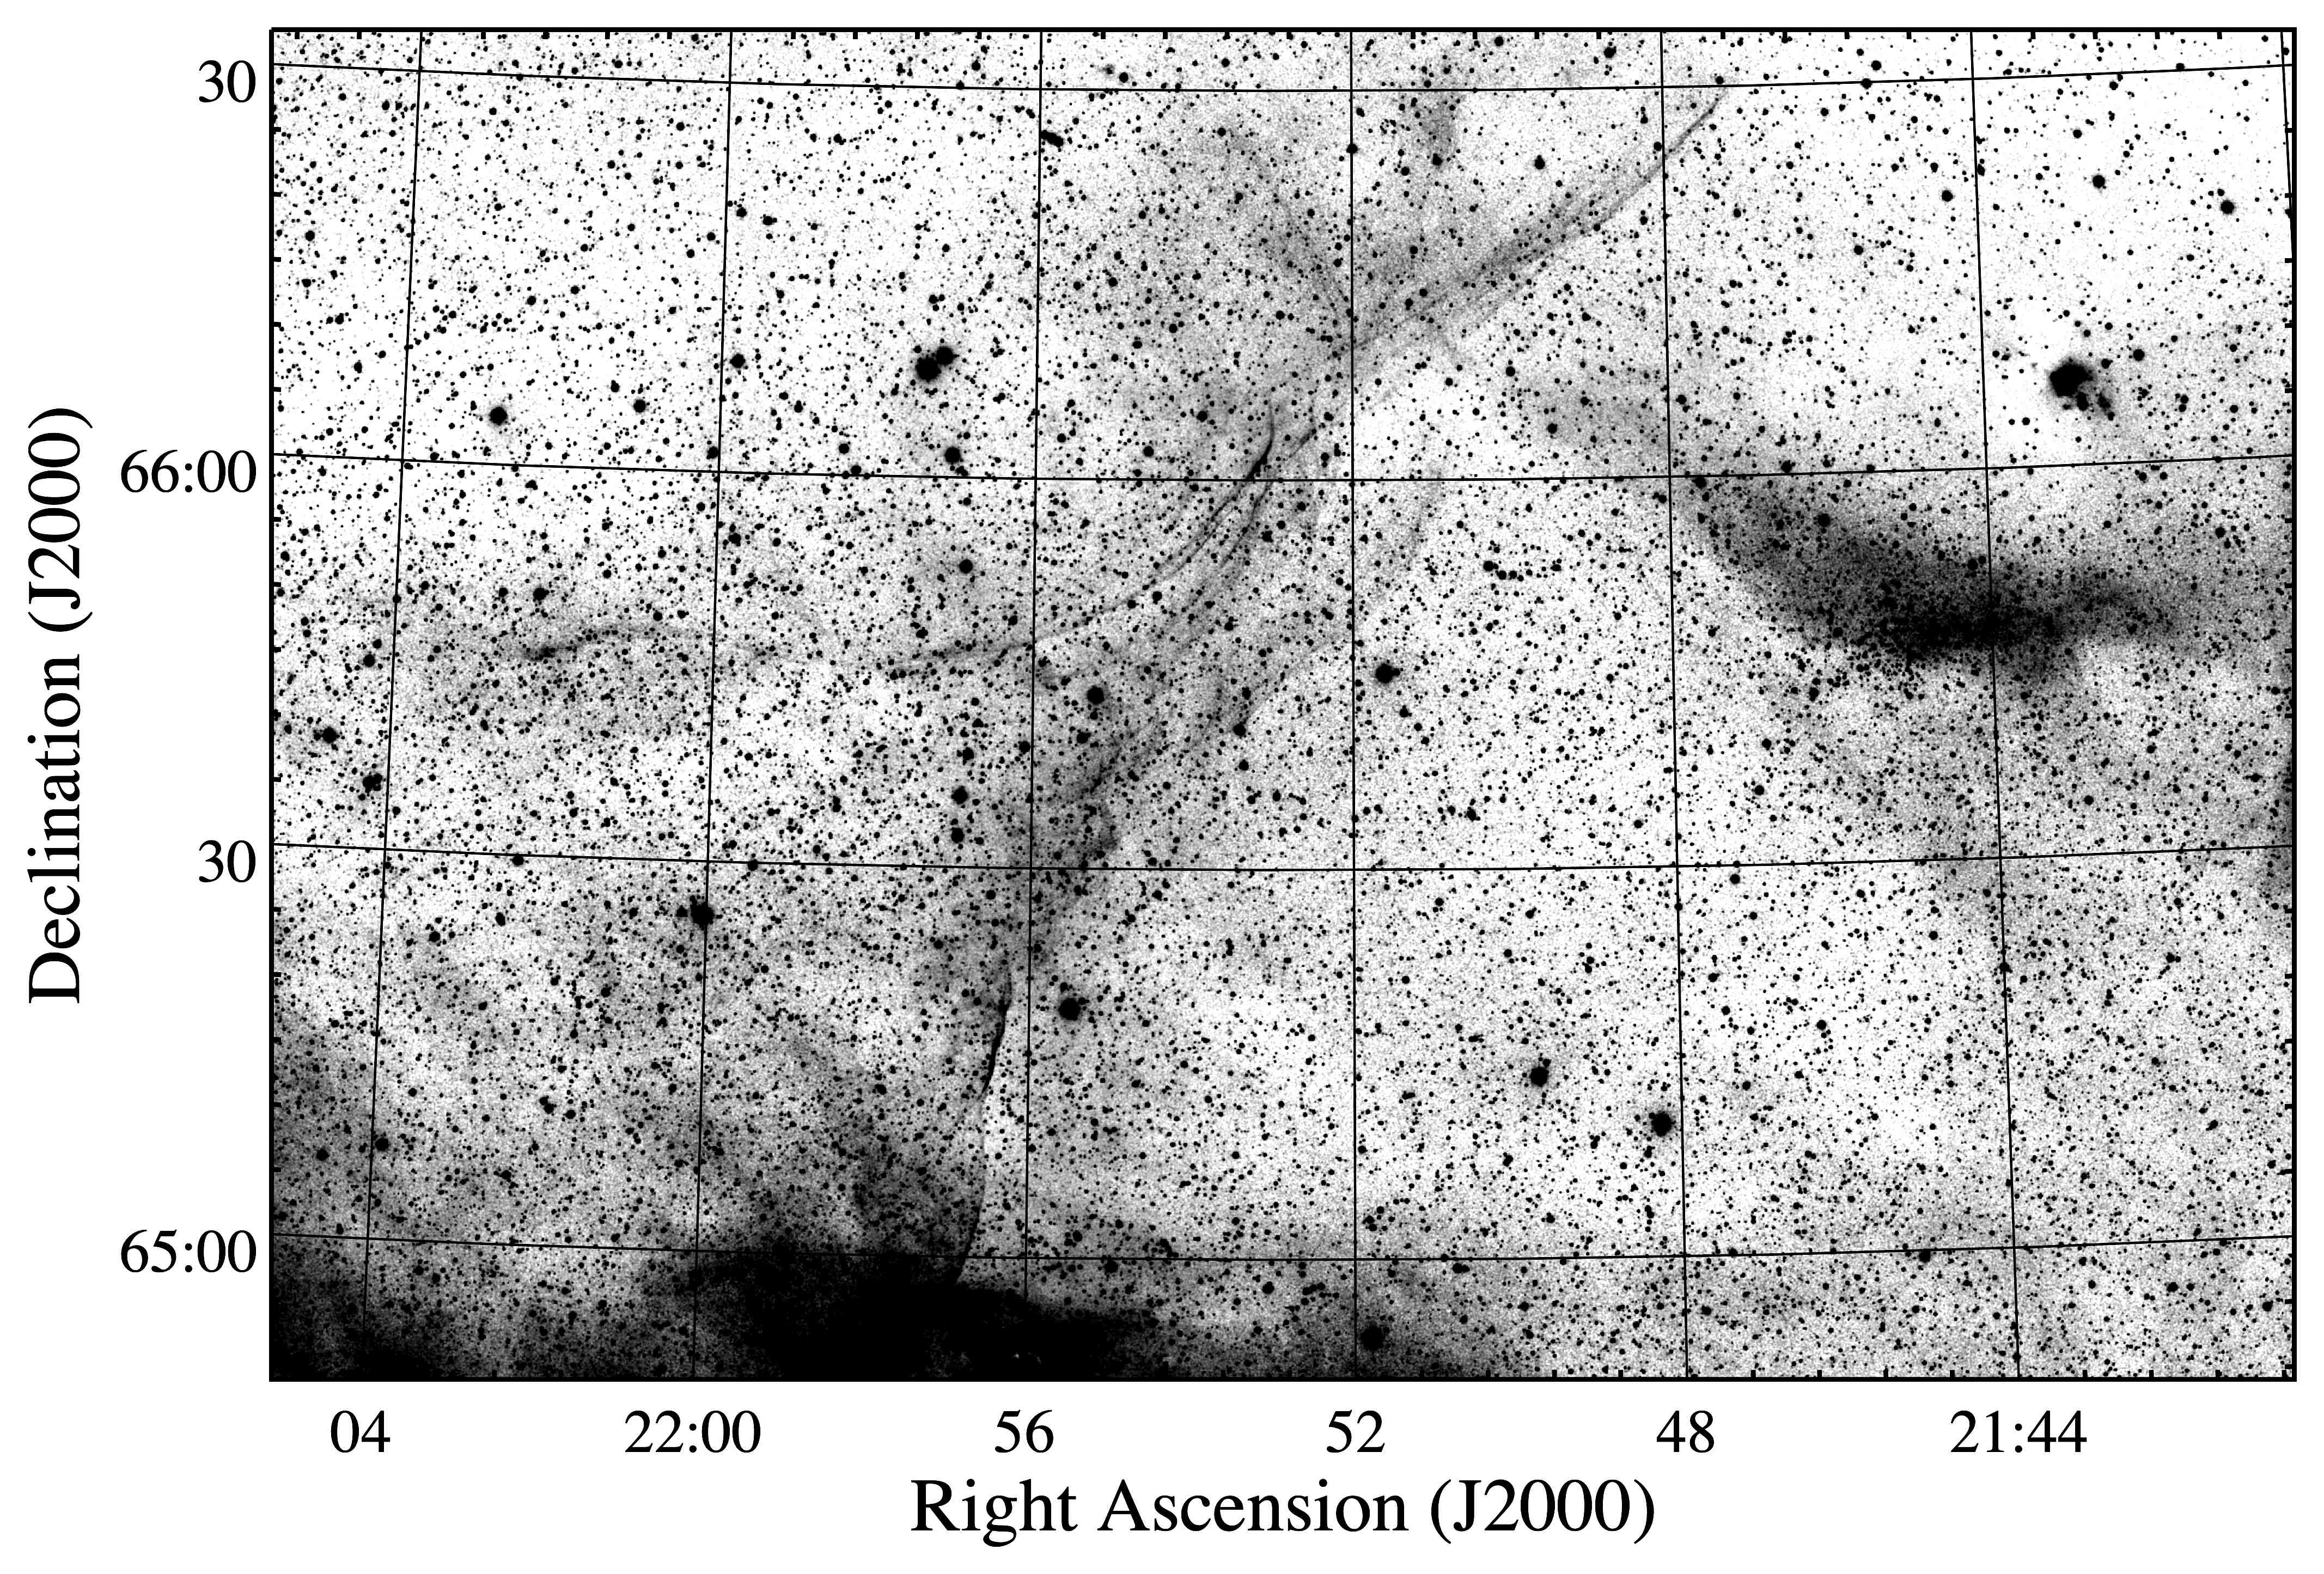
As shown in the enlargements of the MDW H images presented in Figure 3, G107 possesses numerous filaments along its northern and western boundaries, plus considerable interior diffuse emission especially in its western half and along its northern and western limbs. While only one bright filament is readily noticeable along G107’s northernmost limb (upper panel), many such filaments can be seen along its western and southwestern edge (lower panel).
These wide FOV and relatively low-resolution MDW images, deep as they are, hide a far richer, more complex and quite extensive network of optical filaments visible in higher resolution images. Below we will present and briefly discuss our higher resolution images for five regions around G107 in clockwise order starting with the thin, bright northern filament (see Fig. 4).
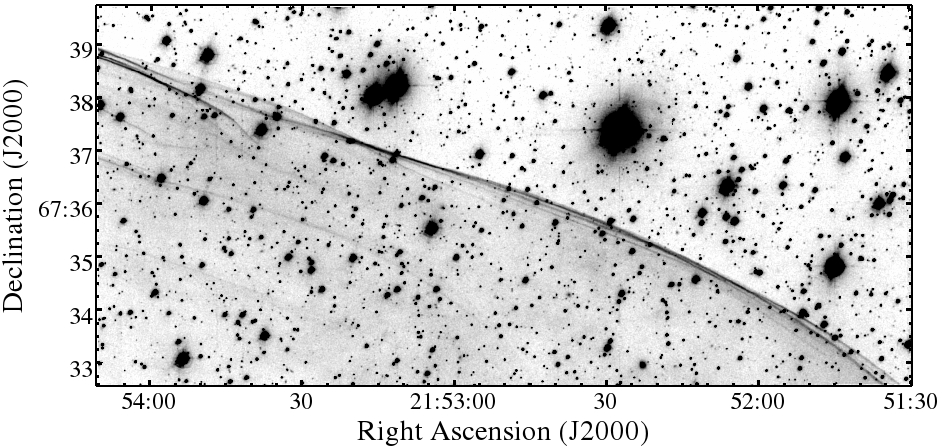
North Filament: A sharp and bright filament seen prominently in Figure 3 (upper panel) along G107’s northern limb, and even easily visible on DSS images, is shown better resolved in Figure 5. Appearing as a textbook example of an optically emitting interstellar shock front, this filament consists of several closely overlapping shocks view edge-on lying in the plane of the sky. Considerable interior trailing emission is readily visible, making for a distinct emission boundary of shocked and unshocked interstellar medium.
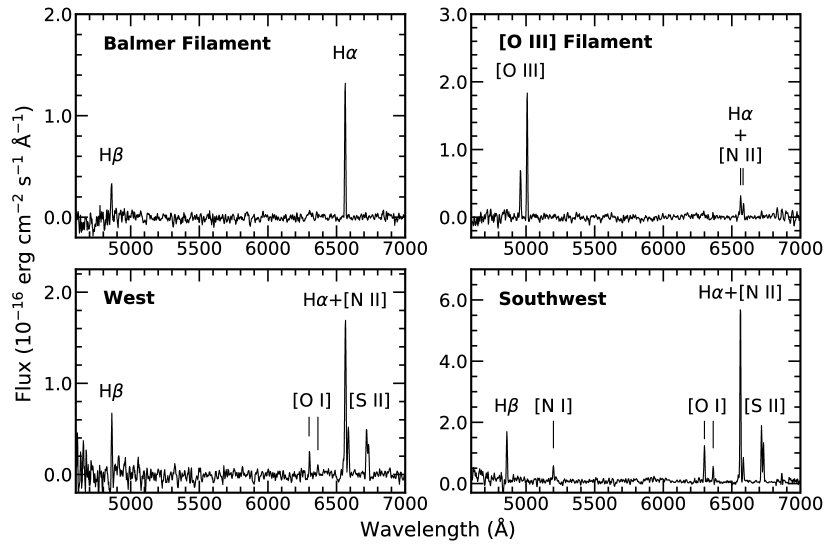
Spectra of this filament, shown in the upper left panel in Figure 6, revealed a Balmer dominated, non-radiative type of shock emission. No emission lines other than H and H were detected in the wavelength region Å. This included absence of the [S II] 6716, 6731 Å lines, commonly seen in the shock filaments of SNRs. An observed H/H ratio 4.1 suggests an assuming an intrinsic unreddened value of 2.76 for T K (Osterbrock & Ferland, 2006).
Although such Balmer dominated spectra have most often been associated with relatively high-velocity shocks ( 1000 km s-1) present in young SNRs, they have also been seen in much older remnants where slower shock velocities km s-1 are present; e.g., the Cygnus Loop (Raymond et al., 1983; Fesen et al., 1992; Medina et al., 2014) and G156.2+5.7 (Gerardy & Fesen, 2007).
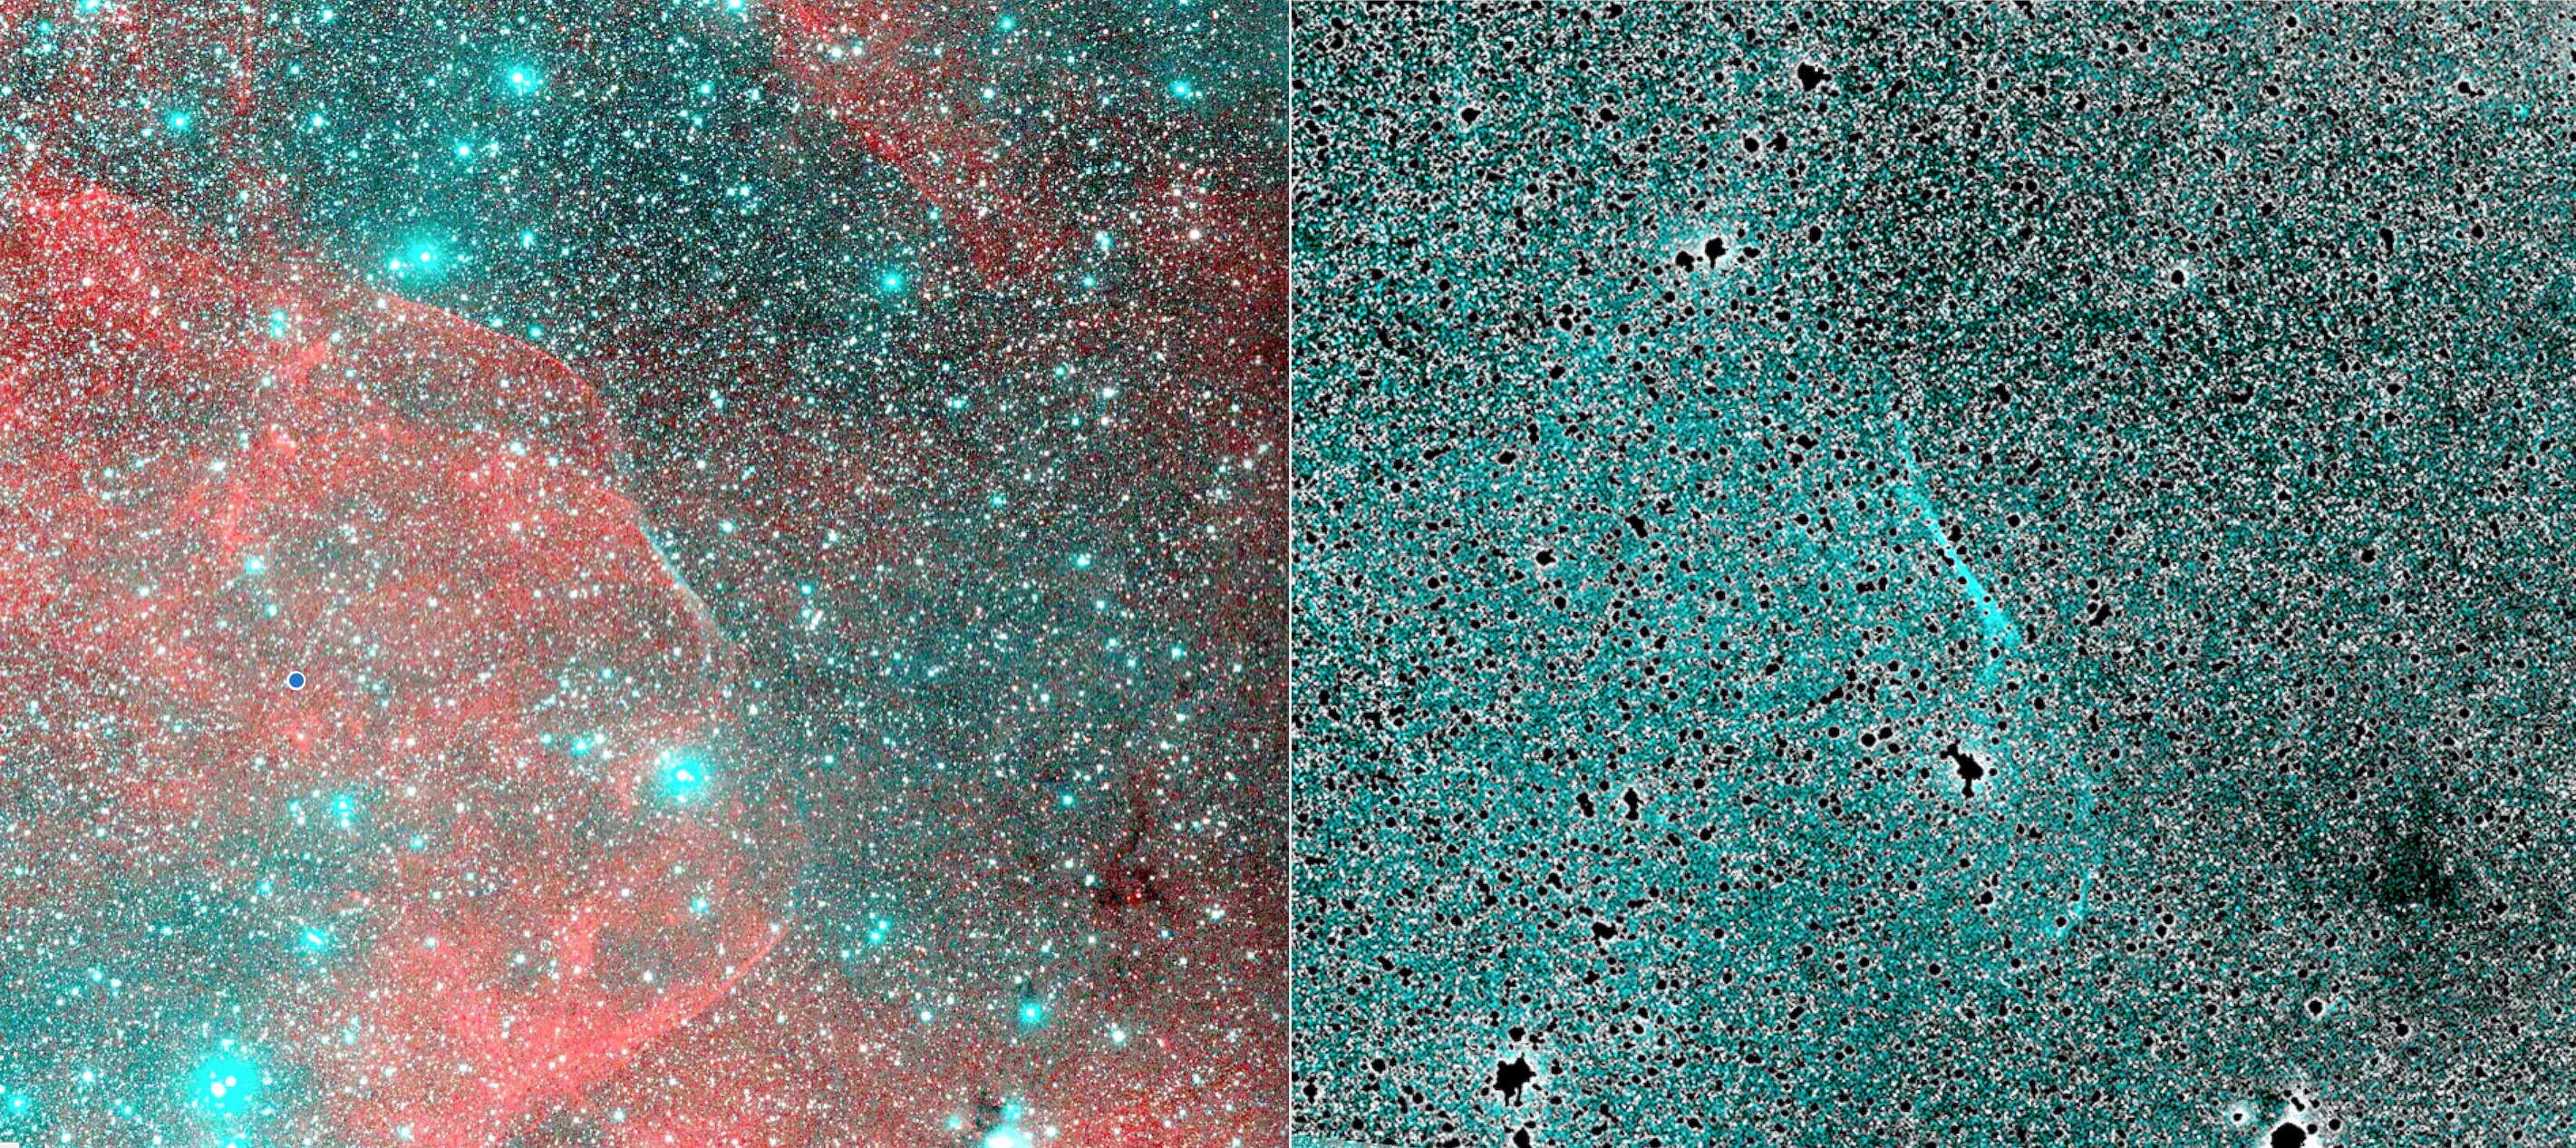
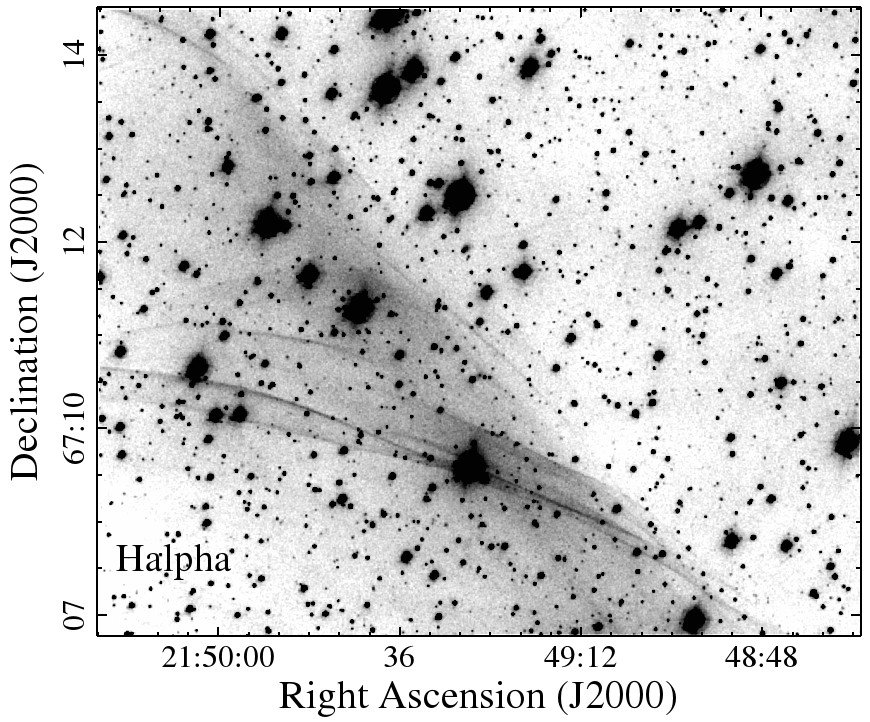
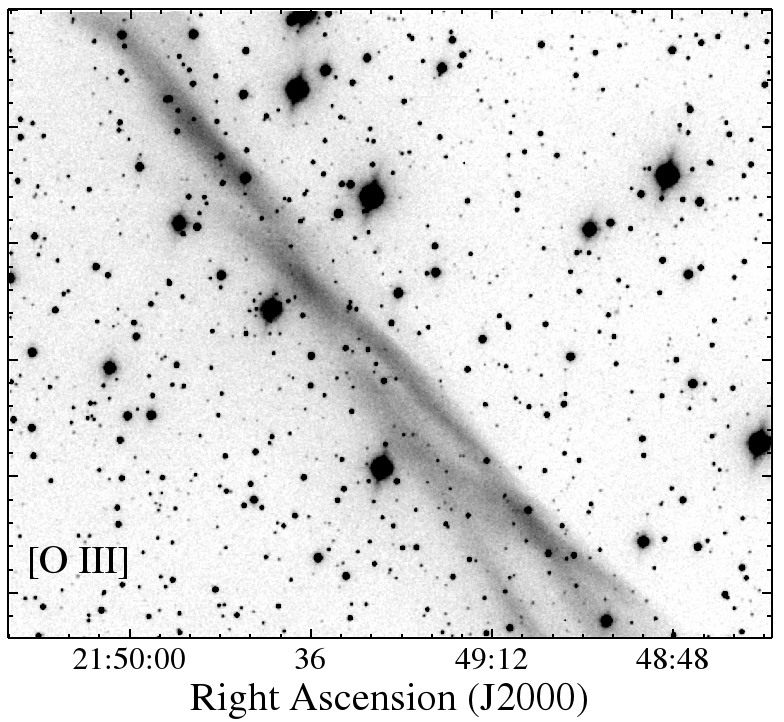
Northwest Region: Matching wide-field H and [O III] images of G107’s northern and northwestern half revealed only a single [O III] bright filament along with faint diffuse interior [O III] emission. These images are shown in Figure 7 where the left panel shows a color composite image where H emission is red and [O III] emission is blue. The right hand panel of this figure shows a continuum subtracted [O III] emission image of this same region. As can be seen in the right panel, the [O III] emission filament is relatively broad and partially resolved with much fainter filamentary and curved emission extending farther to the south and west.
To explore the positional relation of H and [O III] emission along this section of G107’s NW limb, we obtained higher resolution H and [O III] images of this area (see Fig. 4) which are shown in Figure 8. These images present a striking morphological difference in the emission structure between H and [O III]. The [O III] emission is limited mainly to G107’s outer limb and is considerably more diffuse and limited in radial extent as compared to that seen in H.
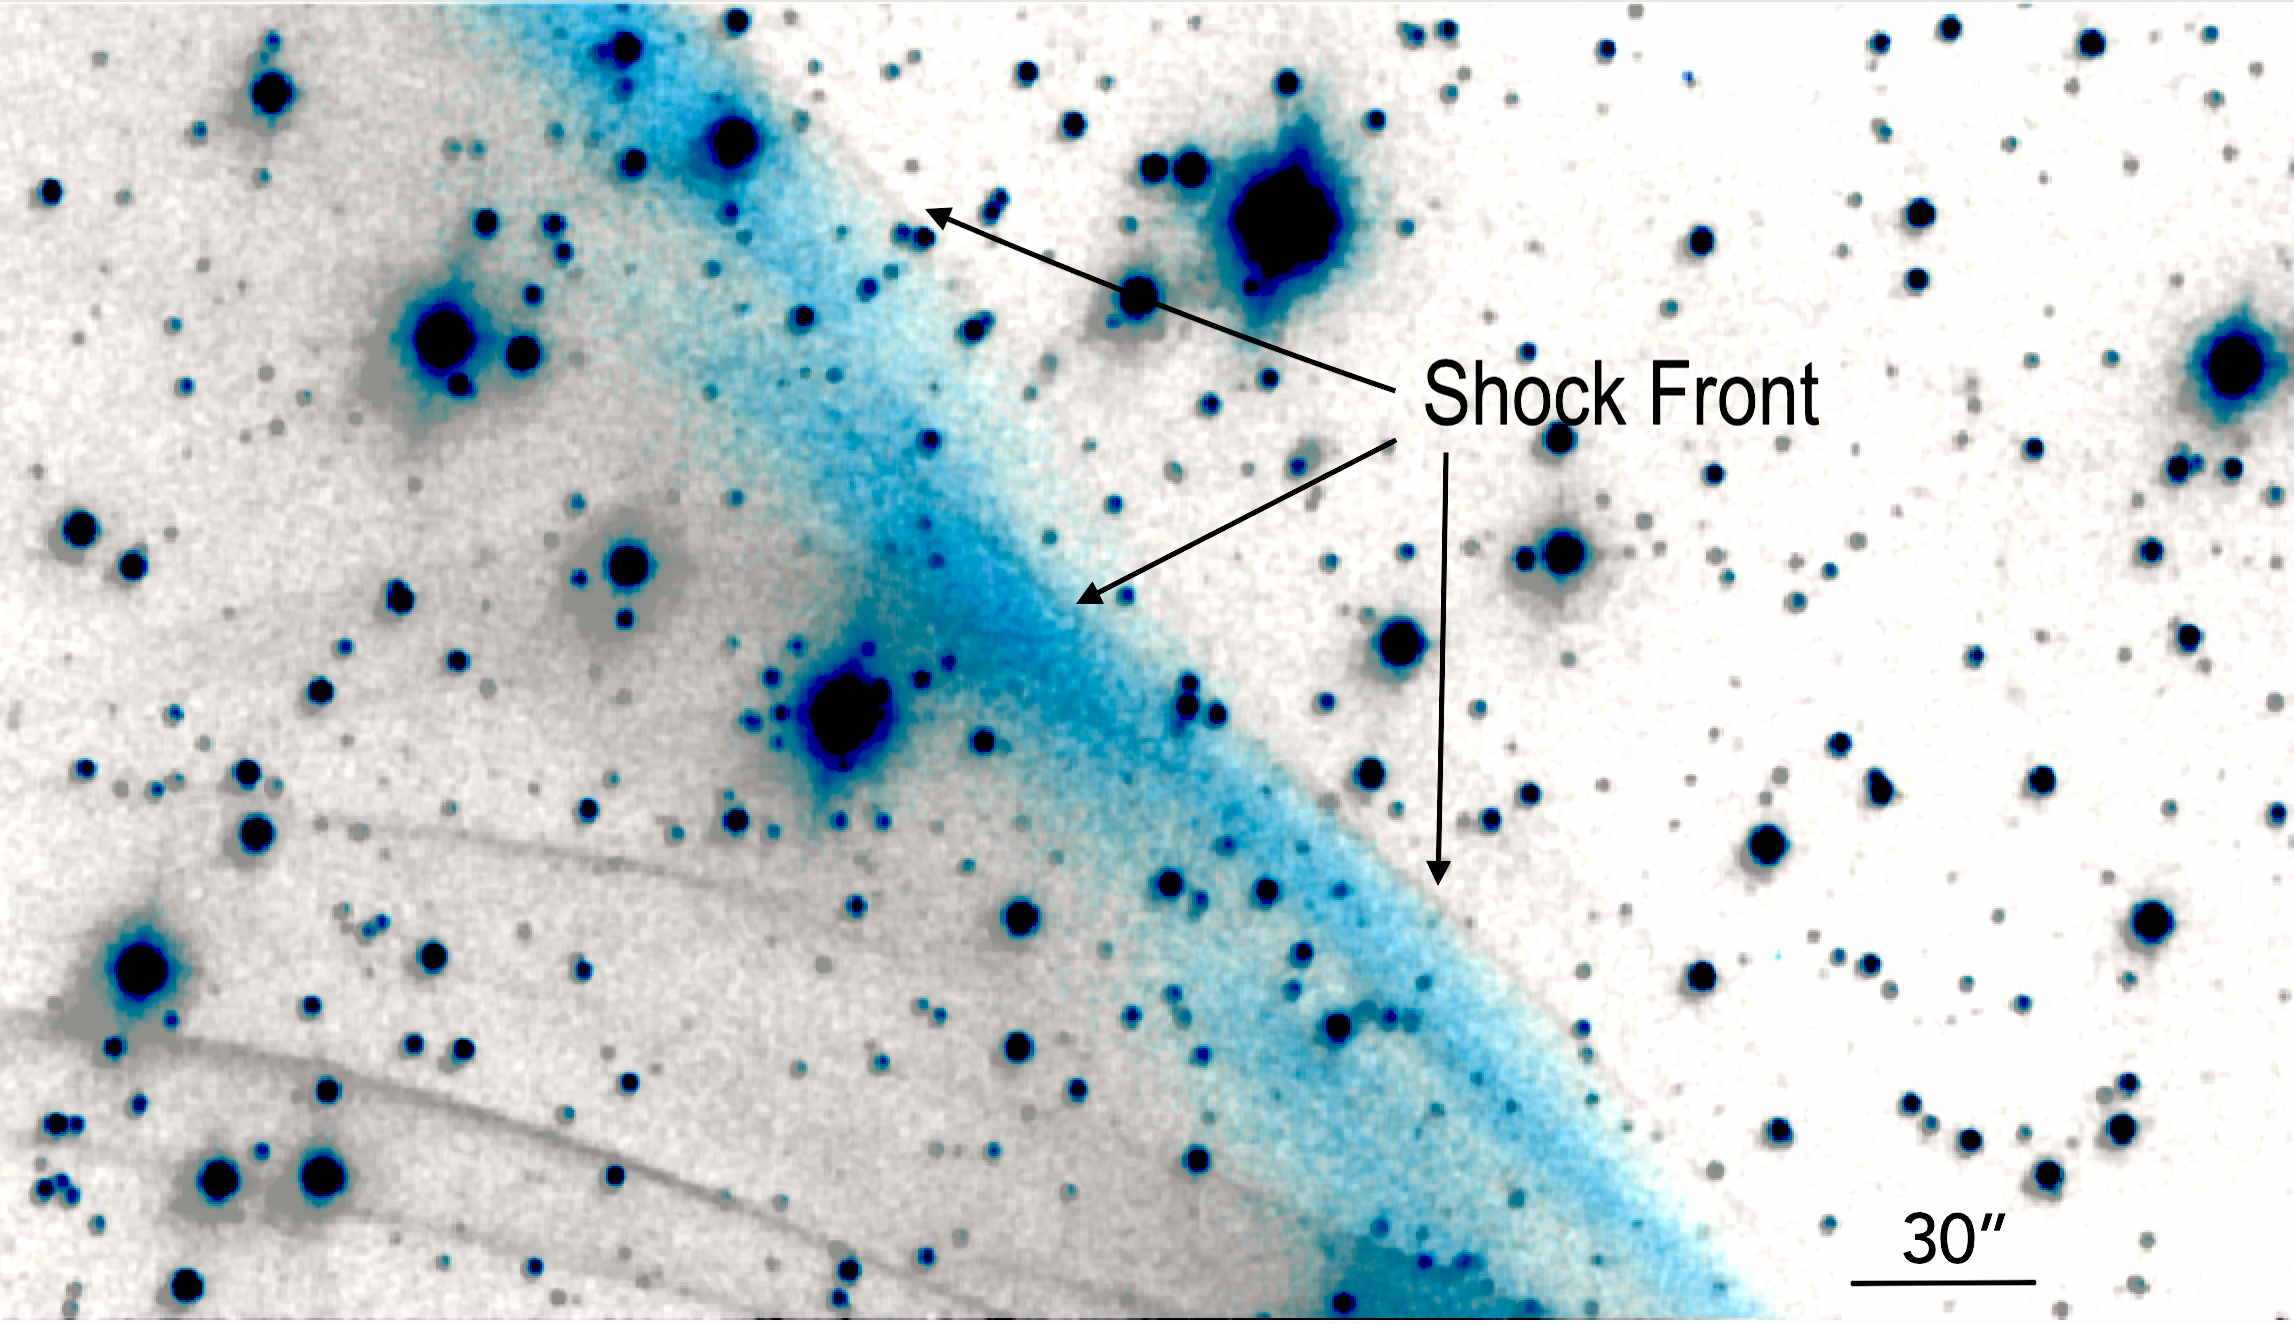
A composite overlay of these H and [O III] images is shown in Figure 9 where H emission is shown as grey with [O III] emission colored blue. Faint thin H emission filaments can be seen to lie immediately ahead of the diffuse [O III] emission. The thin H filaments would appear to mark the location of G107’s expanding shock front followed by a broad recombination zone where [O III] emission gradually strengthens and then gradually fades with increasing distance away from the shock front. The thickness of this apparent [O III] recombination zone perpendicular to the faint H filaments is . Because we only imaged this one section of the [O III] bright filament, we cannot say anything about this H vs [O III] emission structure farther to the southwest where the [O III] filament appears to split.
A long slit spectrum cutting across the [O III] filament with the slit placed perpendicular to the [O III] filament’s long axis was obtained. The spectrum for the thin faint H filament out ahead and bordering the [O III] emission showed only H and H indicating it is a non-radiative emission filament.
The spectrum for the [O III] bright filament region is shown in the upper right-hand panel of Figure 6. As expected, [O III] emission dominates the spectrum, with an [O III] 5007/H ratio of . This value is near the upper range of values seen generally in old, well-evolved SNRs (Fesen et al., 1985; Fesen & Hurford, 1996), and is common in post-shock cooling emission filaments close to the shock front as marked by non-radiative emission filaments (Hester et al., 1994). This is consistent with that shown in the displacement of the [O III] behind the faint H filaments shown in Figure 9. An analysis of this H and [O III] spatial displacement is discussed in 4.
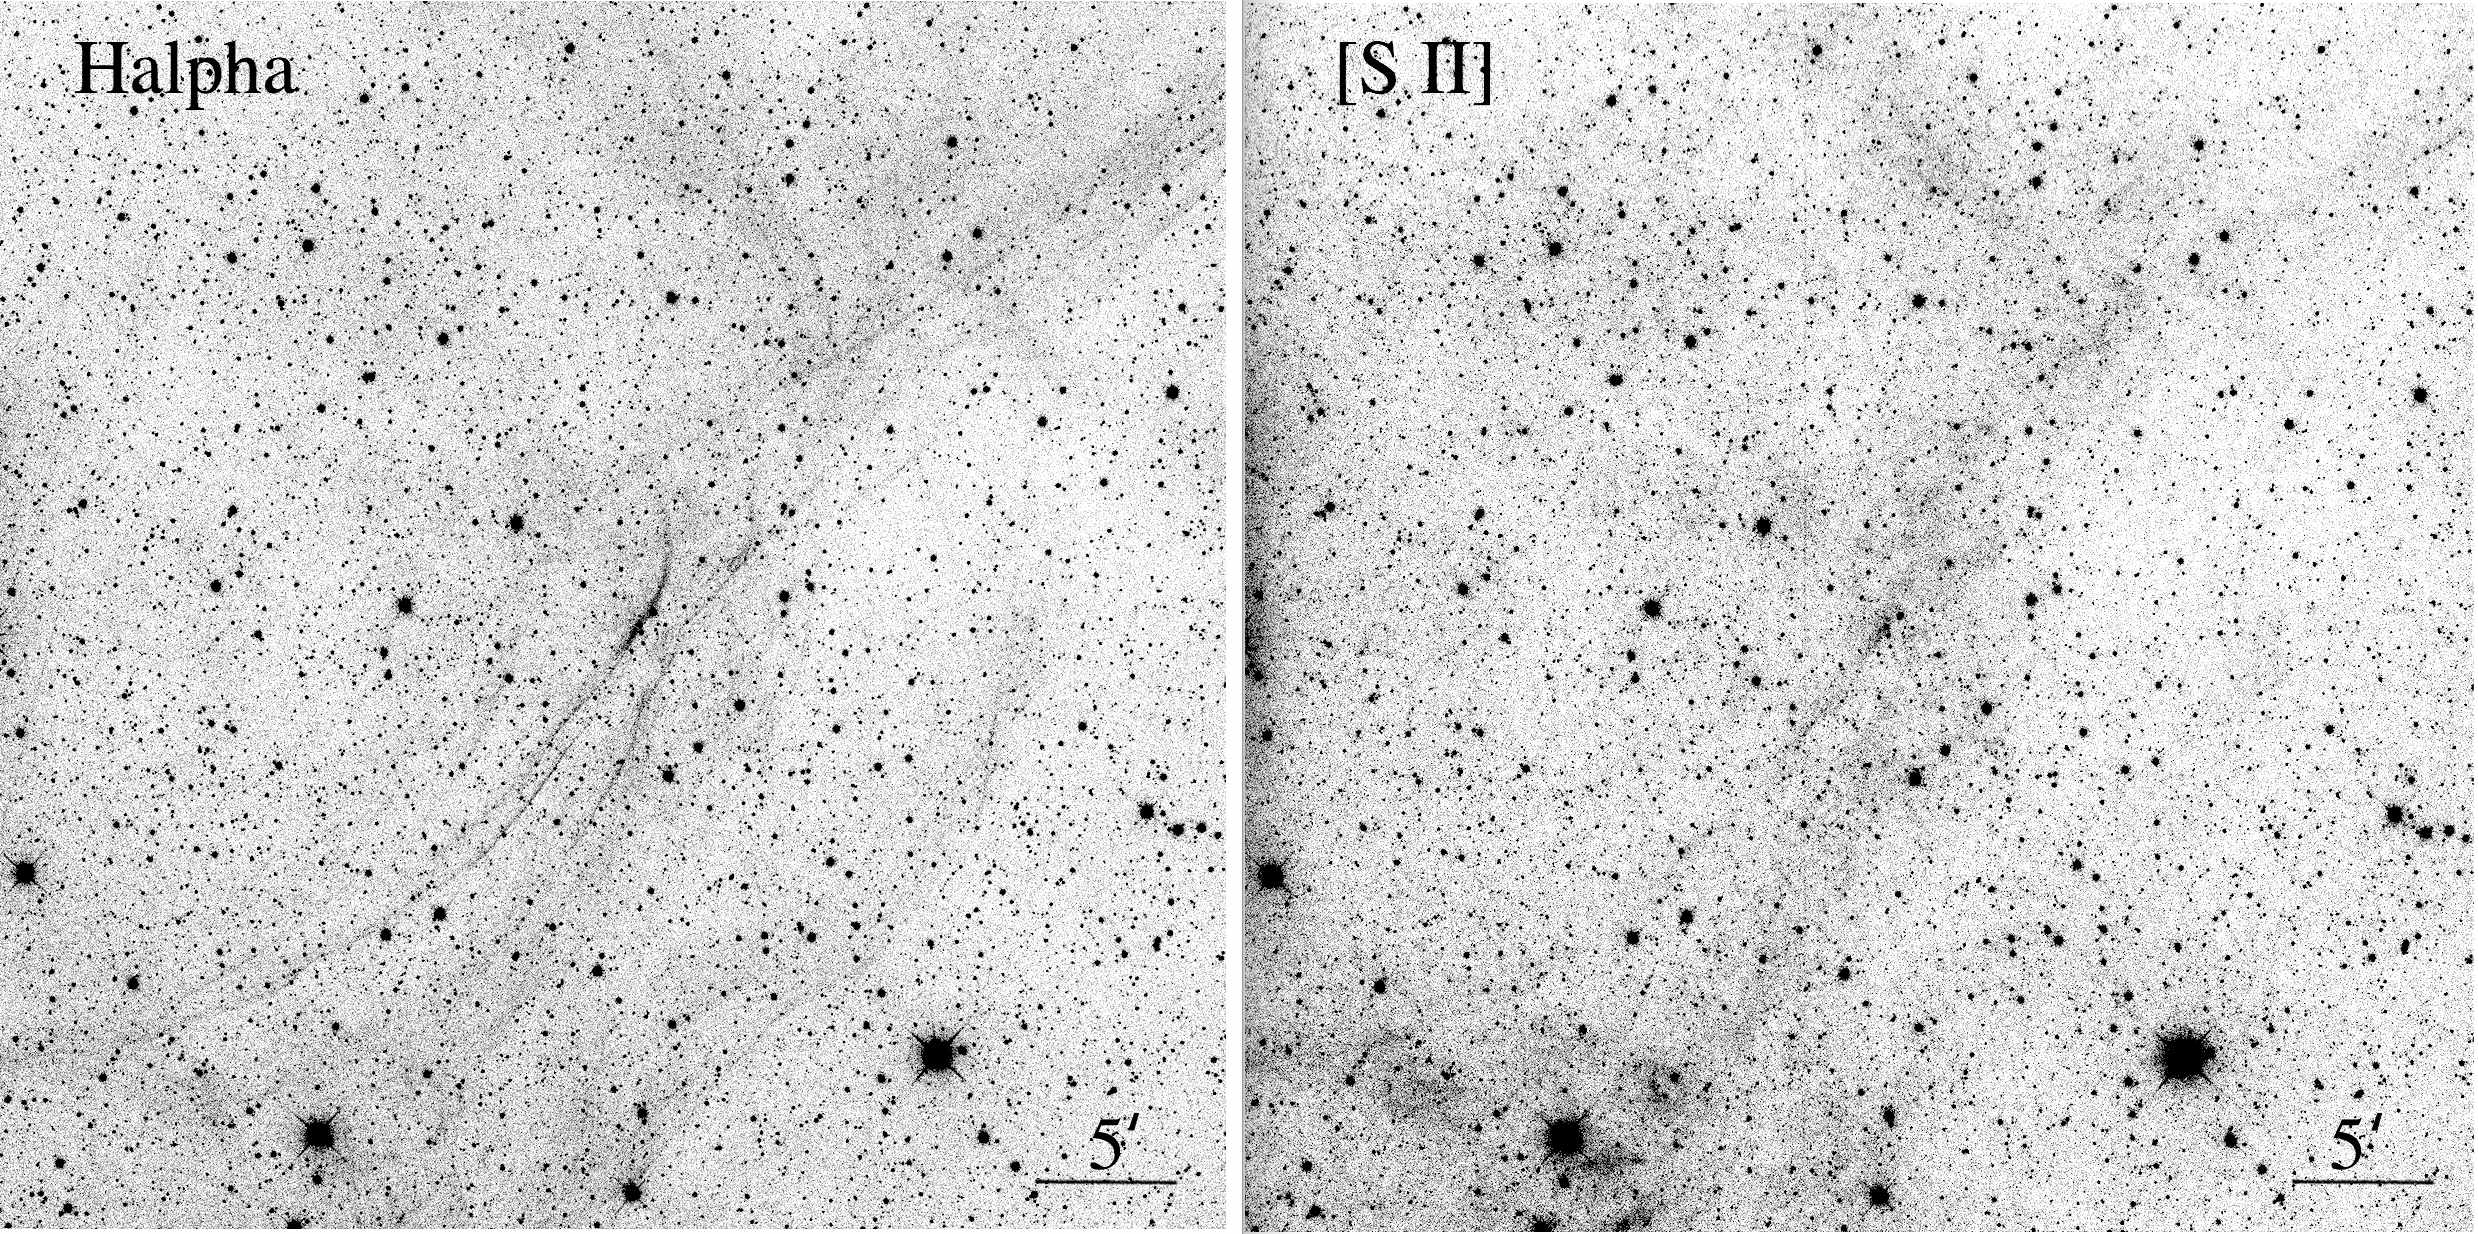
West Limb Regions: It was clear from even DSS and MDW images that G107 exhibits many long, curved filaments along the whole of its western and southwestern limbs. Interestingly, however, this is not the case when viewed in [S II] 6716, 6731 Å line emission.
As shown in the wide-field images presented in Figure 10, G107’s [S II] emission is far less filamentary and much more diffuse in appearance than that seen in H. Although [S II] emission is present in the areas where there is strong H emission, there is poor one-to-one correspondence in many places, and several long thin H filaments have no obvious [S II] counterparts.
This suggests these [S II] absent emission filaments are non-radiative, Balmer dominated shock filaments much like the one seen along G107’s northern limb discussed above. Some of the clearest examples are the two thin filaments extending from the center bright filamentary H emission feature toward the southeast (lower left) and off the image’s left-hand edge.
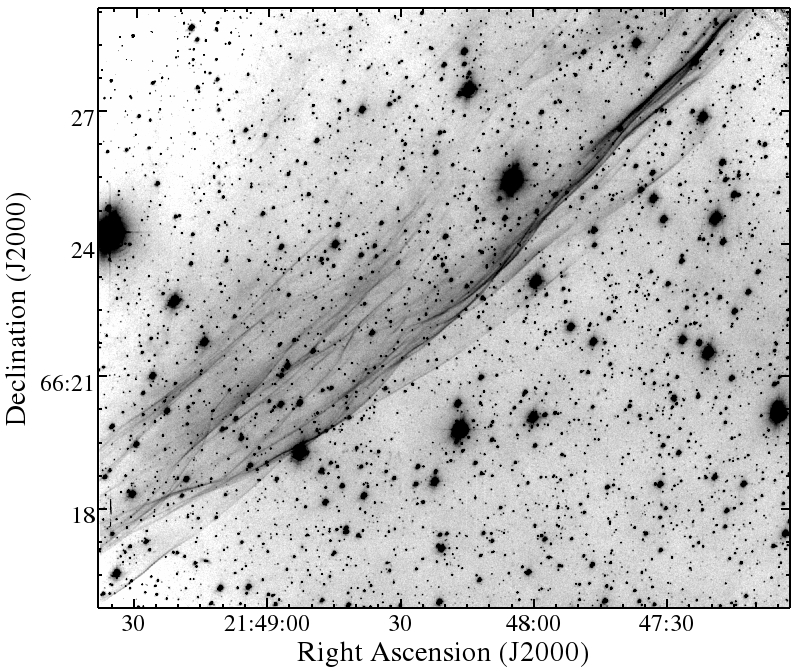
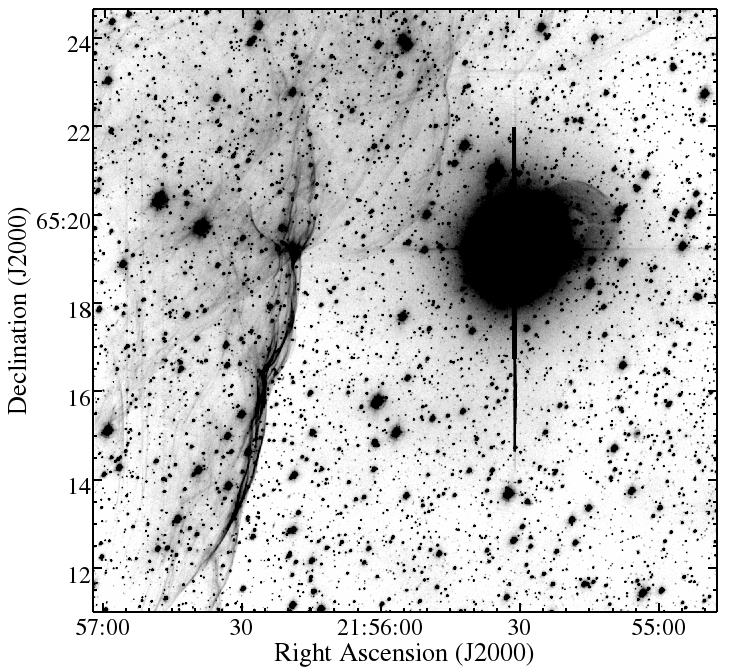
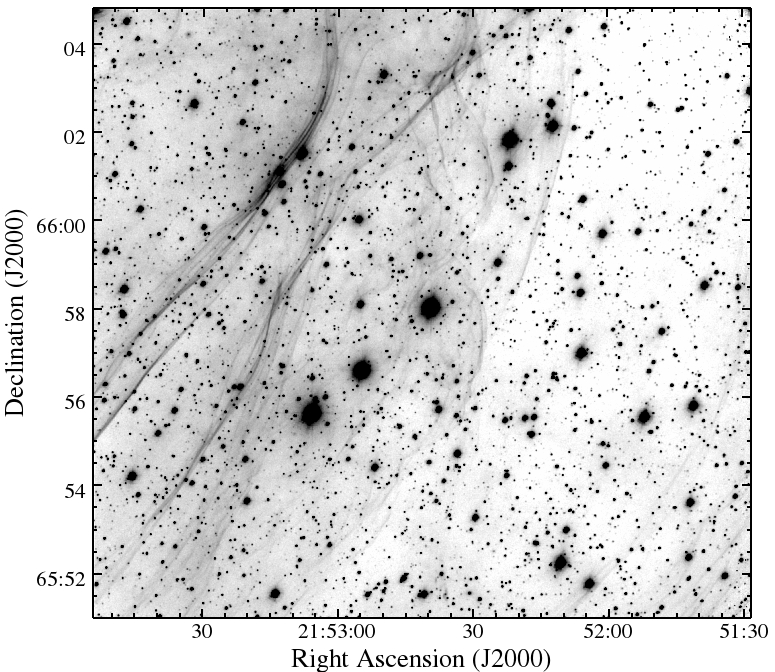
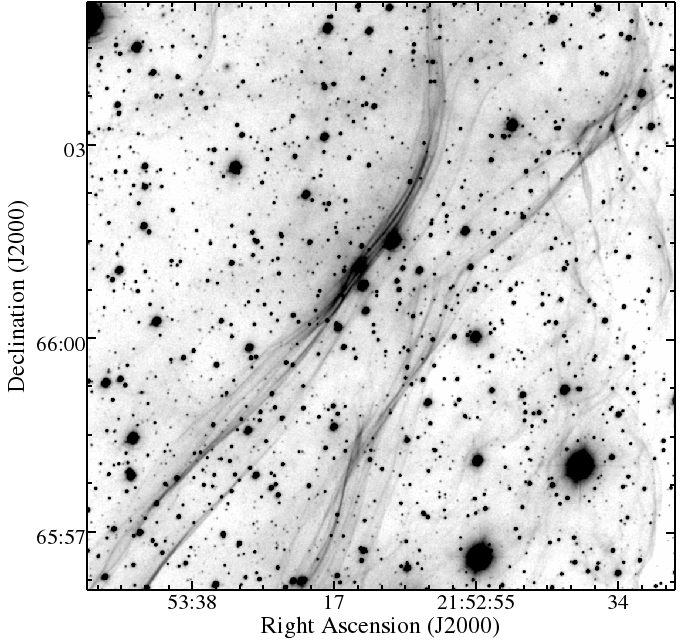
Figure 11 presents our higher resolution H images of three sections of G107’s western limbs; namely, West, Midwest, and Southwest regions (see Fig. 4). As can be seen in these images, G107 possesses a fairly complex arrangement of nearly aligned filaments along its western limb. The amount of detail in these images indicating multiple shock fronts is impressive and we have tried to show some of this complex structure in the lower right-hand panel of Figure 11 where we present an enlargement of one small section along G107’s midwestern limb. Closely spaced and nearly parallel filaments can be seen to merge or diverge in a complex arrangement. It is interesting to note that these brighter western regions mark only part of the remnant’s full western extent since a series of much fainter, farther western filaments can be seen in Figures 3 and 10.
Spectra of two filaments along G107’s western limb (see Fig. 4) are shown in Figure 6. Both filament regions sampled show similar emission lines, with no [O III] emission seen and [S II]/H ratios of for the West filament, and for the Southwest filament. These line ratio values are well within the range seen in radiative shock filaments of SNRs (Dodorico & Dopita, 1983; Dopita et al., 1984; Fesen et al., 1985). This, together with the presence of strong [O I] 6300, 6364 Å line emissions, confirm these filaments to be shock-heated SNR type emissions. The density sensitive [S II] 6716,6731 line ratio for both filaments is near the low density limit of indicating a post-shock filament density cm-3.
The observed H/H ratio for the Northwest filament was 3.8, while spectra of West and Southwestern filaments ranged from to . These values suggest a range of , similar to that found for the northern Balmer dominated filament.
4 Discussion
The imaging and spectral data presented above leave little doubt that the G107.0+9.0 nebulosity is a previously unrecognized Galactic supernova remnant. This conclusion is supported by its near spherical shape, the presence of both radiative and non-radiative filaments found throughout the nebula, and the coincidence of sharp H filaments immediately ahead of [O III] bright emission along its NW limb. Several of the remnant’s brighter filaments show characteristic SNR lines ratios including [S II]/H ratio , widely used as a diagnostic for shocked gas. Moreover, these filaments also show strong [O I] 6300, 6364 Å line emission which is a secondary indicator for shock emission and is commonly observed in evolved SNRs (Fesen et al., 1985; Kopsacheili et al., 2020).
Morphologically, G107’s filament rich optical emission structure is also consistent with a SNR nature. Its numerous and delicate filaments seen along its northern and western boundary are matched by few other Galactic remnants. Dozens of long and gently curved filaments indicate the remnant’s shocks are expanding into large-scale, local interstellar regions with varying preshock densities.
Given G107’s extensive and relatively bright optical structure, it is a bit surprising that it was not identified as a SNR until now given the number of previous optical Galactic SNR searches. This is especially surprising given its visibility on the Digital Sky Survey images. While few of its filaments are particularly bright, the sheer number of its filaments and extended diffuse emissions give G107 a relatively high total optical luminosity.
With a diameter of nearly three degrees, G107 ranks among the largest angular size remnants of the 297 currently confirmed Galactic SNRs (Green, 2019). Centred at a Galactic latitude of nine degrees, it is also among the farthest from the Galactic plane. Given this location, it is perhaps not too surprising that G107 has been missed in radio SNR surveys which have primarily limited their focus within degrees of the Galactic plane (Gerbrandt et al., 2014; Anderson et al., 2017; Gao et al., 2011; Gao & Han, 2014; Gao et al., 2020), although there have been a few radio discoveries at much high latitudes (Kothes et al., 2017).
No clear associated infrared emission features with G107 are seen in either WISE or IRAS infrared images and no associated X-ray emission is visible in ROSAT images. However, some relatively faint 1420 MHz radio emission (Reich, 1982) appears coincident along its western limb, with emission contours following the remnant’s optical emission. This is shown in Figure 12.
The spectrum of the [O III] bright filament along G107’s NW limb showing an [O III] 5007/H ratio indicates a shock velocity of at least km s-1 (Raymond, 1979; Shull & McKee, 1979; Allen et al., 2008). In contrast, the lack of any appreciable [O III] emission in the filaments along G107’s western limb (Fig. 7) or seen in the spectra of the two western filaments (Fig. 6) indicates shock velocities at or below 70 km s-1. A slower shock speed along G107’s western edge compared to its northern limb might help explain the eastern indentation seen in the remnant’s brightest western emission.


While the distance to the G107 remnant is unknown, we can set some limits on it. Its large angular size (dia. pc kpc-1) and shock velocities below 70 km s-1 for much of its western limb are suggestive of an old, physically large and well evolved SNR likely in its post-Sedov, radiative phase of evolution. However, at its Galactic latitude of nine degrees, it is unlikely to be much farther than about 2 kpc, because distances above that it would have a physical diameter greater 100 pc thereby rivaling the largest known Galactic SNRs plus a location in excess of 300 pc off the plane.
Some insight into G107’s likely physical size and hence to its distance can be gained from a comparison of other large optical remnants located far off the Galactic plane like G107. The Cygnus Loop remnant also lies well off the Galactic plane at = , is similar in angular size to G107 (ignoring the Cygnus Loop’s southern blowout region), is also expanding into a fairly low density region ( = 0.4 cm-3), and has an estimated diameter and distance of 40 pc at a distance of 0.74 kpc, respectively (Fesen et al., 2018). However, the Cygnus Loop is likely much younger than G107 (age yr) and is still firmly in its Sedov phase of evolution.
Perhaps a better comparison is the Monoceros Loop SNR (G205.5+0.5). With a angular diameter of 3.6 degrees and an estimated distance around 1.6 kpc (but see Zhao et al. 2018 for a different distance estimate) its has a physical diameter 100 pc. Despite its location nearly in the centre of the Galactic plane, it is believed to be expanding in a multi-phase ISM with a low density intercloud medium (0.01 cm-3; Leahy et al. 1986).
Based on absorption features seen in background stars, the Monoceros Loop has an estimated expansion velocity between 50 and 70 km s-1 (Lozinskaya, 1972; Wallerstein & Jacobsen, 1976), not too dissimilar to that estimated for G107 from its optical spectra, with the exception of its northern and NW regions. The Monoceros remnant also exhibits numerous bright H + [N II] filaments that are diffuse is appearance when imaged in [S II] (Kirshner et al., 1978), again like G107. At a distance of 2 kpc, G107 would have a diameter similar to that of the Monoceros Loop of around 100 pc.
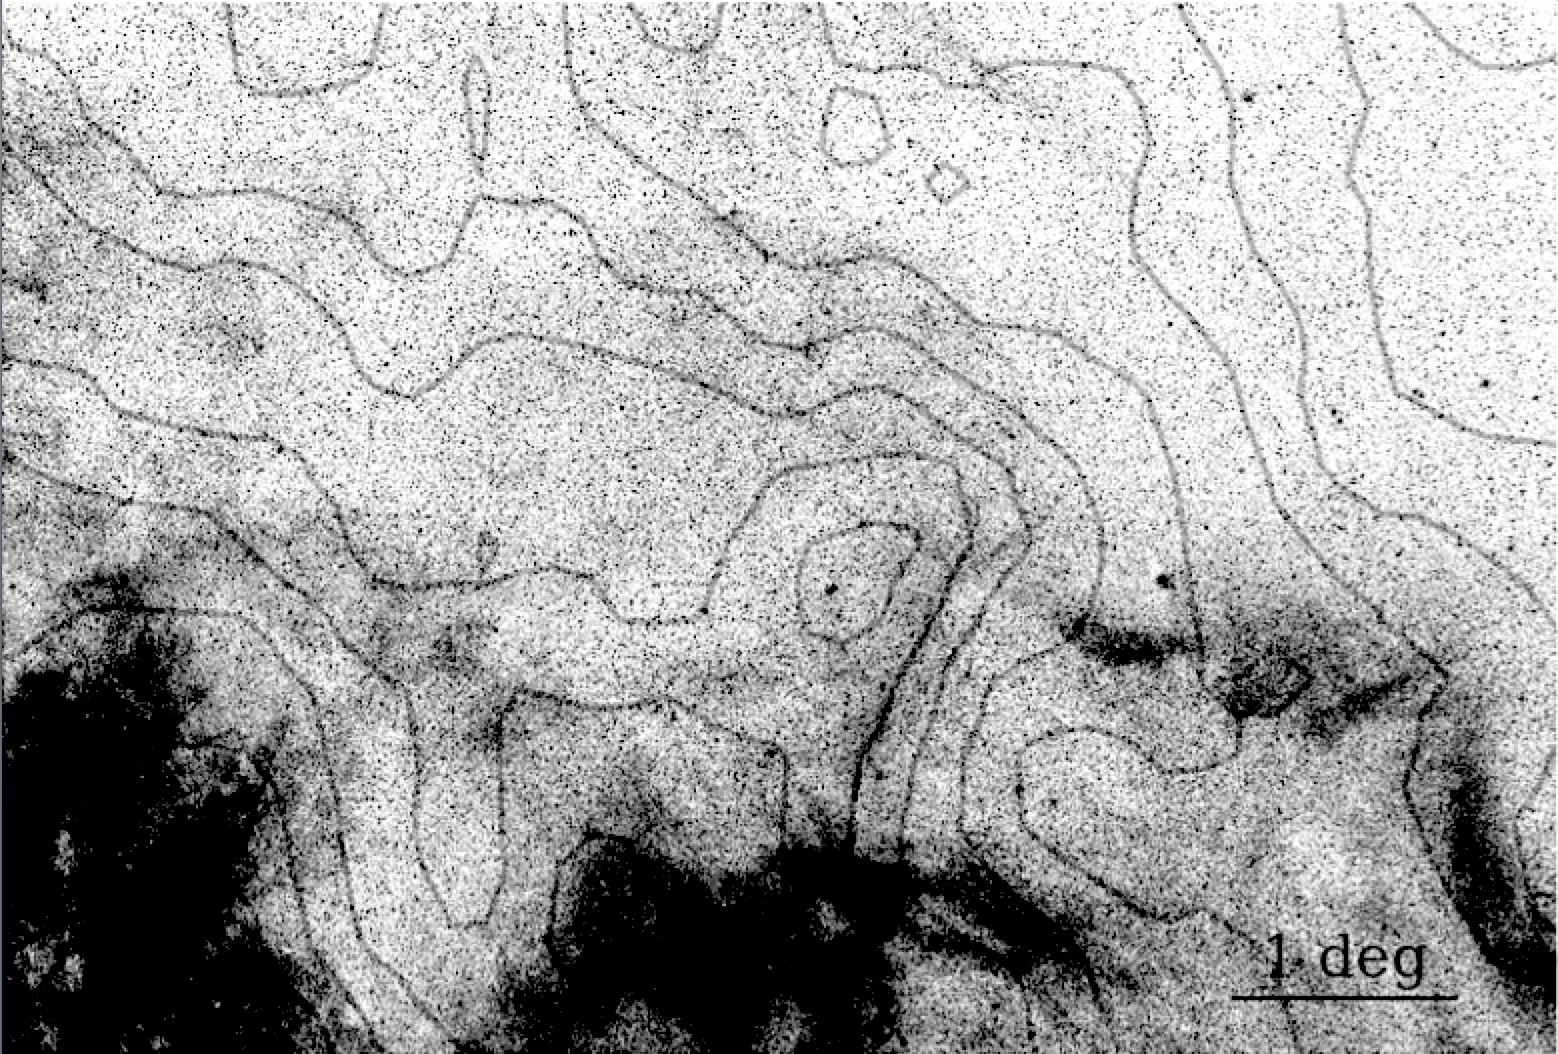
From the observed spatial separation of faint outer H filaments ahead of the bright, diffuse [O III] filaments seen along the remnant’s NW edge (Figs. 8 & 9) we can constrain the density of the local ISM in this region. Figure 13 shows two models of shock emission for a 100 km s-1 shock moving through an interstellar medium with 10% neutral hydrogen at a distance of 1 kpc based on an updated version of the model of Raymond (1979). Here we modeled the H + [N II] emission seen in the H image shown in left panel of Figure 8. The top panel of Figure 13 assumes a preshock density = 0.1 and a magnetic field of 1 G, while the bottom panel assumes = 0.16 and a field of 3 G. The asterisks and diamonds mark relative H + [N II] and [O III] flux measurements from our images, respectively, using a box stepped every 3″ in a perpendicular direction away from the sharp H filament marking the shock front location. The horizontal axis scales inversely as the distance and preshock density, so the density would be a factor of two lower at a distance of 2 kpc. The geometry was assumed to be a gently rippled sheet with an amplitude to wavelength ratio of a few percent.
These simple models provide a surprisingly good match to the observed [O III] and H + [N II] emission to this perpendicular cut across the filament. The models predict a nearly unresolved H + [N II] emission filament with a thickness of where neutral H is excited and ionized just behind the shock. The H drops when the neutrals are ionized, and begins to increase as [N II] emission increases and the density increases as the gas cools.
In contrast, the [O III] emission is very weak at the shock front, increases in strengths as oxygen is ionized to O+2, then decreases as it recombines. This qualitatively agrees with what is seen along G107’s NW limb, where H + [N II] emission sharply decreases in strength immediately behind the shock front, only to become stronger again some 20′′ farther downstream. In addition, the [O III] emission appears much broader and distinctly diffuse, being some in width, and slowly rising and falling with increasing distance behind the shock front. We note that this is similar to some filaments in the old Galactic Halo SNR G70.0-21.5, where sharp H is followed by more diffuse [O III] emission (Raymond et al., 2020).
The model with cm-3 and B = 1 G fits this particular cut across the filament somewhat better than the model with 3 G. The magnetic field at a few hundred pc in the Galactic halo is expected to be 3 to 4 G (Sobey et al., 2019). At that field strength there is a significant magnetic pressure behind the shock, while the low preshock density means a relatively low thermal pressure. Consequently, the magnetic field will inhibit compression of the cooling gas and thus change the [O III] and H intensity profiles as functions of distance from the shock front, thereby flattening the rise of H. There is some variation among the measured [O III] and H+[N II] profiles at different positions, and the higher magnetic field might be preferred at at least one location.
Based on the agreement of this model with our images, we estimate 30% cm-3 at 1 kpc, V km s-1 for this NW region. The lower end of the density range would imply a magnetic field somewhat lower than is typical for this height above the Galactic plane.
The northern non-radiative Balmer emission filament requires a higher velocity, at least 150 km s-1, to produce a higher post-shock temperature with no strong [O III] emission immediately behind the shock front. This implies a density correspondingly lower ( cm-3) and might also suggest a higher neutral fraction to produce the bright Balmer emission. The reason why this old remnant exhibits non-radiative filaments along a small section of its northern limb and apparently some places elsewhere (see Fig. 10) may be due to the remnant’s location along the outer portion of the Galactic plane (Fig. 1) where it may have encountered small ISM regions of especially low density.
It is also possible that the ram pressure is higher in this location, possibly because in the past, the shock along G107’s northern limb had moved through a lower density medium than elsewhere in the remnant. Given the likely physical size of the G107 remnant, large scale density variations leading to a range of ram pressures would seem plausible in G107’s later stages of evolution.
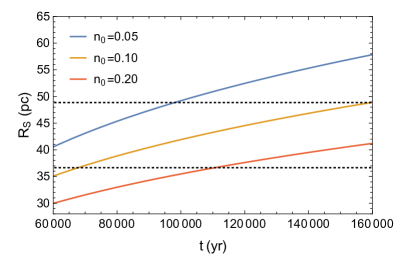
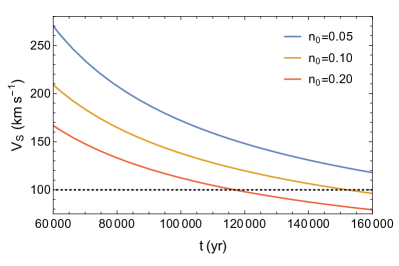
With the assumption that G107 is in its radiative phase, we can use the formulae of Chevalier (1974) and Cioffi et al. (1988) for SNRs in the radiative cooling phase. Figure 14 shows the Cioffi et al. (1988) models for SNR radius and velocity as a function of time using an explosion energy of erg, at three different preshock densities, . The observed radius of the remnant is shown as dashed lines on the left panel of the figure, where the minimum radius of pc corresponds to G107 being at a distance of 1.5 kpc, while the maximum radius of pc if it were at 2 kpc. The shock velocity of the [O III] filament is shown as the dashed line in the right panel.
We find agreement between the observed radius of the remnant at 2 kpc and the model, when the density of matches that of the [O III] filament, cm-3, at an age around years old. However, these 1D models do not match the filament’s inferred shock velocity. This suggests the environment through which G107 has and currently is expanding into is more complicated than this simple uniform density model can account for. Given the large physical size of the remnant, it is unlikely that it has expanded through a constant density medium and this would affect both the remnant’s radius and shock velocity. Using these same models for the somewhat larger G70.0-21.5 remnant, which has a higher estimated preshock density compared to G107, there was a similar over-prediction of the shock velocity for a given radius (Raymond et al., 2020).
Given that the velocity estimate of 100 km s-1 for G107’s [O III] bright NW region may represent the remnant’s higher expansion velocity region and hence among its lowest ambient preshock density, then higher preshock densities and hence lower shock velocities are then likely present in most other optically bright regions of the remnant. This would appear especially true along most of G107’s western limb where the shock velocity appears to be less than 70 km s-1 due to the lack of [O III] emission (Raymond, 1979; Shull & McKee, 1979). Consequently, such large and denser ISM regions may be more representative of the remnant’s environment and evolutionary age.
In a remnant’s cooling phase, its age, can be estimated from Falle (1981)
| (1) |
where E51 is energy in units of erg and in the preshock density in cm-3. Adopting = 0.5 and a preshock densities cm-3 based on the [O III] filament’s ambient density at distances of 1.5 and 2 kpc, the above expression gives an estimate range of G107’s age, , of yr.
Although other distances to G107 than kpc are possible, as noted above the spectra of its NW and western filaments together with the observed H and [O III] emission separation place some constraints on G107’s distance in regard to the remnant’s shock velocities and preshock densities in the regions we examined. Further investigations into the few filaments present along G107’s eastern and northeastern limbs would help constrain its expansion in those directions and hence better determine its overall expansion and shock properties.
5 Conclusions
We report the discovery of a new large supernova remnant with an extensive optical emission structure. Wide-field H images show a diameter supernova remnant centred near = 107.0, = +9.0. Higher resolution H and [O III] 5007 Å images reveal an extensive complex set of thin and overlapping filaments along the remnant’s northern, western, and southwestern limbs, with few filaments bright in [O III] emission.
Optical spectra show both Balmer dominated, non-radiative filaments and brighter radiative filaments with [S II]/H ratios consistent with shock emission. Filament emission lines suggest a range of shock velocities, around km s-1 along its western limb, with higher shock velocities km s-1 along its northern and northwestern boundary. We estimate the remnant to be physically large with a diameter pc, located at a distance of kpc and lying some pc above the Galactic plane.
Follow-up moderate to high-dispersion spectroscopy on bright stars lying behind the remnant could be used to determine both the remnant’s distance and general expansion velocities like that done for some other Galactic SNRs (e.g., Wallerstein & Jacobsen 1976; Jenkins et al. 1984; Fesen et al. 2018; Ritchey et al. 2020). Associated radio and X-ray emissions could also be searched for especially near its brighter optical emissions. The finding of such a large and optically bright remnant might suggest other, high Galactic latitude SNRs still await discovery.
acknowledgements
We thank Justin Rupert, Eric Galayda and the MDM staff for making these observations possible, and Sakib Rasool for helpful communications. K.E.W. acknowledges support from Dartmouth’s Guarini School of Graduate and Advanced Studies, and the Chandra X-ray Center under CXC grant GO7-18050X. This work is part of R.A.F’s Archangel III Research Program at Dartmouth.
Data Availability
The H MDW images presented here are available through the MDW Hydrogen-Alpha Sky Survey (www.mdwskysurvey.org/). The remaining wide-field images are availible through contact with the co-authors at https://www.cxielo.ch/ and at http://www.sternwarte-baerenstein.de/. The optical images and spectra obtained at MDM Observatory presented here are available upon request from the corresponding author.
References
- Alikakos et al. (2012) Alikakos J., Boumis P., Christopoulou P. E., Goudis C. D., 2012, A&A, 544, A140
- Allen et al. (2008) Allen M. G., Groves B. A., Dopita M. A., Sutherland R. S., Kewley L. J., 2008, ApJS, 178, 20
- Anderson et al. (2017) Anderson L. D., et al., 2017, A&A, 605, A58
- Blair et al. (1981) Blair W. P., Kirshner R. P., Chevalier R. A., 1981, ApJ, 247, 879
- Boumis et al. (2002) Boumis P., Mavromatakis F., Paleologou E. V., Becker W., 2002, A&A, 396, 225
- Boumis et al. (2009) Boumis P., Xilouris E. M., Alikakos J., Christopoulou P. E., Mavromatakis F., Katsiyannis A. C., Goudis C. D., 2009, A&A, 499, 789
- Chevalier (1974) Chevalier R. A., 1974, ApJ, 188, 501
- Chevalier (1977) Chevalier R. A., 1977, ARA&A, 15, 175
- Cioffi et al. (1988) Cioffi D. F., McKee C. F., Bertschinger E., 1988, ApJ, 334, 252
- Dennison et al. (1998) Dennison B., Simonetti J. H., Topasna G. A., 1998, Publ. Astron. Soc. Australia, 15, 147
- Dodorico & Dopita (1983) Dodorico S., Dopita M., 1983, in Danziger J., Gorenstein P., eds, IAU Symposium Vol. 101, Supernova Remnants and their X-ray Emission. pp 517–524
- Dopita et al. (1984) Dopita M. A., Binette L., Dodorico S., Benvenuti P., 1984, ApJ, 276, 653
- Downes (1971) Downes D., 1971, AJ, 76, 305
- Falle (1981) Falle S. A. E. G., 1981, MNRAS, 195, 1011
- Fesen & Hurford (1996) Fesen R. A., Hurford A. P., 1996, ApJS, 106, 563
- Fesen & Milisavljevic (2010) Fesen R. A., Milisavljevic D., 2010, AJ, 140, 1163
- Fesen et al. (1985) Fesen R. A., Blair W. P., Kirshner R. P., 1985, ApJ, 292, 29
- Fesen et al. (1992) Fesen R. A., Kwitter K. B., Downes R. A., 1992, AJ, 104, 719
- Fesen et al. (2015) Fesen R. A., Neustadt J. M. M., Black C. S., Koeppel A. H. D., 2015, ApJ, 812, 37
- Fesen et al. (2018) Fesen R. A., Weil K. E., Cisneros I. A., Blair W. P., Raymond J. C., 2018, MNRAS, 481, 1786
- Fesen et al. (2019) Fesen R. A., Neustadt J. M. M., How T. G., Black C. S., 2019, MNRAS, 486, 4701
- Finkbeiner (2003) Finkbeiner D. P., 2003, ApJS, 146, 407
- Gao & Han (2014) Gao X. Y., Han J. L., 2014, A&A, 567, A59
- Gao et al. (2011) Gao X. Y., Sun X. H., Han J. L., Reich W., Reich P., Wielebinski R., 2011, A&A, 532, A144
- Gao et al. (2020) Gao X. Y., Reich P., Reich W., Hou L. G., Han J. L., 2020, MNRAS, 493, 2188
- Gerardy & Fesen (2007) Gerardy C. L., Fesen R. A., 2007, MNRAS, 376, 929
- Gerbrandt et al. (2014) Gerbrandt S., Foster T. J., Kothes R., Geisbüsch J., Tung A., 2014, A&A, 566, A76
- Green (1984) Green D. A., 1984, MNRAS, 209, 449
- Green (2004) Green D. A., 2004, Bulletin of the Astronomical Society of India, 32, 335
- Green (2019) Green D. A., 2019, Journal of Astrophysics and Astronomy, 40, 36
- Hester et al. (1994) Hester J. J., Raymond J. C., Blair W. P., 1994, ApJ, 420, 721
- How et al. (2018) How T. G., Fesen R. A., Neustadt J. M. M., Black C. S., Outters N., 2018, MNRAS, 478, 1987
- Jenkins et al. (1984) Jenkins E. B., Wallerstein G., Silk J., 1984, ApJ, 278, 649
- Kirshner et al. (1978) Kirshner R. P., Gull T. R., Parker R. A. R., 1978, A&AS, 31, 261
- Kopsacheili et al. (2020) Kopsacheili M., Zezas A., Leonidaki I., 2020, MNRAS, 491, 889
- Kothes et al. (2017) Kothes R., Reich P., Foster T. J., Reich W., 2017, A&A, 597, A116
- Leahy et al. (1986) Leahy D. A., Naranan S., Singh K. P., 1986, MNRAS, 220, 501
- Leonidaki et al. (2013) Leonidaki I., Boumis P., Zezas A., 2013, MNRAS, 429, 189
- Long (2017) Long K. S., 2017, in Alsabti A. W., Murdin P., eds, , Handbook of Supernovae. Springer International Publishing AG, p. 2005, doi:10.1007/978-3-319-21846-5_90
- Lozinskaya (1972) Lozinskaya T. A., 1972, Soviet Ast., 15, 910
- Martini et al. (2011) Martini P., et al., 2011, PASP, 123, 187
- Massey & Gronwall (1990) Massey P., Gronwall C., 1990, ApJ, 358, 344
- Medina et al. (2014) Medina A. A., Raymond J. C., Edgar R. J., Caldwell N., Fesen R. A., Milisavljevic D., 2014, ApJ, 791, 30
- Neustadt et al. (2017) Neustadt J. M. M., Fesen R. A., Black C. S., 2017, MNRAS, 469, 516
- Oke (1974) Oke J. B., 1974, ApJS, 27, 21
- Osterbrock & Ferland (2006) Osterbrock D. E., Ferland G. J., 2006, Astrophysics of gaseous nebulae and active galactic nuclei. University Science Books
- Raymond (1979) Raymond J. C., 1979, ApJS, 39, 1
- Raymond et al. (1983) Raymond J. C., Blair W. P., Fesen R. A., Gull T. R., 1983, ApJ, 275, 636
- Raymond et al. (2020) Raymond J. C., Caldwell N., Fesen R. A., Weil K. E., Boumis P., di Cicco D., Mittelman D., Walker S., 2020, ApJ, 888, 90
- Reich (1982) Reich W., 1982, A&AS, 48, 219
- Ritchey et al. (2020) Ritchey A. M., Jenkins E. B., Federman S. R., Rice J. S., Caprioli D., Wallerstein G., 2020, ApJ, 897, 83
- Sabin et al. (2013) Sabin L., et al., 2013, MNRAS, 431, 279
- Safi-Harb et al. (2013) Safi-Harb S., Ferrand G., Matheson H., 2013, in van Leeuwen J., ed., IAU Symposium Vol. 291, Neutron Stars and Pulsars: Challenges and Opportunities after 80 years. pp 483–485 (arXiv:1210.5264), doi:10.1017/S1743921312024593
- Shull & McKee (1979) Shull J. M., McKee C. F., 1979, ApJ, 227, 131
- Sobey et al. (2019) Sobey C., et al., 2019, MNRAS, 484, 3646
- Stupar & Parker (2011) Stupar M., Parker Q. A., 2011, MNRAS, 414, 2282
- Stupar & Parker (2012) Stupar M., Parker Q. A., 2012, MNRAS, 419, 1413
- Stupar et al. (2007) Stupar M., Parker Q. A., Filipović M. D., Frew D. J., Bojičić I., Aschenbach B., 2007, MNRAS, 381, 377
- Stupar et al. (2008) Stupar M., Parker Q. A., Filipović M. D., 2008, MNRAS, 390, 1037
- Stupar et al. (2018) Stupar M., Parker Q. A., Frew D. J., 2018, MNRAS, 479, 4432
- Wallerstein & Jacobsen (1976) Wallerstein G., Jacobsen T. S., 1976, ApJ, 207, 53
- Yuan & Liu (2013) Yuan H. B., Liu X. W., 2013, MNRAS, 436, 718
- Zhao et al. (2018) Zhao H., Jiang B., Gao S., Li J., Sun M., 2018, ApJ, 855, 12
- van Dokkum (2001) van Dokkum P. G., 2001, PASP, 113, 1420