CHARGED PARTICLE IDENTIFICATION WITH THE LIQUID XENON CALORIMETER OF THE CMD-3 DETECTOR

V.L. Ivanov111Corresponding author: V.L.Ivanov@inp.nsk.su G.V. Fedotovich R.R. Akhmetshin A.N. Amirkhanov A.V. Anisenkov V.M. Aulchenko N.S. Bashtovoy A.E. Bondar A.V. Bragin S.I. Eidelman D.A. Epifanov L.B. Epshteyn A.L. Erofeev S.E. Gayazov A.A. Grebenuk S.S. Gribanov D.N. Grigoriev F.V. Ignatov S.V. Karpov V.F. Kazanin A.A. Korobov A.N. Kozyrev E.A. Kozyrev P.P. Krokovny A.E. Kuzmenko A.S. Kuzmin I.B. Logashenko P.A. Lukin K.Yu. Mikhailov V.S. Okhapkin Yu.N. Pestov A.S. Popov G.P. Razuvaev A.A. Ruban N.M. Ryskulov A.E. Ryzhenenkov A.V. Semenov V.E. Shebalin D.N. Shemyakin B.A. Shwartz E.P. Solodov V.M. Titov A.A. Talyshev S.S. Tolmachev A.I. Vorobiov Yu.V. Yudin Budker Institute of Nuclear Physics, SB RAS, Novosibirsk, 630090, Russia Novosibirsk State University, Novosibirsk, 630090, Russia Lebedev Physical Institute RAS, Moscow, 119333, Russia Novosibirsk State Technical University, Novosibirsk, 630092, Russia University of Hawaii, Honolulu, Hawaii 96822, USA
Abstract

The paper describes a method of the charged particle identification, developed for the CMD-3 detector, installed at the VEPP-2000 e+esuperscript𝑒superscript𝑒e^{+}e^{-} collider. The method is based on the application of the boosted decision trees classifiers, trained for the optimal separation of electrons, muons, pions and kaons in the momentum range from 100 to 1200MeV/c1200MeV𝑐1200~{}{\rm MeV}/c. The input variables for the classifiers are linear combinations of the energy depositions of charged particles in 12 layers of the liquid xenon calorimeter of the CMD-3. The event samples for training of the classifiers are taken from the simulation. Various issues of the detector response tuning in simulation and calibration of the calorimeter strip channels are considered. Application of the method is illustrated by the examples of separation of the e+e(γ)superscript𝑒superscript𝑒𝛾e^{+}e^{-}(\gamma) and π+π(γ)superscript𝜋superscript𝜋𝛾\pi^{+}\pi^{-}(\gamma) final states and of selection of the K+Ksuperscript𝐾superscript𝐾K^{+}K^{-} final state at high energies.

1 Introduction

The VEPP-2000 e+esuperscript𝑒superscript𝑒e^{+}e^{-} collider [1, 2, 3, 4] at the Budker Institute of Nuclear Physics (Novosibirsk, Russia) covers the center-of-mass (c.m.) energy (Ec.m.subscript𝐸formulae-sequencecmE_{\rm c.m.}) range from 0.32 to 2.01 GeV and uses a technique of round beams to reach an instantaneous luminosity of 1032 cm-2s-1 at Ec.m.=2.0subscript𝐸formulae-sequencecm2.0E_{\rm c.m.}=2.0 GeV. The Cryogenic Magnetic Detector (CMD-3) described in [5] is installed in one of the two interaction regions of the collider. The main goal of the CMD-3 is the precise measurement of the exclusive cross sections of e+esuperscript𝑒superscript𝑒e^{+}e^{-} annihilation into hadrons, which provides, for instance, a necessary input for the theoretical calculation of the hadronic contribution to the muon anomalous magnetic moment (g2)μsubscript𝑔2𝜇(g-2)_{\mu} and the running fine structure constant [6, 7, 8, 9].

The precise measurement of any hadronic cross section requires selection of a clean sample of signal events. The latter often requires the effective procedure of particle identification (PID), i.e. separation of electrons, muons, pions, kaons etc. In particular in the CMD-3:

  • 1.

    e±superscript𝑒plus-or-minuse^{\pm} identification can be performed on the base of the total energy deposition in the calorimeter [10];

  • 2.

    identification of muons can be carried out with the muon veto system;

  • 3.

    identification of antineutrons can be done with the time-of-flight system [11];

  • 4.

    separation of charged kaons and pions at the momenta less than 550 MeV/c𝑐c is performed using specific energy losses of particles in the drift chamber (dE/dxDC𝑑𝐸𝑑subscript𝑥DCdE/dx_{\rm DC}[12].

In this paper we describe a new technique of the charged PID based on the multiple measurements of the energy depositions of a particle in the layers of liquid xenon (LXe) calorimeter of the CMD-3 [13]. The LXe-based PID method is developed mainly for the task of K±/π±superscript𝐾plus-or-minussuperscript𝜋plus-or-minusK^{\pm}/\pi^{\pm} separation at momenta larger than 550 MeV/c𝑐c, where the dE/dxDC𝑑𝐸𝑑subscript𝑥DCdE/dx_{\rm DC}-based PID is inefficient. For the hadronic final states like K+Ksuperscript𝐾superscript𝐾K^{+}K^{-}, K+Kπ0superscript𝐾superscript𝐾superscript𝜋0K^{+}K^{-}\pi^{0}, K+K2π0superscript𝐾superscript𝐾2superscript𝜋0K^{+}K^{-}2\pi^{0}, KSK±πsubscript𝐾𝑆superscript𝐾plus-or-minussuperscript𝜋minus-or-plusK_{S}K^{\pm}\pi^{\mp} the LXe-based PID turns out to be an efficient tool for background suppression at high c.m. energies.

2 The liquid xenon calorimeter of the CMD-3 detector

The CMD-3 detector layout is shown in Fig. 1. The major tracking system is the cylindrical drift chamber (DC) [12], installed inside a thin (0.085 X0subscriptX0\rm X_{0}) superconducting solenoid with 1.3 T magnetic field. Amplitude information from the DC signal wires is used to measure z𝑧z-coordinates of tracks and ionization losses of charged particles. The endcap calorimeter is made of BGO crystals 13.4 X0subscriptX0\rm X_{0} thick [10]. The barrel calorimeter consists of the inner LXe-based (5.4 X0subscriptX0\rm X_{0}) ionization and outer CsI-based (8.1 X0subscriptX0\rm X_{0}) scintillation calorimeters [14]. The total amount of material in front of the barrel calorimeter is 0.35X0subscriptX0\rm X_{0}.

Refer to caption

Refer to caption

Figure 1: The CMD-3 detector layout: 1 — beam pipe, 2 — drift chamber, 3 — BGO endcap calorimeter, 4 — Z-chamber (ZC), 5 — superconducting solenoid, 6 — LXe calorimeter, 7 — time-of-flight system (TOF), 8 — CsI calorimeter, 9 — yoke.

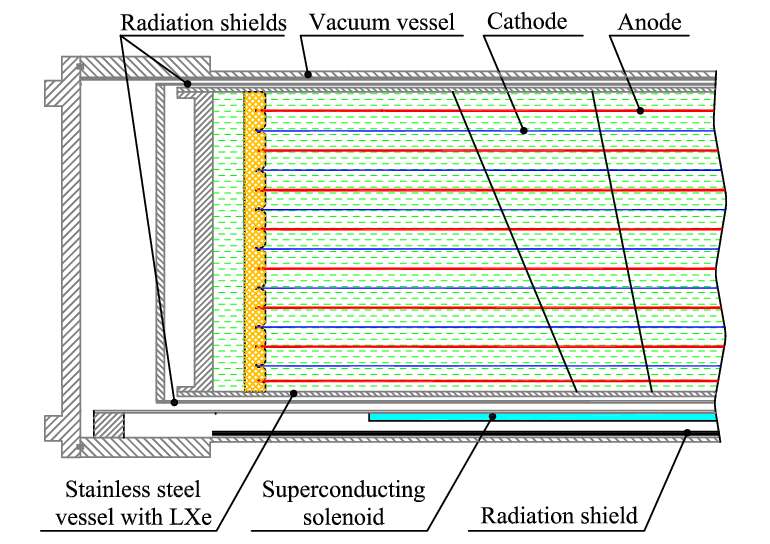
The LXe calorimeter consists of a set of ionization chambers with seven cylindrical cathodes and eight anodes with a 10.2 mm gap between them, see Fig. 3. The electrodes are made of copper-plated G-10. The typical electric field in the gap is 1.1 kV/cm. The conductive surfaces of the anode electrodes are divided into rectangular pads, electrically connected by the wire going through the cathode layers. These 264 sets of pads form the towers oriented to the interaction point and are used to measure the energy deposition of the particles.

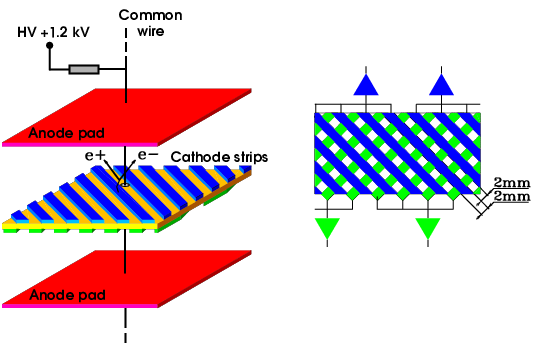
Both conductive surfaces of the cathode electrodes are divided into strips with a 1.2–1.8 mm width (depending on the layer), separated by the 1.5–2.0 mm gaps. A set of four consecutive strips is electrically connected to one superstrip making up one channel of electronics, see Fig. 3. The number of supestrips on one side of the cathode is 147–156. In what follows we refer to superstrips as just strips. The strips on the opposite sides of the cathode are mutually perpendicular that allows one to measure z𝑧z and φ𝜑\varphi coordinates of the clusters.

A current induced on the strip during the ionization flow is integrated for 4.5 μ𝜇\mus, where the integration time corresponds to the maximum drift time of electrons in the gap. The strip channels are used for the measurements of the photon conversion point coordinates and the dE/dx𝑑𝐸𝑑𝑥dE/dx of the particle in each of the 14 layers. Due to the gaps between the strips the cathodes are semitransparent, i.e. the ionization in one layer of the anode-cathode-anode double layer induces the charge on the strips of both sides of the cathode. This allows one to measure the coordinates of the point of photon conversion on the base of ionization that happened in one anode-cathode gap only.
Refer to caption

Figure 2: Structure of LXe calorimeter electrodes.

Refer to caption

Figure 3: Anode-cathode-anode double layer of the LXe calorimeter and the strip structure of the cathode.

3 The idea of the PID procedure

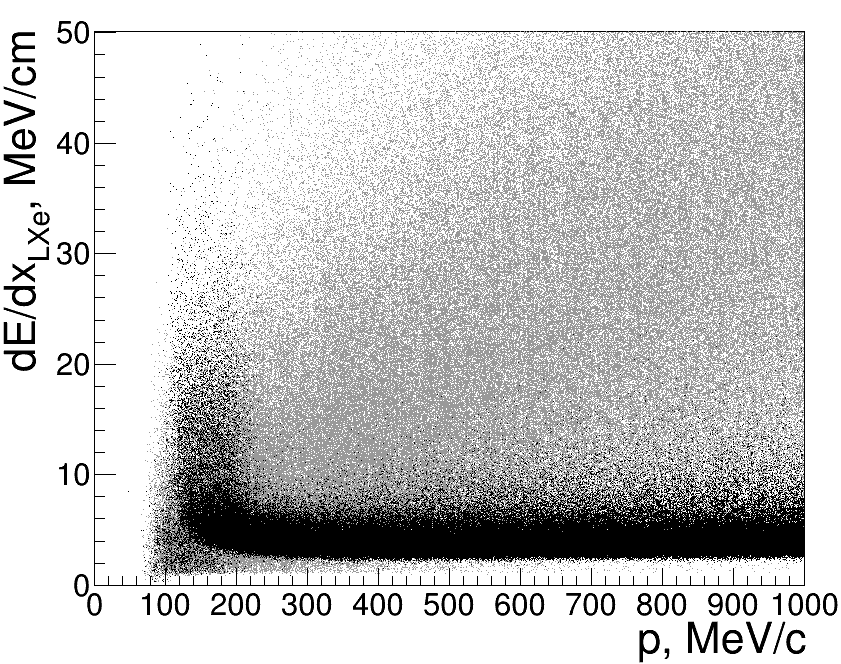
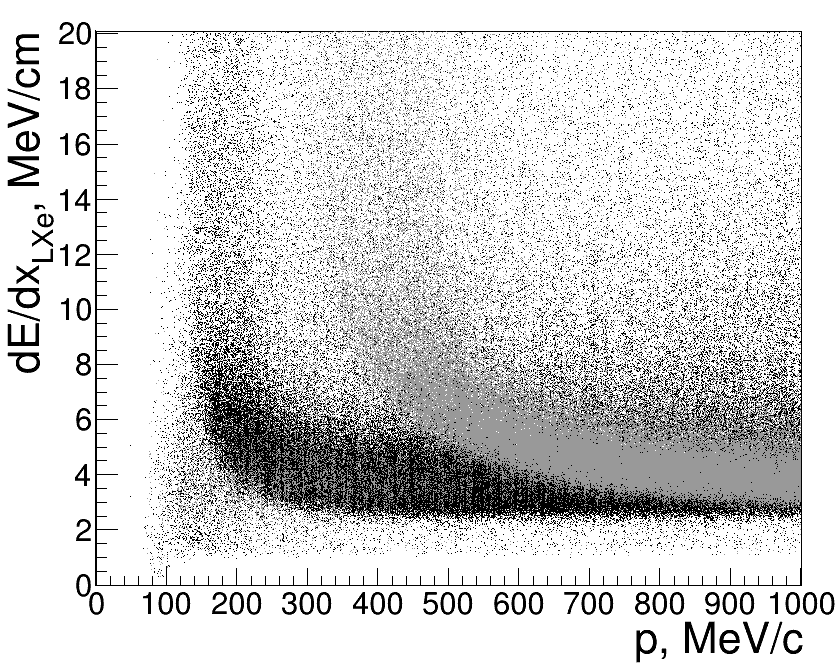
In what follows we denote by dE/dxLXe𝑑𝐸𝑑subscript𝑥LXedE/dx_{\rm LXe} the energy deposition produced by a particle in each LXe layer, normalized to the expected path length dLXesubscript𝑑LXed_{\rm LXe} of the particle in the layer, estimated via the DC-track extrapolation. dE/dxLXe𝑑𝐸𝑑subscript𝑥LXedE/dx_{\rm LXe} is the single designation for the minimum ionizing and nuclear interacting particles as well as for the electromagnetic showers. The distributions of dE/dxLXe𝑑𝐸𝑑subscript𝑥LXedE/dx_{\rm LXe} in 14 LXe layers depending on the particle momentum for the simulated single e±superscript𝑒plus-or-minuse^{\pm} and μ±superscript𝜇plus-or-minus\mu^{\pm}, π±superscript𝜋plus-or-minus\pi^{\pm} and K±superscript𝐾plus-or-minusK^{\pm} are shown in Figs. 5 and 5, respectively. One should note the following features of dE/dxLXe𝑑𝐸𝑑subscript𝑥LXedE/dx_{\rm LXe}:

  • 1.

    In Figs. 5 and 5 a certain momentum threshold pthrsubscript𝑝thrp_{\rm thr} is seen for each particle type that corresponds to a minimum energy necessary to pass through the material in front of the LXe. Below this threshold only the products of the particle decay or nuclear interaction can reach the calorimeter. For kaons pthrKsubscriptsuperscript𝑝𝐾thrp^{K}_{\rm thr} is about 300 MeV/c𝑐c for the normal incident;

  • 2.

    The dE/dxLXe𝑑𝐸𝑑subscript𝑥LXedE/dx_{\rm LXe} spectra and the values of pthrsubscript𝑝thrp_{\rm thr} depend on dLXesubscript𝑑LXed_{\rm LXe}. This dependence is caused by the dependences of the shower development rate, the nuclear interaction probability, the particle deceleration rate etc. on dLXesubscript𝑑LXed_{\rm LXe}.

Refer to caption

Figure 4: dE/dxLXe𝑑𝐸𝑑subscript𝑥LXedE/dx_{\rm LXe} in all LXe layers vs. particle momentum for e±superscript𝑒plus-or-minuse^{\pm} (gray) and μ±superscript𝜇plus-or-minus\mu^{\pm} (black) in simulation.

Refer to caption

Figure 5: dE/dxLXe𝑑𝐸𝑑subscript𝑥LXedE/dx_{\rm LXe} in all LXe layers vs. particle momentum for K±superscript𝐾plus-or-minusK^{\pm} (gray) and π±superscript𝜋plus-or-minus\pi^{\pm} (black) in simulation.

The LXe-based PID method uses the difference in the dE/dxLXe𝑑𝐸𝑑subscript𝑥LXedE/dx_{\rm LXe} in the LXe-layers for different particle types. Namely, for each track in the DC reaching LXe, we calculate six values of the responses of the boosted decision trees (BDT) classifiers provided by the TMVA package [15], trained for optimal separation of particular pairs of particle types in certain ranges of the momentum p𝑝p and dLXesubscript𝑑LXed_{\rm LXe}, i.e. in the Δpi×ΔdLXe,jΔsubscript𝑝𝑖Δsubscript𝑑LXe𝑗{\Delta}p_{i}\times{\Delta}d_{{\rm LXe},\,j} cell. In what follows we denote these six values as BDT(e±,μ±)BDTsuperscript𝑒plus-or-minussuperscript𝜇plus-or-minus{\rm BDT}(e^{\pm},\mu^{\pm}), BDT(e±,π±)BDTsuperscript𝑒plus-or-minussuperscript𝜋plus-or-minus{\rm BDT}(e^{\pm},\pi^{\pm}), BDT(e±,K±)BDTsuperscript𝑒plus-or-minussuperscript𝐾plus-or-minus{\rm BDT}(e^{\pm},K^{\pm}), BDT(μ±,π±)BDTsuperscript𝜇plus-or-minussuperscript𝜋plus-or-minus{\rm BDT}(\mu^{\pm},\pi^{\pm}), BDT(μ±,K±)BDTsuperscript𝜇plus-or-minussuperscript𝐾plus-or-minus{\rm BDT}(\mu^{\pm},K^{\pm}), BDT(π±,K±)BDTsuperscript𝜋plus-or-minussuperscript𝐾plus-or-minus{\rm BDT}(\pi^{\pm},K^{\pm}).

For training of each classifier we use samples of 105similar-toabsentsuperscript105{\sim}10^{5} simulated events with single e±superscript𝑒plus-or-minuse^{\pm}, μ±superscript𝜇plus-or-minus\mu^{\pm}, π±superscript𝜋plus-or-minus\pi^{\pm}, K±superscript𝐾plus-or-minusK^{\pm}, having the momentum and dLXesubscript𝑑LXed_{\rm LXe} uniformly distributed in the Δpi×ΔdLXe,jΔsubscript𝑝𝑖Δsubscript𝑑LXe𝑗{\Delta}p_{i}\times{\Delta}d_{{\rm LXe},\,j} cell. In total, we have 55 ΔpiΔsubscript𝑝𝑖{\Delta}p_{i} cells of 20 MeV/c𝑐c width in the momentum range from 100 to 1200 MeV/c𝑐c and eight ΔdLXe,jΔsubscript𝑑LXe𝑗{\Delta}d_{{\rm LXe},\,j} cells (from 1.0 to 1.5 cm at large momenta). Thus, there is 2×6×55×8=52802655852802{\times}6{\times}55{\times}8=5280 classifiers to be trained, where the factor of 2 stands for the two particle charges. The input variables for the classifiers are linear combinations of the dE/dxLXe𝑑𝐸𝑑subscript𝑥LXedE/dx_{\rm LXe} values in LXe layers described later in Section 5.

Since this PID method is based on the precise measurement of the energy deposition for different type of particles we need in the accurate energy calibration of the strip channels of the LXe calorimeter. Issues of the calibration of strip channels and the detector response tuning in MC are considered in the next sections.

4 Calibration of LXe calorimeter strip channels

In what follows we call cluster the group of the neighboring triggered strips (on one side of the cathode) with at least one strip having an amplitude above the cluster reconstruction threshold. This threshold is set to 1.5 MeV (in terms of the calibrated amplitude), which corresponds to the minimum amplitude induced by the minimum ionizing particles (MIPs) on the strip and is well above the level of electronics noise which energy equivalent is 0.1similar-toabsent0.1{\sim}0.1 MeV. The cluster amplitude is equal to the sum of the amplitudes of its strips. The typical number of strips in the cluster for MIPs is 2–3.

The calibration of the strips is performed using events with cosmic muons having the momentum larger than 1 GeV/c𝑐c. There are three stages of the calibration:

  1. 1.

    Equalization of the strip amplitudes normalized to the particle path length, within each of seven cathodes separately;

  2. 2.

    Equalization of the cluster amplitudes normalized to the particle path length in all seven cathodes by bringing them to a common average;

  3. 3.

    Calculation of the MeV to ADC channel [16] transition coefficient.

The calibrated strip amplitude is calculated as Acalib=ArawK3/(K1K2)subscript𝐴calibsubscript𝐴rawsubscript𝐾3subscript𝐾1subscript𝐾2A_{\rm calib}=A_{\rm raw}K_{3}/(K_{1}K_{2}), where K13subscript𝐾13K_{1...3} are the calibration coefficients of the corresponding stages, Arawsubscript𝐴rawA_{\rm raw} is the raw amplitude with the pedestal subtracted. To achieve the convergence of the K13subscript𝐾13K_{1...3} the calibration is carried out iteratively: reconstruction of events at the current iteration is performed with the application of the calibration coefficients calculated at the previous iteration. To obtain the calibration precision of about 1%, three iterations are sufficient. The K2subscript𝐾2K_{2} and K3subscript𝐾3K_{3} are not calculated at the first iteration, since it does not make sense to clusterize non-equalized strips.

4.1 Equalization of the strip amplitudes within each cathode

The equalization of the strip amplitudes is performed by fitting the spectra of amplitudes of the main strips in the clusters, i.e. of the strips with the maximum amplitude, see Fig. 7. These amplitudes are normalized to the particle’s path length to suppress the dependence on the inclination of the track in the anode-cathode gap. Let us denote by Amainstripmaxsubscriptsuperscript𝐴maxmainstripA^{\rm max}_{\rm main~{}strip} the position of the maximum of the normalized strip amplitude spectrum obtained from the Gaussian fit (Fig. 7). The K1subscript𝐾1K_{1} for a given strip is calculated as the ratio

K1=Amainstripmax/Amainstripmax¯,subscript𝐾1subscriptsuperscript𝐴maxmainstrip¯subscriptsuperscript𝐴maxmainstripK_{1}=A^{\rm max}_{\rm main~{}strip}/\overline{A^{\rm max}_{\rm main~{}strip}}, (1)

where Amainstripmax¯¯subscriptsuperscript𝐴maxmainstrip\overline{A^{\rm max}_{\rm main~{}strip}} is the average maximum position for the strips on both sides of the given cathode.

Simulation of cosmic muons reveals the residual angular dependence of the K1,MCsubscript𝐾1MCK_{1,\,\rm MC} manifested as the systematic ±plus-or-minus\pm1% modulation of the K1,MCsubscript𝐾1MCK_{1,\,\rm MC} for different strips, see Fig. 7. The same modulation is seen in the difference between the K1subscript𝐾1K_{1} coefficients, calculated in the experiment on the base of events with cosmic muons (K1,cosmicsubscript𝐾1cosmicK_{1,\,\rm cosmic}) and using muons from the process e+eμ+μsuperscript𝑒superscript𝑒superscript𝜇superscript𝜇e^{+}e^{-}{\to}\mu^{+}\mu^{-} (K1,μ+μsubscript𝐾1superscript𝜇superscript𝜇K_{1,\,\mu^{+}\mu^{-}}). Since muons from the process e+eμ+μsuperscript𝑒superscript𝑒superscript𝜇superscript𝜇e^{+}e^{-}{\to}\mu^{+}\mu^{-} have the uniform azimuthal angle distribution, there is no azimuthal modulation in K1,μ+μsubscript𝐾1superscript𝜇superscript𝜇K_{1,\,\mu^{+}\mu^{-}}. To account for observed modulation the experimental K1subscript𝐾1K_{1} is multiplied by the approximated angular dependence of the K1,MCsubscript𝐾1MCK_{1,\,\rm MC} (Fig. 7).

Figure 9 shows the K1subscript𝐾1K_{1} trends for the first and second calibration iterations in the runs of 2020 year.

Refer to caption

Figure 6: Typical amplitude spectrum of the cluster main strip and its Gaussian approximation near the maximum. The amplitude is normalized to the particle path length.

Refer to caption

Figure 7: K1,MCsubscript𝐾1MCK_{1,\,\rm MC} dependence on the strip number for simulated cosmic muons (black markers) and its approximation (black curve). The K1,cosmicK1,μ+μsubscript𝐾1cosmicsubscript𝐾1superscript𝜇superscript𝜇K_{1,\,\rm cosmic}-K_{1,\,\mu^{+}\mu^{-}} difference in the experiment as a function of the strip number is shown by the gray markers.

4.2 Equalization of average cluster amplitudes between cathodes

At the second stage we equalize the average cluster amplitudes normalized to the particle’s path length, dE/dx¯clustlsubscriptsuperscript¯𝑑𝐸𝑑𝑥𝑙clust\overline{dE/dx}^{l}_{\rm clust}, l=17𝑙17l=1...7, between cathodes. The average is calculated near the maximum of spectra in the limits containing similar-to\sim90% of events. The calibration coefficients K2lsubscriptsuperscript𝐾𝑙2K^{l}_{2} bringing the dE/dx¯clustlsubscriptsuperscript¯𝑑𝐸𝑑𝑥𝑙clust\overline{dE/dx}^{l}_{\rm clust} on each cathode to the common interlayer average are calculated as

K2l=dE/dx¯clustll=17dE/dx¯clustl/7.subscriptsuperscript𝐾𝑙2subscriptsuperscript¯𝑑𝐸𝑑𝑥𝑙clustsuperscriptsubscript𝑙17subscriptsuperscript¯𝑑𝐸𝑑𝑥𝑙clust7K^{l}_{2}=\frac{\overline{dE/dx}^{l}_{\rm clust}}{\sum\limits_{l=1}^{7}\overline{dE/dx}^{l}_{\rm clust}/7}. (2)

The same equalization procedure is performed for simulation. Figure 9 shows the K2lsubscriptsuperscript𝐾𝑙2K^{l}_{2} trends for different cathodes at the second calibration iteration in the 2020 runs.

Refer to caption

Figure 8: The typical K1subscript𝐾1K_{1} trend for one strip at the first (black) and second (gray) calibration iterations in the 2020 runs. The gray bands show the statistical uncertainties.

Refer to caption

Figure 9: The K2lsubscriptsuperscript𝐾𝑙2K^{l}_{2} trends for different cathodes at the second calibration iteration in the 2020 runs, see color/double layer correspondence in the legend.

4.3 Calculation of the MeV/channel transition coefficient

We calculate the MeV/channel transition coefficient K3subscript𝐾3K_{3} via the relation

K3=l=17dE/dx¯clustl,MCl=17dE/dx¯clustl,dataK3,MC[MeV/channel],subscript𝐾3superscriptsubscript𝑙17subscriptsuperscript¯𝑑𝐸𝑑𝑥𝑙MCclustsuperscriptsubscript𝑙17subscriptsuperscript¯𝑑𝐸𝑑𝑥𝑙dataclustsubscript𝐾3MCdelimited-[]MeVchannelK_{3}=\frac{\sum\limits_{l=1}^{7}\overline{dE/dx}^{l,{\rm MC}}_{\rm clust}}{\sum\limits_{l=1}^{7}\overline{dE/dx}^{l,{\rm data}}_{\rm clust}}{\cdot}K_{3,\rm MC}[\rm MeV/{\rm c}hannel], (3)

where K3,MCsubscript𝐾3MCK_{3,\rm MC} is the transition coefficient tabulated in the MC. Figure 10 shows the K3subscript𝐾3K_{3} trends for the second and third calibration iterations in the 2020 runs.

Refer to caption
Figure 10: The K3/K3,MCsubscript𝐾3subscript𝐾3MCK_{3}/K_{\rm{3,MC}} trends at the second (gray) and third (black) calibration iterations in the 2020 runs.

5 Detector response tuning in simulation

5.1 Tuning for minimum ionizing particles

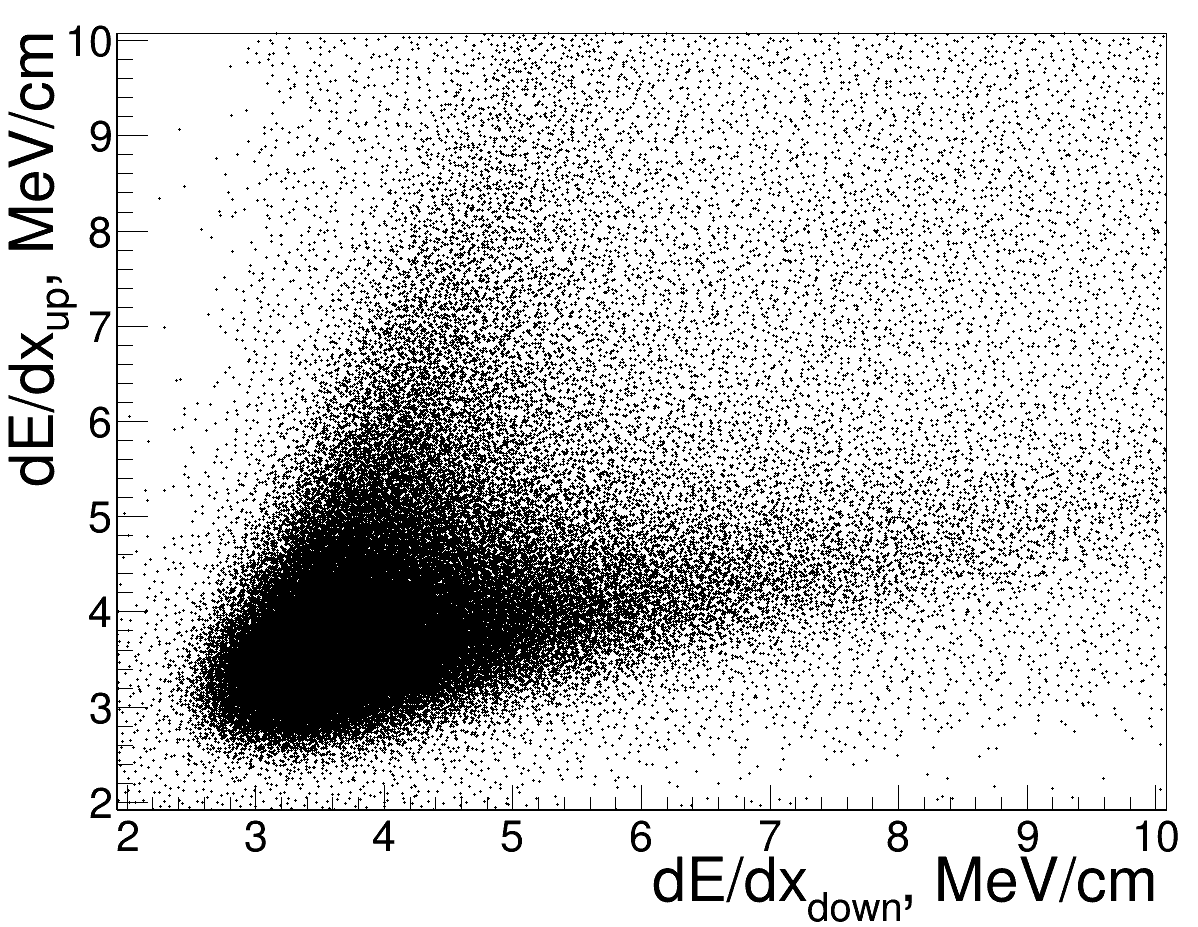
Figure 12 shows dE/dxLXe𝑑𝐸𝑑subscript𝑥LXedE/dx_{\rm LXe} of the cosmic muons measured in the innermost double layer by the upper strips (dE/dxup𝑑𝐸𝑑subscript𝑥updE/dx_{\rm up}) vs. that measured by the lower strips (dE/dxlow𝑑𝐸𝑑subscript𝑥lowdE/dx_{\rm low}). The events in the pair of inclined bands correspond to the cases, when the large ionization in one anode-cathode gap induces the large amplitude on the strips on the opposite side due to the cathode transparency. This cross-layer induction, compared with the normal interlayer induction, occurs with some suppression factor, which depends on the position of the ionization in the gap. The average of this factor over all possible ionization positions is called the transparency coefficient Tl,subscript𝑇𝑙T_{l}, l=17𝑙17l=1...7. The Tlsubscript𝑇𝑙T_{l} depends on the geometry of the cathode, namely on the widths of the strips and the gaps and on the thickness of dielectric. Initially we fix the Tlsubscript𝑇𝑙T_{l} values to the a priori value of 0.17 for all double layers.

The transparency mixes up the real energy depositions dE/dxlow,upreal𝑑𝐸𝑑subscriptsuperscript𝑥reallowupdE/dx^{\rm real}_{\rm low,\,up} into the amplitudes measured by the lower and upper strips dE/dxlow,upmeas𝑑𝐸𝑑subscriptsuperscript𝑥measlowupdE/dx^{\rm meas}_{\rm low,\,up}:

[dE/dxupmeasdE/dxlowmeas]=11+Tl[1TlTl1][dE/dxuprealdE/dxlowreal].matrix𝑑𝐸𝑑subscriptsuperscript𝑥measup𝑑𝐸𝑑subscriptsuperscript𝑥measlow11subscript𝑇𝑙matrix1subscript𝑇𝑙subscript𝑇𝑙1matrix𝑑𝐸𝑑subscriptsuperscript𝑥realup𝑑𝐸𝑑subscriptsuperscript𝑥reallow\begin{bmatrix}dE/dx^{\rm meas}_{\rm up}\\ dE/dx^{\rm meas}_{\rm low}\end{bmatrix}=\frac{1}{1+T_{l}}\begin{bmatrix}1&T_{l}\\ T_{l}&1\end{bmatrix}{\cdot}\begin{bmatrix}dE/dx^{\rm real}_{\rm up}\\ dE/dx^{\rm real}_{\rm low}\end{bmatrix}. (4)

These relations should be understood as correct on average, or as the definitions of dE/dxlow,upreal𝑑𝐸𝑑subscriptsuperscript𝑥reallowupdE/dx^{\rm real}_{\rm low,\,up}. For convenience in what follows we operate with the half sum and the half difference of the dE/dxlow,upreal𝑑𝐸𝑑subscriptsuperscript𝑥reallowupdE/dx^{\rm real}_{\rm low,\,up}:

[dE/dxsummdE/dxdiff]=12(1Tl)[1111][1TlTl1][dE/dxupmeasdE/dxlowmeas].matrix𝑑𝐸𝑑subscript𝑥summ𝑑𝐸𝑑subscript𝑥diff121subscript𝑇𝑙matrix1111matrix1subscript𝑇𝑙subscript𝑇𝑙1matrix𝑑𝐸𝑑subscriptsuperscript𝑥measup𝑑𝐸𝑑subscriptsuperscript𝑥measlow\begin{bmatrix}dE/dx_{\rm summ}\\ dE/dx_{\rm diff}\end{bmatrix}=\frac{1}{2(1-T_{l})}\begin{bmatrix}1&1\\ 1&-1\end{bmatrix}{\cdot}\begin{bmatrix}1&-T_{l}\\ -T_{l}&1\end{bmatrix}{\cdot}\begin{bmatrix}dE/dx^{\rm meas}_{\rm up}\\ dE/dx^{\rm meas}_{\rm low}\end{bmatrix}. (5)

We use dE/dxsumm𝑑𝐸𝑑subscript𝑥summdE/dx_{\rm summ} and dE/dxdiff𝑑𝐸𝑑subscript𝑥diffdE/dx_{\rm diff} in six inner double layers as the input variables of the BDT classifiers, described in Section 3. The outer seventh double layer suffers from the incomplete xenon fill and is not used in PID. The data/MC comparison of the dE/dxsumm𝑑𝐸𝑑subscript𝑥summdE/dx_{\rm summ} spectra for cosmic muons reveals the relative broadening of the experimental spectra, see Fig. 12 (in what follows the simulated histograms are normalized to the number of events in the experimental one unless otherwise stated). The alleged reason of the broadening is the complicated cathode structure, not taken into account in the MC, where the cathode is supposed to be just a solid plane. To account for this broadening, we add in simulation the random Gaussian noise to the amplitudes induced on the strips on both sides of the cathode. The width of the Gaussian noise is taken the same for all double layers, its energy equivalent is 0.8similar-toabsent0.8{\sim}0.8 MeV. The resulting simulation agrees well with the data, see Fig. 12.
Refer to caption

Figure 11: dE/dxLXe𝑑𝐸𝑑subscript𝑥LXedE/dx_{\rm LXe} for cosmic muons measured in the innermost double layer by the upper strips vs. that measured by the lower strips in the experiment.

Refer to caption

Figure 12: The dE/dxsumm𝑑𝐸𝑑subscript𝑥summdE/dx_{\rm summ} spectra in the innermost double layer for cosmic muons in the experiment (markers) and MC before (open histogram) and after (gray histogram) tuning.

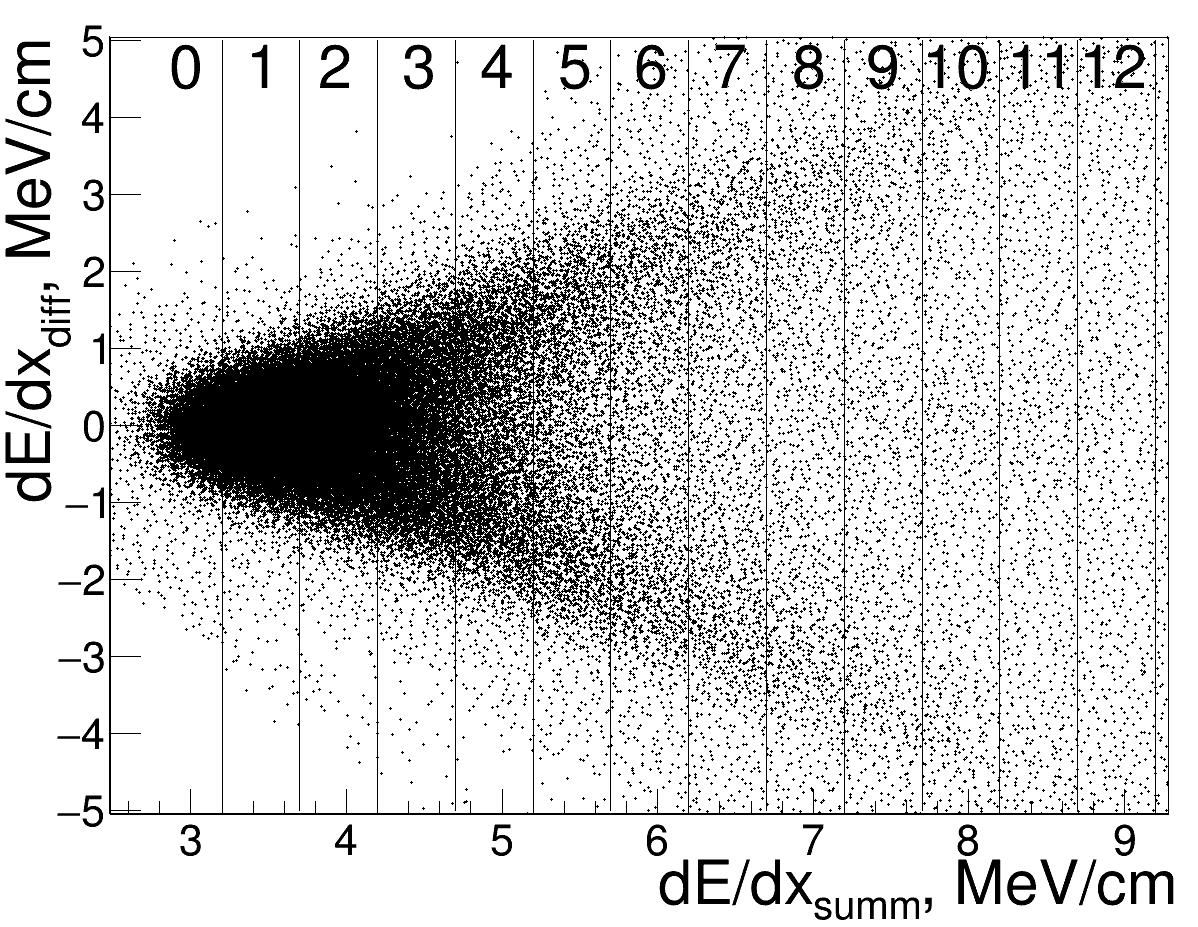
Next, Fig. 13 shows the distribution of the dE/dxdiff𝑑𝐸𝑑subscript𝑥diffdE/dx_{\rm diff} vs. dE/dxsumm𝑑𝐸𝑑subscript𝑥summdE/dx_{\rm summ} for the cosmic muons in the innermost double layer in the experiment. The vertical lines show the slices of the distribution, inside which we perform the data/MC comparison of the dE/dxdiff𝑑𝐸𝑑subscript𝑥diffdE/dx_{\rm diff} spectra. For example, such a comparison for the third double layer is shown in Fig. 14. Since the position of the peaks in Fig. 14 is mainly controlled by the Tlsubscript𝑇𝑙T_{l}, the discrepancy between the data/MC peak positions means that the a priori taken Tlsubscript𝑇𝑙T_{l} values are wrong. We tune the Tlsubscript𝑇𝑙T_{l} values to achieve the coincidence of the peaks and thus obtain the true transparency coefficients T1=0.23subscript𝑇10.23T_{1}=0.23, T2=0.22subscript𝑇20.22T_{2}=0.22, T3=0.35subscript𝑇30.35T_{3}=0.35, T4=0.32subscript𝑇40.32T_{4}=0.32, T5=0.35subscript𝑇50.35T_{5}=0.35, T6=0.33subscript𝑇60.33T_{6}=0.33, T7=0.33subscript𝑇70.33T_{7}=0.33 with about 5% uncertainty.

Refer to caption
Figure 13: The dE/dxdiff𝑑𝐸𝑑subscript𝑥diffdE/dx_{\rm diff} vs. dE/dxsumm𝑑𝐸𝑑subscript𝑥summdE/dx_{\rm summ} distribution for the cosmic muons in the innermost double layer in the experiment. The slicing on the dE/dxsumm𝑑𝐸𝑑subscript𝑥summdE/dx_{\rm summ} is also shown.

Apart from the shift of the peak positions we observe the relative broadening of the experimental dE/dxdiff𝑑𝐸𝑑subscript𝑥diffdE/dx_{\rm diff} spectra, presumably related to the variation of the transparency around its average value of Tlsubscript𝑇𝑙T_{l}. To account for this broadening, we add the anticorrelated Gaussian noise to the amplitudes, induced on the upper and lower strips in simulation. This means that the same random value is added to the amplitude of the upper strips and subtracted from the amplitude of the lower strips. This additional anticorrelated noise simulates the effect of the redistribution of the charge between upper and lower strips due to the Tlsubscript𝑇𝑙T_{l} variations. The variance of the additional noise is tuned individually in all double layers, the noise energy equivalents are 0.60.12similar-toabsent0.60.12{\sim}0.6-0.12 MeV depending on the layer. After the applied corrections we observe a good data/MC agreement in the dE/dxdiff𝑑𝐸𝑑subscript𝑥diffdE/dx_{\rm diff} spectra, see Fig. 14.

Refer to caption
Refer to caption
Figure 14: The dE/dxdiff𝑑𝐸𝑑subscript𝑥diffdE/dx_{\rm diff} spectra for the cosmic muons in the third double layer in all slices in the experiment (markers) and MC (gray histogram) before (upper figure) and after (lower figure) Tlsubscript𝑇𝑙T_{l} tuning and addition of the anticorrelated noise.

5.2 Tuning for electromagnetic shower

Another kind of the data/MC discrepancy is observed in the dE/dxsumm𝑑𝐸𝑑subscript𝑥summdE/dx_{\rm summ} spectra for the electromagnetic (e.m.) showers, produced in the calorimeter by electrons and positrons from the process e+ee+esuperscript𝑒superscript𝑒superscript𝑒superscript𝑒e^{+}e^{-}{\to}e^{+}e^{-}, see Fig. 15. The additional noises used for tuning of the MIPs in simulation show no serious effect on the large amplitudes of the e.m. showers. The actual reasons of the observed discrepancy remain unclear, but many possible sources were studied, including the imprecise description of the dead material in front of the calorimeter, the influence of the electronegative admixtures in LXe, the inaccurate value of LXe density etc. Fortunatelly, the discrepancy can be mostly eliminated by the simple linear transformation of the simulated amplitudes dE/dxmeas,corr=adE/dxmeasb𝑑𝐸𝑑superscript𝑥meascorr𝑎𝑑𝐸𝑑superscript𝑥meas𝑏dE/dx^{\rm meas,\,corr}=a{\cdot}dE/dx^{\rm meas}-b, where a=1.055𝑎1.055a=1.055 is the “additional calibration” coefficient for the showers and b=0.7𝑏0.7b=0.7 is the shift introduced to reach the data/MC coincidence of the minimum ionizing peaks in the innermost double layer. The resulting data/MC good agreement (except the innermost double layer), shown in Fig. 15, is conserved for all e±superscript𝑒plus-or-minuse^{\pm} momenta and angles.

Refer to caption

Refer to caption

Refer to caption

Figure 15: The dE/dxsumm𝑑𝐸𝑑subscript𝑥summdE/dx_{\rm summ} spectra in the first (left), third (middle) and fifth (right) double layers for e±superscript𝑒plus-or-minuse^{\pm} from the process e+ee+esuperscript𝑒superscript𝑒superscript𝑒superscript𝑒e^{+}e^{-}{\to}e^{+}e^{-} in the experiment (markers), MC before (open histogram) and after (gray histogram) linear transformation. The beam energy is 987.5 MeV.

6 Spectra of classifier response and signal/background separation power

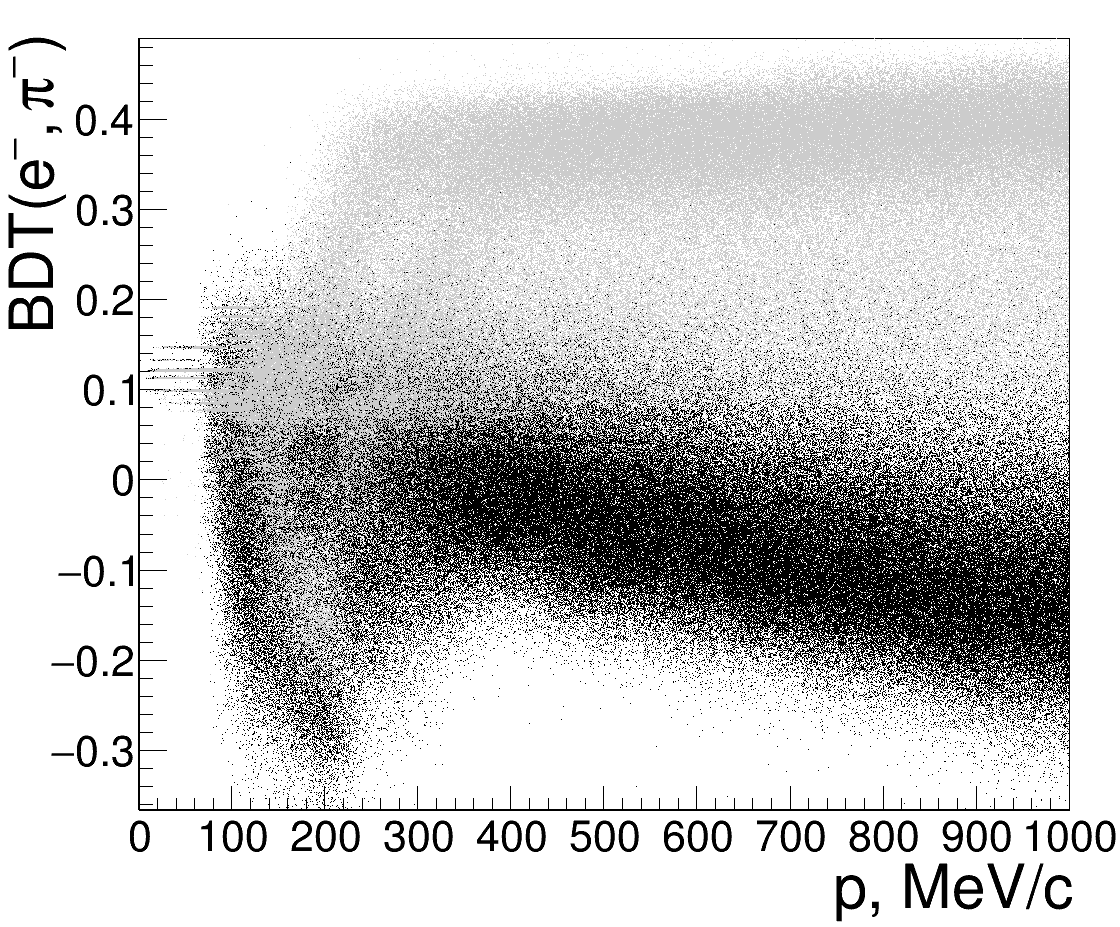
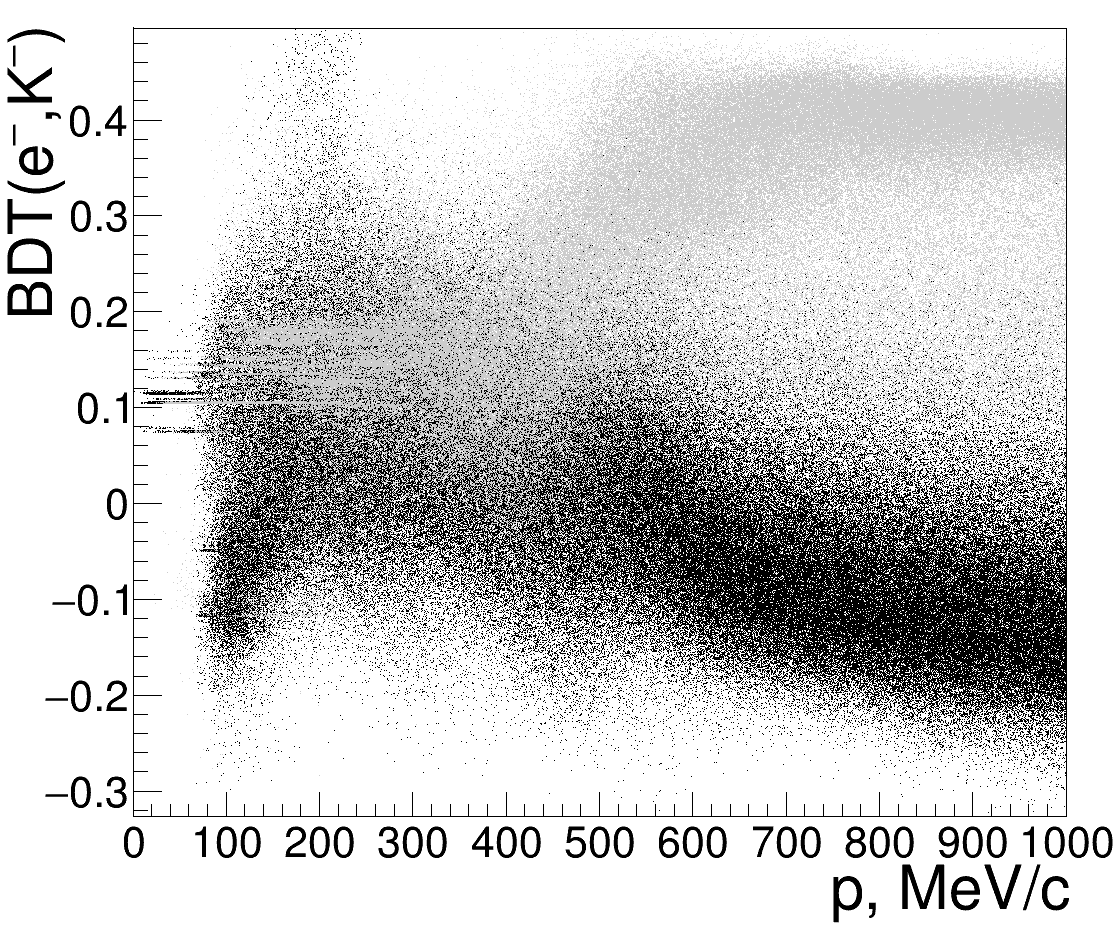
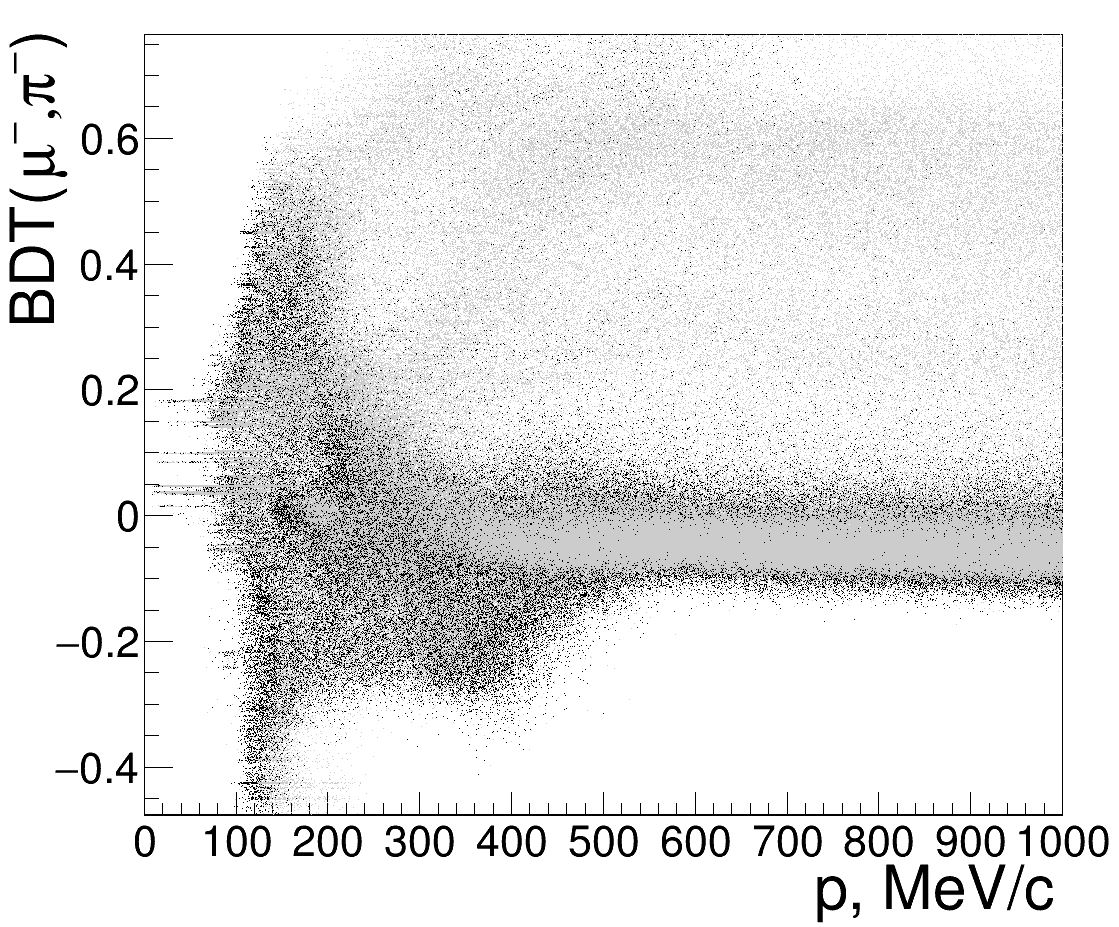
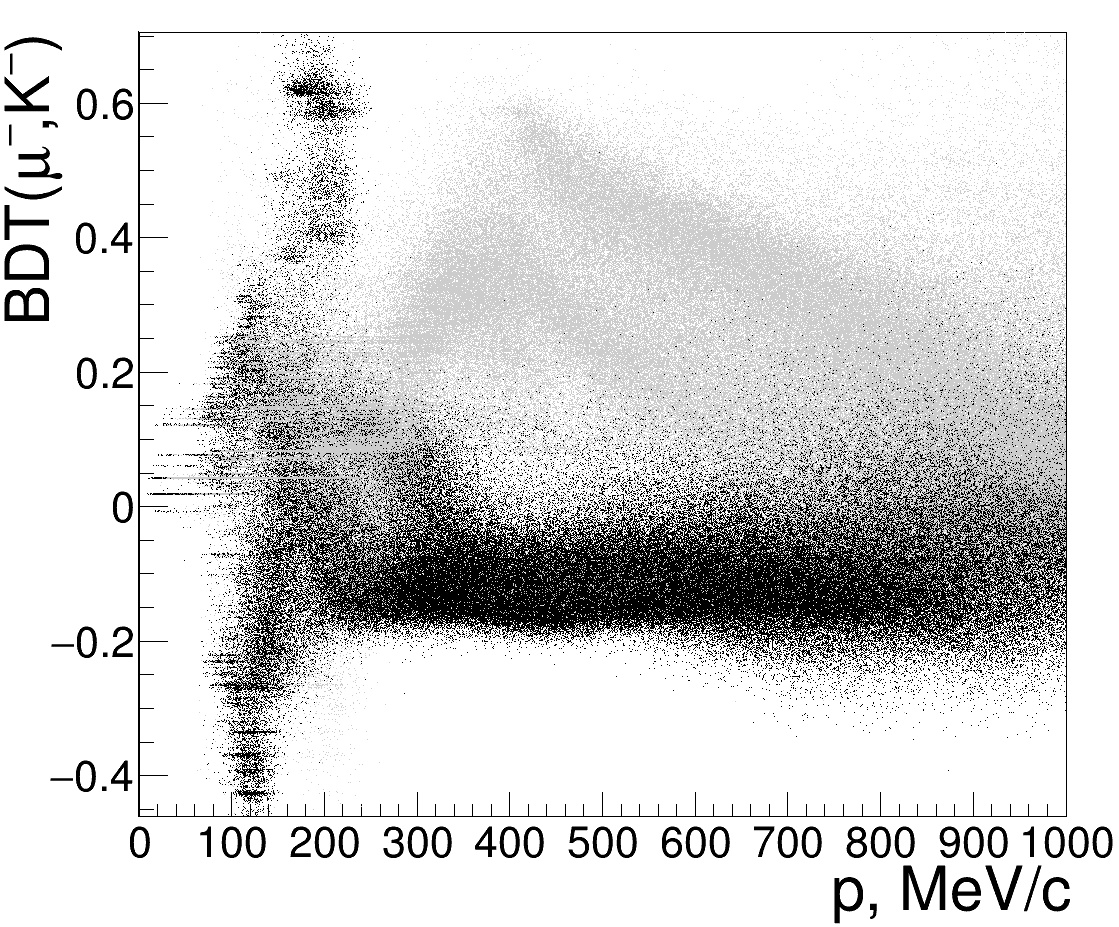
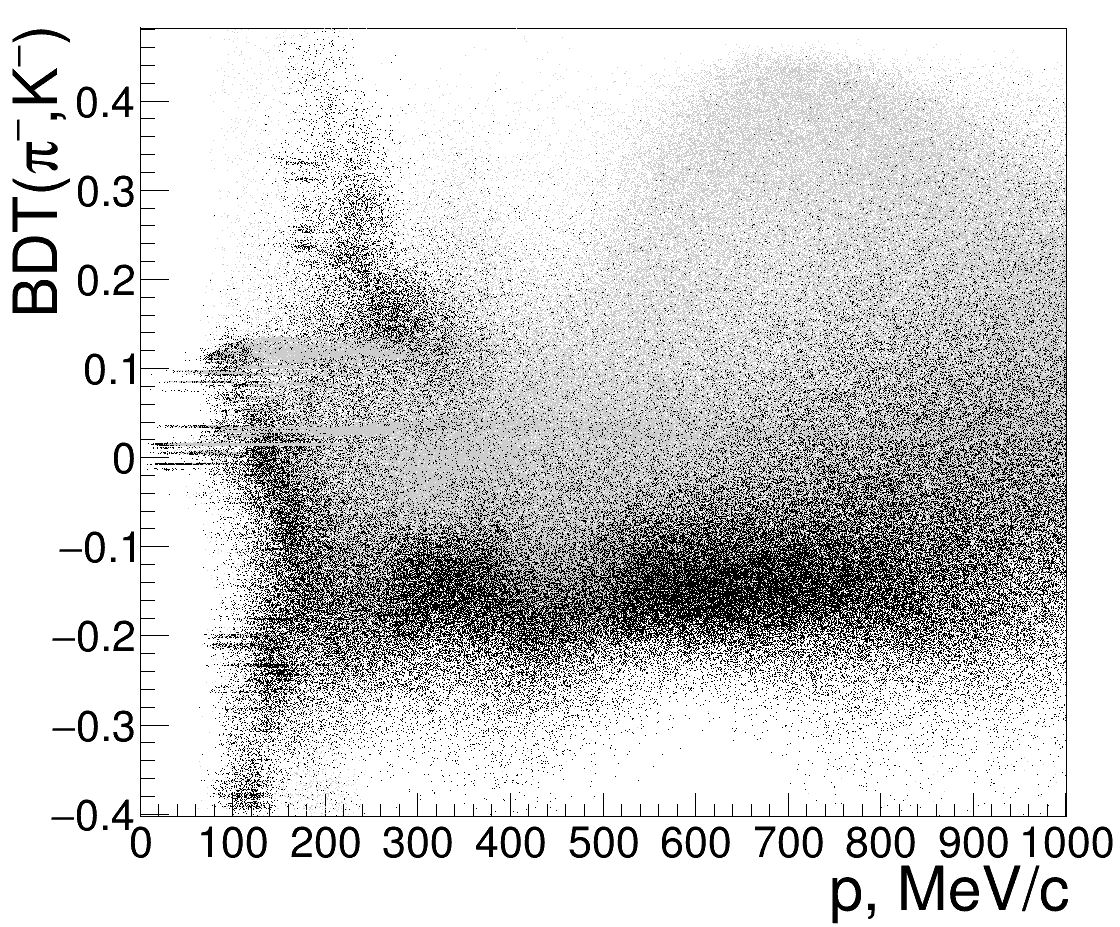
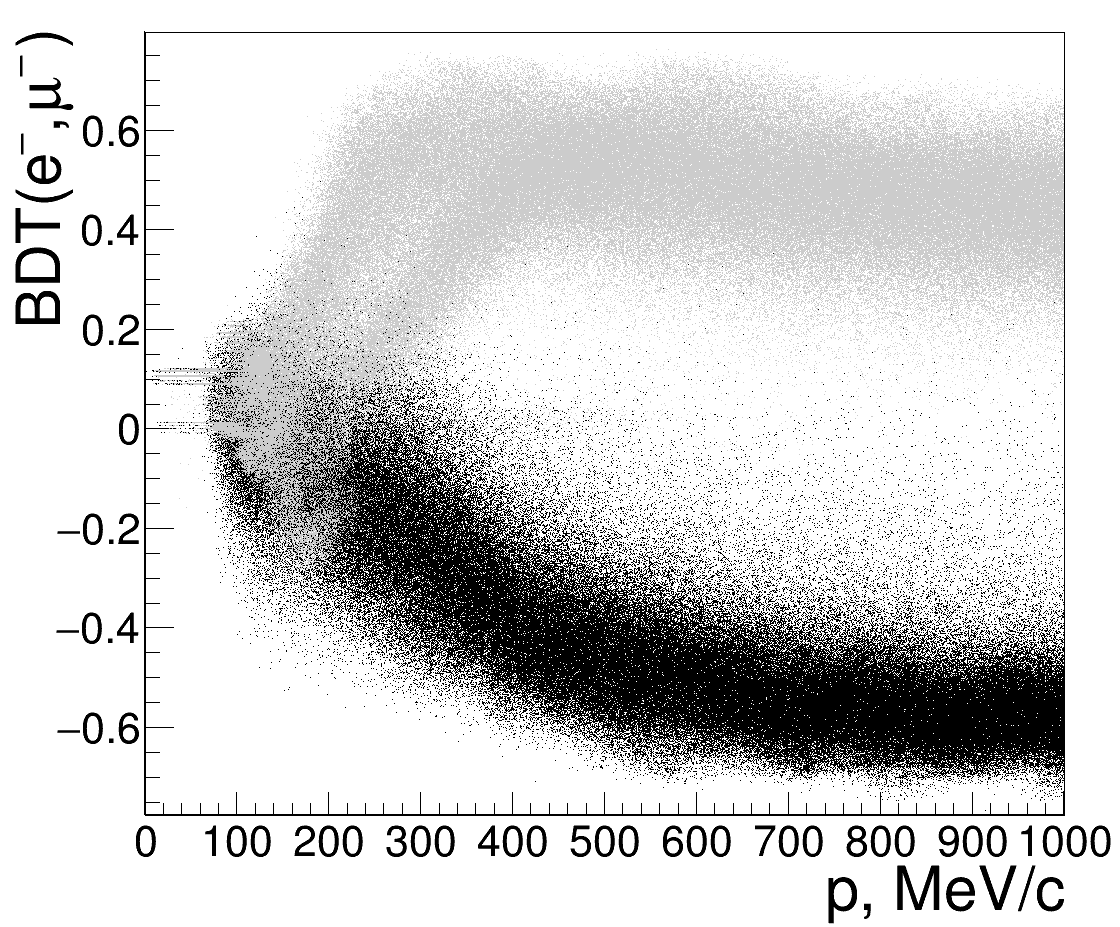
In this section we perform the data/MC comparison of the resulting BDT response spectra for different types of particles. Figures 1721 provide a general view of the potential effectiveness of all six types of classifiers as a function of particle momentum according to simulation. The “comb” in the BDT spectra at low momentum corresponds to the cases when all input variables of the classifiers are zero. It is seen, that μ/π𝜇𝜋\mu/\pi separation (Fig. 19) is not effective at all, whereas separation of e±superscript𝑒plus-or-minuse^{\pm} from μ±superscript𝜇plus-or-minus\mu^{\pm}, π±superscript𝜋plus-or-minus\pi^{\pm} and K±superscript𝐾plus-or-minusK^{\pm} (Figs. 1719) is effective starting from some threshold momentum.
Refer to caption

Figure 16: The BDT(e,μ)BDTsuperscript𝑒superscript𝜇{\rm BDT}(e^{-},\mu^{-}) vs. particle momentum for simulated esuperscript𝑒e^{-} (black) and μsuperscript𝜇\mu^{-} (gray), uniformly distributed in dLXesubscript𝑑LXed_{\rm LXe}.

Refer to caption

Figure 17: The BDT(e,π)BDTsuperscript𝑒superscript𝜋{\rm BDT}(e^{-},\pi^{-}) vs. particle momentum for simulated esuperscript𝑒e^{-} (black) and πsuperscript𝜋\pi^{-} (gray), uniformly distributed in dLXesubscript𝑑LXed_{\rm LXe}.

Refer to caption

Figure 18: The BDT(e,K)BDTsuperscript𝑒superscript𝐾{\rm BDT}(e^{-},K^{-}) vs. particle momentum for the simulated esuperscript𝑒e^{-} (black) and Ksuperscript𝐾K^{-} (gray), uniformly distributed in dLXesubscript𝑑LXed_{\rm LXe}.

Refer to caption

Figure 19: The BDT(μ,π)BDTsuperscript𝜇superscript𝜋{\rm BDT}(\mu^{-},\pi^{-}) vs. particle momentum for simulated μsuperscript𝜇\mu^{-} (black) and πsuperscript𝜋\pi^{-} (gray), uniformly distributed in dLXesubscript𝑑LXed_{\rm LXe}.

Refer to caption

Figure 20: The BDT(μ,K)BDTsuperscript𝜇superscript𝐾{\rm BDT}(\mu^{-},K^{-}) vs. particle momentum for simulated μsuperscript𝜇\mu^{-} (black) and Ksuperscript𝐾K^{-} (gray), uniformly distributed in dLXesubscript𝑑LXed_{\rm LXe}.

Refer to caption

Figure 21: The BDT(π,K)BDTsuperscript𝜋superscript𝐾{\rm BDT}(\pi^{-},K^{-}) vs. particle momentum for simulated πsuperscript𝜋\pi^{-} (black) and Ksuperscript𝐾K^{-} (gray), uniformly distributed in dLXesubscript𝑑LXed_{\rm LXe}.

6.1 Electrons/positrons

We select e±superscript𝑒plus-or-minuse^{\pm} from e+ee+esuperscript𝑒superscript𝑒superscript𝑒superscript𝑒e^{+}e^{-}{\to}e^{+}e^{-} events using the following criteria: 1) there are exactly two DC-tracks with the opposite charges; 2) the |ρ|𝜌|\rho| and |z|𝑧|z| of the track point of the closest approach to the beam axis should be less than 0.6 and 12 cm, respectively; 3) the polar angles of tracks should be in the range from 0.9 to π0.9𝜋0.9\pi-0.9 rad; 4) the tracks are collinear: |θ1+θ2π|<0.15subscript𝜃1subscript𝜃2𝜋0.15|\theta_{1}+\theta_{2}-\pi|<0.15 rad and ||φ1φ2|π|<0.15subscript𝜑1subscript𝜑2𝜋0.15||\varphi_{1}-\varphi_{2}|-\pi|<0.15 rad; 5) the energy deposition of each particle in the barrel calorimeter (LXe and CsI) is larger than the half beam energy (Ebeamsubscript𝐸beamE_{\rm beam}). Data/MC comparison for the BDT(e±,μ±)BDTsuperscript𝑒plus-or-minussuperscript𝜇plus-or-minus{\rm BDT}(e^{\pm},\mu^{\pm}), BDT(e±,π±)BDTsuperscript𝑒plus-or-minussuperscript𝜋plus-or-minus{\rm BDT}(e^{\pm},\pi^{\pm}) and BDT(e±,K±)BDTsuperscript𝑒plus-or-minussuperscript𝐾plus-or-minus{\rm BDT}(e^{\pm},K^{\pm}) spectra for the selected e±superscript𝑒plus-or-minuse^{\pm} at the low (280 MeV) and high (987.5 MeV) beam energies is shown in Fig. 22. Agreement is good in all cases.

Refer to caption Refer to caption Refer to caption
Figure 22: The BDT(e±,μ±)BDTsuperscript𝑒plus-or-minussuperscript𝜇plus-or-minus{\rm BDT}(e^{\pm},\mu^{\pm}) (left), BDT(e±,π±)BDTsuperscript𝑒plus-or-minussuperscript𝜋plus-or-minus{\rm BDT}(e^{\pm},\pi^{\pm}) (middle) and BDT(e±,K±)BDTsuperscript𝑒plus-or-minussuperscript𝐾plus-or-minus{\rm BDT}(e^{\pm},K^{\pm}) (right) spectra for the e±superscript𝑒plus-or-minuse^{\pm} selected from e+ee+esuperscript𝑒superscript𝑒superscript𝑒superscript𝑒e^{+}e^{-}{\to}e^{+}e^{-} events in the experiment (markers) and MC (gray histrogram) at Ebeam=280subscript𝐸beam280E_{\rm beam}=280 MeV (top figures) and Ebeam=987.5subscript𝐸beam987.5E_{\rm beam}=987.5 MeV (bottom figures).

6.2 Muons

We select a sample of μ±superscript𝜇plus-or-minus\mu^{\pm} from events with cosmic muons using the following criteria: 1) there is only one DC-track; 2) the track momentum is in the range from 100 to 1200 MeV/c𝑐c; 3) track is not central: the minimal distance from the track to the beam axis is in the range from 3 to 15 cm; 4) the energy deposition of the particle in the calorimeter is less than 400 MeV. Reasonable data/MC agreement for the BDT(e±,μ±)BDTsuperscript𝑒plus-or-minussuperscript𝜇plus-or-minus{\rm BDT}(e^{\pm},\mu^{\pm}), BDT(μ±,π±)BDTsuperscript𝜇plus-or-minussuperscript𝜋plus-or-minus{\rm BDT}(\mu^{\pm},\pi^{\pm}) and BDT(μ±,K±)BDTsuperscript𝜇plus-or-minussuperscript𝐾plus-or-minus{\rm BDT}(\mu^{\pm},K^{\pm}) spectra can be seen in Fig. 23.

Refer to caption

Refer to caption

Refer to caption

Figure 23: The BDT(e±,μ±)BDTsuperscript𝑒plus-or-minussuperscript𝜇plus-or-minus{\rm BDT}(e^{\pm},\mu^{\pm}) (left), BDT(μ±,π±)BDTsuperscript𝜇plus-or-minussuperscript𝜋plus-or-minus{\rm BDT}(\mu^{\pm},\pi^{\pm}) (middle) and BDT(μ±,K±)BDTsuperscript𝜇plus-or-minussuperscript𝐾plus-or-minus{\rm BDT}(\mu^{\pm},K^{\pm}) (right) spectra for the cosmic μ±superscript𝜇plus-or-minus\mu^{\pm} in the experiment (markers) and MC (gray histrogram). The muon momentum is in the range from 100 to 1200 MeV/c.

6.3 Pions

The clean π±superscript𝜋plus-or-minus\pi^{\pm} sample with well-predicted angular-momentum distributions can be obtained by selection of e+eϕ(1020)π+ππ0superscript𝑒superscript𝑒italic-ϕ1020superscript𝜋superscript𝜋superscript𝜋0e^{+}e^{-}{\to}\phi(1020){\to}\pi^{+}\pi^{-}\pi^{0} events. To do this, we search for events with exactly two DC-tracks with opposite charges and momenta larger than 100 MeV/c. Then, there should be not less than two photons with energies larger than 40 MeV. Sorting over all the pairs of such photons, we perform the 4C-kinematic fit for two tracks and the photon pair assuming energy-momentum conservation and choose the pair giving the smallest χ4C2subscriptsuperscript𝜒24C\chi^{2}_{\rm 4C}. If the invariant mass of the photon pair m2γsubscript𝑚2𝛾m_{\rm 2\gamma} satisfies the |m2γmπ0|<40MeV/c2subscript𝑚2𝛾subscript𝑚superscript𝜋040MeVsuperscriptc2|m_{\rm 2\gamma}-m_{\pi^{0}}|<40\,{\rm MeV/{\rm c}^{2}} condition, we consider the π+ππ0superscript𝜋superscript𝜋superscript𝜋0\pi^{+}\pi^{-}\pi^{0} event as reconstructed.

First of all, since simulation of nuclear interactions of pions is not perfect, we check the data/MC agreement in the dE/dxsumm𝑑𝐸𝑑subscript𝑥summdE/dx_{\rm summ} and dE/dxdiff𝑑𝐸𝑑subscript𝑥diffdE/dx_{\rm diff} spectra for selected π±superscript𝜋plus-or-minus\pi^{\pm}, see Fig. 24. The agreement is good for all pion momenta. Then, Fig. 25 shows good data/MC agreement for the BDT(e±,π±)BDTsuperscript𝑒plus-or-minussuperscript𝜋plus-or-minus{\rm BDT}(e^{\pm},\pi^{\pm}), BDT(μ±,π±)BDTsuperscript𝜇plus-or-minussuperscript𝜋plus-or-minus{\rm BDT}(\mu^{\pm},\pi^{\pm}) and BDT(π±,K±)BDTsuperscript𝜋plus-or-minussuperscript𝐾plus-or-minus{\rm BDT}(\pi^{\pm},K^{\pm}) spectra. The agreement is good for both pion charges. The efficiency of esuperscript𝑒e^{-} rejection vs. the efficiency of πsuperscript𝜋\pi^{-} selection (ROC-curve) for the BDT(e,π)BDTsuperscript𝑒superscript𝜋{\rm BDT}(e^{-},\pi^{-}) at different pion momenta is shown in Fig. 26.

Refer to caption Refer to caption Refer to caption
Figure 24: The dE/dxsumm𝑑𝐸𝑑subscript𝑥summdE/dx_{\rm summ} (top figures) and dE/dxdiff𝑑𝐸𝑑subscript𝑥diffdE/dx_{\rm diff} (bottom figures) in the 1st (left), 3rd (middle) and 5th (right) double layers for the π±superscript𝜋plus-or-minus\pi^{\pm} selected from e+eπ+ππ0superscript𝑒superscript𝑒superscript𝜋superscript𝜋superscript𝜋0e^{+}e^{-}{\to}\pi^{+}\pi^{-}\pi^{0} events in the experiment (markers) and simulation (gray histogram). The c.m. energy is 1019 MeV (ϕ(1020)italic-ϕ1020\phi(1020) meson peak).

Refer to caption

Refer to caption

Refer to caption

Figure 25: The BDT(e±,π±)BDTsuperscript𝑒plus-or-minussuperscript𝜋plus-or-minus{\rm BDT}(e^{\pm},\pi^{\pm}) (left), BDT(μ±,π±)BDTsuperscript𝜇plus-or-minussuperscript𝜋plus-or-minus{\rm BDT}(\mu^{\pm},\pi^{\pm}) (middle) and BDT(π±,K±)BDTsuperscript𝜋plus-or-minussuperscript𝐾plus-or-minus{\rm BDT}(\pi^{\pm},K^{\pm}) (right) spectra for the π±superscript𝜋plus-or-minus\pi^{\pm} selected from e+eπ+ππ0superscript𝑒superscript𝑒superscript𝜋superscript𝜋superscript𝜋0e^{+}e^{-}{\to}\pi^{+}\pi^{-}\pi^{0} events in the experiment (markers) and MC (gray histrogram). The c.m. energy is 1019 MeV (ϕ(1020)italic-ϕ1020\phi(1020) meson peak).
Refer to caption
Figure 26: The ROC-curves for the BDT(e,π)BDTsuperscript𝑒superscript𝜋{\rm BDT}(e^{-},\pi^{-}) classifier for different particle momenta (see legend) according to simulation.

6.4 Kaons

The clean K±superscript𝐾plus-or-minusK^{\pm} sample can be selected from the four-track e+eK+Kπ+πsuperscript𝑒superscript𝑒superscript𝐾superscript𝐾superscript𝜋superscript𝜋e^{+}e^{-}{\to}K^{+}K^{-}\pi^{+}\pi^{-} events. We select these events on the base of 60pb1similar-toabsent60superscriptpb1{\sim}60\,{\rm pb^{-1}} of integrated luminosity collected in the 2019 runs and use data from all energy points above the reaction threshold. The event selection procedure involves the kinematic energy-momentum selections along with the cuts on the value of the likelihood function, based on the dE/dxDC𝑑𝐸𝑑subscript𝑥DCdE/dx_{\rm DC} of tracks, as described in [17, 18]. However, a large part of selected kaons has the momenta lower than the ptrhK300similar-tosubscriptsuperscript𝑝Ktrh300p^{\rm K}_{\rm trh}\sim 300 MeV/c, and for such momenta only the products of kaon decay or nuclear interaction can reach the LXe.

Similarly to the case of pions, we check the accuracy of simulation of the nuclear interactions of kaons by the data/MC comparison for the dE/dxsumm𝑑𝐸𝑑subscript𝑥summdE/dx_{\rm summ} and dE/dxdiff𝑑𝐸𝑑subscript𝑥diffdE/dx_{\rm diff} spectra for selected K±superscript𝐾plus-or-minusK^{\pm}, see Fig. 27. The agreement is reasonable for all kaon momenta. The data/MC comparison for the BDT(e±,K±)BDTsuperscript𝑒plus-or-minussuperscript𝐾plus-or-minus{\rm BDT}(e^{\pm},K^{\pm}), BDT(μ±,K±)BDTsuperscript𝜇plus-or-minussuperscript𝐾plus-or-minus{\rm BDT}(\mu^{\pm},K^{\pm}) and BDT(π±,K±)BDTsuperscript𝜋plus-or-minussuperscript𝐾plus-or-minus{\rm BDT}(\pi^{\pm},K^{\pm}) spectra is shown in Fig. 28. The simulated BDT(π±,K±)BDTsuperscript𝜋plus-or-minussuperscript𝐾plus-or-minus{\rm BDT}(\pi^{\pm},K^{\pm}) spectrum seems somewhat distorted for K±superscript𝐾plus-or-minusK^{\pm} with low momenta (lower left picture in Fig. 28), presumably due to the inacurracy in the simulation of nuclear interactions. However, the distortion mostly disappears at large kaon momenta, see lower right picture in Fig. 28.

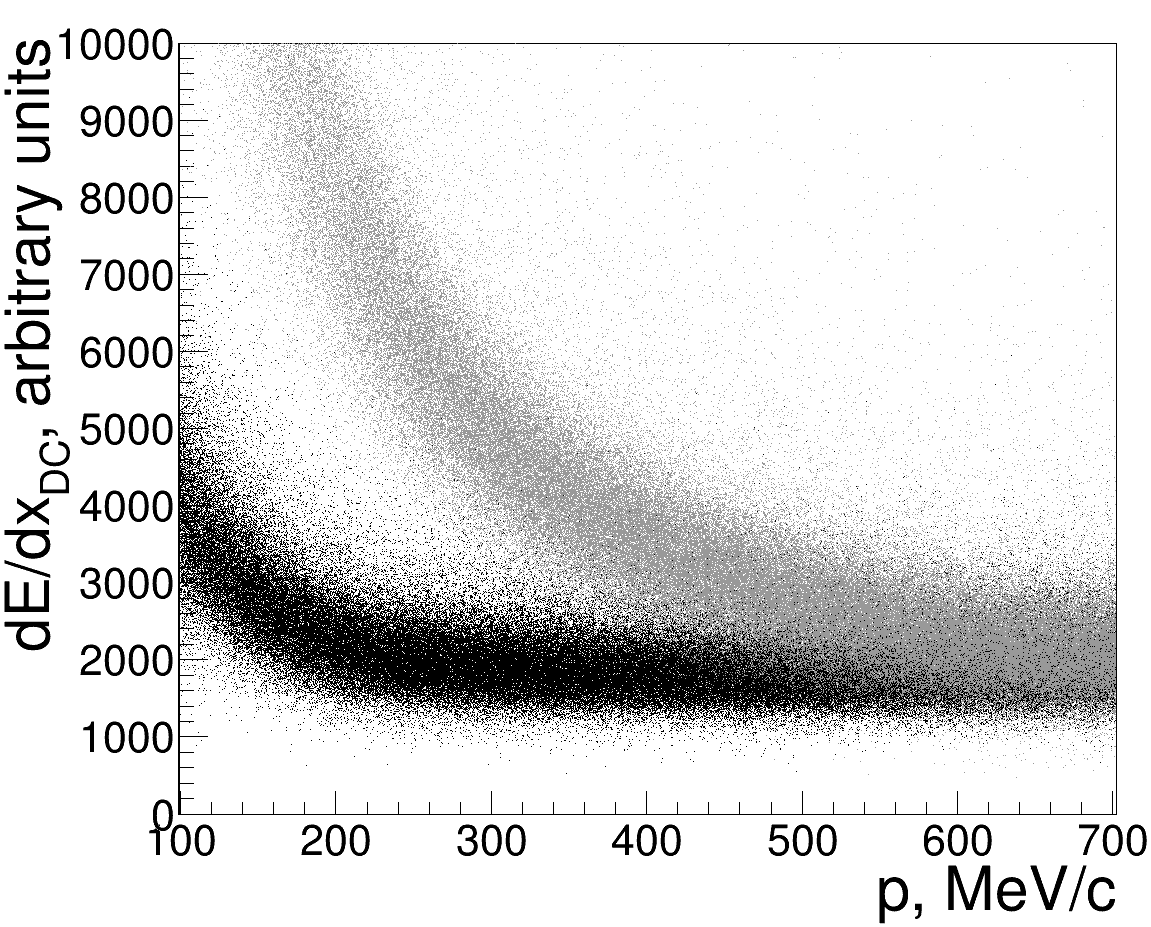
The LXe-based π/K𝜋𝐾\pi/K separation is of special importance in the studies of the hadronic processes with K±superscript𝐾plus-or-minusK^{\pm}, and it should be compared with the separation based on dE/dxDC𝑑𝐸𝑑subscript𝑥DCdE/dx_{\rm DC}. Figure 29 shows the distributions of the dE/dxDC𝑑𝐸𝑑subscript𝑥DCdE/dx_{\rm DC} vs. momentum for the simulated K±superscript𝐾plus-or-minusK^{\pm} and π±superscript𝜋plus-or-minus\pi^{\pm}. The ROC-curves for both types of classification at different particle momenta are shown in Fig. 30. At the momenta below 400 MeV/c the LXe-based classifier has poor efficiency. At the largest momenta its efficiency gradually reduces due to the decrease of the difference between kaon and pion ionization losses, see Fig. 5. Hovewer, the LXe-based π/K𝜋𝐾\pi/K separation remains effective at the momenta 650–900 MeV/c, where the dE/dxDC𝑑𝐸𝑑subscript𝑥DCdE/dx_{\rm DC}-based separation does not work.

Refer to caption Refer to caption Refer to caption
Figure 27: The dE/dxsumm𝑑𝐸𝑑subscript𝑥summdE/dx_{\rm summ} (top figures) and dE/dxdiff𝑑𝐸𝑑subscript𝑥diffdE/dx_{\rm diff} (bottom figures) in the 1st (left), 3rd (middle) and 5th (right) double layers for the K±superscript𝐾plus-or-minusK^{\pm} selected from e+eK+Kπ+πsuperscript𝑒superscript𝑒superscript𝐾superscript𝐾superscript𝜋superscript𝜋e^{+}e^{-}{\to}K^{+}K^{-}\pi^{+}\pi^{-} events in the experiment (markers) and simulation (gray histogram). The data from all experimental runs of 2019 are used.
Refer to caption Refer to caption
Figure 28: The BDT(e±,K±)BDTsuperscript𝑒plus-or-minussuperscript𝐾plus-or-minus{\rm BDT}(e^{\pm},K^{\pm}) (top), BDT(μ±,K±)BDTsuperscript𝜇plus-or-minussuperscript𝐾plus-or-minus{\rm BDT}(\mu^{\pm},K^{\pm}) (middle) and BDT(π±,K±)BDTsuperscript𝜋plus-or-minussuperscript𝐾plus-or-minus{\rm BDT}(\pi^{\pm},K^{\pm}) (bottom) spectra for the K±superscript𝐾plus-or-minusK^{\pm} and π±superscript𝜋plus-or-minus\pi^{\pm} selected from e+eK+Kπ+πsuperscript𝑒superscript𝑒superscript𝐾superscript𝐾superscript𝜋superscript𝜋e^{+}e^{-}{\to}K^{+}K^{-}\pi^{+}\pi^{-} events in the experiment (filled circles for K±superscript𝐾plus-or-minusK^{\pm} and empty circles for π±superscript𝜋plus-or-minus\pi^{\pm}) and simulation (gray histogram for K±superscript𝐾plus-or-minusK^{\pm} and open histogram for π±superscript𝜋plus-or-minus\pi^{\pm}). The left figures are drawn for particles with momenta lower than 400 MeV, the right – larger than 400 MeV. The data from all experimental runs of 2019 are used.
Refer to caption
Figure 29: dE/dxDC𝑑𝐸𝑑subscript𝑥DCdE/dx_{\rm DC} as a function of particle momentum for simulated K±superscript𝐾plus-or-minusK^{\pm} (gray) and π±superscript𝜋plus-or-minus\pi^{\pm} (black).
Refer to caption Refer to caption
Figure 30: The ROC-curves for the BDT(π,K)BDTsuperscript𝜋superscript𝐾{\rm BDT}(\pi^{-},K^{-}) classifier and dE/dxDC𝑑𝐸𝑑subscript𝑥DCdE/dx_{\rm DC}-based π/Ksuperscript𝜋superscript𝐾\pi^{-}/K^{-} separation for different particle momenta according to simulation. The classifier types and particle momenta are shown in the legends.

7 Examples of the application of the LXe-based PID

7.1 Separation of the e+e(γ)superscript𝑒superscript𝑒𝛾e^{+}e^{-}(\gamma) and π+π(γ)superscript𝜋superscript𝜋𝛾\pi^{+}\pi^{-}(\gamma) final states at Ebeam<500subscript𝐸beam500E_{\rm beam}<500 MeV

The developed PID procedure can be used for the important task of the pion form factor |Fπ|2superscriptsubscript𝐹𝜋2|F_{\pi}|^{2} measurement [19]. To calculate the |Fπ|2superscriptsubscript𝐹𝜋2|F_{\pi}|^{2} at the given Ec.m.subscript𝐸formulae-sequencecmE_{\rm c.m.} point one needs to determine the number of events of the π+π(γ)superscript𝜋superscript𝜋𝛾\pi^{+}\pi^{-}(\gamma) final state, Nπ+πsubscript𝑁superscript𝜋superscript𝜋N_{\pi^{+}\pi^{-}}. The major background sources for π+π(γ)superscript𝜋superscript𝜋𝛾\pi^{+}\pi^{-}(\gamma) are the e+e(γ)superscript𝑒superscript𝑒𝛾e^{+}e^{-}(\gamma), μ+μ(γ)superscript𝜇superscript𝜇𝛾\mu^{+}\mu^{-}(\gamma) final states and cosmic muons. The effective separation of the π+π(γ)superscript𝜋superscript𝜋𝛾\pi^{+}\pi^{-}(\gamma) and μ+μ(γ)superscript𝜇superscript𝜇𝛾\mu^{+}\mu^{-}(\gamma) final states at the CMD-3 is a difficult task at the energies Ebeam>350subscript𝐸beam350E_{\rm beam}>350 MeV. However, since the cross sections of the e+ee+e(γ)superscript𝑒superscript𝑒superscript𝑒superscript𝑒𝛾e^{+}e^{-}\to e^{+}e^{-}(\gamma) and e+eμ+μ(γ)superscript𝑒superscript𝑒superscript𝜇superscript𝜇𝛾e^{+}e^{-}\to\mu^{+}\mu^{-}(\gamma) processes are precisely calculated in the frame of QED, the number of events Nμ+μsubscript𝑁superscript𝜇superscript𝜇N_{\mu^{+}\mu^{-}} can be calculated once the number of events Ne+esubscript𝑁superscript𝑒superscript𝑒N_{e^{+}e^{-}} is known. In turn, determination of the Ne+esubscript𝑁superscript𝑒superscript𝑒N_{e^{+}e^{-}} becomes possible with the application of the effective separation of the e+e(γ)superscript𝑒superscript𝑒𝛾e^{+}e^{-}(\gamma) and π+π(γ)superscript𝜋superscript𝜋𝛾\pi^{+}\pi^{-}(\gamma) final states. Currently at CMD-3 we use two independent approaches for the e+e(γ)superscript𝑒superscript𝑒𝛾e^{+}e^{-}(\gamma) and π+π(γ)superscript𝜋superscript𝜋𝛾\pi^{+}\pi^{-}(\gamma) separation: 1) using the particle momenta; 2) using the full energy depositions of particles in the calorimeter. The LXe-based PID provides us another method of e+e(γ)superscript𝑒superscript𝑒𝛾e^{+}e^{-}(\gamma) and π+π(γ)superscript𝜋superscript𝜋𝛾\pi^{+}\pi^{-}(\gamma) separation.

As an example we consider the e+e(γ)superscript𝑒superscript𝑒𝛾e^{+}e^{-}(\gamma) and π+π(γ)superscript𝜋superscript𝜋𝛾\pi^{+}\pi^{-}(\gamma) separation at the energies Ebeam<500subscript𝐸beam500E_{\rm beam}<500 MeV in the experimental runs of 2018. We select events having exactly two oppositely charged tracks, satisfying the following conditions: 1) the momenta of tracks are larger than 100 MeV/cMeV𝑐{\rm MeV}/c; 2) the |ρ|𝜌|\rho| and |z|𝑧|z| of the track point of the closest approach to the beam axis should be less than 0.6 and 12 cm, respectively; 3) the polar angles of tracks should be in the range from 1.0 to π1.0𝜋1.0\pi-1.0 rad; 4) the track collinearity conditions: |θ1+θ2π|<0.25subscript𝜃1subscript𝜃2𝜋0.25|\theta_{1}+\theta_{2}-\pi|<0.25 rad and ||φ1φ2|π|<0.15subscript𝜑1subscript𝜑2𝜋0.15||\varphi_{1}-\varphi_{2}|-\pi|<0.15 rad.

Figure 31 shows the momentum spectrum for the particles, selected in the experiment and simulation at Ebeam=280subscript𝐸beam280E_{\rm beam}=280 MeV. The contribution of the collinear final states is estimated according to the known cross sections of the processes and luminosity, while the contribution of the cosmic muons is estimated using the events with the momenta larger than 1.25Ebeam1.25subscript𝐸beam1.25{\cdot}E_{\rm beam}. Further, Fig. 32 shows the distribution of the average BDT(e,π)BDT𝑒𝜋{\rm BDT}(e,\pi) response for two tracks, i.e. (BDT(e,π)+BDT(e+,π+))/2BDTsuperscript𝑒superscript𝜋BDTsuperscript𝑒superscript𝜋2({\rm BDT}(e^{-},\pi^{-})+{\rm BDT}(e^{+},\pi^{+}))/2, for Ebeam=280subscript𝐸beam280E_{\rm beam}=280 MeV (left tail of the ρ(770)𝜌770\rho(770)) and 380 MeV (near the peak of ρ(770)𝜌770\rho(770)). It is seen that the (BDT(e,π)+BDT(e+,π+))/2BDTsuperscript𝑒superscript𝜋BDTsuperscript𝑒superscript𝜋2({\rm BDT}(e^{-},\pi^{-})+{\rm BDT}(e^{+},\pi^{+}))/2 parameter provides a powerful classifier for e+e(γ)superscript𝑒superscript𝑒𝛾e^{+}e^{-}(\gamma) and π+π(γ)superscript𝜋superscript𝜋𝛾\pi^{+}\pi^{-}(\gamma) separation, see corresponding ROC-curves in Fig. 33. At Ebeam=380subscript𝐸beam380E_{\rm beam}=380 MeV the classifier allows to select 99.5% of π+π(γ)superscript𝜋superscript𝜋𝛾\pi^{+}\pi^{-}(\gamma) events by the 98% rejection of the e+e(γ)superscript𝑒superscript𝑒𝛾e^{+}e^{-}(\gamma) background.

Refer to caption
Figure 31: The momentum spectra of the particles selected at Ebeam=280subscript𝐸beam280E_{\rm beam}=280 MeV in the experiment (markers), simulation of π+π(γ)superscript𝜋superscript𝜋𝛾\pi^{+}\pi^{-}(\gamma) (gray histogram), e+e(γ)superscript𝑒superscript𝑒𝛾e^{+}e^{-}(\gamma) (horizontal hatching), μ+μ(γ)superscript𝜇superscript𝜇𝛾\mu^{+}\mu^{-}(\gamma) (vertical hatching) and cosmic muons (open histograsm). The black line shows the total MC of the signal and background processes.

Refer to caption

Refer to caption

Figure 32: The distribution of the (BDT(e,π)+BDT(e+,π+))/2BDTsuperscript𝑒superscript𝜋BDTsuperscript𝑒superscript𝜋2({\rm BDT}(e^{-},\pi^{-})+{\rm BDT}(e^{+},\pi^{+}))/2 (left — for Ebeam=280subscript𝐸beam280E_{\rm beam}=280 MeV, right — Ebeam=380subscript𝐸beam380E_{\rm beam}=380 MeV) in the experiment (markers), simulation of π+π(γ)superscript𝜋superscript𝜋𝛾\pi^{+}\pi^{-}(\gamma) (gray histogram), e+e(γ)superscript𝑒superscript𝑒𝛾e^{+}e^{-}(\gamma) (horizontal hatching), μ+μ(γ)superscript𝜇superscript𝜇𝛾\mu^{+}\mu^{-}(\gamma) (vertical hatching) and cosmic muons (dashed line). The open histogram shows the total MC of the signal and background processes.
Refer to caption
Figure 33: ROC-curves for separation of the e+e(γ)superscript𝑒superscript𝑒𝛾e^{+}e^{-}(\gamma) and π+π(γ)superscript𝜋superscript𝜋𝛾\pi^{+}\pi^{-}(\gamma) final states using (BDT(e,π)+BDT(e+,π+))/2BDTsuperscript𝑒superscript𝜋BDTsuperscript𝑒superscript𝜋2({\rm BDT}(e^{-},\pi^{-})+{\rm BDT}(e^{+},\pi^{+}))/2 at different Ebeamsubscript𝐸beamE_{\rm beam} (see legend) according to simulation.

7.2 Selection of the K+Ksuperscript𝐾superscript𝐾K^{+}K^{-} final state at high energies

Another application of the LXe-based PID is the task of the selection of the K+Ksuperscript𝐾superscript𝐾K^{+}K^{-} final state at high energies. As an example, we perform such selection on the base of 2.2 pb1superscriptpb1{\rm pb^{-1}} of data collected at Ec.m.=1.975subscript𝐸formulae-sequencecm1.975E_{\rm c.m.}=1.975 GeV in the 2019 runs. To select the two-track collinear events, we apply the selections listed earlier in Section 7.1. The main background sources are the e+e(γ)superscript𝑒superscript𝑒𝛾e^{+}e^{-}(\gamma), μ+μ(γ)superscript𝜇superscript𝜇𝛾\mu^{+}\mu^{-}(\gamma), π+π(γ)superscript𝜋superscript𝜋𝛾\pi^{+}\pi^{-}(\gamma) final states and the events with cosmic muons, their contributions in simulation are estimated in a way described earlier in Section 7.1. The background suppression is done by the cuts, imposed on the values of the average BDT responses (BDT(e,K)+BDT(e+,K+))/2BDTsuperscript𝑒superscript𝐾BDTsuperscript𝑒superscript𝐾2({\rm BDT}(e^{-},K^{-})+{\rm BDT}(e^{+},K^{+}))/2 and (BDT(μ,K)+BDT(μ+,K+))/2BDTsuperscript𝜇superscript𝐾BDTsuperscript𝜇superscript𝐾2({\rm BDT}(\mu^{-},K^{-})+{\rm BDT}(\mu^{+},K^{+}))/2 for the 2 tracks, see Figs. 3535. The cut on (BDT(μ,K)+BDT(μ+,K+))/2BDTsuperscript𝜇superscript𝐾BDTsuperscript𝜇superscript𝐾2({\rm BDT}(\mu^{-},K^{-})+{\rm BDT}(\mu^{+},K^{+}))/2 leads to the loss of 5similar-toabsent5{\sim}5% of signal events and also provides significant suppression of the e+eπ+π(γ)superscript𝑒superscript𝑒superscript𝜋superscript𝜋𝛾e^{+}e^{-}{\to}\pi^{+}\pi^{-}(\gamma) process. Since the cross section of the latter is relatively low at Ec.m.2similar-tosubscript𝐸formulae-sequencecm2E_{\rm c.m.}{\sim}2 GeV and π+πsuperscript𝜋superscript𝜋\pi^{+}\pi^{-} events are kinematically separated from K+Ksuperscript𝐾superscript𝐾K^{+}K^{-}, we do not impose any cuts on BDT(π±,K±)BDTsuperscript𝜋plus-or-minussuperscript𝐾plus-or-minus{\rm BDT}(\pi^{\pm},K^{\pm}).

Refer to caption

Figure 34: The (BDT(e,K)+BDT(e+,K+))/2BDTsuperscript𝑒superscript𝐾BDTsuperscript𝑒superscript𝐾2({\rm BDT}(e^{-},K^{-})+{\rm BDT}(e^{+},K^{+}))/2 spectra in the experiment (markers), MC of the K+K(γ)superscript𝐾superscript𝐾𝛾K^{+}K^{-}(\gamma) (gray histogram), e+e(γ)superscript𝑒superscript𝑒𝛾e^{+}e^{-}(\gamma) (hatched histogram). The open histogram shows the total MC of the signal and background processes.

Refer to caption

Figure 35: The (BDT(μ,K)+BDT(μ+,K+))/2BDTsuperscript𝜇superscript𝐾BDTsuperscript𝜇superscript𝐾2({\rm BDT}(\mu^{-},K^{-})+{\rm BDT}(\mu^{+},K^{+}))/2 spectra in the experiment (markers), MC of the K+K(γ)superscript𝐾superscript𝐾𝛾K^{+}K^{-}(\gamma) (gray histogram), μ+μ(γ)superscript𝜇superscript𝜇𝛾\mu^{+}\mu^{-}(\gamma) and cosmic muons (hatched histogram), π+π(γ)superscript𝜋superscript𝜋𝛾\pi^{+}\pi^{-}(\gamma) (dotted line). The open histogram shows the total MC of the signal and background processes.

Next, the signal/background separation is performed by approximation of the distribution of “energy disbalance” ΔEΔ𝐸{\Delta}E, defined as

ΔE=p+ 2c2+mK+2c4+p 2c2+mK2c4+|p++p|c2Ebeam1,Δ𝐸superscriptsubscript𝑝2superscript𝑐2subscriptsuperscript𝑚2superscript𝐾superscript𝑐4superscriptsubscript𝑝2superscript𝑐2subscriptsuperscript𝑚2superscript𝐾superscript𝑐4subscript𝑝subscript𝑝𝑐2subscript𝐸beam1{\Delta}E=\frac{\sqrt{{\vec{p}_{+}}^{\,2}c^{2}+m^{2}_{K^{+}}c^{4}}+\sqrt{{\vec{p}_{-}}^{\,2}c^{2}+m^{2}_{K^{-}}c^{4}}+|\vec{p}_{+}+\vec{p}_{-}|c}{2E_{\rm beam}}-1, (6)

where p±subscript𝑝plus-or-minus\vec{p}_{\pm} are the particle momenta. The additional term |p++p|subscript𝑝subscript𝑝|\vec{p}_{+}+\vec{p}_{-}|, corresponding to the total momentum of two tracks, allows to get rid of the superimposition of the signal peak with the e+e(γ)superscript𝑒superscript𝑒𝛾e^{+}e^{-}(\gamma) radiative tail. Figure 36 shows the ΔEΔ𝐸{\Delta}E spectra before and after the application of cuts on BDT. It is seen that after the background suppression the signal/background separation in the ΔEΔ𝐸{\Delta}E spectrum becomes possible. To perform the separation, we approximate the experimental ΔEΔ𝐸{\Delta}E spectra using the sum of three Gaussians to approximate the peaking background and the linear function to approximate the contribution of cosmic muons. The shape of the signal peak is fixed from the approximation of the simulated ΔEΔ𝐸{\Delta}E spectra for the e+eK+Ksuperscript𝑒superscript𝑒superscript𝐾superscript𝐾e^{+}e^{-}{\to}K^{+}K^{-} process, except for the shift of the signal peak as a whole and its additional broadening, which are added as the floating parameters. Thus, we obtain 548±27plus-or-minus54827548{\pm}27 of signal events at Ec.m.=1.975subscript𝐸formulae-sequencecm1.975E_{\rm c.m.}=1.975 GeV (Fig. 36, right).

It should be noted that for the c.m. energies larger than 1.5 GeV usage of the LXe-based PID is the only way to measure the e+eK+Ksuperscript𝑒superscript𝑒superscript𝐾superscript𝐾e^{+}e^{-}{\to}K^{+}K^{-} process cross section at CMD-3.

Refer to caption

Refer to caption

Figure 36: The ΔEΔ𝐸{\Delta}E spectra before (left) and after (right) background suppression in the experiment (markers) and MC of the K+K(γ)superscript𝐾superscript𝐾𝛾K^{+}K^{-}(\gamma) (gray histogram). The open histogram shows the total MC of the signal and background processes. The solid curve on the right picture shows the fit of the distribution in the experiment, dotted curve — the background part of the fit.

8 Conclusions

The procedure of the charged PID using the LXe calorimeter of the CMD-3 detector was developed. The procedure uses the energy depositions, measured in 12 layers of the LXe calorimeter, as the input for the set of boosted decision trees classifiers, trained for the separation of the electrons, muons, pions and kaons in the momentum range from 100 to 1200MeV/c1200MeV𝑐1200~{}{\rm MeV}/c. Since the event samples for the classifier training are taken from the MC, special attention was paid to the tuning of the simulated detector response. From the experimental side the procedure of the calibration of strip channels of LXe calorimeter with the precision of about 1% was developed. These efforts resulted in good data/MC agreement for the classifier responses for all particle types. Finally, the application of the method was demonstrated by the examples of separation of the e+e(γ)superscript𝑒superscript𝑒𝛾e^{+}e^{-}(\gamma) and π+π(γ)superscript𝜋superscript𝜋𝛾\pi^{+}\pi^{-}(\gamma) final states at Ebeam<500subscript𝐸beam500E_{\rm beam}<500 MeV and of the selection of the K+Ksuperscript𝐾superscript𝐾K^{+}K^{-} final state at high energies.

9 Acknowledgments

We thank the VEPP-2000 personnel for excellent machine operation. Part of work related to the method of the selection of e+eK+Kπ+πsuperscript𝑒superscript𝑒superscript𝐾superscript𝐾superscript𝜋superscript𝜋e^{+}e^{-}{\to}K^{+}K^{-}\pi^{+}\pi^{-} process events mentioned in the Section 6.4 is partially supported by the grant of the Russian Foundation for Basic Research 20-02-00496 A 2020.

References

  • [1] V.V. Danilov et al., Proceedings EPAC96, Barcelona, p.1593 (1996).
  • [2] I.A. Koop, Nucl. Phys. B (Proc. Suppl.) 181-182, 371 (2008).
  • [3] P.Yu. Shatunov et al., Phys. Part. Nucl. Lett. 13, 995 (2016).
  • [4] D. Shwartz et al., PoS ICHEP2016, 054 (2016).
  • [5] B.I. Khazin et al. (CMD-3 Collaboration), Nucl. Phys. B (Proc. Suppl.) 181-182, 376 (2008).
  • [6] F. Jegerlehner, Springer Tracks Mod. Phys. 274, 1 (2017).
  • [7] M. Davier, A. Hoecker, B. Malaescu, and Z. Zhang, Eur. Phys. J. C 77, 827 (2017).
  • [8] A. Keshavarzi, D. Nomura, T. Teubner, Phys. Rev. D 97, 114025 (2018).
  • [9] K. Hagiwara et al., J. Phys. G 38, 085003 (2011).
  • [10] D. Epifanov (CMD-3 Collaboration), J. Phys. Conf. Ser. 293, 012009 (2011).
  • [11] A. Amirkhanov et al., Nucl. Instrum. Meth. A936, 598 (2019).
  • [12] F. Grancagnolo et al., Nucl. Instr. Meth. A623, 114 (2010).
  • [13] A.V. Anisyonkov et al., Nucl. Instr. Meth. A598, 266 (2009).
  • [14] V.E. Shebalin et al., JINST 9 (10), C10013 (2014).
  • [15] H. Voss, A. Hcker, J. Stelzer, F. Tegenfeldt, PoS(ACAT) 040.
  • [16] K.I. Kakhuta and Yu.V. Yudin, Nucl. Instr. and Meth. A 598, 342 (2009).
  • [17] D.N. Shemyakin et al. (CMD-3 Collaboration), Phys.Lett. B 756, 153 (2016).
  • [18] R.R. Akhmetshin et al. (CMD-3 Collaboration), Phys. Lett. B 794, 64 (2019).
  • [19] F.V. Ignatov et al. (CMD-3 Collaboration), EPJ Web Conf. 218, 02006 (2019).