Atomic Collapse in Disordered Graphene Quantum Dots
Abstract
In this paper, we numerically study a Coulomb impurity problem for interacting Dirac fermions restricted in disordered graphene quantum dots. In the presence of randomly distributed lattice defects and spatial potential fluctuations, the response of the critical coupling constant for atomic collapse is mainly investigated by local density of states calculations within the extended mean-field Hubbard model. We find that both types of disorder cause an amplification of the critical threshold. As a result, up to thirty-four percent increase in the critical coupling constant is reported. This numerical result may explain why the Coulomb impurities remain subcritical in experiments, even if they are supercritical in theory. Our results also point to the possibility that atomic collapse can be observed in defect-rich samples such as Ar+ ion bombarded, He+ ion irradiated, and hydrogenated graphene.
Quantum electrodynamics predicts that the 1S1/2 state is only stable up to a critical nuclear charge 172; otherwise, formerly bound state becomes a resonant state reinhardt1977quantum . In spite of its long-standing history greiner2000relativistic , collapse of the vacuum is far from being proven in experiments performed with real atoms cowan1985anomalous . However, graphene reduces the critical threshold to 1 through a larger fine structure constant = 2.2/ pereira2007coulomb ; shytov2007atomic , where is the dielectric constant. Therefore, the idea of creating an artificial supercritical atom with a smaller critical valence charge has received considerable experimental attention wang2012mapping ; wang2013observing ; mao2016realization ; wong2017spatially ; lu2019frustrated . In the condensed matter analogue, Dirac fermions form the vacuum itself, and the Coulomb impurity acts as a nucleus that couples to the vacuum by means of a dimensionless coupling strength = neto2009electronic . When exceeds a critical coupling constant , the lowest energy electron state firstly turns into a quasi-bound state (QBS) pereira2007coulomb , which corresponds to the 1S1/2 state of the impurity, and an infinite number of QBS can appear for massless fermions, depending on the value of shytov2007atomic . The critical coupling constant is estimated to be = 0.5 for a vacuum consisting of non-interacting massless Dirac fermions shytov2007atomic ; pereira2007coulomb , and it remains the same when these fermions are confined in smaller-sized graphene quantum dots (GQDs) van2017graphene ; polat2020collapse . A further extension of the problem takes electron interactions into account biswas2007coulomb ; terekhov2008screening for which this critical value is renormalized to = 0.6 due to off-site Coulomb repulsion among Dirac particles polat2020collapse . However, up until now, all theoretical calculations assume a disorder-free graphene by ignoring the experimental facts hashimoto2004direct ; martin2008observation , and the question of effects of imperfections on atomic collapse in graphene has not been addressed yet.
Atomic scale defects meyer2008direct ; banhart2011structural and the intercalation of hydrogen atoms mccreary2012magnetic ; wang2018imaging ; ccakmak2018effects may arise during the growth process, and these defects lead to an imperfect honeycomb lattice eckmann2012probing ; li2019nanoscale . Furthermore, such a deformed vacuum can fluctuate in response to spatial charge inhomogeneities caused by substrate burson2013direct ; ozdemir2016magnetic . To find out ambiguous consequences of these distortions beyond conventional perspective of the theory, the hexagonal GQDs with armchair edges gucclu2010excitonic could provide a practical playground. These GQDs serve as a bridge between the finite-sized samples and bulk graphene thanks to their special band-gap characteristics gucclu2010excitonic ; devrim , and a sufficiently large size of them is enough to observe atomic collapse, as evidenced by transmission coefficients of the 1S1/2 state polat2020collapse . The latter could help in finding solutions to such complex problems via exact diagonalization of Hamiltonian, even in the case of interacting fermions.
In this letter, the critical threshold is studied by placing the Coulomb impurity at the center of disordered hexagonal GQDs. Deviations from the perfection in the vacuum are intentionally created by: (i) randomly distributed point vacancies with different concentrations and (ii) electron-hole puddles induced by Gaussian impurities. We find a strong dependence of the critical threshold on both types of disorder, leading to up to thirty-four percent increase in the critical coupling constant.
[\capbeside\thisfloatsetupcapbesideposition=right,center,capbesidewidth=6cm]figure[\FBwidth]
Extended mean-field Hubbard model is employed to study the dynamics, and its Hamiltonian reads
| (1) |
where the first term describes the tight-binding Hamiltonian with a hopping amplitude of = -2.8 eV in which the operator () creates (annihilates) an electron with spin at the lattice site i. = 16.52/ eV is the onsite Coulomb repulsion devrim , where = 6 is equivalent to that of the SiO2 substrate under the effects of interband polarization ando2006screening . is the spin-dependent expectation value of electron densities, and niσ is the spin-dependent number operator. Third term is associated with the off-site Coulomb repulsion, which is set to be 8.64/ eV, 5.33/ eV, and 27.21/dij eV for the nearest-neighbors, next-nearest-neighbors, and the remote atomic sites, respectively devrim ; potasz2010spin . dij is the distance between the sites i and j at relatively large distances, and it is in atomic units. The last term represents the Coulomb impurity placed at the origin of coordinate system, where ri is the distance between the impurity and the site i. 1 106 m/s is the Fermi velocity.
Atomic vacancies with concentrations of 0.1, 0.5, 1, and 2, which refers to the ratio of the number of point vacancies N to that of the lattice sites N, are created by randomly and equally removing the two sublattices, A (50) and B (50), of the bipartite lattice altintacs2018defect . For 1 concentration of carbon vacancies, the electron-hole puddles are created by the superposition of contributions of randomly distributed Gaussian impurities bardarson2007one with a total number of = 16, i.e., the impurity concentration = 1.1 1013 cm-2. Gaussian potential at a position rn can be written as follows: , where is the impurity strength, and the impurity correlation length is taken to be = 10a (a = 0.142 nm is the C-C distance) zhang2009origin . Half of these impurities are chosen as positive and the other half as negative with the help of , which randomly fluctuates within three different intervals: (i) 0.1t, (ii) 0.3t, and (iii) 0.5t.
Local density of states (LDOS) shytov2007atomic is experimentally accessible through a scanning tunneling microscope (STM) wang2013observing and is calculated by = , where is the normalized wave function, the energy is identical to applied bias voltage in STM measurements, and is the eigenenergy of the ith state. The LDOS is the spatially resolved density of states (DOS), which is calculated by summing the discrete energy levels of the GQDs at a set of radial distances from the impurity, ranging from r = 0.142 nm up to r = 1.136 nm. The summations are performed by using a Gaussian membership function with a standard deviation of = 0.2 eV in a linearly spaced energy interval E [-2.5,2.5]. Since the effects of random disorders may differ from atom to atom, these calculations are separately carried out for each individual atom at the predefined radial distances, and this is repeated in ten random disorder distributions for each of the above configurations text . Finally, the LDOS spectra per lattice site at various distances are extracted by averaging over these samples.
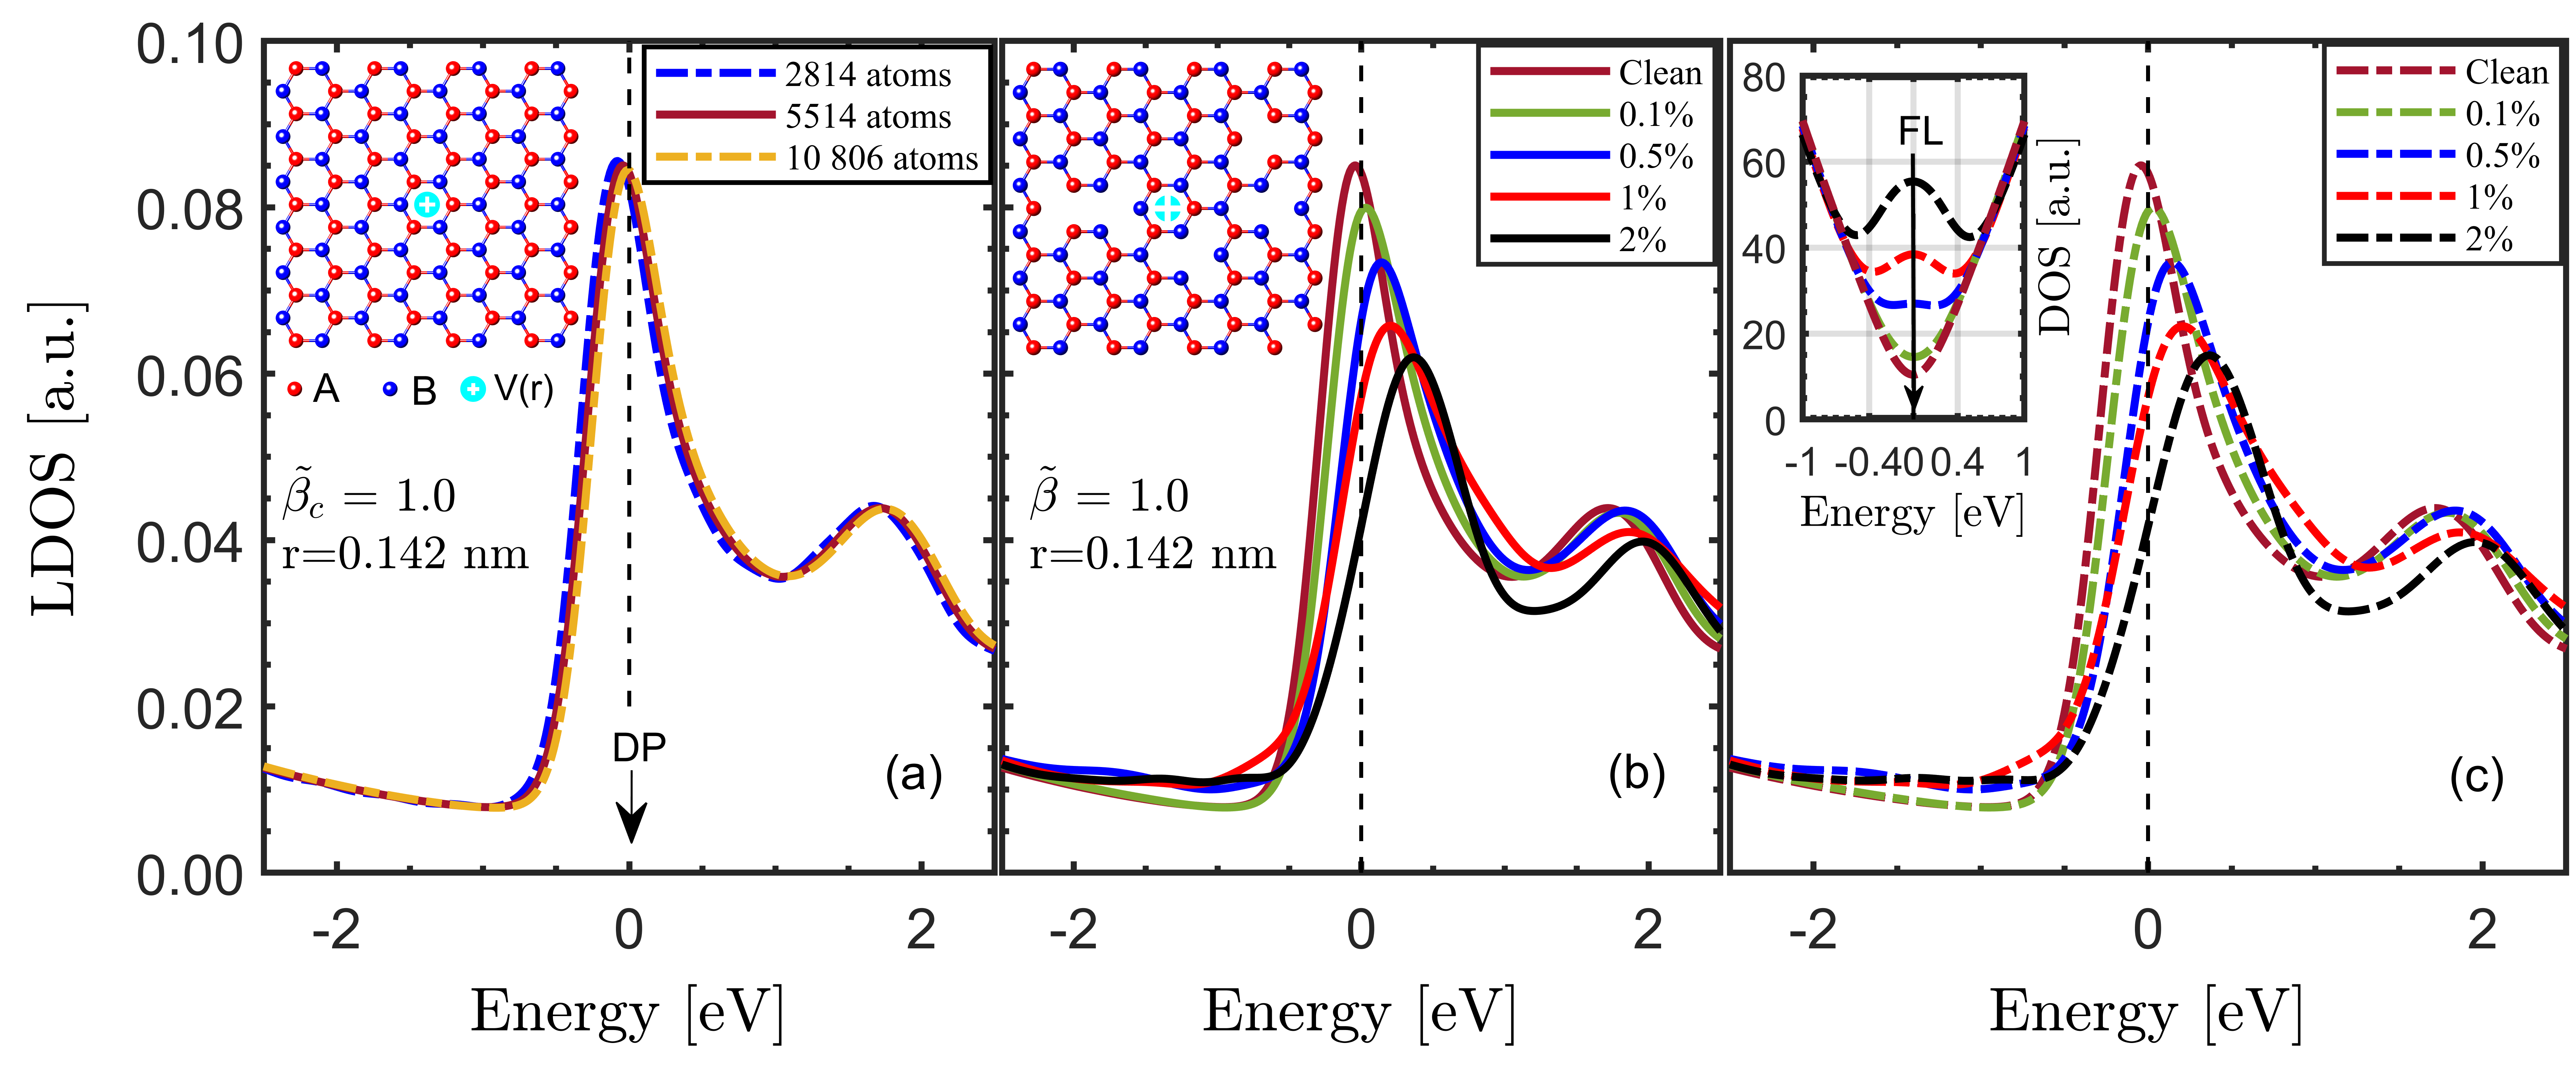
It can be useful to discuss the effect of the vacuum size from a different perspective before proceeding to the disordered cases. The pristine hexagonal GQDs that differ in size are created, and the discrete energy levels of them are summed over at the impurity site r = 0.142 nm, as described above. Although such a sum corresponding to a family of QBS is not necessary for the perfect vacuums, it will provide a considerable advantage in the following sections. All supercritical states are sequentially arranged within this family, which contains the 1S1/2 state as the first component shytov2007atomic . Atomic collapse occurs when this sharp peak in the electronic LDOS crosses just below the Dirac point (DP) wang2013observing , which will be the energy origin in our calculations due to the formation of spatially extended resonances at the negative energies van2017graphene . Meanwhile, the Fermi level (FL) moves down starting from the energy origin as the coupling strength is increased within the half-filled model van2017graphene ; polat2020collapse . To avoid too cumbersome notation, the critical coupling constant of the families of QBS is represented by , and only the response of the spin-up Dirac fermions is studied for the perfect vacuums due to the presence of a spin-independent central potential. The spin-up QBS families at the impurity site are shown in Fig. 1(a) for the perfect GQDs consisting of 2814, 5514, and 10 806 carbon atoms. All families are pinned just below the DP at = 1.0, revealing that the effect of the Coulomb impurity is the same for all these GQDs, and the critical bare valence charge is calculated to be 2.73 by taking = 6.
When point defects are evenly distributed between the sublattices, i.e., A (50) and B (50), the FL continues to stay at the energy origin in the absence of the impurity pereira2006disorder ; pereira2008modeling ; kul2020electronic as shown in the inset of Fig. 1(c). In fact, the FL is the same for both the perfect and disordered cases that validates the previous discussion on the DP and the FL in our defect configurations when is turned on. As for the spin symmetry, it is naturally broken in the disordered lattices altintacs2018defect . However, there is no difference between the spin-up and spin-down families near as shown in Fig. 1(b) and Fig. 1(c), respectively. As is clear from these two figures, all QBS families at the impurity site retreat from the DP depending on the concentration of these defects, which are randomly distributed in the GQD lattice consisting of 5514 atoms in the pristine case. Fig. 1(b) and Fig. 1(c) point out that = 1.0 is no longer a critical coupling constant, and it is the first effect of point defects on atomic collapse.
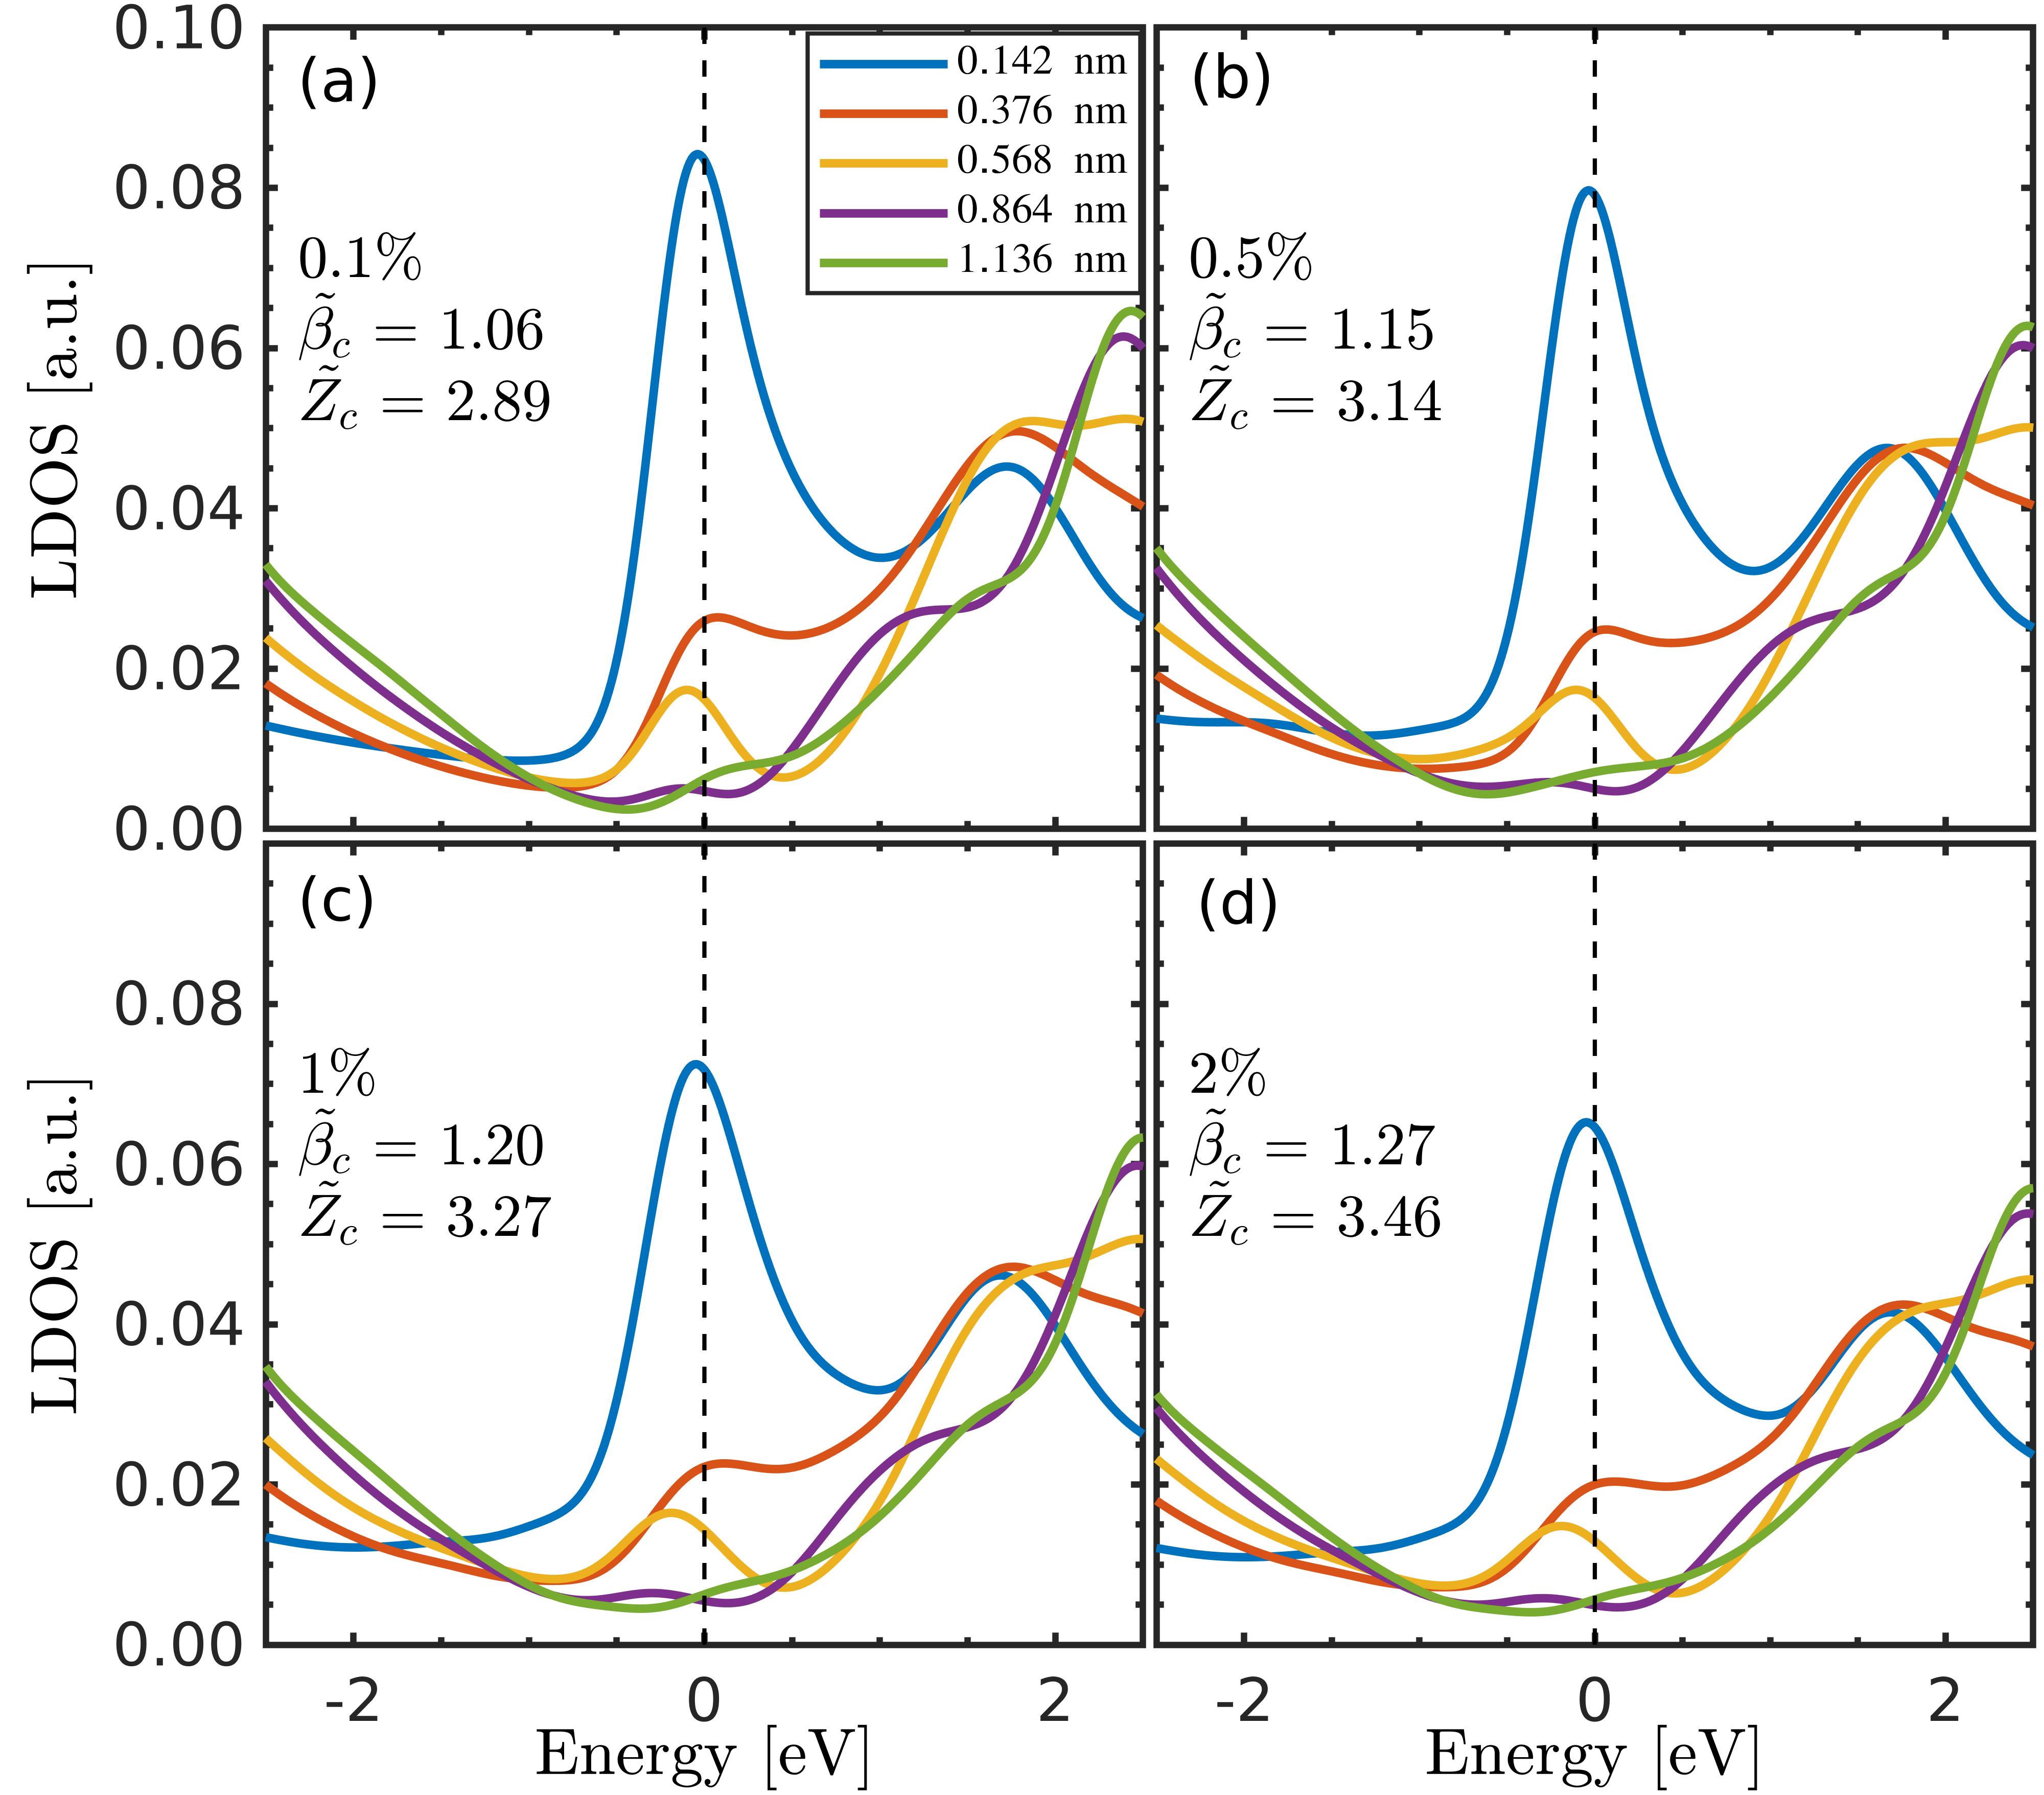
These families transit from above to the edge of the DP at different which is evident in Fig. 2(a)-(d). The critical coupling constant gradually increases in proportion to the defect densities and reaches = 1.27 for random dilution at 2 [see Fig. 2(d)]. Actually, these defects are ubiquitous in the crystal structure eckmann2012probing . For example, the Raman spectrum has 0.5 G–to–2D intensity ratio for the high-quality graphene monolayer grown by chemical vapor deposition (CVD) li2009large , and this ratio indicates that there is a finite defect density in graphene. As is clear from our numerical results, these structural peculiarities can cause an increase in the critical threshold. On the other hand, the spectral shapes of all QBS families are the same as of the defect-free case, especially in the vicinity of the impurity. It can be inferred that atomic collapse can be similarly observed in the imperfect lattices with the help of a higher valance charge.
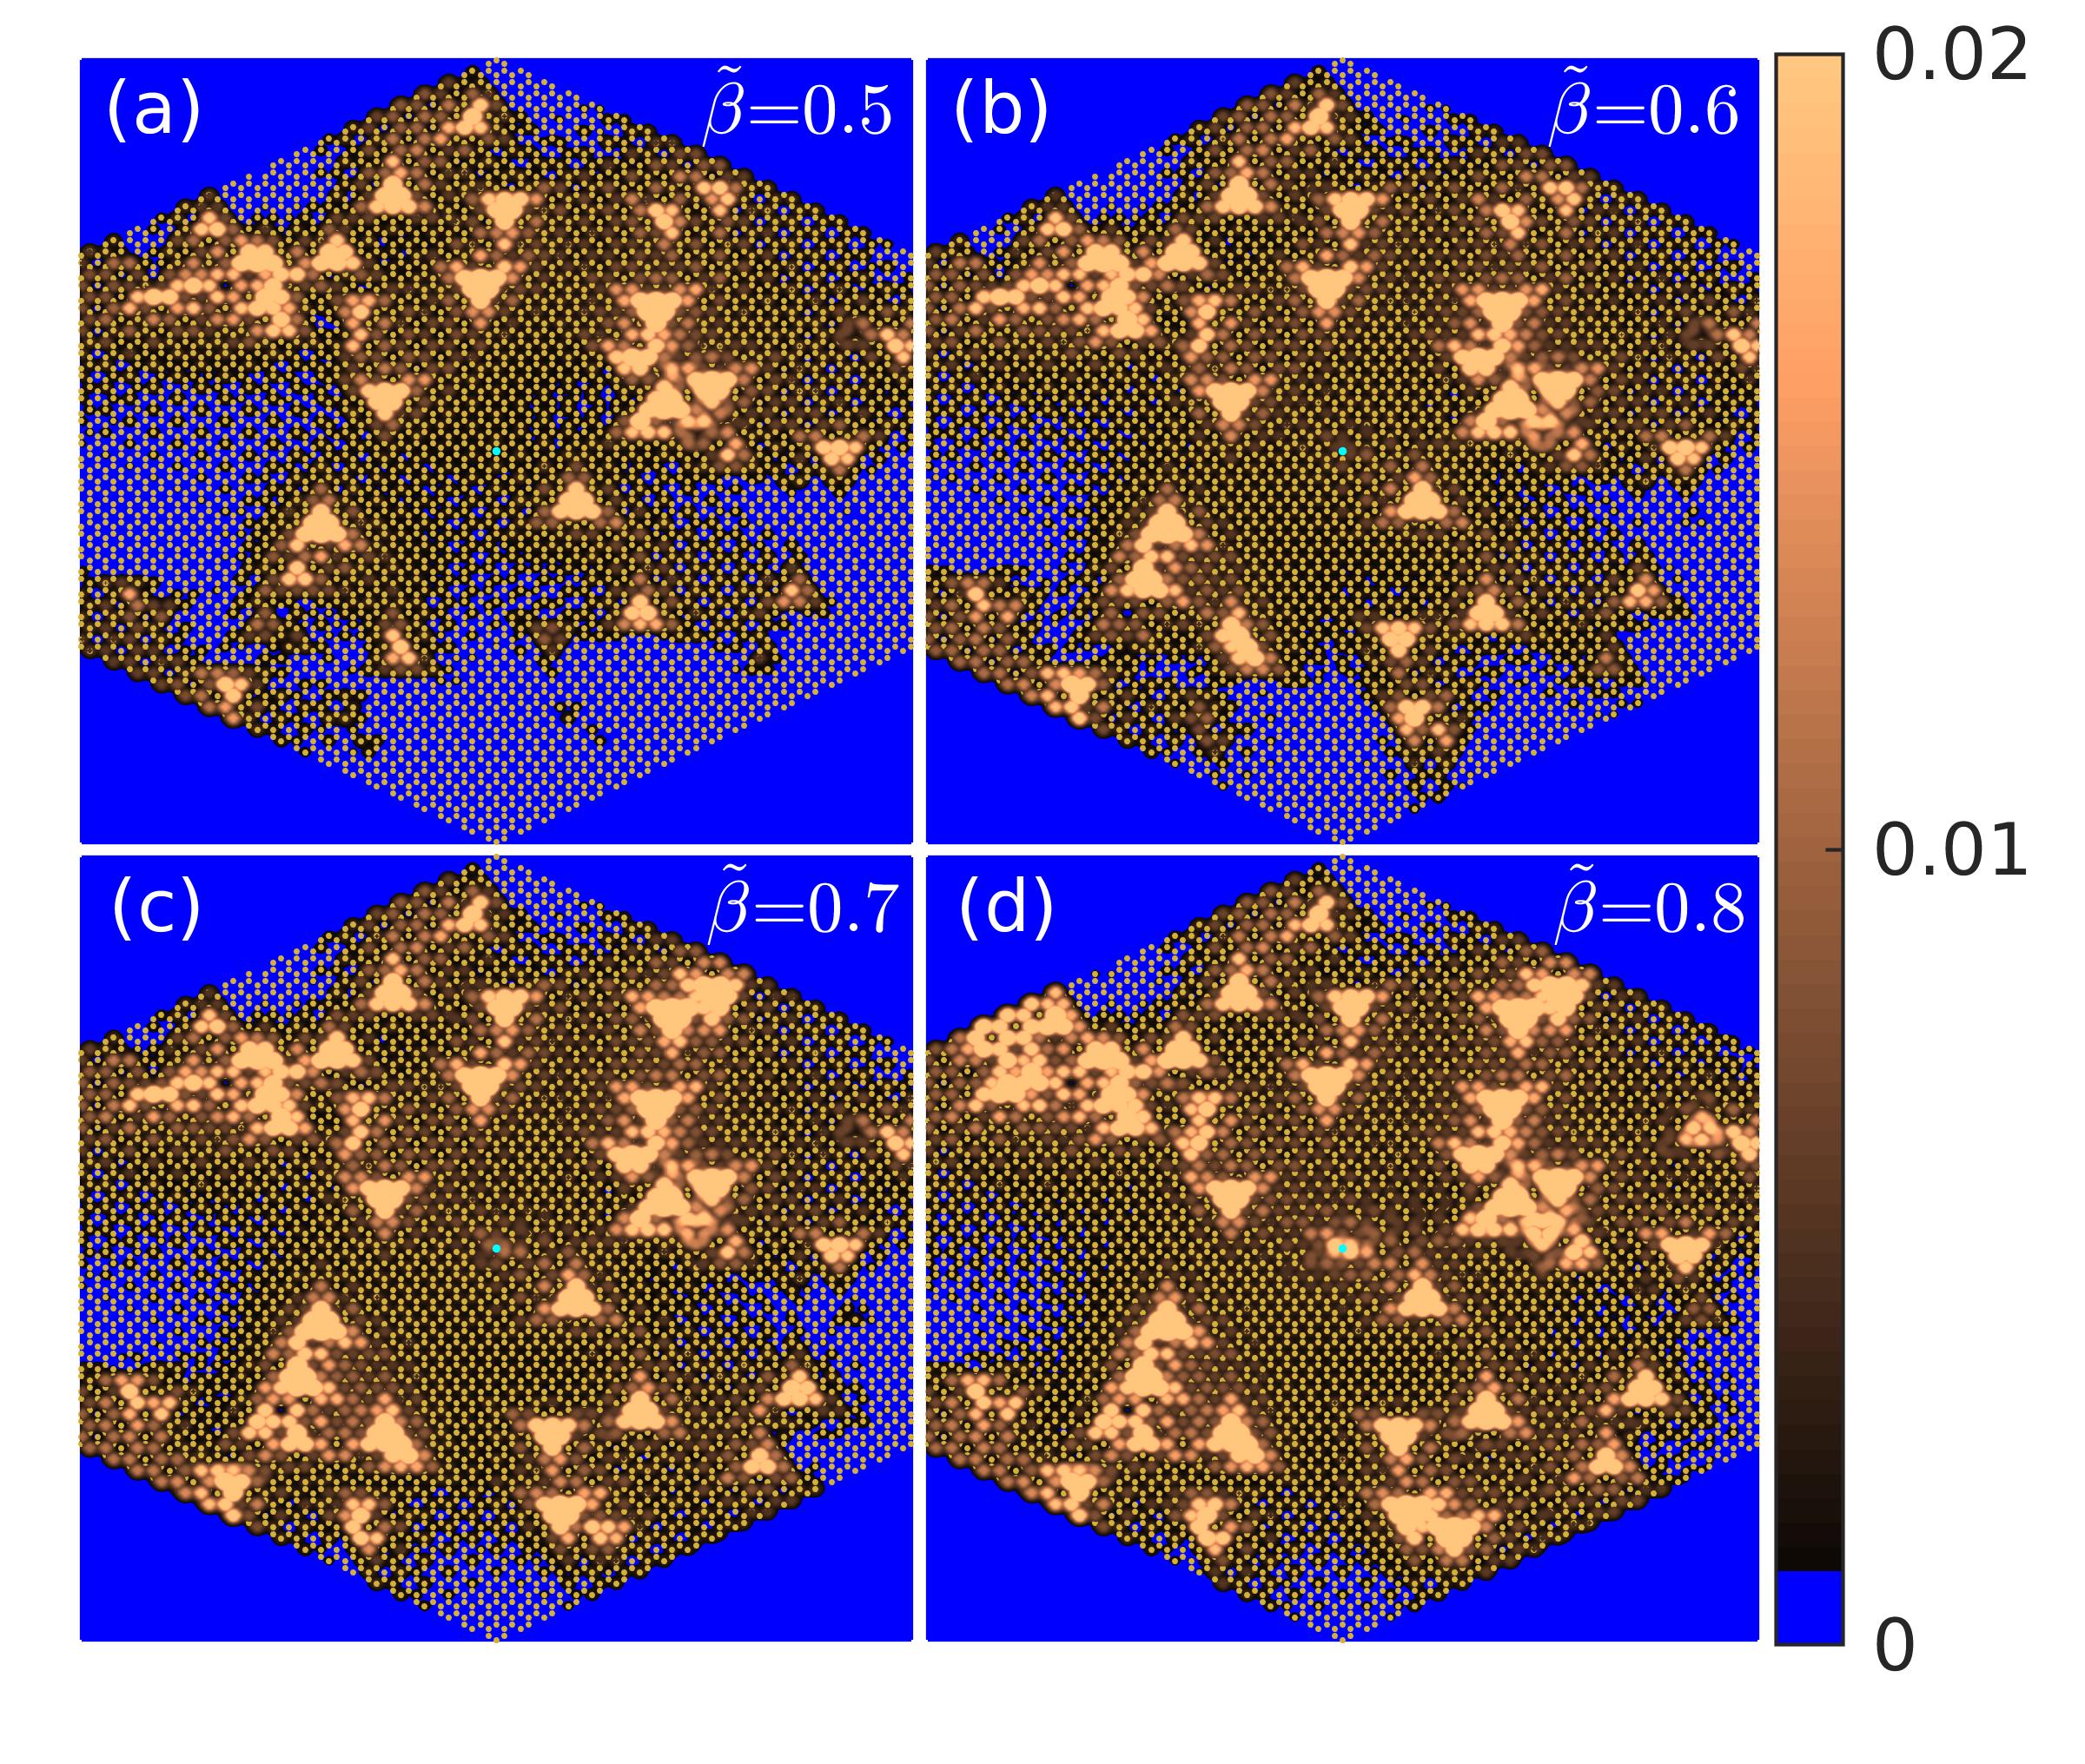
In the half-filled Hubbard model, the lowest energy states in the conduction band are unoccupied vacancy-induced states whose energies are between 0 eV0.4 eV for 1 defect concentration [see the global DOS in the inset of Fig. 1(c)]. As is increased, these states successively dive into the negative energies. However, there is no explicit crossing from the higher energy conduction states within the energy spectrums. Therefore, of particular interest are these merging states below the DP, and the total probability density of them is calculated by p(r) = in which both spin components are included. For a representative sample, p(r) is projected into the space at different coupling constants, ranging from = 0.5 up to = 0.8. Fig. 3(a)-(d) clearly show that whenever defect states dive just below the DP, they are localized around the missing atoms by preserving their characteristic triangular shapes and then demonstrate a striking stability against the Coulomb impurity. On the other hand, the weight of probability density around the impurity progressively increases, but there is no formation of the first supercritical state at = 0.5 nor at = 0.6, which are the critical coupling constants of the 1S1/2 state for the non-interacting shytov2007atomic and interacting polat2020collapse fermions in a clean vacuum, respectively. Finally, the 1S1/2 state textt comes into appearance at = 0.8, despite not being a direct contribution of the bulk states to p(r). Such a formation of the 1S1/2 state is presumably due only to the hybridized components of the diving defect states, and the defect-induced increases in Fig. 2(a)-(d) actually originate from the formation mechanism of the 1S1/2 state.
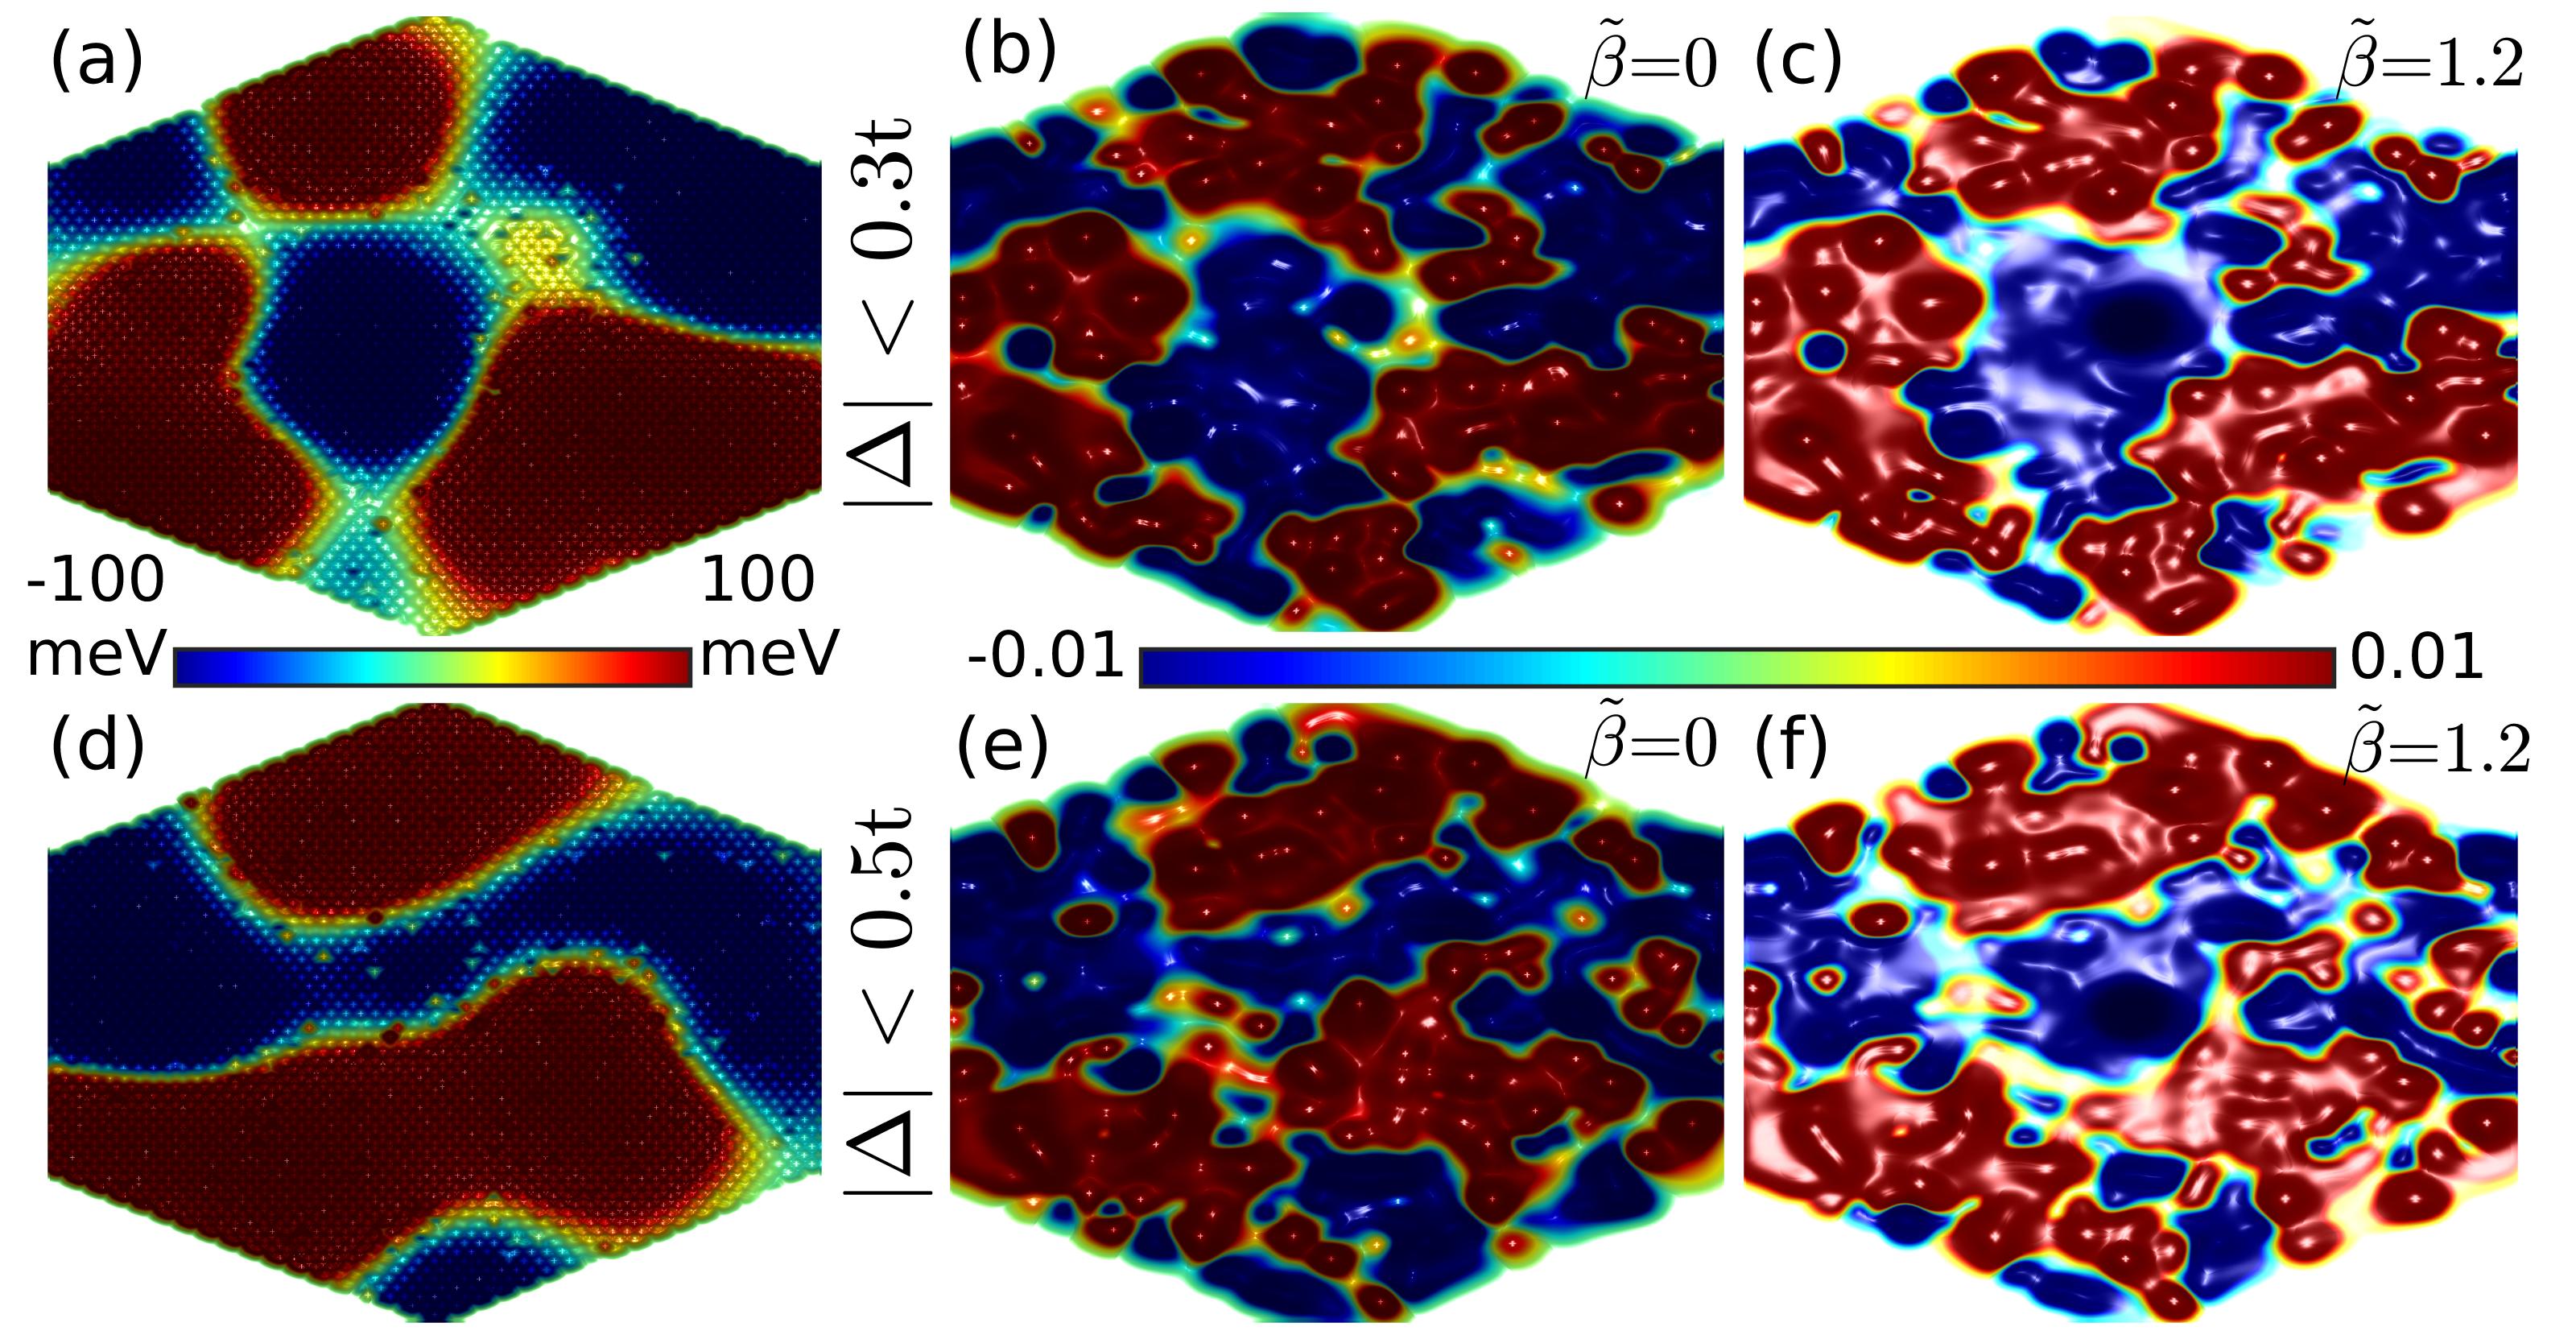
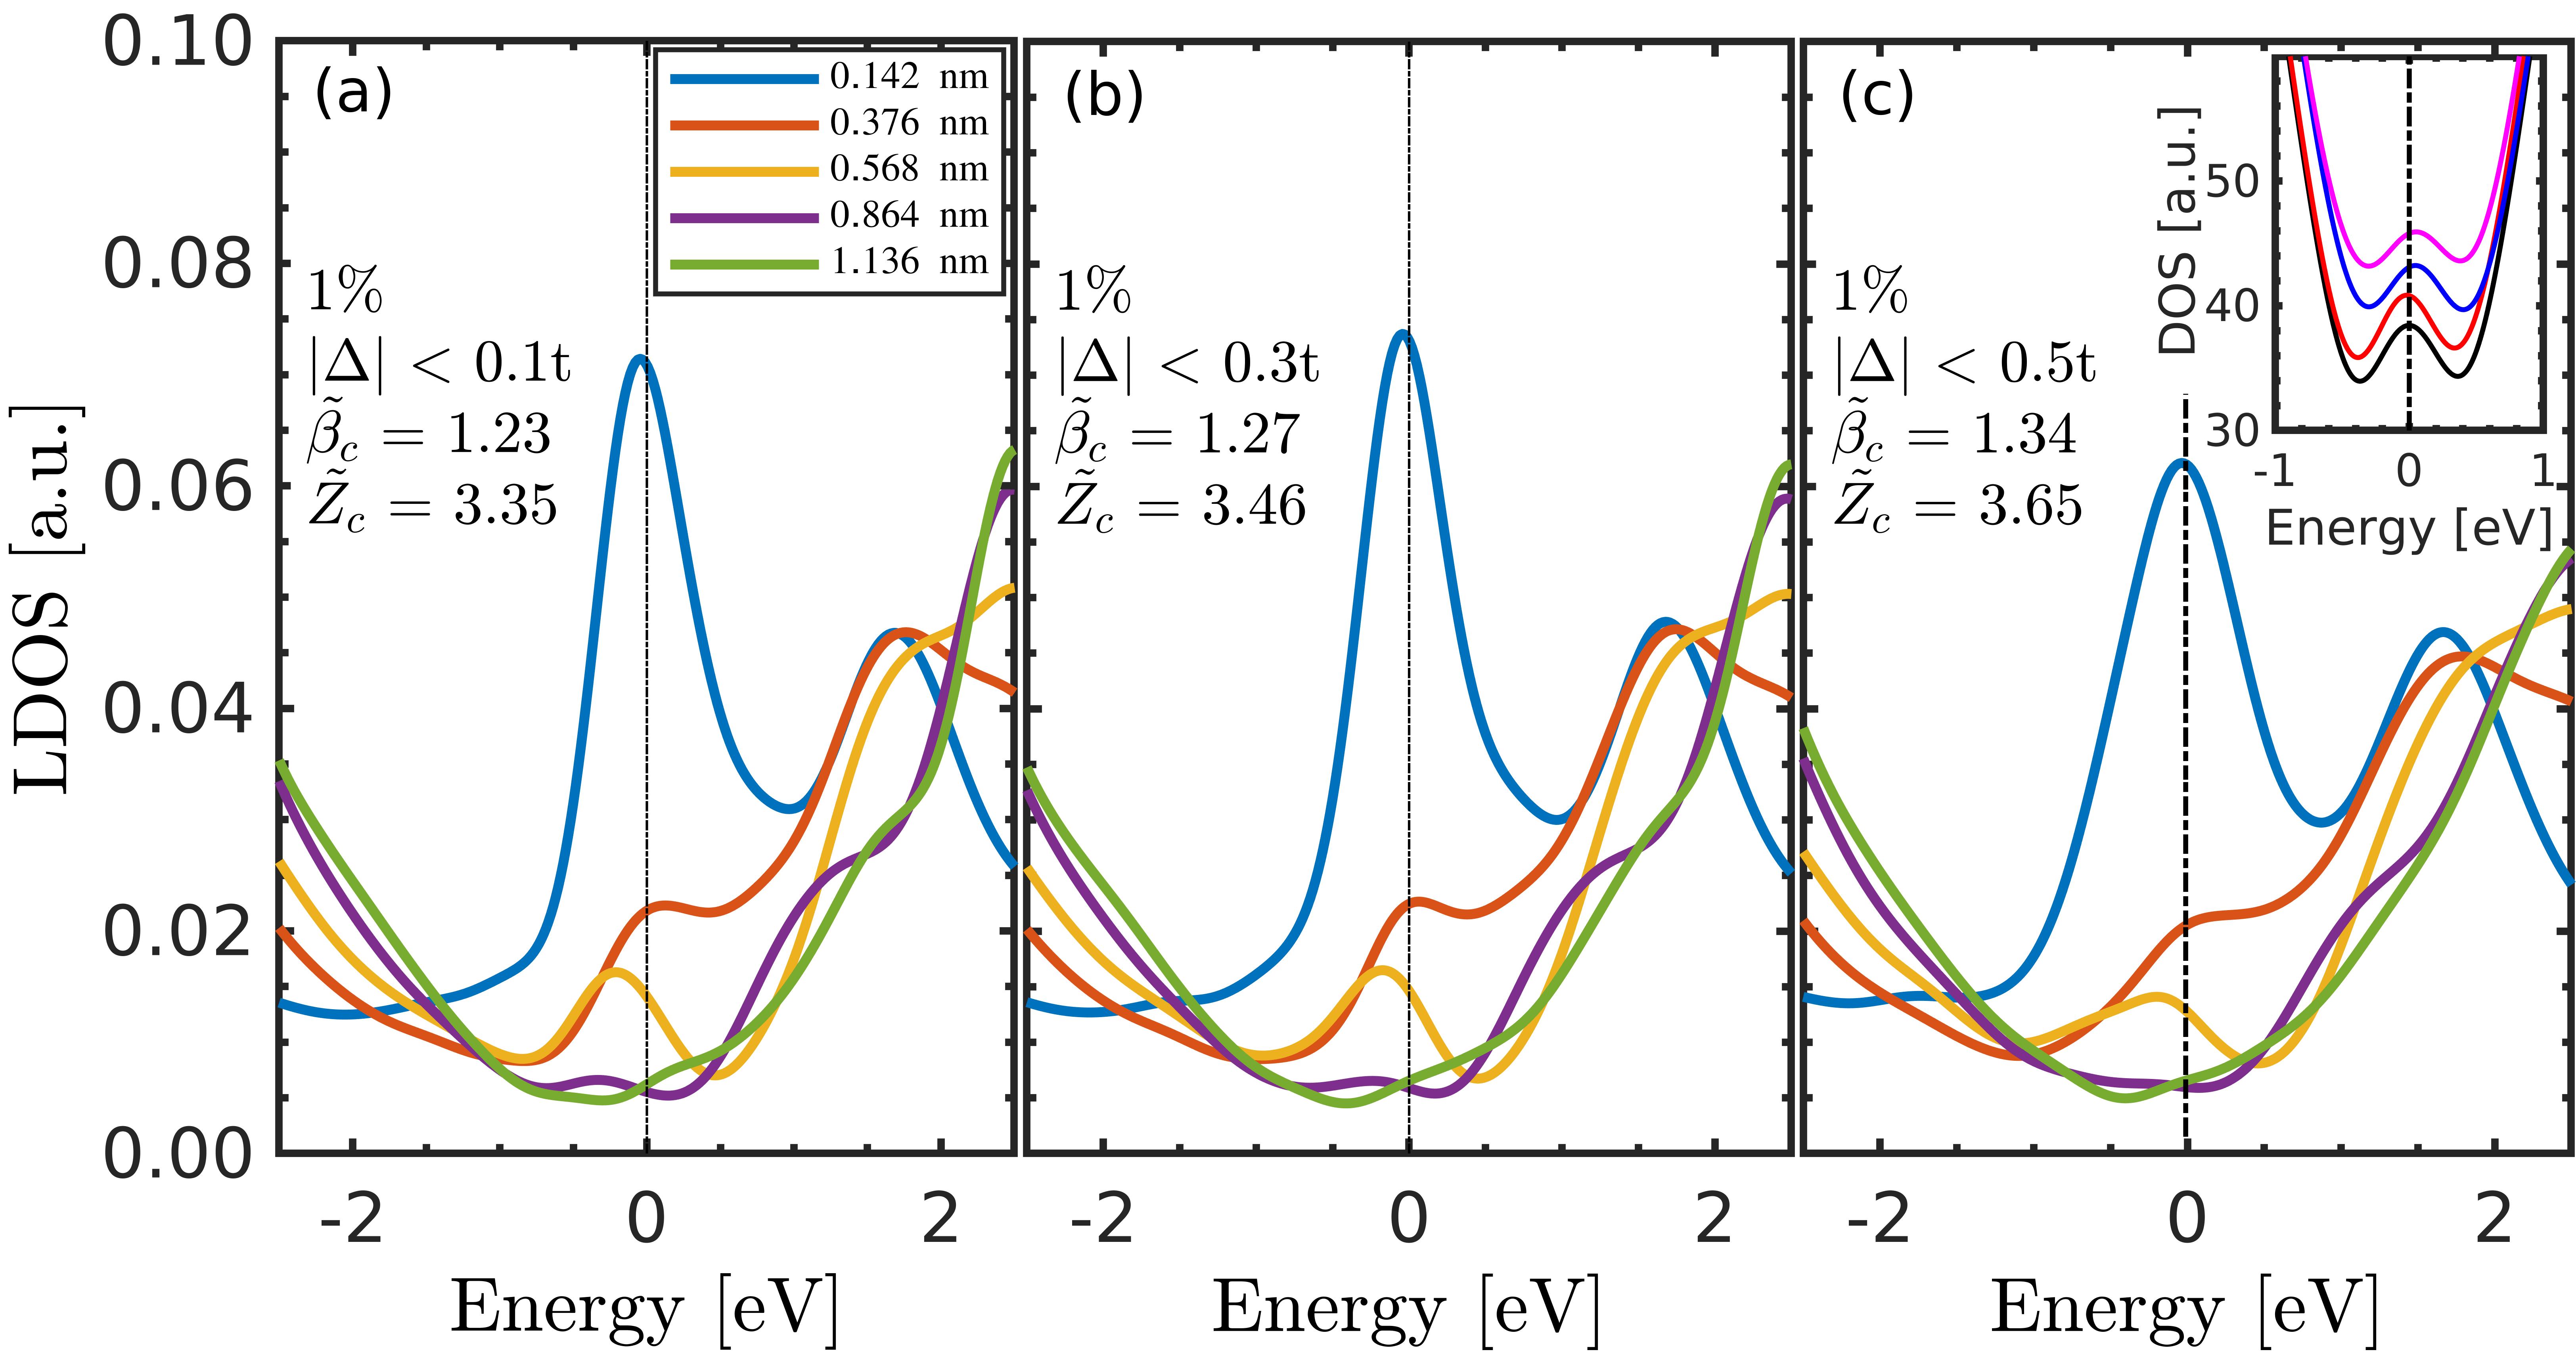
Prior to the collapse experiments wang2012mapping ; wang2013observing ; mao2016realization ; wong2017spatially , monolayer graphene is grown by CVD and then is transferred onto a hBN flake placed on a SiO2/Si substrate. To model the spatial potential fluctuations caused by such a substrate, we randomly distributed Gaussian impurities for the set of vacuum disordered by 1 concentration of carbon vacancies. The averaged potential landscapes of 0.3t and 0.5t are shown in Fig. 4(a) and Fig. 4(d), respectively. The resulting electron-hole puddles of both spin components show that the electron puddles (red) appear in the positive potential regions, whereas the hole puddles (blue) manifest themselves in the negative potential regions as can be seen in Fig. 4(b) for 0.3t and Fig. 4(e) for 0.5t. As is turned on, the charge inhomogeneities rearrange themselves under the effect of the Coulomb potential. For example, at = 1.2, the electron-hole puddles of 0.3t and those of 0.5t are mapped in Fig. 4(c) and Fig. 4(f), respectively. Even if there is no significant change in the positions of the hole puddles formed at the distances away from the center, those close to the center leave their positions and are centered around the stronger Coulomb impurity. As will be seen below, such a reformation has a significant effect on the critical threshold.
LDOS spectra in Fig. 5(a)-(c) are calculated for the spin-up QBS family at the corresponding radial distances, starting from the impurity site. When the positive and negative Gaussian impurities are distributed evenly, the total DOS of the spin-up fermions at = 0 clearly reveal that the FL is again around the energy origin for these configurations; see the inset in Fig. 5(c). There is no significant shift in the minimum energy point at = 0, allowing us to take the energy origin as the DP for the non-zero values of . Similar to the previous cases, whenever the sharp peak enters the negative energy spectrum, then atomic collapse has occurred. The addition of Gaussian impurities causes to an increase in the critical threshold from = 1.20 [Fig. 2(c)] up to = 1.34 [Fig. 5(c)], and the critical valance charge is estimated to be as high as = 3.65. In addition, we also study the point defect-free GQD consisting of 5514 atoms for ten random distributions of 0.5t, and the critical threshold reaches to = 1.10 (not shown here), which is = 1.0 [Fig. 1(a)] in its clean case. It can be noted that the increments in the critical threshold are independent of the sign of the substrate-induced potential where the Coulomb impurity is placed and are directly proportional to the strengths of Gaussian impurities. As a result, seems to be highly influenced by the disorders within the vacuum itself.
In bulk graphene, a series of LDOS measurements performed by a STM reveals that a cluster, composed of four calcium dimers in the charge state of +1, is needed to form an infinite family of QBS at just above the DP [see Fig. 1(D) in Ref. wang2013observing ]. Therefore, the critical bare valance charge should be slightly greater than 4 in the experiment. Accordingly, the calculated values of are approaching to that of the experiment, and adding these experimentally relevant factors to the Coulomb impurity problem opens a new route towards such experimental results wang2012mapping ; wang2013observing . These findings can be useful in interpreting the experimental results of positively charged Coulomb impurities, even if they exceed the theoretical critical value. Results of this paper can be tested via Ar+ ion bombarded lucchese2010quantifying , He+ ion irradiated chen2009defect , and hydrogenated bostwick2009quasiparticle graphene. The latter can be achieved by transferring CVD graphene samples at different H coverages bostwick2009quasiparticle onto a hBN/SiO2/Si device, which facilities to control bias and back-gate voltages. Impurities such as cobalt trimmers wang2012mapping and calcium dimers wang2013observing ; wong2017spatially can be gathered in a defect-rich region by atomic manipulation of them with the help of STM, and an artificial supercritical atom can be created from these subcritical impurities. Once the DP has been determined, LDOS spectra can be measured at different radial or lateral distances. There should be an increase in the critical threshold due to the partial removal of the states depending on the concentration of H.
Acknowledgements.
This work was supported by The Scientific and Technological Research Council of Turkey (TUBITAK) under 1001 Grant Project No. 116F152.References
- (1) J. Reinhardt and W. Greiner, Rep. Prog. Phys. 40, 219 (1977).
- (2) W. Greiner, Relativistic Quantum Mechanics (Springer, New York, 2000).
- (3) T. Cowan, H. Backe, M. Begemann, K. Bethge, H. Bokemeyer, H. Folger, J. Greenberg, H. Grein, A. Gruppe, Y. Kido, et al., Phys. Rev. Lett. 54, 1761 (1985).
- (4) V. M. Pereira, J. Nilsson, and A. C. Neto, Phys. Rev. Lett. 99, 166802 (2007).
- (5) A. Shytov, M. Katsnelson, and L. Levitov, Phys. Rev. Lett. 99, 246802 (2007).
- (6) Y. Wang, V. W. Brar, A. V. Shytov, Q. Wu, W. Regan, H.-Z. Tsai, A. Zettl, L. S. Levitov, and M. F. Crommie, Nat. Phys. 8, 653 (2012).
- (7) Y. Wang, D. Wong, A. V. Shytov, V. W. Brar, S. Choi, Q. Wu, H.-Z. Tsai, W. Regan, A. Zettl, R. K. Kawakami, et al., Science 340, 734 (2013).
- (8) J. Mao, Y. Jiang, D. Moldovan, G. Li, K. Watanabe, T. Taniguchi, M. R. Masir, F. M. Peeters, and E. Y. Andrei, Nat. Phys. 12, 545 (2016).
- (9) D. Wong, F. Corsetti, Y. Wang, V. W. Brar, H.-Z. Tsai, Q. Wu, R. K. Kawakami, A. Zettl, A. A. Mostofi, J. Lischner, et al., Phys. Rev. B 95, 205419 (2017).
- (10) J. Lu, H.-Z. Tsai, A. N. Tatan, S. Wickenburg, A. A. Omrani, D. Wong, A. Riss, E. Piatti, K. Watanabe, T. Taniguchi, et al, Nat. Commun. 10, 1 (2019).
- (11) A. C. Neto, F. Guinea, N. M. Peres, K. S. Novoselov, and A. K. Geim, Rev. Mod. Phys. 81, 109 (2009).
- (12) R. Van Pottelberge, M. Zarenia, P. Vasilopoulos, and F. Peeters, Phys. Rev. B 95, 245410 (2017).
- (13) M. Polat, H. Sevinçli, and A. D. Güçlü, Phys. Rev. B 101, 205429 (2020).
- (14) R. R. Biswas, S. Sachdev, and D. T. Son, Phys. Rev. B 76, 205122 (2007).
- (15) I. S. Terekhov, A. I. Milstein, V. N. Kotov, and O. P. Sushkov, Phys. Rev. Lett. 100, 076803 (2008).
- (16) A. Hashimoto, K. Suenaga, A. Gloter, K. Urita, and S. Iijima, Nature 430, 870 (2004).
- (17) J. Martin, N. Akerman, G. Ulbricht, T. Lohmann, J. v. Smet, K. Von Klitzing, and A. Yacoby, Nat. Phys. 4, 144 (2008).
- (18) J. C. Meyer, C. Kisielowski, R. Erni, M. D. Rossell, M. Crommie, and A. Zettl, Nano Lett. 8,3582 (2008).
- (19) F. Banhart, J. Kotakoski, and A. V. Krasheninnikov, ACS Nano 5, 26 (2011).
- (20) K. M. McCreary, A. G. Swartz, W. Han, J. Fabian, and R. K. Kawakami, Phys. Rev. Lett. 109, 186604 (2012).
- (21) W.-X. Wang, Y.-W. Wei, S.-Y. Li, X. Li, X. Wu, J. Feng, and L. He, Phys. Rev. B 97, 085407 (2018).
- (22) K. E. Çakmak, A. Altıntaş, and A. D. Güçlü, Phys. Rev. B 98, 115428 (2018).
- (23) A. Eckmann, A. Felten, A. Mishchenko, L. Britnell, R. Krupke, K. S. Novoselov, and C. Casiraghi, Nano Lett. 12, 3925 (2012).
- (24) S.-Y. Li, Y.-N. Ren, Y.-W. Liu, M.-X. Chen, H. Jiang, and L. He, 2D Mater. 6, 031005 (2019).
- (25) K. M. Burson, W. G. Cullen, S. Adam, C. R. Dean, K. Watanabe, T. Taniguchi, P. Kim, and M. S. Fuhrer, Nano Lett. 13, 3576 (2013).
- (26) H. U. Özdemir, A. Altıntaş, and A. D. Güçlü, Phys. Rev. B 93, 014415 (2016).
- (27) A. Güçlü, P. Potasz, and P. Hawrylak, Phys. Rev. B 82, 155445 (2010).
- (28) A. D. Güçlü, P. Potasz, M. Korkusinski, and P. Hawrylak, Graphene Quantum Dots (Springer, Berlin, 2014).
- (29) T. Ando, J. Phys. Soc. Jpn. 75, 074716 (2006).
- (30) P. Potasz, A. Güçlü, and P. Hawrylak, Phys. Rev. B 82, 075425 (2010).
- (31) A. Altıntaş and A. D. Güçlü, Solid State Commun. 281, 44 (2018).
- (32) J. H. Bardarson, J. Tworzydło, P. Brouwer, and C. Beenakker, Phys. Rev. Lett. 99, 106801 (2007).
- (33) Y. Zhang, V. W. Brar, C. Girit, A. Zettl, and M. F. Crommie, Nat. Phys. 5, 722 (2009).
- (34) Consider the case with defect concentration, we have ten different samples, each with totally random distributions. For each of these samples, we randomly distribute Gaussian impurities with 0.1t. This is also performed for 0.3t and 0.5t in the presence of defect concentration.
- (35) V. M. Pereira, F. Guinea, J. L. Dos Santos, N. Peres, and A. C. Neto, Phys. Rev. Lett. 96, 036801 (2006).
- (36) V. M. Pereira, J. L. Dos Santos, and A. C. Neto, Phys. Rev. B 77, 115109, (2008).
- (37) E. B. Kul, M. Polat, and A. D. Güçlü, Solid State Commun. 322, 114096, (2020).
- (38) X. Li, W. Cai, J. An, S. Kim, J. Nah, D. Yang, R. Piner, A. Velamakanni, I. Jung, E. Tutuc, et al., Science 324, 1312 (2009).
- (39) Its shape is exactly the same as the 1S1/2 state of the defect-free GQDs (not shown here), and this formation is observed for all samples at around = 0.8 for random dilution at 1.
- (40) M. M. Lucchese, F. Stavale, E. M. Ferreira, C. Vilani, M. V. d. O. Moutinho, R. B. Capaz, C. A. Achete, and A. Jorio, Carbon 48, 1592 (2010).
- (41) J.-H. Chen, W. G. Cullen, C. Jang, M. Fuhrer, and E. D. Williams, Phys. Rev. Lett. 102, 236805 (2009).
- (42) A. Bostwick, J. L. McChesney, K. V. Emtsev, T. Seyller, K. Horn, S. D. Kevan, and E. Rotenberg, Phys. Rev. Lett. 103, 056404 (2009).