Characterization of Temporarily-Captured Minimoon 2020 CD3 by Keck Time-resolved Spectrophotometry
Abstract
We present rotationally-averaged visible spectrophotometry of minimoon 2020 CD3, the second asteroid known to become temporarily captured by the Earth-Moon system’s gravitational field. The spectrophotometry was taken with Keck I/LRIS between wavelengths 434 nm and 912 nm in , , , , and RG850 filters as it was leaving the Earth-Moon system on 2020 March 23 UTC. The broad-band spectrophotometry of 2020 CD3 most closely resembles the spectra of V-type asteroids and some Lunar rock samples with a reddish slope of 18/100 nm between 434 nm and 761 nm corresponding to colors of - = 0.620.08, - = 0.21 0.06 and an absorption band at 900 nm corresponding to - = -0.540.10 (DeMeo et al., 2009; Isaacson et al., 2011). Combining our measured 31.90.1 absolute magnitude with an albedo of 0.35 typical for V-type asteroids (DeMeo & Carry, 2013), we determine 2020 CD3’s size to be 1.00.1 m making it the first minimoon and one of the smallest asteroids to be spectrally characterized. We use our time-series photometry to detect periodic lightcurve variations with a 10-4 false alarm probability corresponding to a lightcurve period of 573 s and a lightcurve amplitude of 1 mag implying 2020 CD3 possesses a axial ratio of 2.5. In addition, we extend the observational arc of 2020 CD3 to 37 days between 2020 February 15 UTC and 2020 March 23 UTC. From the improved orbital solution for 2020 CD3, we estimate its likely duration of its capture to be 2 y, and we measure the non-gravitation perturbation on its orbit due to radiation pressure with an area-to-mass ratio of 6.92.410-4 m2/kg implying a density of 2.10.7 g/cm3, broadly compatible with the densities of other meter-scale asteroids (e.g., Micheli et al., 2012; Mommert et al., 2014) and Lunar rock (2.4 g/cm Kiefer et al., 2012). We searched for pre-discovery observations of 2020 CD3 in the ZTF archive as far back as 2018 October (Masci et al., 2019), but were unable to locate any positive detections.
1 Introduction
Asteroid population models predict that out of 109 asteroids larger than 1 m in the steady-state near-Earth object (NEO) population (Harris & D’Abramo, 2015; Schunová-Lilly et al., 2017) a small fraction, 10-7, become temporarily captured by the Earth-Moon system’s gravity every year (Granvik et al., 2012; Jedicke et al., 2018). These temporary natural satellites, or what we call “minimoons” have pre-capture orbital trajectories similar to the Earth which allow them to encounter the Earth at relatively low 1 km/s speeds assisting them in their capture. However, the captured status of the minimoon is temporary due to its interaction with the gravity of the Sun and the Earth-Moon system and other massive Solar System bodies, with the vast majority of minimoons only being gravitationally-bound the Earth-Moon system for 70- 280 days (Fedorets et al., 2017). Since they originate from the NEO population, the Earth-Moon system has a steady-state of temporarily captured minimoons with 1-2 being in orbit around the Earth at any given time with diameter 1 m. Out of 22,000 NEOs currently known111https://minorplanetcenter.net/iau/TheIndex.html, only 5 known NEOs are in the 1 m range. Thus, due to their frequency of capture and small size, minimoons, therefore, provide the opportunity to study the smallest and most incomplete portion of the NEO population (Granvik et al., 2018). Also because of their low velocities relative to the Earth, minimoons provide excellent targets for human exploration missions (Elvis et al., 2011; Granvik, 2013; Chyba et al., 2014).
Asteroids on quasi-satellite orbits that are strongly affected by the gravitational influence of the Earth-Moon system but are not gravitationally captured have been observed before, such as 2013 LX28 and (469219) Kamo‘oalewa (Sidorenko et al., 2014; de la Fuente Marcos & de la Fuente Marcos, 2016). However, the previously only known example of an asteroid being truly gravitationally captured by the Earth-Moon system was 2006 RH120 discovered by the Catalina Sky Survey in 2006 while it was being captured by the Earth-Moon system’s gravity. This first known minimoon remained in orbit around the Earth for 400 days (Kwiatkowski et al., 2008) and had a diameter of 3 m. Recently, the second known example of a temporarily-captured asteroid was discovered on 2020 February 15 UTC with the Catalina Sky Survey’s 1.5-meter telescope (Pruyne et al., 2020).
At the time of discovery on 2020 February 15 UTC, 2020 CD3 had a highly eccentric geocentrically-bound orbit with a geocentric eccentricity, , of 0.96, a geocentric semi-major axis, , of 3 Lunar distances (LD) or 0.008 au, where 1 LD equals 0.00257 au, and a prograde geocentric inclination of 49∘. The majority of space-debris or satellites of artificial origin are contained within 0.1 LD of the Earth suggesting that the distant geocentric orbit of 2020 CD3 is of natural origin (Tingay et al., 2013). It is possible for artificial objects such as spacecraft boosters to be on more distant geocentric orbits that may have trajectories similar to temporary natural orbits, such as J002E3, a possible Apollo program-era rocket booster (Jorgensen et al., 2003). The Minor Planet Center maintains a list of known spacecraft as well as distant space debris222https://minorplanetcenter.net/iau/artsats/artsats.html, however none of these known spacecraft or distant space debris were associated with the trajectory of 2020 CD3 at the time of its discovery (Pruyne et al., 2020).
While the initial orbit suggests a natural origin, determining the origin from within the Solar System is less clear. As discussed above, NEO population models describe that the minimoon population originates from the Main Belt (Granvik et al., 2017), however, another possible natural origin of minimoons is from Lunar impacts due to the typical low, 1 km ejection speed of Lunar debris (Gladman et al., 1995). The orbits of Lunar debris dynamically decay after a few kyrs, though it is possible that some Lunar ejecta can be re-captured by the Earth-Moon system as minimoons due to their orbital similarity with the Earth just as for minimoons of asteroidal origin (Granvik et al., 2012). However, it is currently unknown from the dynamical circumstances of Lunar debris and temporarily captured asteroids what proportion of minimoons have an origin as the former to the latter.
In this paper, we build on the discovery of 2020 CD3 with ground-based visible observations of 2020 CD3 as an observational test to constrain whether 2020 CD3 is of asteroidal or Lunar debris origin. As we will discuss below, we will use the approach of Bolin et al. (2020) to combine estimation of its taxonomic classification from spectrophotometric observations at different visible wavelengths as well as its physical properties. In addition, we will use the astrometry from our observations of 2020 CD3 to extend the orbital arc and refine the orbit of 2020 CD3 enabling study of its dynamical evolution before, during and after its capture by the Earth-Moon system. The refined orbit enabled by our observations will also serve as an independent constraint on its origin before being captured by the Earth-moon system as well as on its physical properties and origin by comparison with the NEO population model (Morbidelli et al., 2020) and estimation of non-gravitational perturbations on its orbit (Mommert et al., 2014).
2 Observations
We used the 10 m Keck I telescope with the Low Resolution Imaging Spectrometer (LRIS) (Oke et al., 1995; Rockosi et al., 2010) to observe 2020 CD3 on 2020 March 23.545694 UTC to March 23.583322 UTC in imaging mode (Program ID C236, PI M. Fremling). Both the blue camera consisting of a 2 x 2K x 4K Marconi CCD array and the red camera consisting of a science grade Lawrence Berkeley National Laboratory 2K x 4K CCD array were used simultanously. Both cameras have a spatial resolution of 0.135 arcsec/pixel and were used in 2 x 2 binning mode providing an effective resolution element size of 0.27 arcsec providing a field of view of 6′x 7.8′. The 560 nm dichroic with 50 peak transmission was used in combination with the filters ( = 435 nm, FWHM of 91 nm), ( = 474 nm, FWHM of 98 nm), ( = 541 nm, FWHM of 95 nm) filters for the blue camera. The filters ( = 628 nm, FWHM of 119 nm), ( = 760 nm, FWHM of 123 nm) and RG850 ( = 912 nm, FWHM of 128 nm), similar to the SDSS filter ( = 905 nm, FWHM of 137 nm, Fukugita et al., 1996), were used for the red camera in total with the blue camera providing six total resolution elements between 435 nm and 912 nm333https://www2.keck.hawaii.edu/inst/lris/filters.html. Typical exposure times were 120 s which were tracked non-siderally at the the 3″/min motion of 2020 CD3. We rotated filters and used the two cameras simultaneously to limit the effect of rotational variations on photometric measurements. At the time of our observations, 2020 CD3 was located near R.A., Dec. = 14 20 00.3, +33 15 49.7, and had a heliocentric distance, , of 1.0059 au, a geocentric distance, , of 0.0128 au and a phase angle, , of 45.4063∘. During our observations, the sky plane of motion of 2020 CD3 was 2.5 ″/m and had airmass 1.03-1.08.
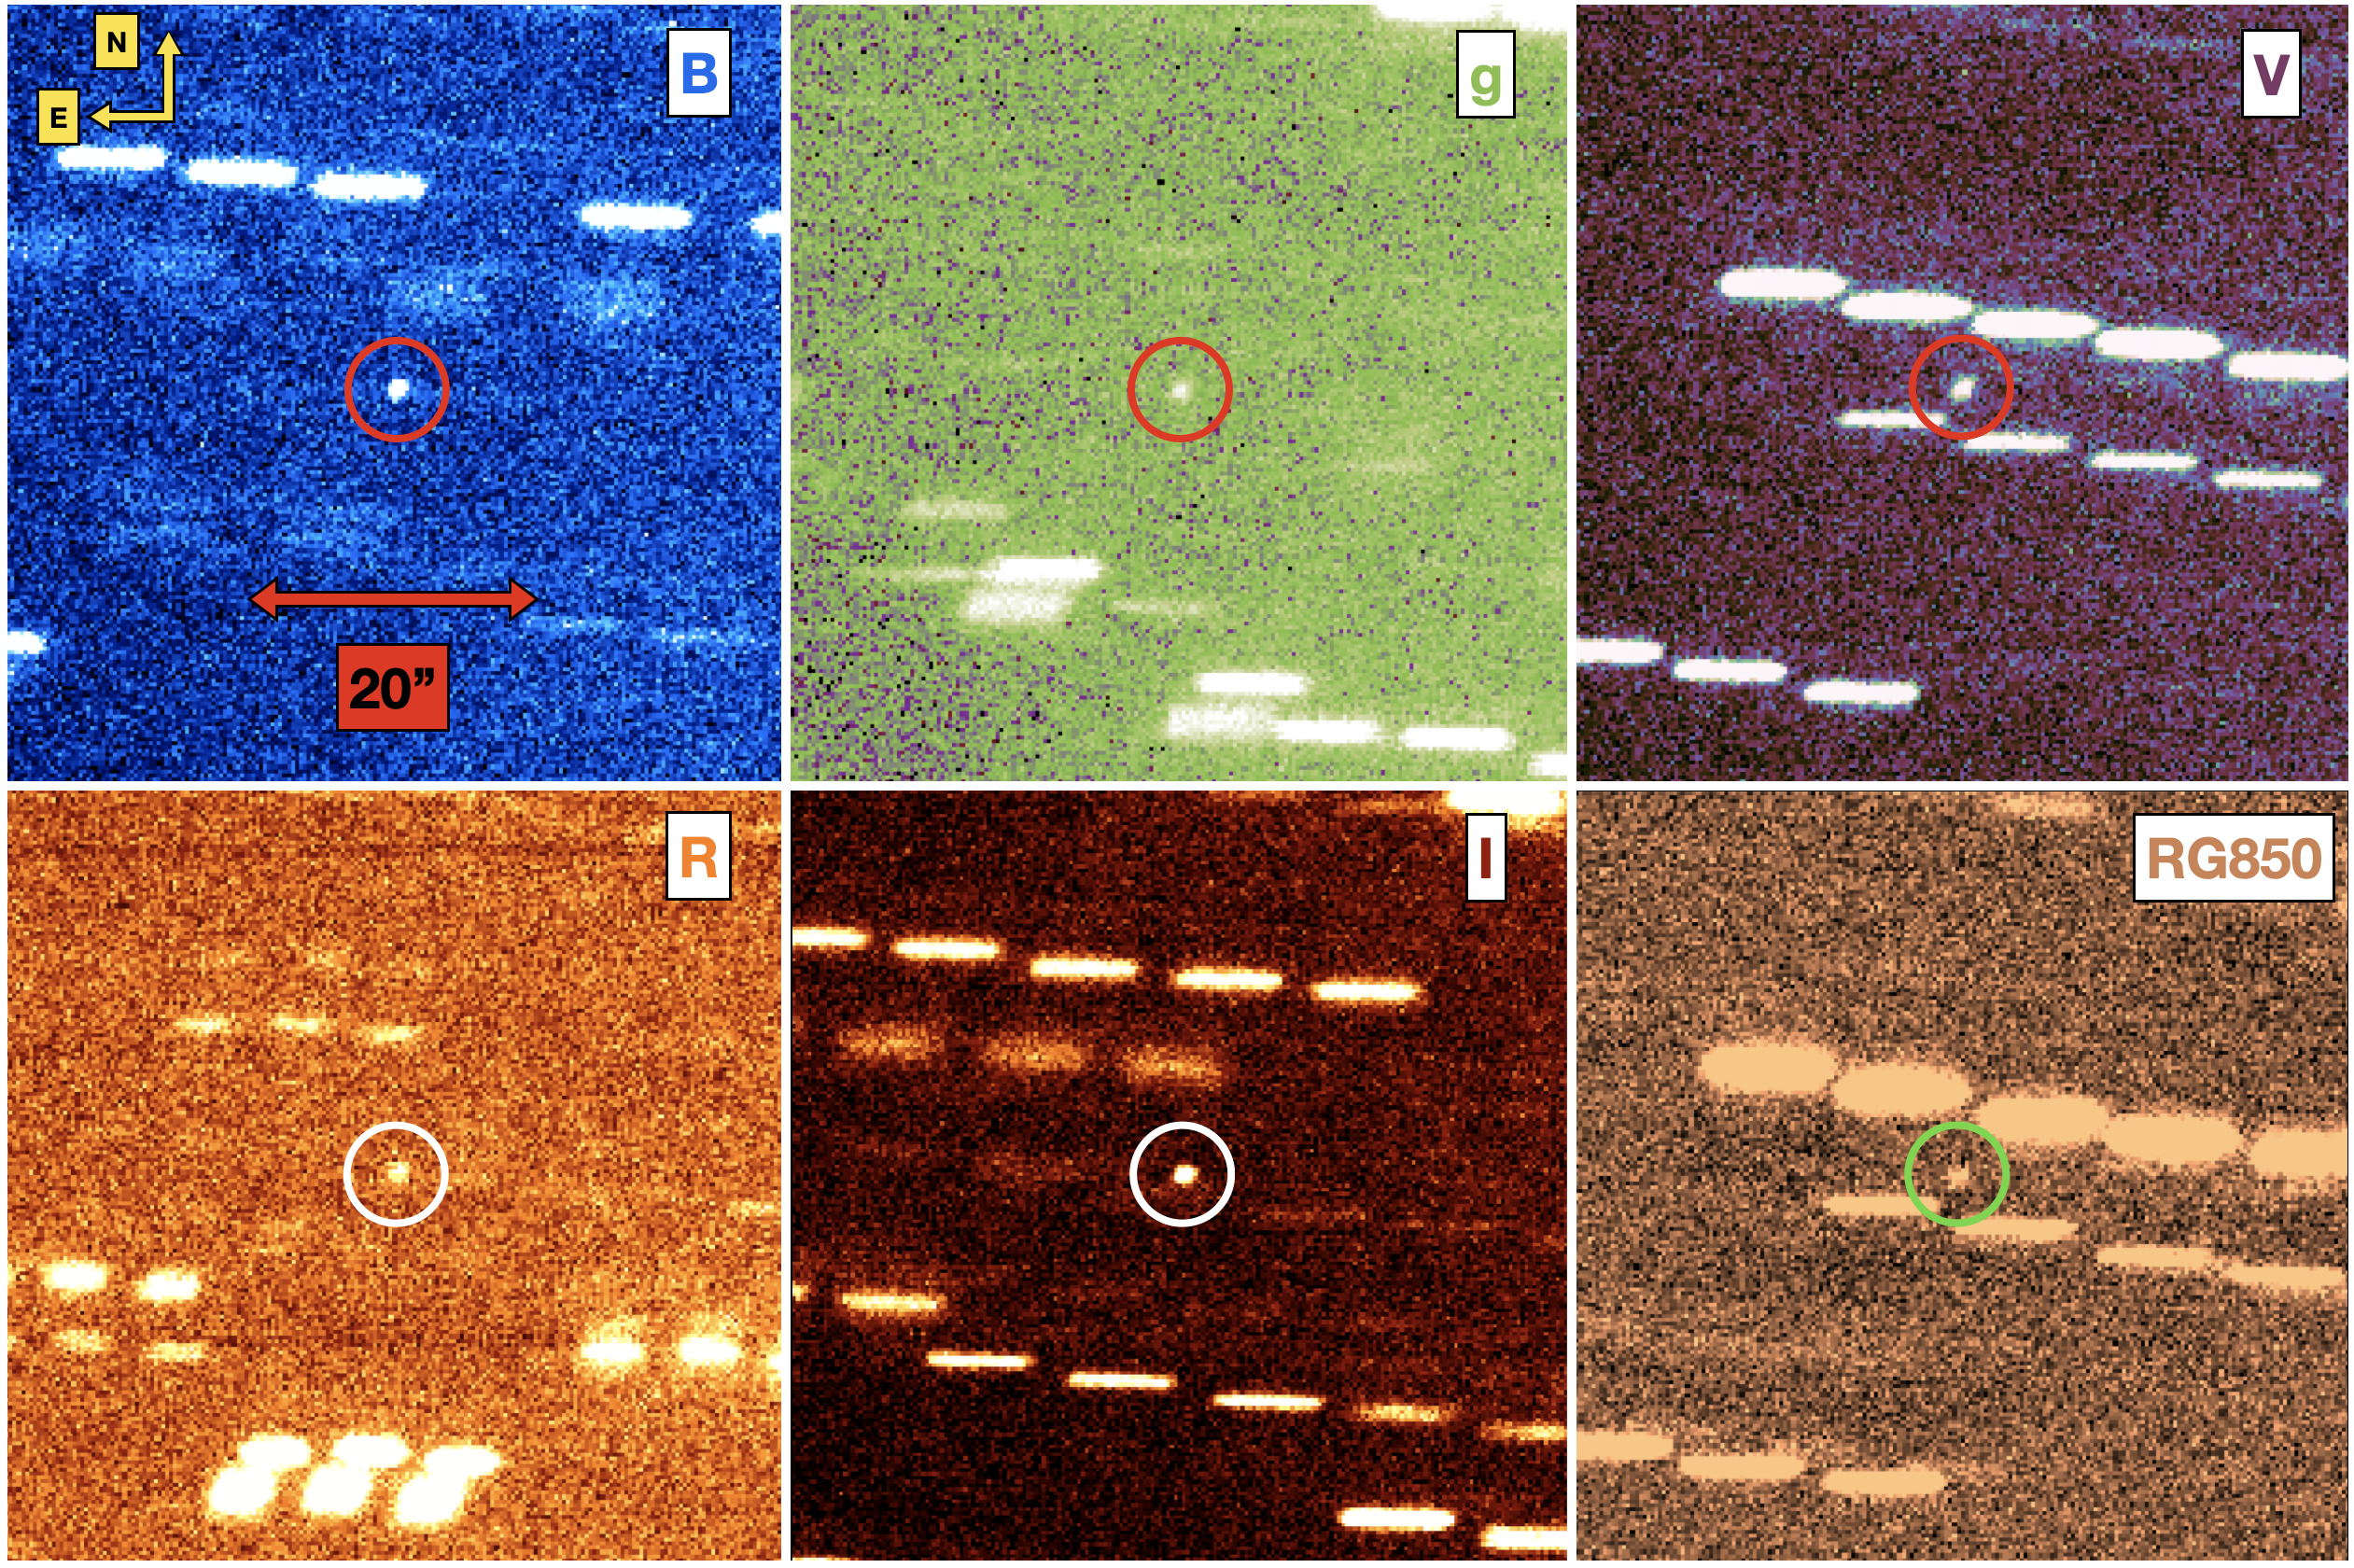
Images were taken of Solar-like calibrator stars in nearby fields as 2020 CD3 were identified using the Pan-STARRS catalog (Chambers et al., 2016; Flewelling et al., 2016). The seeing was 0.5″ and data from the CFHT Sky Probe indicated that the night was photometrically stable with less than 0.01 magnitude variations over the course of our observations444. Bias and flat frames were obtained using the uniform flattening screen inside the Keck dome. The reduction of the imaging data was completed using the LPipe reduction software (Perley, 2019). In total, 5 x 120 s filter, 5 x 120 s Filter, 5 x 120 s filter images, 3 x 30 s, 3 x 60 s filter images, 8 x 120 s filter, and 5 x 120 s RG850 filter exposures were taken. Some images contained field stars near 2020 CD3 which were discarded. The images were median-combined into separate composite stacks for all six filters as shown in the image mosaic in Fig 1.
3 Results
3.1 Photometry and spectral classification
We measured the photometry of 2020 CD3 and the Solar analog stars using a 0.81″ aperture subtracting the median contribution from the sky background within a 2.5-3.5″ annulus. The ,, and Johnson-Cousins and SDSS filter photometry were calibrated using Solar analog stars from the Pan-STARRS catalog Chambers et al. (2016). The Pan-STARRS catalog magnitudes of the Solar analog stars were transformed to Johnson-Cousins and SDSS magnitudes using the conversions from Tonry et al. (2012). We obtain magnitudes = 25.11 0.05, = 24.48 0.05, = 24.21 0.05, = 23.74 0.06 and = 23.31 0.02. In addition, we determine an RG850 magnitude of 23.88 0.09 calibrated by using the equivalent SDSS filter magnitudes determined for our Solar analog from the Pan-STARRS catalog. However, we caution the RG850 and SDSS filters not being exactly alike, therefore our measured uncertainty is likely affected by small systematic differences between the RG850 and SDSS filters and thus serves as a lower limit to its true magnitude.
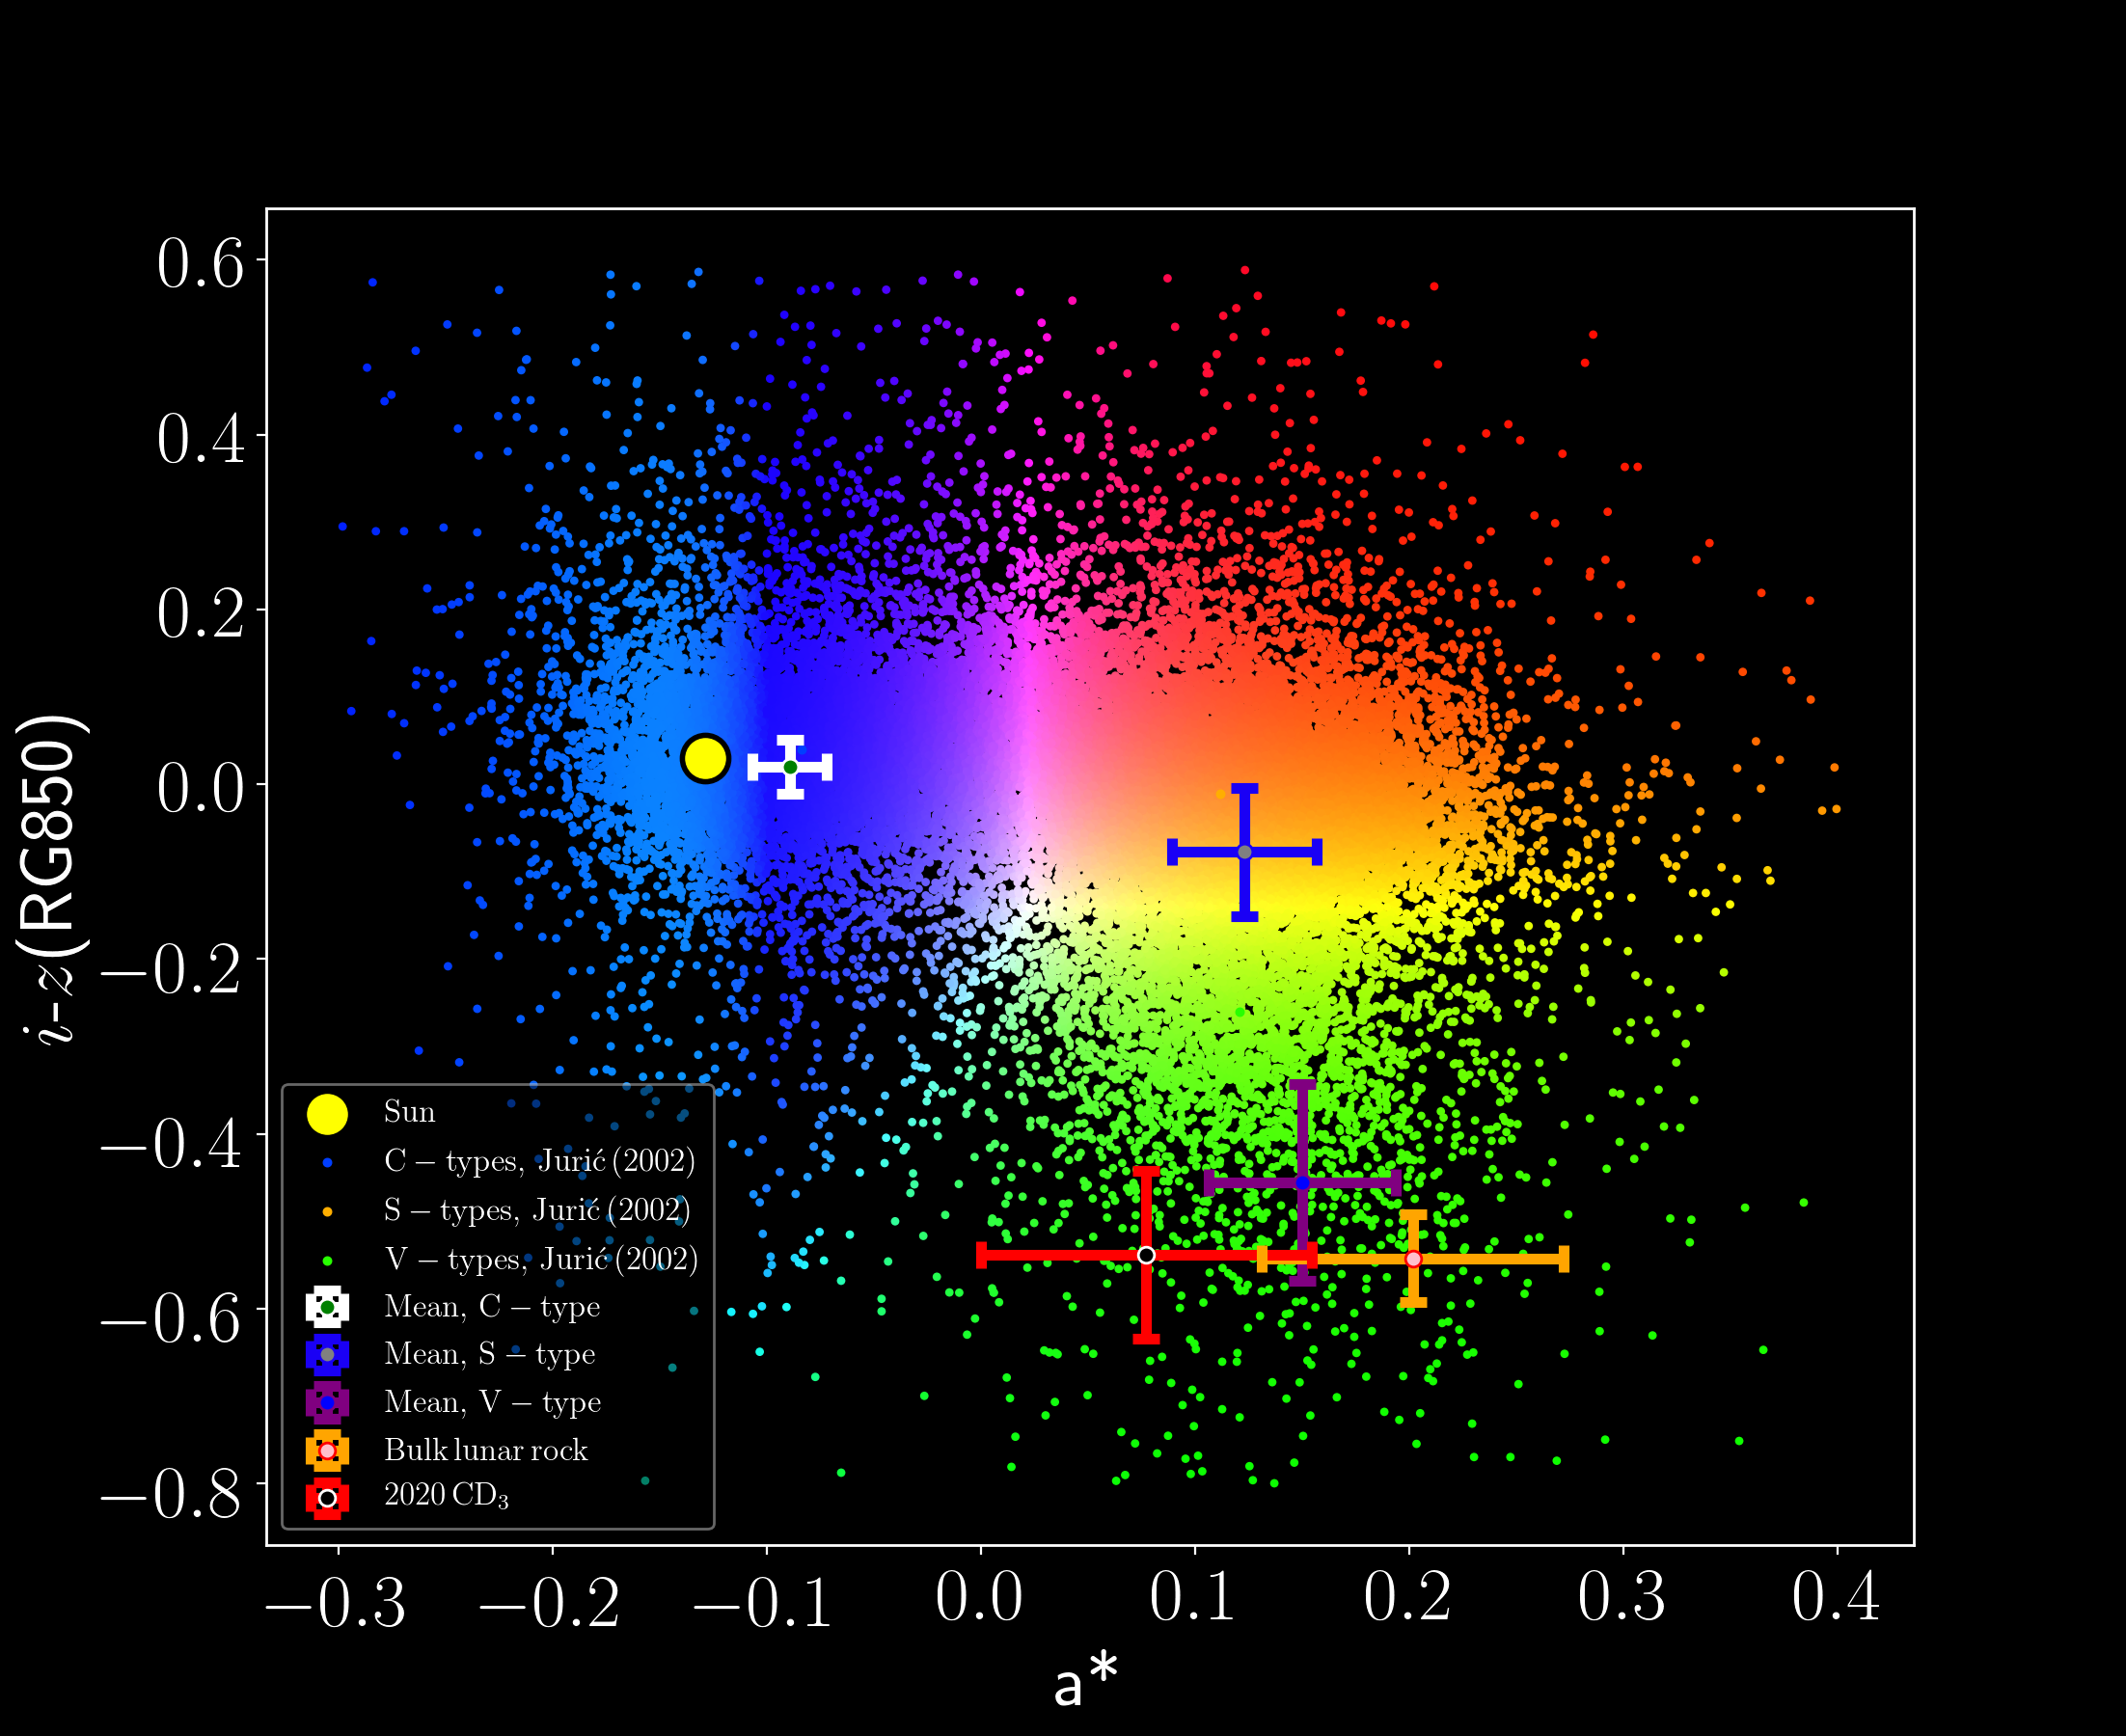
The colors of 2020 CD3 are - = 0.90 0.07, - = -0.27 0.07, - = 0.46 0.08, - = 0.44 0.06. The equivalent colors in SDSS bands are - = 0.62 0.08, - = 0.21 0.06 using the filter transformations from Jordi et al. (2006). In addition, we determine an -RG850 color of -0.54 0.10. The - color of 2020 CD3 is 1.80 0.05 corresponding to a reflective spectral slope between 434 nm and 761 nm of 18/100 nm, indicating a surface significantly redder than the Sun (- = 1.33, Holmberg et al., 2006). In addition, the parameter a∗ = (0.89 (-)) + (0.45 (-)) - 0.57, which is an indicator of reflective spectral slope (Ivezić et al., 2001), is equal to 0.080.08 and is plotted vs. -(RG850) in Fig. 2. Compared to other asteroids, the a∗ = 0.080.08 and -(RG850) = -0.54 0.10 has broad overlap with other V-type asteroids which have on average a∗ = 0.15 0.11 and - = -0.46 0.04, (Jurić et al., 2002).
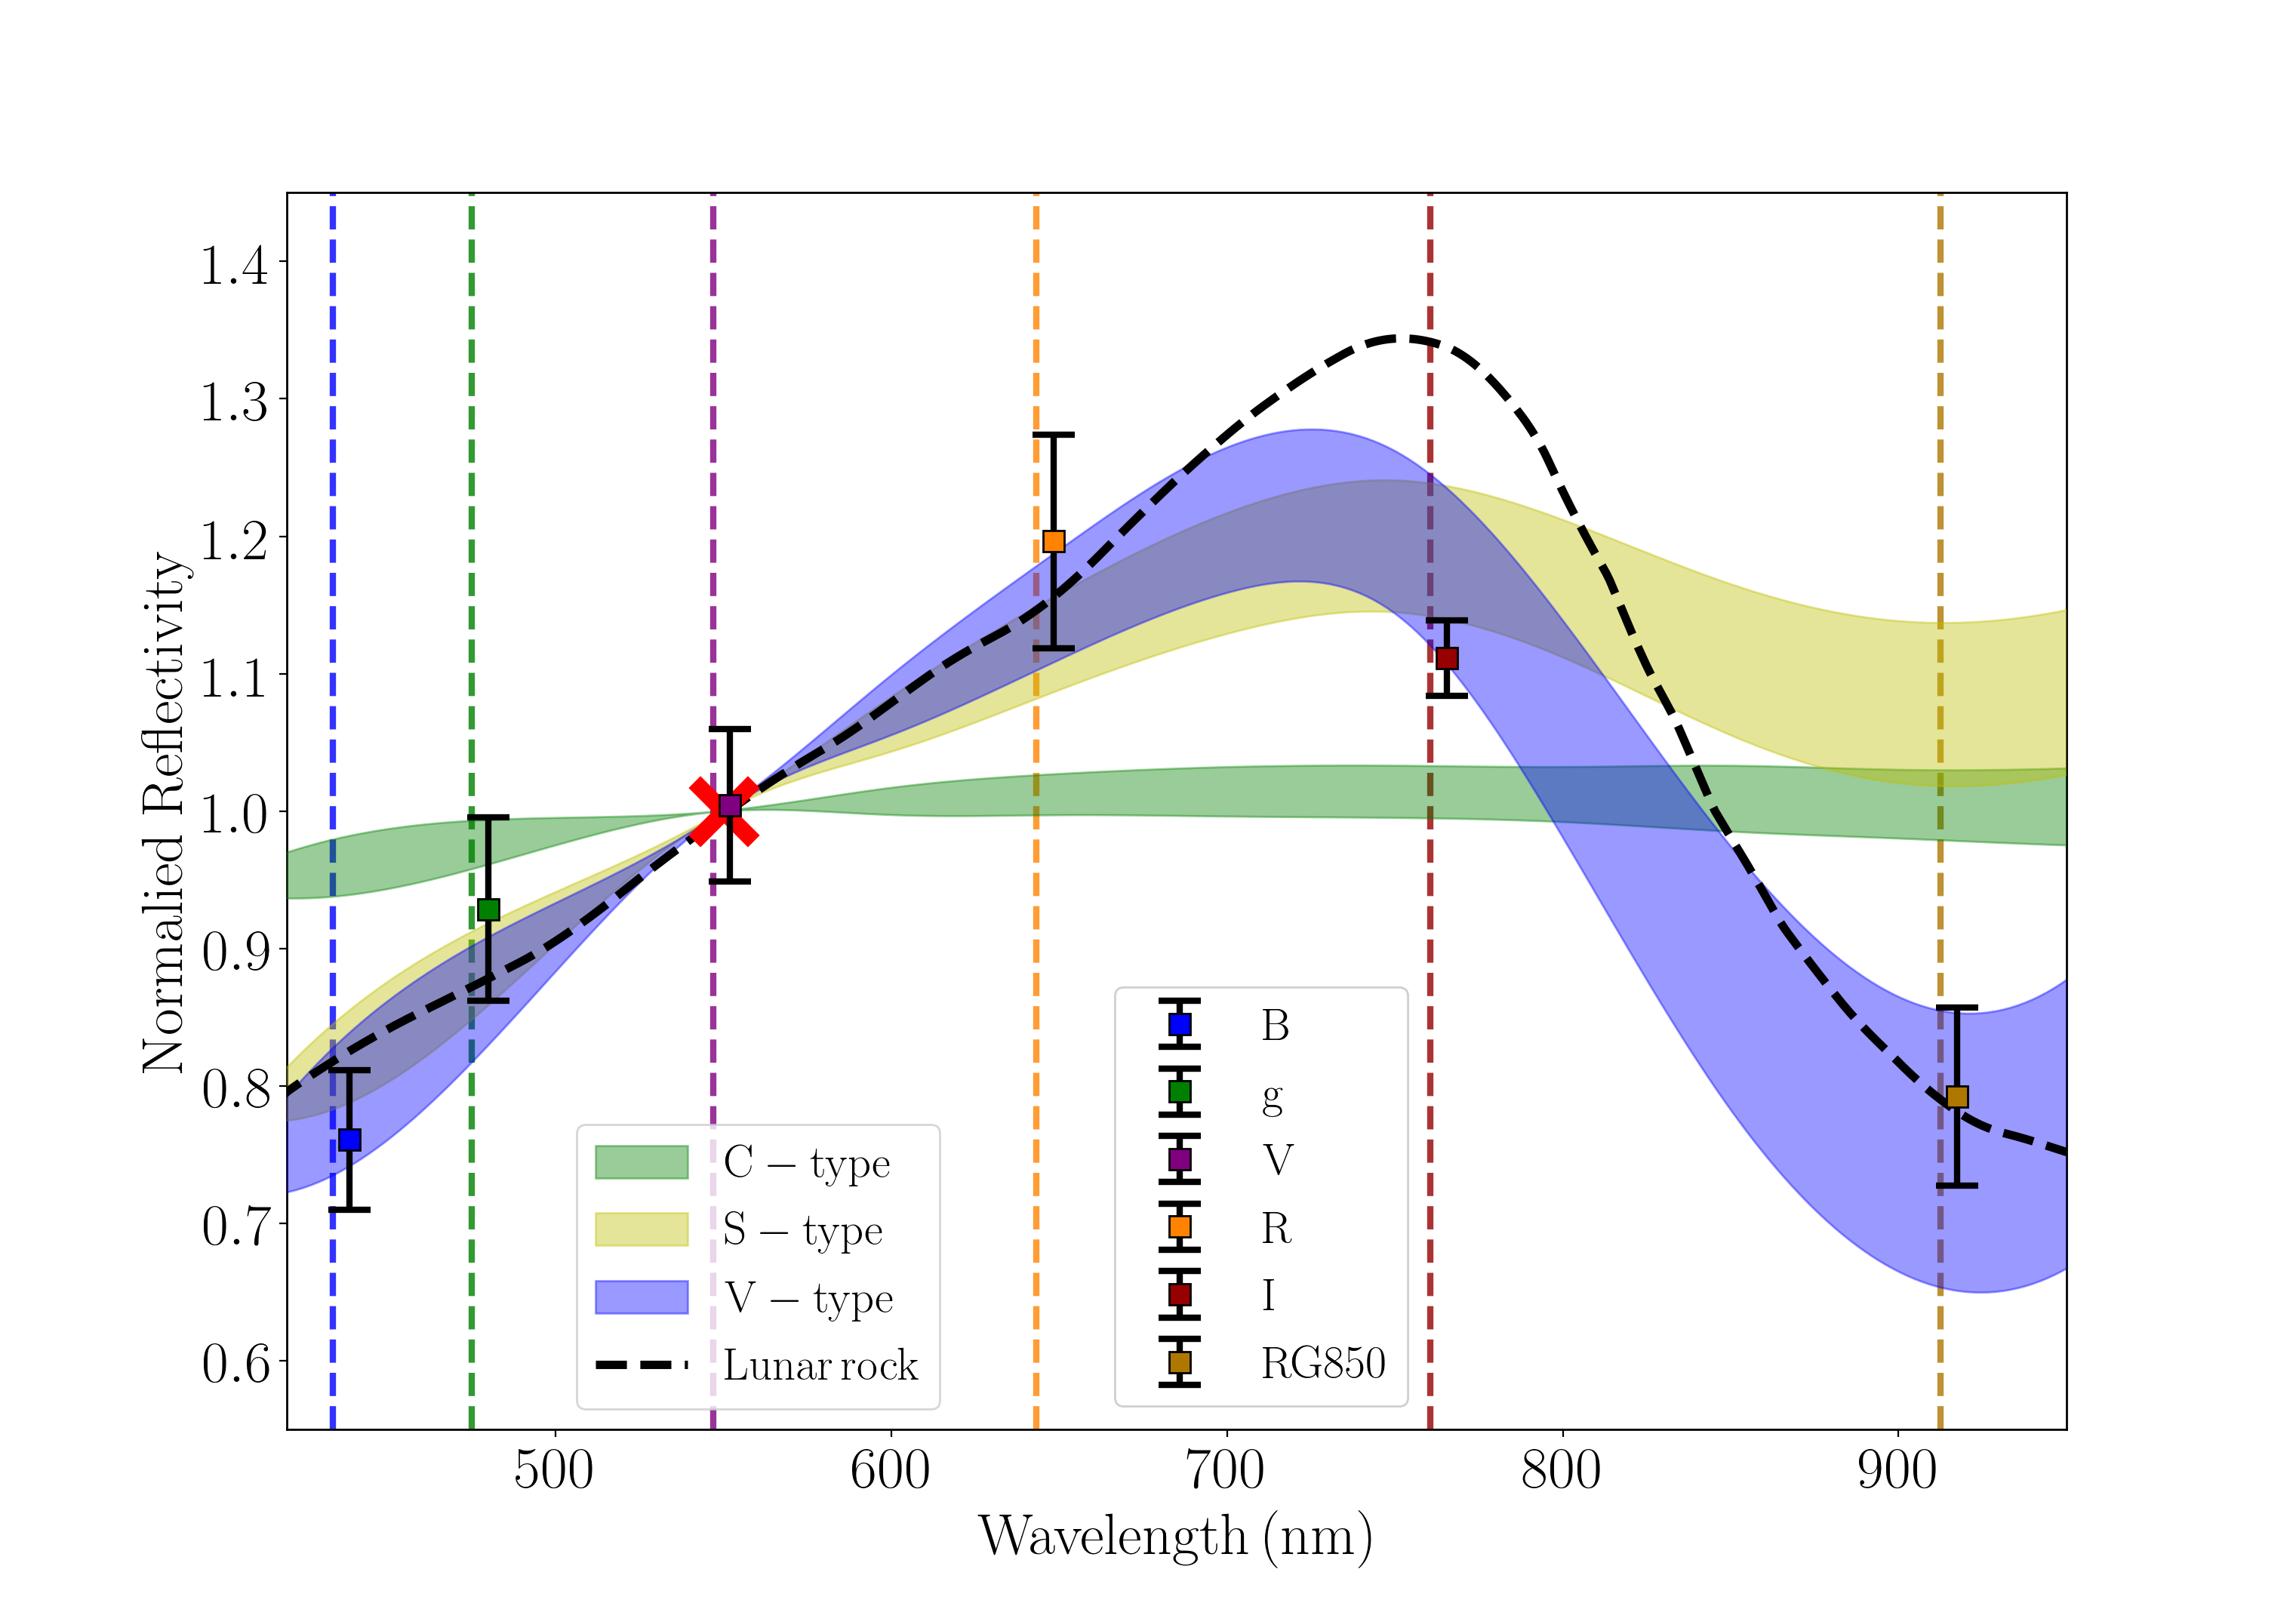
To compute the reflectivity spectrum of 2020 CD3, we divide the flux per , , , , and RG850 filter obtained for 2020 CD3 by the flux of the Solar analog flux in each corresponding filter. We then normalize the reflectivity spectrum of to 550 nm and detrend the data using a fit of the spectrum with the function
| (1) |
from Bus & Binzel (2002) where is the normalized reflectivity as a function of and is the spectral slope. The fit used to detrend the data from this function is made by fitting all , , , , and RG850 data between 435 nm and 912 nm. The resulting normalized reflectivity spectrum is plotted in Fig. 3. The normalized reflectivity spectrum of 2020 CD3 is most similar to the spectral range of V-type asteroids (Bus & Binzel, 2002; DeMeo et al., 2009) with a red slope between 430 nm and 760 nm deep absorption feature in the vicinity of the RG850 data point at 1000 nm compared to the reflectivity spectra of S and C-type asteroids (DeMeo et al., 2009). We note the same similarity in a∗ vs. -(RG850) colors between 2020 CD3 and V-type asteroids as seen in Fig. 2 as with our normalized reflectivity spectrum. This absorption feature at 1000 nm as seen for basaltic V-type asteroids found through the inner Main Belt is due to the presence of large amounts of pyroxene minerals on the asteroid’s surface (Moskovitz et al., 2008). In addition, we note the same similarity between the spectrum of 2020 CD3 and bulk basaltic Lunar rock consisting of pyroxenes minerals (Isaacson et al., 2011).
3.2 Lightcurve, periodicity and axial ratio estimation
In addition to measuring the photometry of 2020 CD3 in the per filter , , , , and RG850 composite image stacks, we search for lightcurve variations by measuring the photometry in our individual , , and filter observations. The measured photometric values in the individual images are presented in Table LABEL:t:photo. We used the colors measured from our composite image stacks described in Section 3.1 and photo-spectrum to convert our , and measurements to their equivalent value in . Using our magnitudes and the following equation:
| (2) |
from Bowell et al. (1988) where is the 1.0059 au heliocentric distance of 2020 CD3 on 2020 March 23 UTC, is its geocentric distance of 0.0128 au and is its phase angle of 45.4063∘. is the phase coefficient which we use the value of 0.25, the average value of for S or Q-type asteroids (Vereš et al., 2015). and are the basis functions normalized at = 0∘ described in (Bowell et al., 1988). We detrend the values of inferred from Eq. 2 dividing them by a linear fit which are plotted in the top panel of Fig. 4 which a median value of = 31.90.1. The errors on these measurements may be underestimated in part due to the unknown phase function of 2020 CD3.
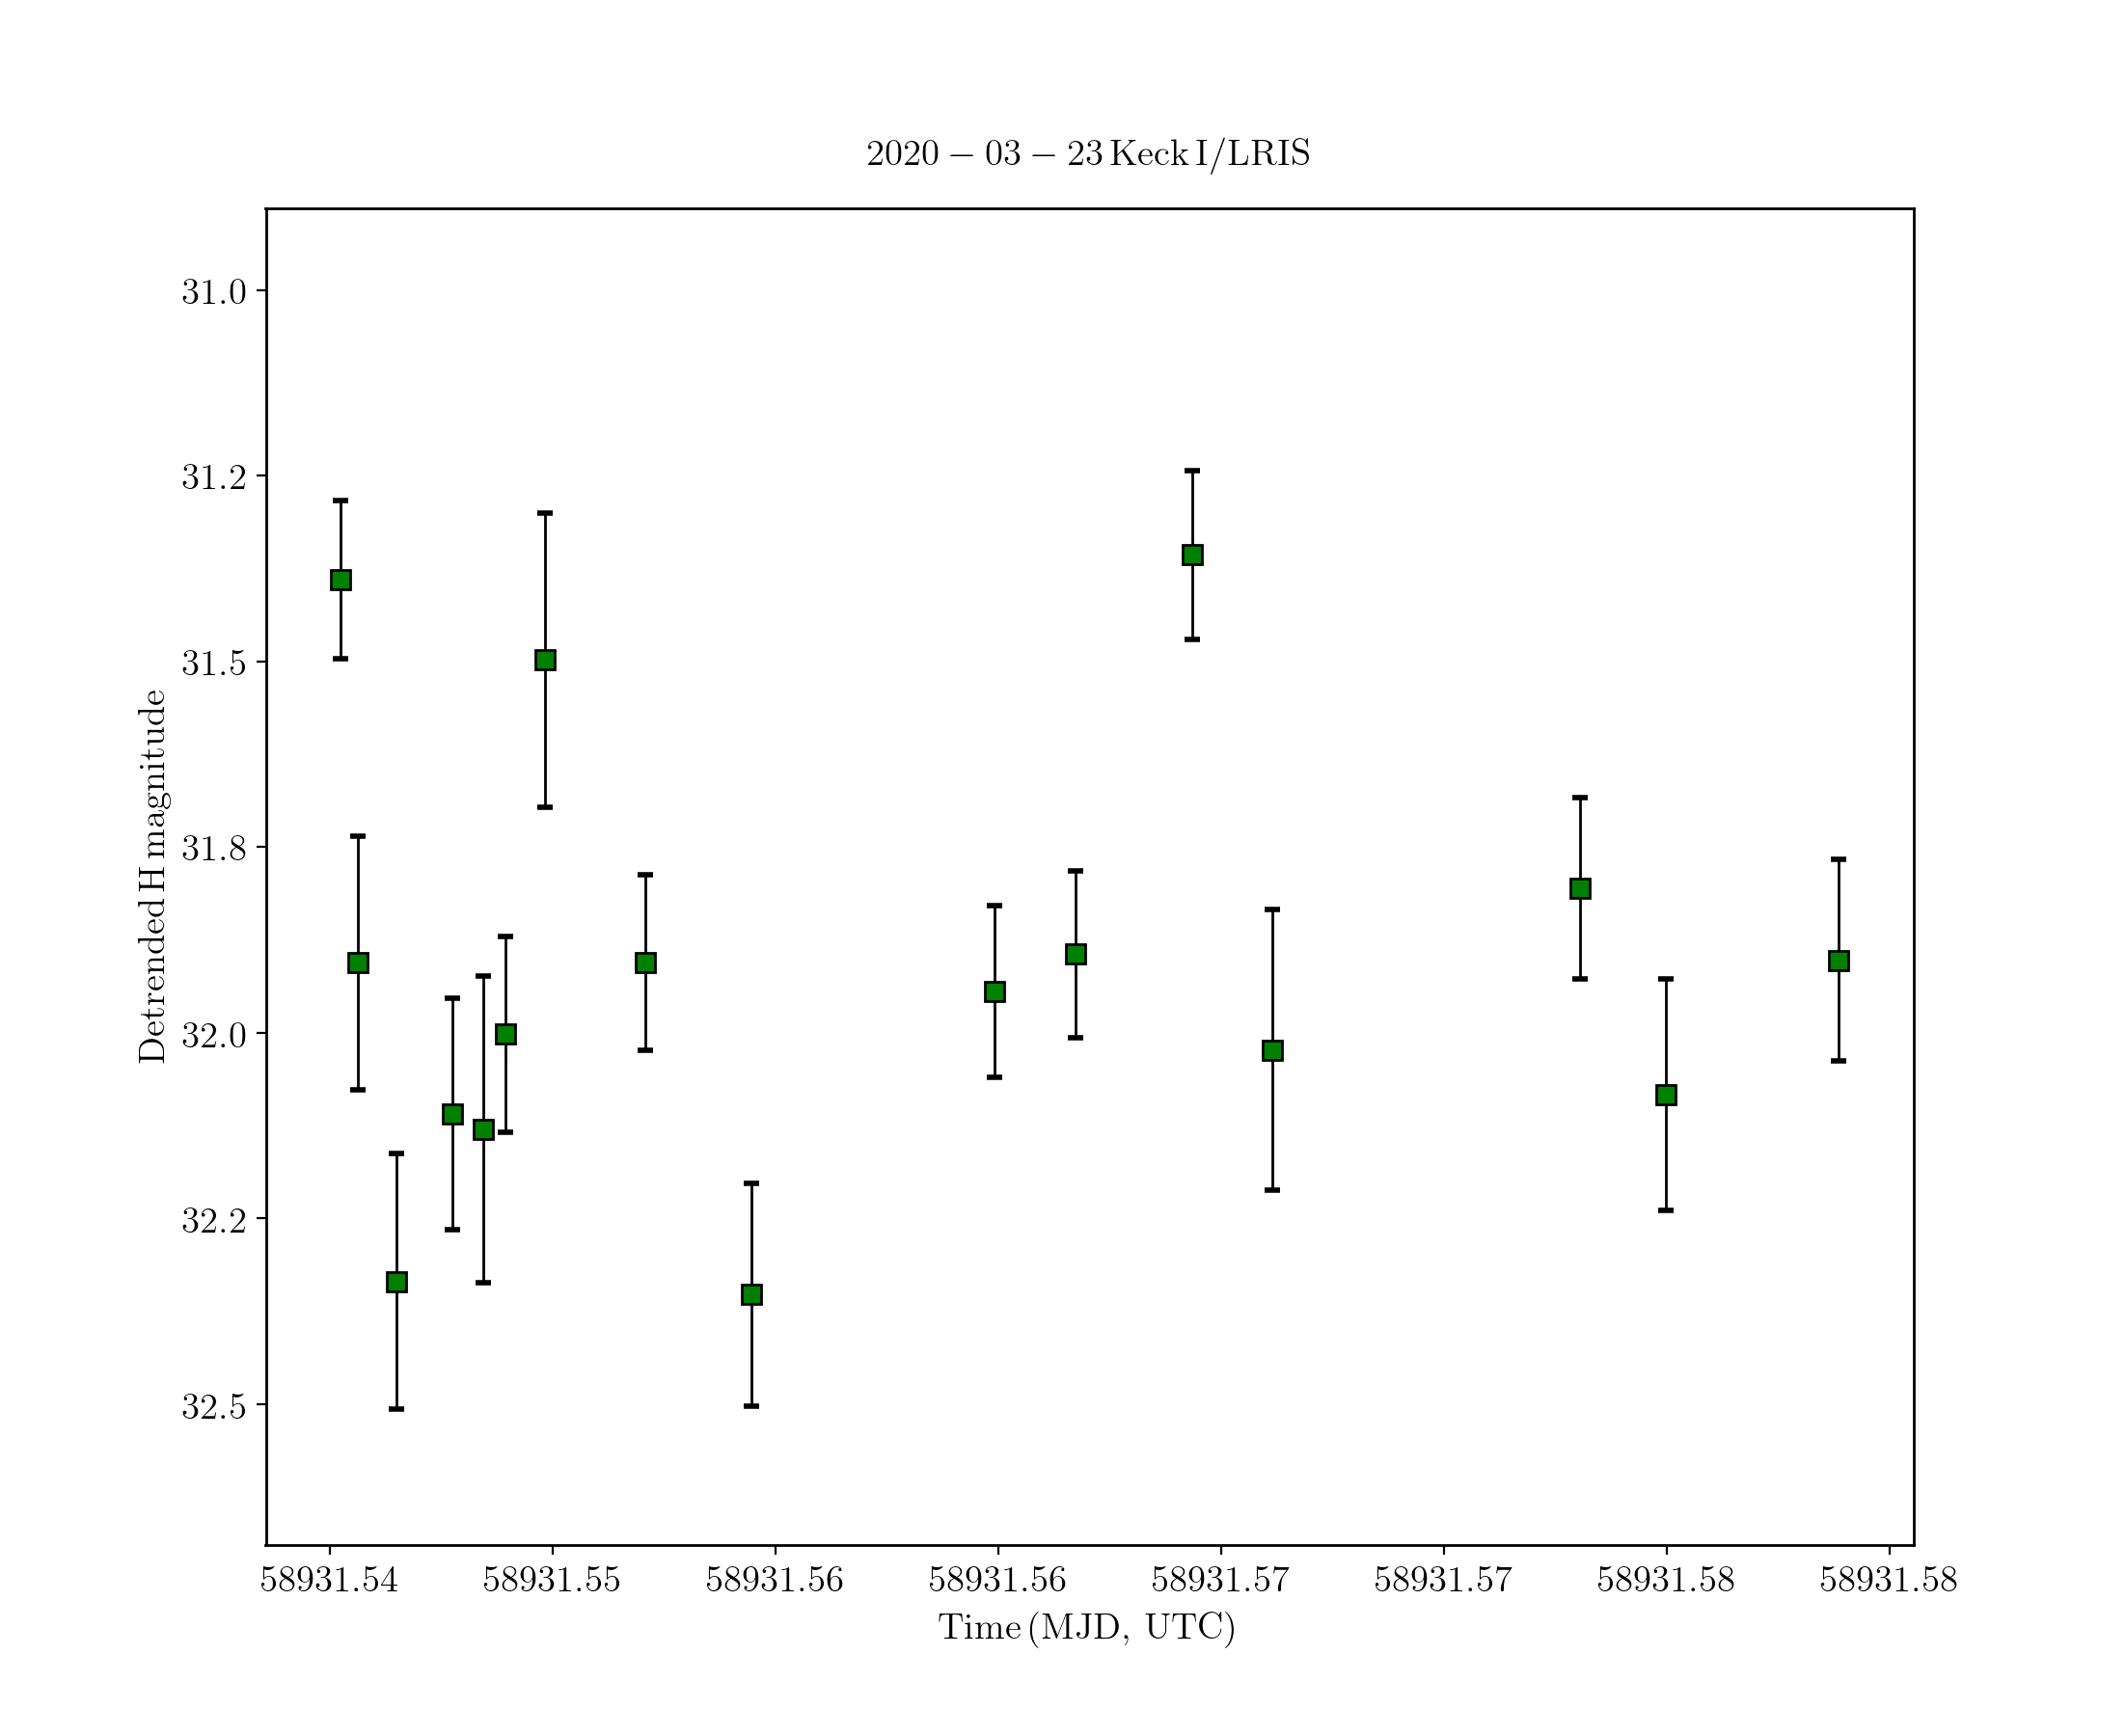
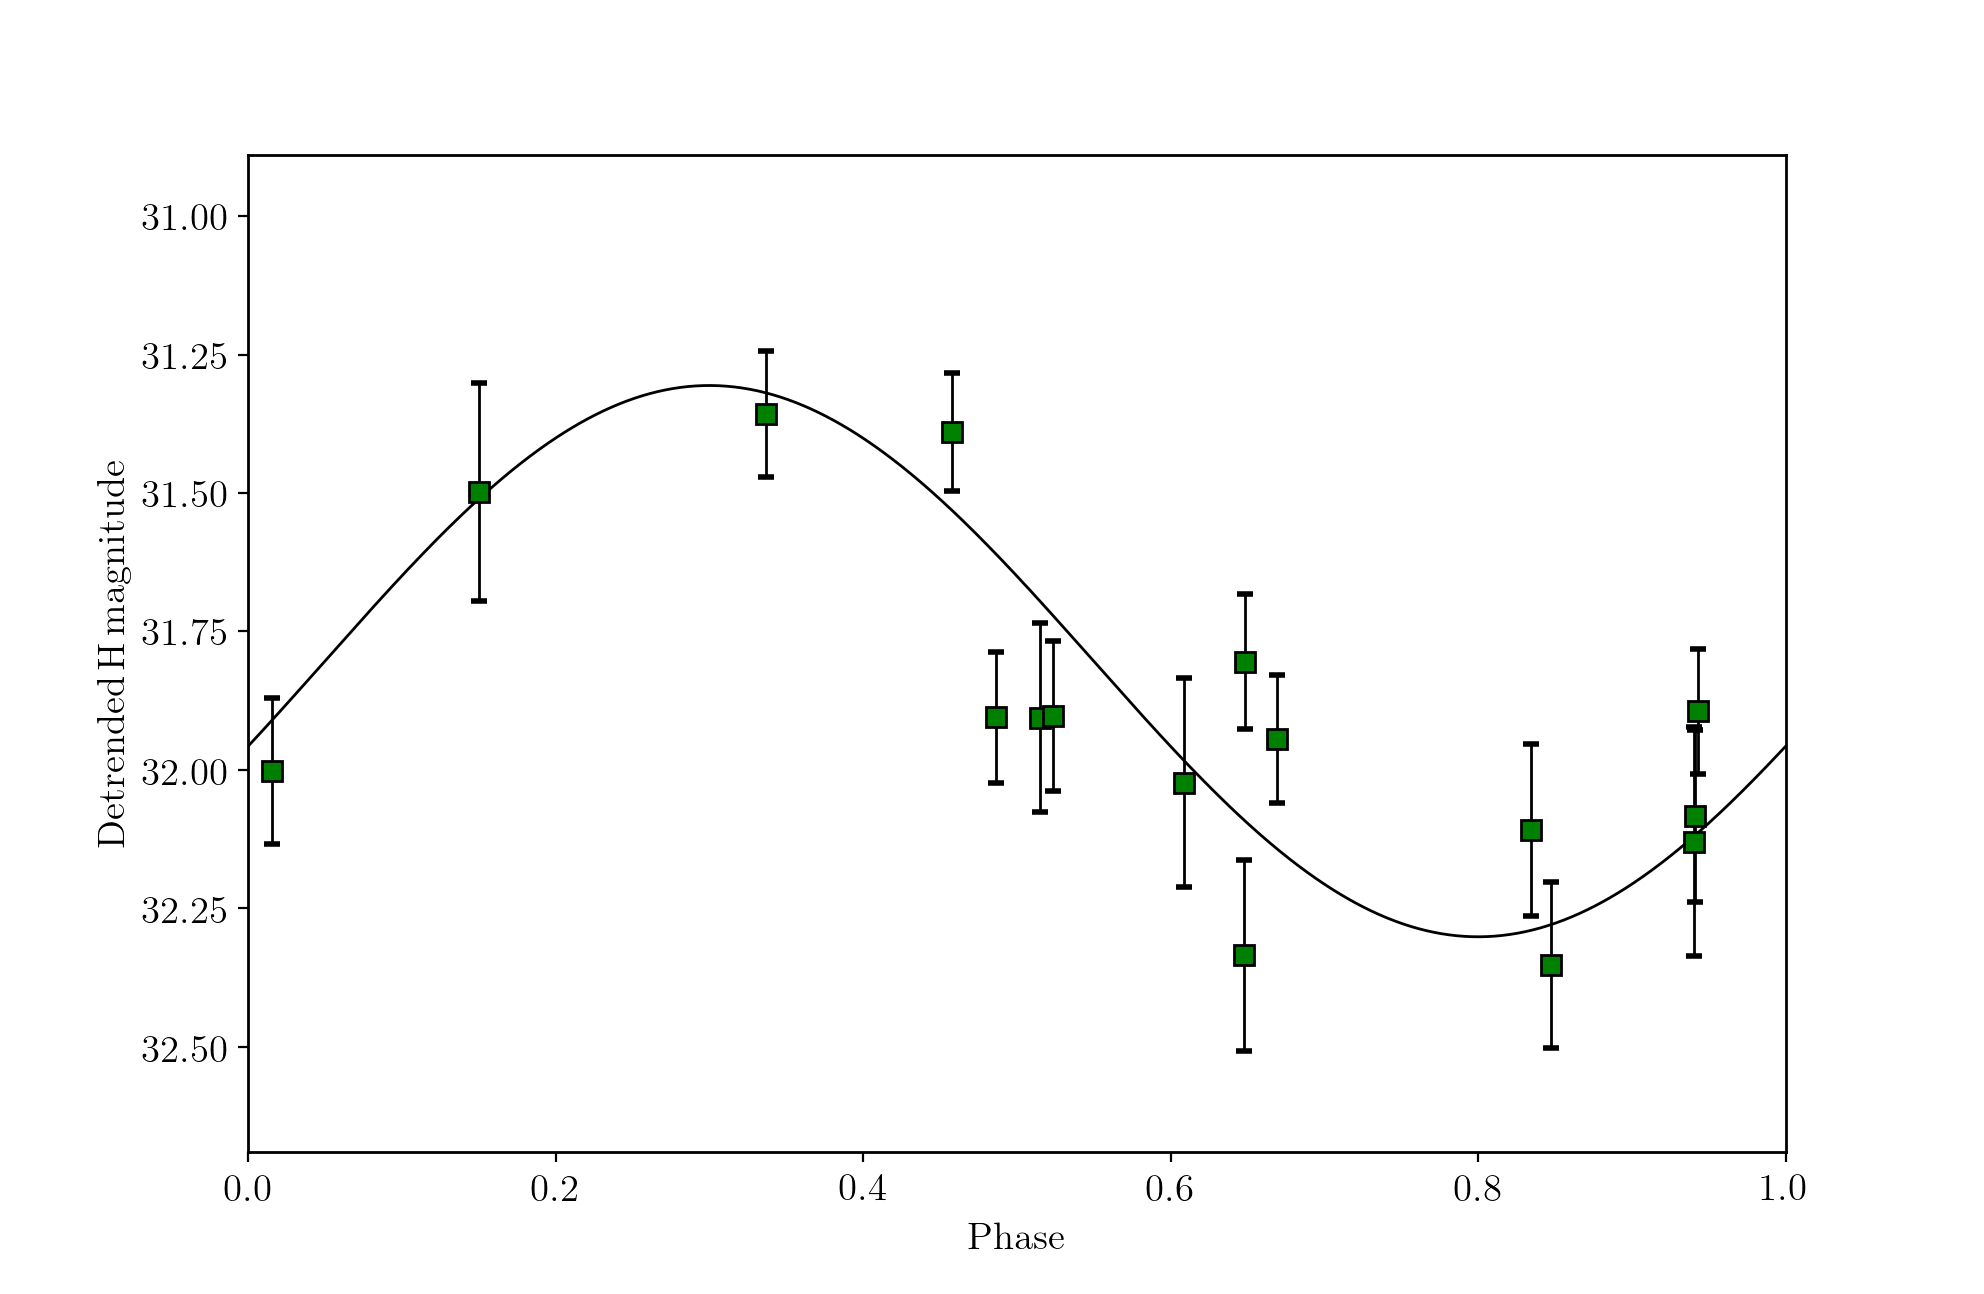
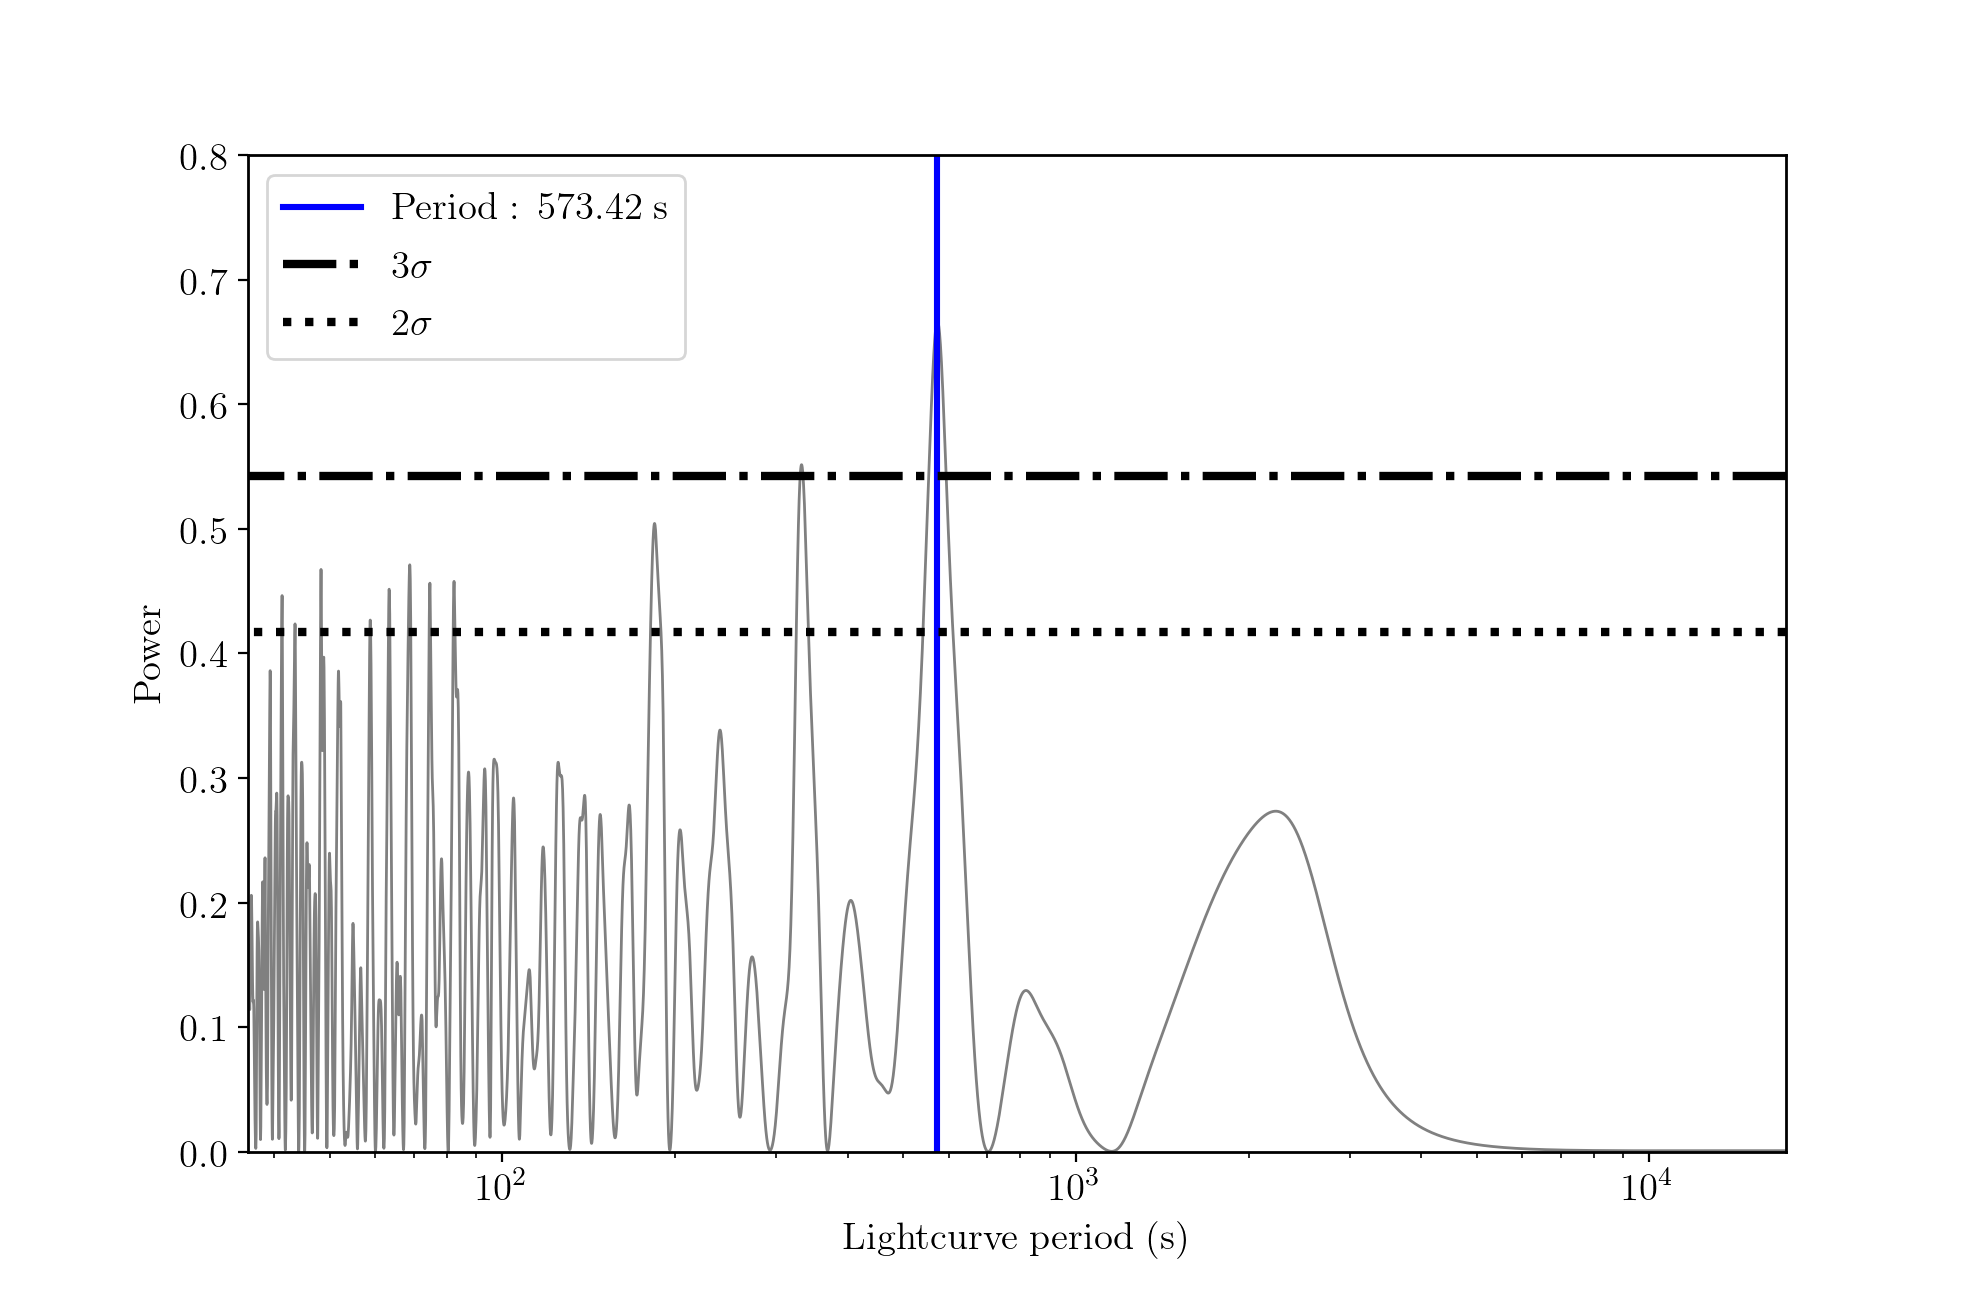
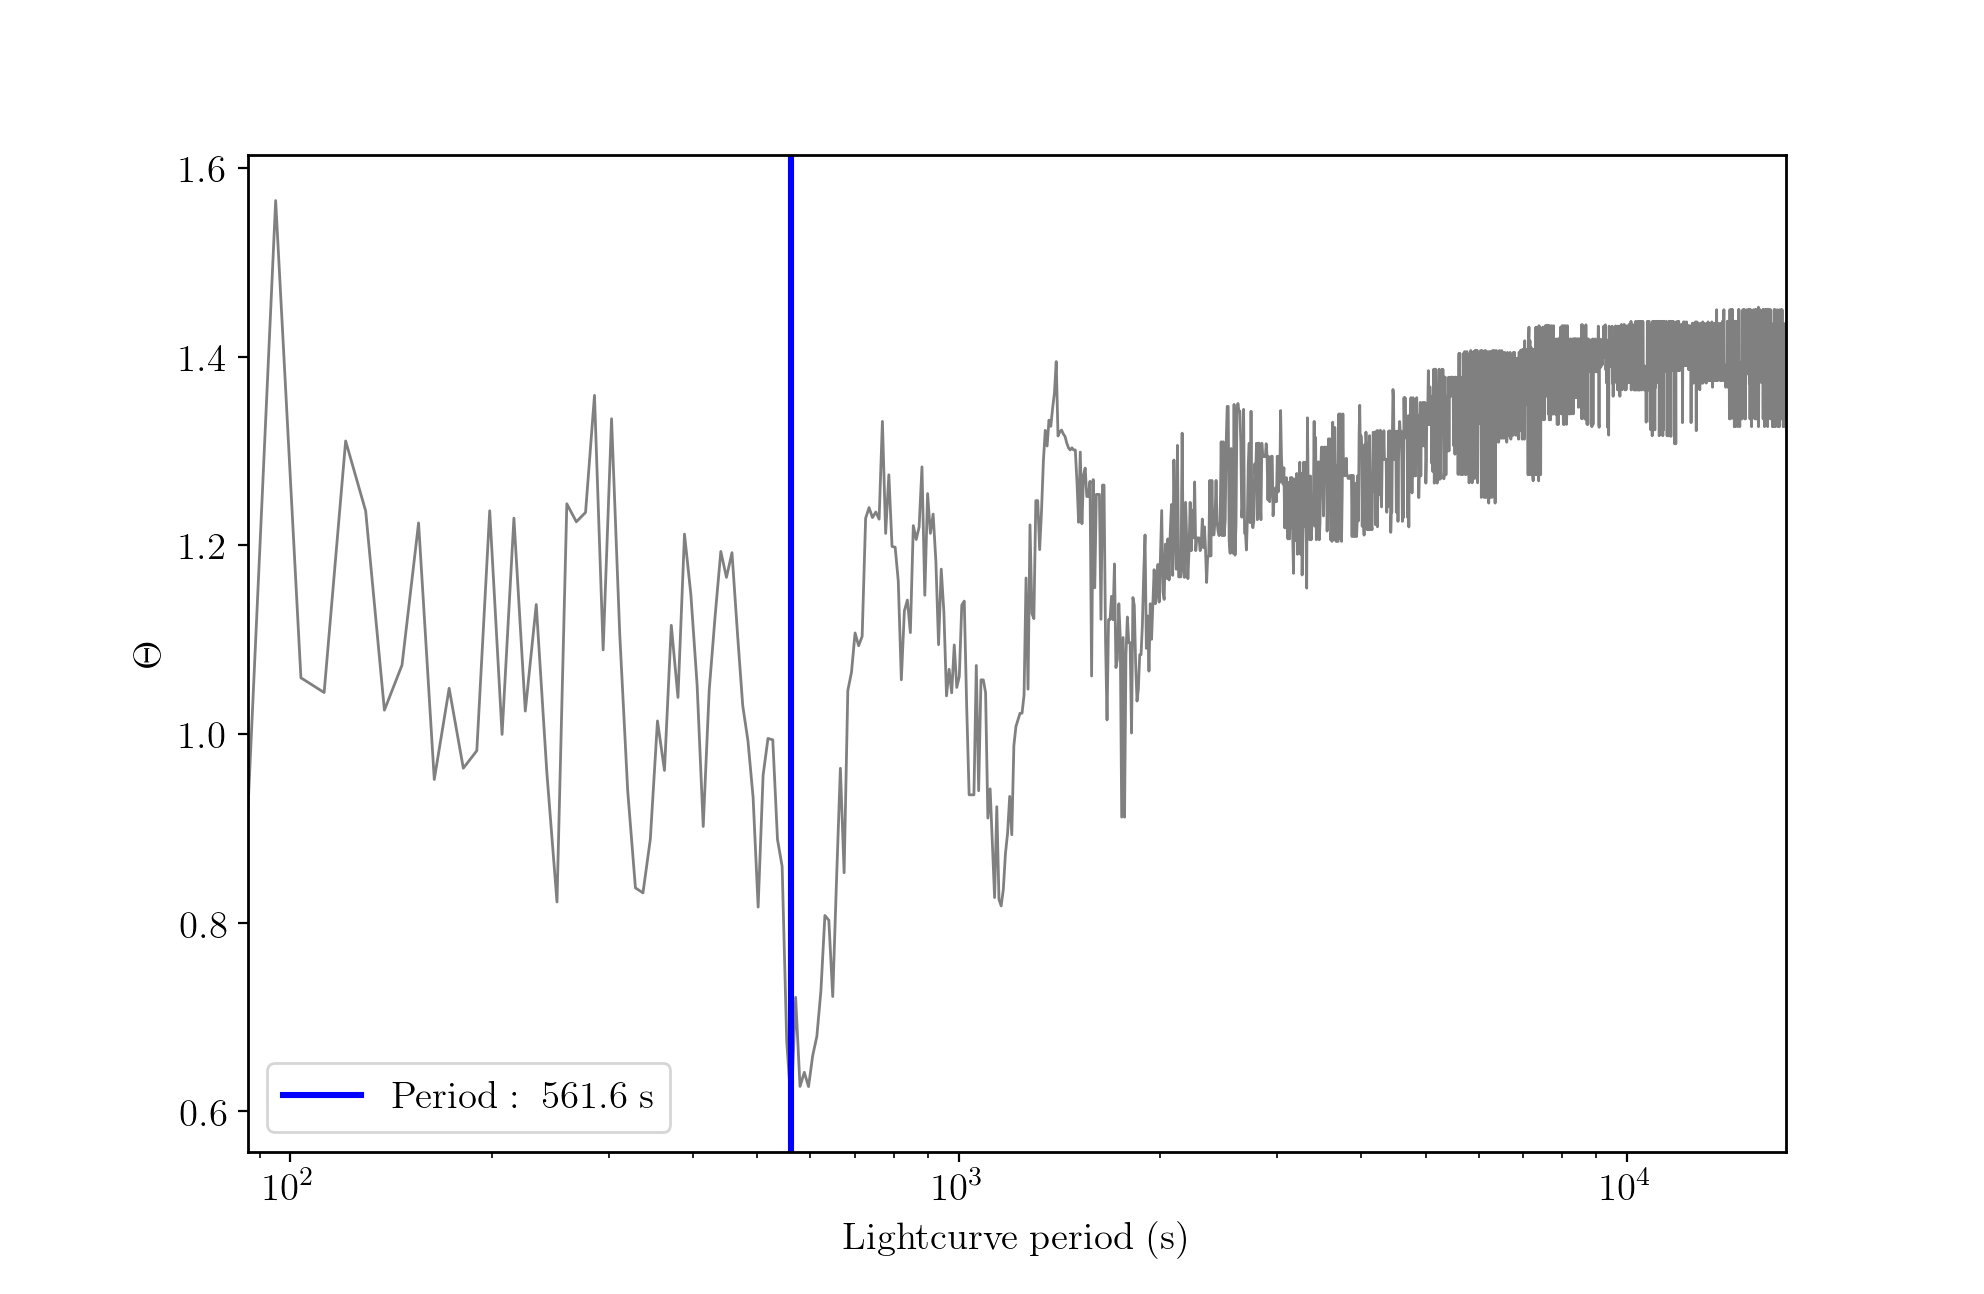
As seen in Fig. 4, there is brightness variability larger than the 0.01 photometric scatter measured from the CFHT Skyprobe and the typical 0.1 mag uncertainty of the data at SNR 10. Therefore, we will attempt to search for possible periodicities caused by time-variability in 2020 CD3’s reflective cross-section over its rotation (Barucci & Fulchignoni, 1982). We apply the Lomb-Scargle periodogram (Lomb, 1976) to the detrended magnitude data which is displayed in the top panel of Fig. 5. Removal of the linear trend over the 1 h observing period will affect the determination of lightcurve periods that are on 1 h time scales, but do not affect periodicities on 100 s time scales. The highest peak in the lightcurve period vs. spectral power curve is located at 573.4 s with a formal significance of 10-4. We apply bootstrap estimation (Press et al., 1986) of the uncertainties by removing data points from the time series lightcurve and repeating our periodogram estimation of the lightcurve period 10,000 times resulting in a central value of 574.5 s and a 1 uncertainty estimate of 30.5 s. As an independent check of our results obtained with the Lomb-Scargle periodogram, we apply phase dispersion minimization analysis to our data (Stellingwerf, 1978) and obtain a result of 561.6 s compatible with the lightcurve period estimate obtained with the Lomb-Scargle periodogram as seen in the bottom panel of Fig. 5. For comparison, the meter-scale asteroids 2006 RH120 and 2015 TC25 both had lightcurve periods on the order of 60-120 s measured from photometry and radar observations. Furthermore, the ensemble of the available catalog of asteroid lightcurve periods available from the Asteroid Lightcurve Database (Warner et al., 2009) seems to indicate that asteroids smaller than 10 m can have rotation periods much shorter than 60 s (Bolin et al., 2014).
We can estimate a rough shape for 2020 CD3 by assuming it possesses a triaxial prolate shape with dimensions, :: where in rough approximation with the shapes of other asteroids inferred from lightcurve inversion (Harris et al., 2009; Durech et al., 2010). Assuming =, the ratio between is described by where is the peak-to-trough lightcurve amplitude (Binzel et al., 1989) resulting in a of 2.5 for 2020 CD3 with lightcurve amplitude of 1 mag. However, the combination of the significant phase angle of 45∘ 2020 CD3 was observed on 2020 March 23 UTC and the light scattering properties of its presumably rough surface may have had the effect of amplifying its observed lightcurve amplitude (Zappala et al., 1990). The relationship between the observed lightcurve amplitude at a given phase angle and the lightcurve amplitude it would have if observed at = 0∘ is given by
| (3) |
from Zappala et al. (1990), where is in units of mag deg-1 for which we adopt the mean value of 0.012 mag deg-1 from light scattering experiment and observations of asteroids (Gutiérrez et al., 2006). Applying this correction to our observed lightcurve aplitude of 1 magnitude lightcurve amplitude at 45∘ phase angle, we calculate an equivalent = 0∘ lightcurve amplitude of 0.6 mag.
In addition to the relationship between phase angle and lightcurve amplitude, the aspect angle of an asteroid when viewed from the Earth can also have an effect on its lightcurve amplitude (e.g., Hanuš et al., 2018; Bolin, 2019). Because the pole orientation of 2020 CD3 is unknown, it is not possible for us to constrain its aspect viewing angle. Therefore, we adopt the approach of Bolin et al. (2018c) which is to average over all possible aspect angles using the following equation
| (4) |
from (Thirouin et al., 2016) which gives the lightcurve amplitude of an asteroid when viewed equatorially, i.e., at aspect angle, = 90∘, and where , and are the dimensions of 2020 CD3. We will assume 12 as observed in asteroid shape models inverted from lightcurves (Hanuš et al., 2013; Durech et al., 2015) and = for a prolate triaxial elipsoid. Integrating Eq. 4 over all possible aspect angles results in 0.5. Therefore, we calculate the ratio of 2020 CD3 using where = ( = 0.6 from Eq. 3 + = 0.5 from Eq. 4) 1 corresponding to a 2.5 with the lightcurve amplitude phase angle and aspect angle effects roughly canceling each other out.
3.3 Astrometry, orbit determination and archival data search
In addition to measuring the photometry from our observations, we use the positions of 2020 CD3 measured in our 3 x 30 s filter images to refine the orbit of 2020 CD3. We measured the astrometry of 2020 CD3 with the Astrometrica software (Raab, 2012) combined with reference stars from the Gaia data release 2 catalog (Gaia Collaboration et al., 2016, 2018). Table LABEL:t:astro contains our measured positions of 2020 CD3 from our filter observations. We conservatively estimate an astrometric uncertainty of 1.0″ in both the right ascension and declination directions to take into account the 3 s timing uncertainty of the Keck I/LRIS instrument (Burdge et al., 2019) resulting in an increased 0.2″ uncertainty in the along-track direction measured for the position of 2020 CD3 in addition to our nominal astrometric uncertainty of 0.5″. Adding to our 2020 March 23 UTC observations, we combine our observations with the publicly available observations of 2020 CD3 measured by other observatories from the Minor Planet Center observation database555https://www.minorplanetcenter.net/tmp/2020_CD3.txt In total, we use 60 observations of 2020 CD3 taken between 2020 February 18 UTC and 2020 March 23 UTC in addition to our own observations that are listed in Table LABEL:t:astro. Although uncertainty estimates for other observatories’ measurements of asteroids exist (Vereš & Chesley, 2017), we adopt conservative estimates for the astrometric uncertainties of 1.0″ in both right ascension and declination for these other observatories’ measured positions of 2020 CD3. As an exception, we adopt the positional uncertainty of 0.4″ for the observations for 2020 CD3 reported by T14, Mauna Kea, UH/Tholen NEO Follow-Up, made by the Canada France Hawaii Telescope and 0.8″ for observations made by J95, Great Shefford’s 0.41 m telescope based on the historical astrometric performance made by these observatories described in the documentation for the orbit fitting software FindOrb by Bill Gray666https://www.projectpluto.com/findorb.htm. We have submitted our astrometry of 2020 CD3 on 2020 March 23 UTC to the Minor Planet Center which has appeared in MPEC 2020-O103777https://minorplanetcenter.net/mpec/K20/K20OA3.html.
Using FindOrb, we fit an orbit to our list of observations using the 8 planets and the Moon as perturbers. In addition to the six orbit parameters, semi-major axis, , eccentricity, , inclination, , ascending node, , argument of perihelion, , mean anomaly, , we include an additional parameter to our orbital fit, the area-to-mass ration (AMR) as a measure of the effect of Solar radiation pressure on the orbit of 2020 CD3 (e.g., Micheli et al., 2012). The nominal orbital fit to our list of observations for the epoch of JD 2,458,931.5 (2020 March 23 UTC) in both heliocentric (, , , , , ) and geocentric orbital elements (, , , , , ), the AMR and magnitude are given in Table 3. It can be noted that the Earth-similar heliocentric elements of 1 au, 0.02 and low inclination are typical properties of the minimoon population (Granvik et al., 2012; Fedorets et al., 2017).
The mean observed-minus-computed residual from our least squares orbital fit to the observations is 0.40″ with the Keck I/LRIS observations having observed-minus-computed residuals of 0.2″using the seven orbital parameter (, , , , , , AMR fit). By comparison, the six orbital paremter (, , , , , ) fit results in a slightly higher mean observed-minus-computed residual of 0.43″. The complete list of observed-minus-computed residuals for each of the 60 observations used to compute the orbit is given in Table LABEL:t:astro. The of 0.95821 at the epoch of our orbital fit corresponding to the 2020 March 23 UTC data of our observations roughly indicates that 2020 CD3’s orbit was approaching a 1 hyperbolic state for leaving the Earth-Moon system and the measured AMR of 6.962.4110-4 m2/kg is comparable to other small asteroids with measured AMRs (e.g., Micheli et al., 2013; Mommert et al., 2014; Farnocchia et al., 2017). In addition, 2020 CD3’s is retrograde with a value of 146.68615∘ and a geocentric perihelion, , of 0.00031 au indicating that it is in the retrograde class of temporary natural satellites that come within the 0.01 au Hill radius of the Earth (Urrutxua & Bombardelli, 2017; Jedicke et al., 2018).
Our refined orbital solution of 2020 CD3 from our 2020 March 23 UTC observations enabled the search for possible prediscovery detections of 2020 CD3 in the Zwicky Transient Facility (ZTF) archive (Masci et al., 2019) for additional refinement of the orbit (e.g., as for prediscovery observations interstellar object 2I/Borisov by ZTF Bolin et al., 2020; Ye et al., 2020). The ZTF survey based on the Palomar Observatory’s P48 Oschin Schmidt telescope consists of a number of survey programs, some that are open to the public and some that are internal to the ZTF collaboration and Caltech, that are designed to cover the entire sky and detect transient sources including Solar System asteroids and comets (Graham et al., 2019). The ZTF survey camera consists of a 576 megapixel array with a pixel scale of 1.01 arcseconds/pixel covering a 7.4-degree x 7.4-degree field of view (Dekany et al., 2016) and , and band filters with a 20.5 to a SNR = 5 depth in a 30 s exposure generally used in survey (Bellm et al., 2019). The ZTF data system has the ability to detect both round, PSF-like detections (Masci et al., 2019) and fast-moving objects moving 5″/m resulting in the detections becoming significantly trailed (Ye et al., 2019a; Duev et al., 2019) in the survey’s 30 s exposures. Therefore, because of its large field of view and ability to identify fast-moving objects, ZTF is the ideal system for ground-based detection of minimoons, objects that typically moving 10″/min or more (Bolin et al., 2014; Fedorets et al., 2020).
Extrapolating the trajectory of 2020 CD3 as far back as 2018 October, we located regions of the sky where it was covered by the ZTF survey in and filters. We narrowed our search for prediscovery observations to times when 2020 CD3 was brighter than 20 taking into account the 0.2 mag mean color differences between the standard Johsnon filter and the ZTF filter for asteroids (Vereš & Chesley, 2017). Our search revealed dates when 2020 CD3 was brighter than 20 on 2019 January 17 UTC (19.1), 2019 April 04 UTC (15.2), 2019 November 15 UTC (19.5) and 2020 February 13 UTC (17.0). However, the only date overlapping with ZTF observations was on 2019 November 15 UTC in which a single band exposure was obtained which was also during the full phase of the moon greatly increasing the sky background in the image. In addition, 2020 CD3 was moving nearly 40″/min resulting in significant trailing losses (Shao et al., 2014) making its already difficult brightness of 19.5 impossible to detect. A possible method of detection for 2020 CD3 is to use where its orbital trajectory overlaps with higher-cadence fields while it is moving with a slower rate of motion and use synthetic tracking to shift and stack along its possible trajectories increasing its detection’s SNR to a detectable threshold as has been demonstrated for ZTF data of Main Belt and NEOs (Zhai et al., 2020), however, a full demonstration of synthetic tracking to locate 2020 CD3 in ZTF data is beyond the scope of this work.
3.4 Orbital evolution
The second-known minimoon 2020 CD3 was discovered while it was captured by the Earth-Moon system. To determine its orbital evolution before, during and after its captured state, we implemented the rebound -body orbit integration package (Rein & Liu, 2012) with our fitted orbit from Table 3. In addition to its nominal orbit, we cloned 10 additional massless test particles defined from the vertices of a cuboid represented by the heliocentric orbital elements and orbital parameter semi-major axis , eccentricity and inclination uncertainties listed in Table. 3 and an initial ephemeris time of 2020 March 23 UTC. The simulations are run using the IAS15 integrator (Rein & Spiegel, 2015) and the Sun, eight major masses of the Solar system, along with the Moon, Vesta, Ceres and Pluto 888Taken from the JPL HORIZONS Solar System Dynamics Database https://ssd.jpl.nasa.gov/ (Giorgini et al., 1996), on 10th April, 2020.. The simulations were run using a timestep of 0.00249 y (21.825 hours, 0.03 times the Lunar orbital period), with an output of 0.01 y for 5-y and 100-y time-frames.
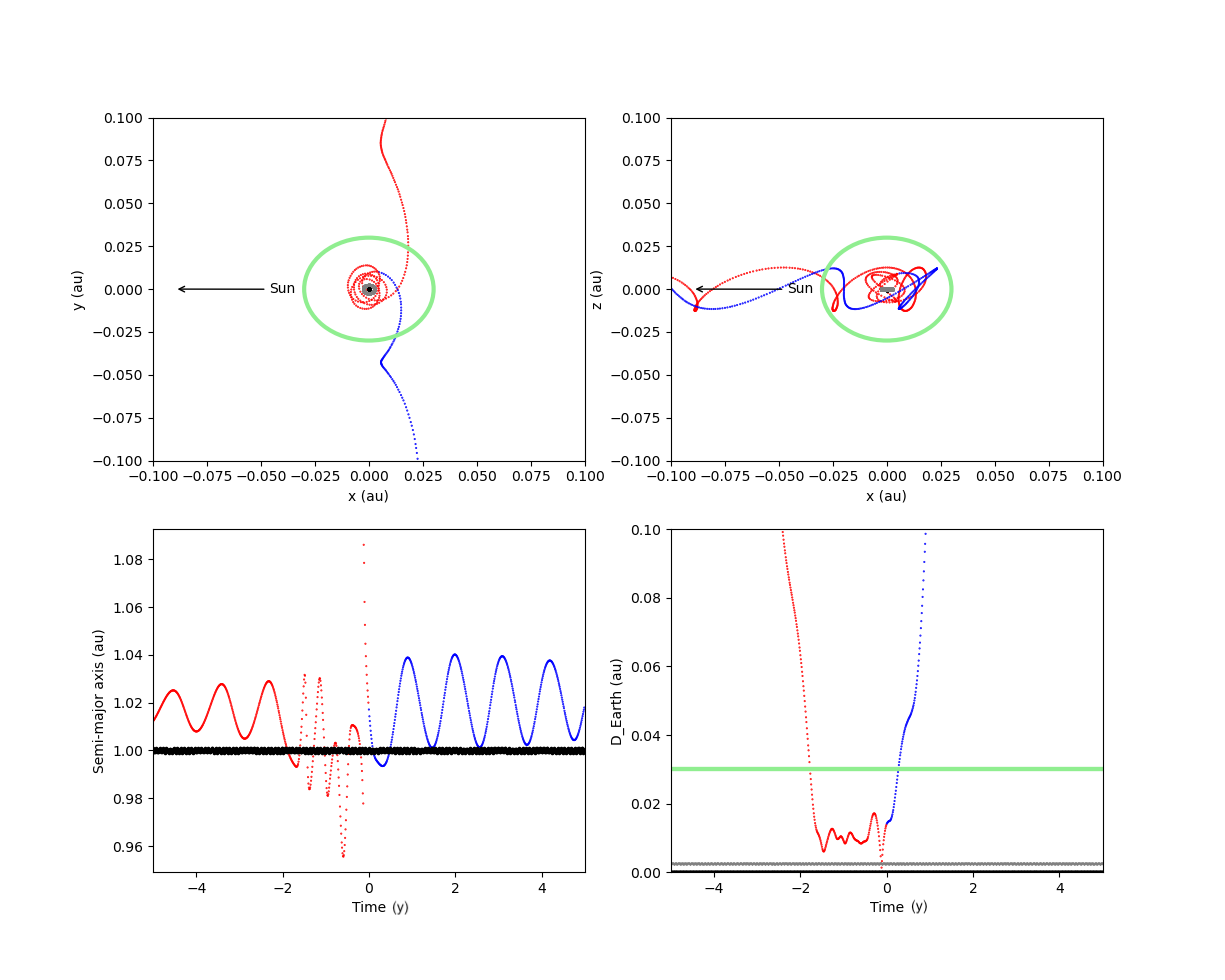
We adopt the definition of geocentric capture from Fedorets et al. (2017) and Jedicke et al. (2018) to describe the geocentric orbital evolution of 2020 CD3, namely that while captured, 2020 CD3 remains within 3 Hill radii (0.03 au) of the Earth, has a 1, and approaches the Earth to within 1 Hill radius (0.01 au) at some point during its captures. As seen in Fig. 6, 2020 CD3, approaches the Earth-Moon system opposite from the Sun’s direction in the direction of the L2 Lagrange point with its capture beginning in mid 2018 with a low 1 km/s encounter velocity. Almost half of minimoons pass through the L2 Lagrange point while becoming temporarily geocentrically bound (Granvik et al., 2012), therefore, it seems 2020 CD3’s capture is non-exceptional in the case of temporarily captured asteroids. In addition, we see from the top panels of Fig. 6 that 2020 CD3 is captured on a retrograde orbit 100∘ and completes 5 revolutions around the Earth-Moon system while remaining within three Hill radii of geocenter. Integrating its orbit forward and backward, the majority of 2020 CD3 orbital clones remained captured within the Earth-Moon for 2 y as seen in the bottom right panel of Fig.6 leaving the Earth-Moon system in mid 2020. Integrating the orbit with and without a Solar radiation pressure component does not significantly affect the capture duration of 2020 CD3. The geocentric orbit of 2020 CD3 is retrograde for nearly the entirety of its capture and its final orbit will result in it having a slightly larger heliocentric semi-major axis of of 1.027 au compared to its pre-capture of 0.973 au as seen in the bottom left panel of Fig. 6. Overall it seems the capture of 2020 CD3 is a typical, however, having a longer duration than the 1 y capture duration of 2006 RH120, the only other known minimoon, and the 9 month capture duration averaged over the minimoon population (Granvik et al., 2012).
In addition, we take a look at the longer term, 100 y heliocentric orbital evolution of 2020 CD3 as presented in Figs. 7 and 8. Integrating the orbit of 2020 CD3 100 y into the past and into the future show similar behavior in that 2020 CD3 has close encounters with the Earth placing 2020 CD3 inside the Hill radius of the Earth every 20-30 y as seen in the bottom right panels of Figs. 7 and 8. The long-term orbit of 2020 CD3 resembles a horseshoe orbit as seen in the upper left panels of Figs. 7 and 8 where its status as temporarily capture asteroids has resulted from its similar orbital plane and low encounter velocity relative to Earth’s (Granvik, 2013; Jedicke et al., 2018). Interestingly, some of the 2020 CD3 orbit clones when integrated into the future switch from a max inclination of 0.012∘ to 0.031∘ during the next encounter with the Earth. In addition, we have undertaken preliminary, long term simulations using the hybrid MERCURIUS rebound integrator, (Rein et al., 2019) using the same initial conditions as above, including the eight clones. These initial simulations indicate that the horse-shoe dynamical situation is stable for at least 106 years.


4 Discussion and Conclusions
It appears that 2020 CD3 represents a typical case when compared to the known ensemble and dynamical path of minimoons. While it is difficult to estimate the true population of minimoons given the vast incompleteness of asteroid surveys (Jedicke et al., 2016) the discovery of 2020 CD3 along with 2006 RH120 confirm minimoons as viable members of the near-Earth object population and is the first minimoon to be spectrophotometrically characterized. It seems as its orbital dynamics are similar to co-orbitals of Earth (Morais & Morbidelli, 2002) of which there is one known example, 2010 TK7 (Connors et al., 2011) and quasi-satellites of which several are known, e.g., (469219) 2016 HO3 (Chodas, 2016). Compared to the asteroid population at large, out of 1 million known asteroids as of 2020 July, only 10 are of similar size as 2020 CD3 with H31 or smaller making 2020 CD3 one of the smallest asteroids discovered and characterizes with spectrophotometry (e.g., Reddy et al., 2016).
While its spectrum and colors seem to indicated that 2020 CD3 is a likely V-type asteroid with an origin from the inner-Main Belt (DeMeo & Carry, 2013) as discussed in Section 3.1, we can use its orbit in reference with models describing the NEO population (Granvik et al., 2016, 2018) as an independent indication of its source through asteroid escape pathways in the Main Belt (Granvik et al., 2017). Comparison with the NEO population model suggests that its most likely Main Belt escape source with 70 probability was through the resonance located near the inner edge of the Main Belt at 2.1 au for low inclination objects (Milani & Knežević, 1990). The second and third most likely sources are the Hungaria asteroid population located between 1.8 au and 2.0 au (Milani et al., 2010) with a 25 probability and the 3:1 mean motion resonance located at the border between the inner and center Main Belt at 2.5 au (Wisdom, 1983) with a 5 probability. We note that the current NEO model is only available for asteroids with 25 or brighter, therefore we have made the comparison between 2020 CD3 and the NEO model with the assumption that it has = 25. Its other orbital parameters remain the same for the purposes of comparison with the NEO model.
Weighing the NEO albedo model (Morbidelli et al., 2020) according to these source probabilities for 2020 CD3 results in a predicted albedo, , of 0.23 which is on the lower 0.25-0.45 range of V-type asteroids (DeMeo & Carry, 2013). Using our measured magnitude of 31.90.1 and the following equation relating the diameter and :
| (5) |
from Harris & Lagerros (2002), we calculate that 2020 CD3 has = 1.20.1 m assuming = 0.23 as determined for 2020 CD3 from its possible Main Belt sources in the NEO albedo model (Morbidelli et al., 2020) or = 0.90.1 m if using = 0.35, the mean albedo of V-type asteroids in the Main Belt (DeMeo & Carry, 2013) making it currently the smallest asteroid studied spectrophometrically with the next smallest being asteroid 2015 TC25 (Reddy et al., 2016).
We estimate the density of 2020 CD3 by combining our constraints on its diameter and albedo combined with our AMR measurement from fitting its orbit. Using our measured AMR of 6.92.410-4 m2/kg and diameter estimate of = 1.00.1 m, we estimate the bulk density of 2020 CD3 to be 2.10.7 g/cm3 broadly compatible with the densities of other small asteroids determined from AMR measurements (e.g., Micheli et al., 2012). In comparison, the density of 2015 TC25 is 1 g/cm3 assuming a diameter of 2.2 m (Reddy et al., 2016) and an AMR of 6-710-4 m2/kg (Farnocchia et al., 2017). Assuming 0 macroporosity, the total mass of 2020 CD3 is 104 kg.
While its estimated density of 2.10.7 g/cm3 is broadly consistent with the density of V-type asteroids which have bulk densities of 2.3 g/cm3 (Carry, 2012) which its spectrum resembles, it is likely, however, that 2020 CD3 has a porosity in the range of 10-20 as for meteorites (Consolmagno et al., 2008), its closest analog as one of the smallest known asteroids. In contrast, the km-scale V-type asteroids which we are drawing in comparison with 2020 CD3 have macroporosities of 30 or larger (Carry, 2012) resulting in a higher density when correcting their 2.3 g/cm3 bulk densities for their higher macroporosity. Therefore, it may be more appropriate to compare the density of 2020 CD3 with achondritic basaltic meteorites which typically have bulk densities of 3.0 g/cm3 which is somewhat larger than our estimated range of the density of 2020 CD3.
2020 CD3 is likely the product of the fragmentation of a larger parent asteroid given its small 1 m size and its correspondingly short 1 Myr time scale (Bottke et al., 2005). There appears to be some discrepancy in the fact that 2020 CD3 most likely originates in the 1.8-2.2 au range at the inner edge of the Main Belt while having a spectrum similar to V-type asteroids which are thought to originate from the asteroid (4) Vesta (Binzel & Xu, 1993; Parker et al., 2008) and are primarily located at 2.3 au (DeMeo & Carry, 2013). A significant number of V-type asteroids exist further from the Sun located past 2.5 au in the central Main Belt (Carruba et al., 2005; Migliorini et al., 2017) which could provide a possible source of Earth-crossing V-type NEOs like 2020 CD3 if they were to drift inward into the 3:1 resonance due to the thermal recoil Yarkovsky effect (Farinella et al., 1998).
However, the role of the 3:1 resonance in transporting 2020 CD3 into Earth-crossing space from the Main Belt seems unlikely due to its 5 source probability. In addition, the Yarkovsky effect is able to transport meter-scale objects like 2020 CD3 into the proximity of the resonance, the most likely source of 2020 CD3, in 1 Myrs if it were to have originated as a fragment at 2.3 au (Bottke et al., 2006; Vokrouhlický et al., 2015) where most V-type asteroids are found even if possesses significantly different thermal inertia properties compared to larger, km-scale asteroids (Delbo et al., 2007; Bolin et al., 2018a). In addition, is apparent from the wide distribution of 1 km Vesta family fragments covering the entirety of the inner Main Belt (Bolin et al., 2017) that the size-dependent velocity distribution of family fragments originating from Vesta could have placed 2020 CD3-sized objects anywhere between the resonance at 2.2 au and the 3:1 resonance at 3.5 au (Carruba & Nesvorný, 2016; Bolin et al., 2018b). Therefore, the location of the resonance at the inner edge of the Main Belt at 2.2 au as the most likely source of 2020 CD3 does not necessarily preclude asteroids far from its vicinity as the original parent body of 2020 CD3.
Besides collisions, rotational fission of asteroids that are spinning near their rotational stability limit could be a possible origin of 2020 CD3 (Walsh et al., 2008). Several asteroids have been observed to be in the act of rotationally shedding mass or fragmenting (e.g., Moreno et al., 2017; Jewitt et al., 2017; Ye et al., 2019b) or have a dynamically-associated cluster of asteroids compatible with a fragmentation event in the recent past due to their rotation (Vokrouhlický et al., 2017). In addition, binary asteroids systems can become decoupled over time due to the influence of thermal radiation recoil effects (McMahon & Scheeres, 2010) which can result in small asteroids like 2020 CD3 leaving their binary systems and entering Earth-crossing space. The fragmentation of asteroid parent bodies or decoupling of binary systems can occur while an asteroid parent body in near-Earth object space (Scheirich et al., 2019; Bottke et al., 2020) providing an origin for 2020 CD3 outside of the Main Belt.
Another possible origin of minimoons is from Lunar impacts. While the orbits of Lunar debris dynamically decay after a few kyrs, it is possible that some Lunar ejecta can be re-captured by the Earth-Moon system as minimoons due to their orbital similarity with the Earth (Gladman et al., 1995). As presented in Fig. 3, the spectrum of 2020 CD3 is compatible with the spectrum of bulk Lunar rock at the precision of our spectrophotometry. In addition, our inferred density of 2020 CD3 of 2.10.7 g/cm3 is similar impact basin ejecta Lunar rock which have bulk density (2.4 g/cm3 Kiefer et al., 2012) and 20 porosity. Under the assumption that 2020 CD3 originated as Lunar ejecta, the young, 1 Myr-scale cosmic-ray exposure ages of Lunar meteorites (Eugster et al., 2006) implies that the vast majority of Lunar meteorites and 2020 CD3 by extension had to have been produced by a large and recent Lunar impact. The most recent, large impact that could produce ejecta the size of 2020 CD3 is the Giordano Bruno crater that has been estimated to be 4 Myrs old (Morota et al., 2009) based on the occurrence of craters near its proximity. However, the Lunar ejecta origin of 2020 CD3 is diminished by the fact that the vast majority Lunar meteorites posses cosmic ray exposure ages much shorter than the 4 Myr age of the Giordano Bruno crater suggesting that the dominant source of recent Lunar meteorites and thus Lunar ejecta are much smaller, more recent impact events than could have produced ejecta the size of 2020 CD3 (Minton et al., 2019).
consortium). Funding for the DPAC has been provided by national institutions, in particular the institutions participating in the Gaia Multilateral Agreement. Keck I Telescope, P48 Oschin Schmidt telescope/Zwicky Transient Facility
References
- Barucci & Fulchignoni (1982) Barucci, M. A., & Fulchignoni, M. 1982, Moon and Planets, 27, 47
- Bellm et al. (2019) Bellm, E. C., Kulkarni, S. R., Graham, M. J., et al. 2019, 131, 018002, doi: 10.1088/1538-3873/aaecbe
- Binzel et al. (1989) Binzel, R. P., Farinella, P., Zappalà, V., & Cellino, A. 1989, in Asteroids II, ed. R. P. Binzel, T. Gehrels, & M. S. Matthews, 416–441
- Binzel & Xu (1993) Binzel, R. P., & Xu, S. 1993, Science, 260, 186, doi: 10.1126/science.260.5105.186
- Bolin et al. (2014) Bolin, B., Jedicke, R., Granvik, M., et al. 2014, Icarus, 241, 280, doi: 10.1016/j.icarus.2014.05.026
- Bolin (2019) Bolin, B. T. 2019, arXiv e-prints, arXiv:1912.07386. https://arxiv.org/abs/1912.07386
- Bolin et al. (2017) Bolin, B. T., Delbo, M., Morbidelli, A., & Walsh, K. J. 2017, Icarus, 282, 290, doi: 10.1016/j.icarus.2016.09.029
- Bolin et al. (2018a) Bolin, B. T., Morbidelli, A., & Walsh, K. J. 2018a, A&A, 611, A82, doi: 10.1051/0004-6361/201732079
- Bolin et al. (2018b) Bolin, B. T., Walsh, K. J., Morbidelli, A., & Delbo, M. 2018b, MNRAS, 473, 3949, doi: 10.1093/mnras/stx2546
- Bolin et al. (2018c) Bolin, B. T., Weaver, H. A., Fernandez, Y. R., et al. 2018c, ApJ, 852, L2, doi: 10.3847/2041-8213/aaa0c9
- Bolin et al. (2020) Bolin, B. T., Lisse, C. M., Kasliwal, M. M., et al. 2020, AJ, 160, 26, doi: 10.3847/1538-3881/ab9305
- Bottke et al. (2005) Bottke, W. F., Durda, D. D., Nesvorný, D., et al. 2005, Icarus, 179, 63, doi: 10.1016/j.icarus.2005.05.017
- Bottke et al. (2020) Bottke, W. F., Moorhead, A., Hergenrother, C. W., et al. 2020, in Lunar and Planetary Science Conference, Lunar and Planetary Science Conference, 1215
- Bottke et al. (2006) Bottke, Jr., W. F., Vokrouhlický, D., Rubincam, D. P., & Nesvorný, D. 2006, Annual Review of Earth and Planetary Sciences, 34, 157, doi: 10.1146/annurev.earth.34.031405.125154
- Bowell et al. (1988) Bowell, E., Hapke, B., Domingue, D., et al. 1988, Asteroids II, 399
- Burdge et al. (2019) Burdge, K. B., Fuller, J., Phinney, E. S., et al. 2019, ApJ, 886, L12, doi: 10.3847/2041-8213/ab53e5
- Bus & Binzel (2002) Bus, S. J., & Binzel, R. P. 2002, Icarus, 158, 146, doi: 10.1006/icar.2002.6856
- Carruba et al. (2005) Carruba, V., Michtchenko, T. A., Roig, F., Ferraz-Mello, S., & Nesvorný, D. 2005, A&A, 441, 819, doi: 10.1051/0004-6361:20053355
- Carruba & Nesvorný (2016) Carruba, V., & Nesvorný, D. 2016, MNRAS, 457, 1332, doi: 10.1093/mnras/stw043
- Carry (2012) Carry, B. 2012, Planet. Space Sci., 73, 98, doi: 10.1016/j.pss.2012.03.009
- Chambers et al. (2016) Chambers, K. C., Magnier, E. A., Metcalfe, N., et al. 2016, ArXiv e-prints. https://arxiv.org/abs/1612.05560
- Chodas (2016) Chodas, P. 2016, in AAS/Division for Planetary Sciences Meeting Abstracts #48, AAS/Division for Planetary Sciences Meeting Abstracts, 311.04
- Chyba et al. (2014) Chyba, M., Patterson, G., Picot, G., et al. 2014, Journal of Industrial and Management Optimization, 10, 477
- Connors et al. (2011) Connors, M., Wiegert, P., & Veillet, C. 2011, Nature, 475, 481, doi: 10.1038/nature10233
- Consolmagno et al. (2008) Consolmagno, G., Britt, D., & Macke, R. 2008, Chemie der Erde / Geochemistry, 68, 1, doi: 10.1016/j.chemer.2008.01.003
- de la Fuente Marcos & de la Fuente Marcos (2016) de la Fuente Marcos, C., & de la Fuente Marcos, R. 2016, MNRAS, 462, 3441, doi: 10.1093/mnras/stw1972
- Dekany et al. (2016) Dekany, R., Smith, R. M., Belicki, J., et al. 2016, in Society of Photo-Optical Instrumentation Engineers (SPIE) Conference Series, Vol. 9908, Proc. SPIE, 99085M
- Delbo et al. (2007) Delbo, M., dell’Oro, A., Harris, A. W., Mottola, S., & Mueller, M. 2007, Icarus, 190, 236, doi: 10.1016/j.icarus.2007.03.007
- DeMeo et al. (2009) DeMeo, F. E., Binzel, R. P., Slivan, S. M., & Bus, S. J. 2009, Icarus, 202, 160, doi: 10.1016/j.icarus.2009.02.005
- DeMeo & Carry (2013) DeMeo, F. E., & Carry, B. 2013, Icarus, 226, 723, doi: 10.1016/j.icarus.2013.06.027
- Duev et al. (2019) Duev, D. A., Mahabal, A., Ye, Q., et al. 2019, MNRAS, 486, 4158, doi: 10.1093/mnras/stz1096
- Durech et al. (2015) Durech, J., Carry, B., Delbo, M., Kaasalainen, M., & Viikinkoski, M. 2015, Asteroid Models from Multiple Data Sources, 183–202
- Durech et al. (2010) Durech, J., Sidorin, V., & Kaasalainen, M. 2010, A&A, 513, A46, doi: 10.1051/0004-6361/200912693
- Elvis et al. (2011) Elvis, M., McDowell, J., Hoffman, J. A., & Binzel, R. P. 2011, Planet. Space Sci., 59, 1408, doi: 10.1016/j.pss.2011.05.006
- Eugster et al. (2006) Eugster, O., Herzog, G. F., Marti, K., & Caffee, M. W. 2006, Irradiation Records, Cosmic-Ray Exposure Ages, and Transfer Times of Meteorites, ed. D. S. Lauretta & H. Y. McSween, 829
- Farinella et al. (1998) Farinella, P., Vokrouhlický, D., & Hartmann, W. K. 1998, Icarus, 132, 378
- Farnocchia et al. (2017) Farnocchia, D., Tholen, D. J., Micheli, M., et al. 2017, in AAS/Division for Planetary Sciences Meeting Abstracts #49, AAS/Division for Planetary Sciences Meeting Abstracts, 100.09
- Fedorets et al. (2017) Fedorets, G., Granvik, M., & Jedicke, R. 2017, Icarus, 285, 83, doi: 10.1016/j.icarus.2016.12.022
- Fedorets et al. (2020) Fedorets, G., Granvik, M., Jones, R. L., Jurić, M., & Jedicke, R. 2020, Icarus, 338, 113517, doi: 10.1016/j.icarus.2019.113517
- Flewelling et al. (2016) Flewelling, H. A., Magnier, E. A., Chambers, K. C., et al. 2016, ArXiv e-prints. https://arxiv.org/abs/1612.05243
- Fukugita et al. (1996) Fukugita, M., Ichikawa, T., Gunn, J. E., et al. 1996, AJ, 111, 1748, doi: 10.1086/117915
- Gaia Collaboration et al. (2016) Gaia Collaboration, Prusti, T., de Bruijne, J. H. J., et al. 2016, A&A, 595, A1, doi: 10.1051/0004-6361/201629272
- Gaia Collaboration et al. (2018) Gaia Collaboration, Brown, A. G. A., Vallenari, A., et al. 2018, A&A, 616, A1, doi: 10.1051/0004-6361/201833051
- Giorgini et al. (1996) Giorgini, J. D., Yeomans, D., Chamberlin, A., et al. 1996, in Bulletin of the American Astronomical Society, Vol. 28, AAS/Division for Planetary Sciences Meeting Abstracts #28, 1158
- Gladman et al. (1995) Gladman, B. J., Burns, J. A., Duncan, M. J., & Levison, H. F. 1995, Icarus, 118, 302, doi: 10.1006/icar.1995.1193
- Graham et al. (2019) Graham, M. J., Kulkarni, S. R., Bellm, E. C., et al. 2019, PASP, 131, 078001, doi: 10.1088/1538-3873/ab006c
- Granvik et al. (2017) Granvik, M., Morbidelli, A., Vokrouhlický, D., et al. 2017, A&A, 598, A52, doi: 10.1051/0004-6361/201629252
- Granvik et al. (2012) Granvik, M., Vaubaillon, J., & Jedicke, R. 2012, Icarus, 218, 262, doi: 10.1016/j.icarus.2011.12.003
- Granvik et al. (2016) Granvik, M., Morbidelli, A., Jedicke, R., et al. 2016, Nature, 530, 303, doi: 10.1038/nature16934
- Granvik et al. (2018) —. 2018, Icarus, 312, 181, doi: 10.1016/j.icarus.2018.04.018
- Granvik (2013) Granvik, M.; Jedicke, R. 2013 (XXX), XXX
- Gutiérrez et al. (2006) Gutiérrez, P. J., Davidsson, B. J. R., Ortiz, J. L., Rodrigo, R., & Vidal-Nuñez, M. J. 2006, A&A, 454, 367, doi: 10.1051/0004-6361:20064838
- Hanuš et al. (2013) Hanuš, J., Ďurech, J., Brož, M., et al. 2013, A&A, 551, A67, doi: 10.1051/0004-6361/201220701
- Hanuš et al. (2018) Hanuš, J., Delbo, M., Alí-Lagoa, V., et al. 2018, Icarus, 299, 84, doi: 10.1016/j.icarus.2017.07.007
- Harris & D’Abramo (2015) Harris, A. W., & D’Abramo, G. 2015, Icarus, 257, 302, doi: 10.1016/j.icarus.2015.05.004
- Harris et al. (2009) Harris, A. W., Fahnestock, E. G., & Pravec, P. 2009, Icarus, 199, 310, doi: 10.1016/j.icarus.2008.09.012
- Harris & Lagerros (2002) Harris, A. W., & Lagerros, J. S. V. 2002, Asteroids III, 205
- Holmberg et al. (2006) Holmberg, J., Flynn, C., & Portinari, L. 2006, MNRAS, 367, 449, doi: 10.1111/j.1365-2966.2005.09832.x
- Isaacson et al. (2011) Isaacson, P. J., Sarbadhikari, A. B., Pieters, C. M., et al. 2011, Meteoritics and Planetary Science, 46, 228, doi: 10.1111/j.1945-5100.2010.01148.x
- Ivezić et al. (2001) Ivezić, Ž., Tabachnik, S., Rafikov, R., et al. 2001, AJ, 122, 2749, doi: 10.1086/323452
- Ivezić et al. (2002) Ivezić, Ž., Lupton, R. H., Jurić, M., et al. 2002, AJ, 124, 2943, doi: 10.1086/344077
- Jedicke et al. (2016) Jedicke, R., Bolin, B., Granvik, M., & Beshore, E. 2016, Icarus, 266, 173, doi: 10.1016/j.icarus.2015.10.021
- Jedicke et al. (2018) Jedicke, R., Bolin, B. T., Bottke, W. F., et al. 2018, Frontiers in Astronomy and Space Sciences, 5, 13, doi: 10.3389/fspas.2018.00013
- Jewitt et al. (2017) Jewitt, D., Agarwal, J., Li, J., et al. 2017, AJ, 153, 223, doi: 10.3847/1538-3881/aa6a57
- Jordi et al. (2006) Jordi, K., Grebel, E. K., & Ammon, K. 2006, A&A, 460, 339, doi: 10.1051/0004-6361:20066082
- Jorgensen et al. (2003) Jorgensen, K., Rivkin, A., Binzel, R., et al. 2003, in AAS/Division for Planetary Sciences Meeting Abstracts #35, AAS/Division for Planetary Sciences Meeting Abstracts, 36.02
- Jurić et al. (2002) Jurić, M., Ivezić, Ž., Lupton, R. H., et al. 2002, AJ, 124, 1776, doi: 10.1086/341950
- Kiefer et al. (2012) Kiefer, W. S., Macke, R. J., Britt, D. T., Irving, A. J., & Consolmagno, G. J. 2012, Geophys. Res. Lett., 39, L07201, doi: 10.1029/2012GL051319
- Kwiatkowski et al. (2008) Kwiatkowski, T., Kryszczynska, A., Polinska, M., et al. 2008, LPI Contributions, 1405, 8297
- Lomb (1976) Lomb, N. R. 1976, Ap&SS, 39, 447, doi: 10.1007/BF00648343
- Masci et al. (2019) Masci, F. J., Laher, R. R., Rusholme, B., et al. 2019, PASP, 131, 018003, doi: 10.1088/1538-3873/aae8ac
- McMahon & Scheeres (2010) McMahon, J., & Scheeres, D. 2010, Celestial Mechanics and Dynamical Astronomy, 106, 261, doi: 10.1007/s10569-009-9247-9
- Micheli et al. (2012) Micheli, M., Tholen, D. J., & Elliott, G. T. 2012, New A, 17, 446, doi: 10.1016/j.newast.2011.11.008
- Micheli et al. (2013) —. 2013, Icarus, 226, 251, doi: 10.1016/j.icarus.2013.05.032
- Migliorini et al. (2017) Migliorini, A., De Sanctis, M. C., Lazzaro, D., & Ammannito, E. 2017, MNRAS, 464, 1718, doi: 10.1093/mnras/stw2441
- Milani et al. (2010) Milani, A., Knežević, Z., Novaković, B., & Cellino, A. 2010, Icarus, 207, 769, doi: 10.1016/j.icarus.2009.12.022
- Milani & Knežević (1990) Milani, A., & Knežević, Z. 1990, Celestial Mechanics and Dynamical Astronomy, 49, 347, doi: 10.1007/BF00049444
- Minton et al. (2019) Minton, D. A., Fassett, C. I., Hirabayashi, M., Howl, B. A., & Richardson, J. E. 2019, Icarus, 326, 63, doi: 10.1016/j.icarus.2019.02.021
- Mommert et al. (2014) Mommert, M., Hora, J. L., Farnocchia, D., et al. 2014, ApJ, 786, 148, doi: 10.1088/0004-637X/786/2/148
- Morais & Morbidelli (2002) Morais, M. H. M., & Morbidelli, A. 2002, Icarus, 160, 1, doi: 10.1006/icar.2002.6937
- Morbidelli et al. (2020) Morbidelli, A., Delbo, M., Granvik, M., et al. 2020, Icarus, 340, 113631, doi: 10.1016/j.icarus.2020.113631
- Moreno et al. (2017) Moreno, F., Pozuelos, F. J., Novaković, B., et al. 2017, ApJ, 837, L3, doi: 10.3847/2041-8213/aa6036
- Morota et al. (2009) Morota, T., Haruyama, J., Miyamoto, H., et al. 2009, Meteoritics and Planetary Science, 44, 1115, doi: 10.1111/j.1945-5100.2009.tb01211.x
- Moskovitz et al. (2008) Moskovitz, N. A., Jedicke, R., Gaidos, E., et al. 2008, Icarus, 198, 77, doi: 10.1016/j.icarus.2008.07.006
- Ofek (2012) Ofek, E. O. 2012, The Astrophysical Journal, 749, 10
- Oke et al. (1995) Oke, J. B., Cohen, J. G., Carr, M., et al. 1995, PASP, 107, 375, doi: 10.1086/133562
- Parker et al. (2008) Parker, A., Ivezić, Ž., Jurić, M., et al. 2008, Icarus, 198, 138, doi: 10.1016/j.icarus.2008.07.002
- Perley (2019) Perley, D. A. 2019, PASP, 131, 084503, doi: 10.1088/1538-3873/ab215d
- Press et al. (1986) Press, W. H., Flannery, B. P., & Teukolsky, S. A. 1986, Numerical recipes. The art of scientific computing
- Pruyne et al. (2020) Pruyne, T. A., Wierzchos, K. W., D., R., Christensen, E., & Farneth, G. 2020, Minor Planet Electronic Circulars, 2020-D104, 104
- Raab (2012) Raab, H. 2012, Astrometrica: Astrometric data reduction of CCD images. http://ascl.net/1203.012
- Reddy et al. (2016) Reddy, V., Sanchez, J. A., Bottke, W. F., et al. 2016, AJ, 152, 162, doi: 10.3847/0004-6256/152/6/162
- Rein & Liu (2012) Rein, H., & Liu, S.-F. 2012, A&A, 537, A128, doi: 10.1051/0004-6361/201118085
- Rein & Spiegel (2015) Rein, H., & Spiegel, D. S. 2015, MNRAS, 446, 1424, doi: 10.1093/mnras/stu2164
- Rein et al. (2019) Rein, H., Hernandez, D. M., Tamayo, D., et al. 2019, Mon. Not. R. Astron. Soc., 485, 5490, doi: 10.1093/mnras/stz769
- Rockosi et al. (2010) Rockosi, C., Stover, R., Kibrick, R., et al. 2010, in Society of Photo-Optical Instrumentation Engineers (SPIE) Conference Series, Vol. 7735, Proc. SPIE, 77350R
- Scheirich et al. (2019) Scheirich, P., Pravec, P., Kušnirák, P., et al. 2019, arXiv e-prints, arXiv:1912.06456. https://arxiv.org/abs/1912.06456
- Schunová-Lilly et al. (2017) Schunová-Lilly, E., Jedicke, R., Vereš, P., Denneau, L., & Wainscoat, R. J. 2017, Icarus, 284, 114, doi: 10.1016/j.icarus.2016.11.010
- Shao et al. (2014) Shao, M., Nemati, B., Zhai, C., et al. 2014, ApJ, 782, 1, doi: 10.1088/0004-637X/782/1/1
- Sidorenko et al. (2014) Sidorenko, V. V., Neishtadt, A. I., Artemyev, A. V., & Zelenyi, L. M. 2014, Celestial Mechanics and Dynamical Astronomy, 120, 131, doi: 10.1007/s10569-014-9565-4
- Solontoi et al. (2012) Solontoi, M., Ivezić, Ž., Jurić, M., et al. 2012, Icarus, 218, 571, doi: 10.1016/j.icarus.2011.10.008
- Stellingwerf (1978) Stellingwerf, R. F. 1978, ApJ, 224, 953, doi: 10.1086/156444
- Thirouin et al. (2016) Thirouin, A., Moskovitz, N., Binzel, R. P., et al. 2016, AJ, 152, 163, doi: 10.3847/0004-6256/152/6/163
- Tingay et al. (2013) Tingay, S. J., Kaplan, D. L., McKinley, B., et al. 2013, AJ, 146, 103, doi: 10.1088/0004-6256/146/4/103
- Tonry et al. (2012) Tonry, J. L., Stubbs, C. W., Lykke, K. R., et al. 2012, ApJ, 750, 99, doi: 10.1088/0004-637X/750/2/99
- Urrutxua & Bombardelli (2017) Urrutxua, H., & Bombardelli, C. 2017
- Vereš et al. (2015) Vereš, P., Jedicke, R., Fitzsimmons, A., et al. 2015, Icarus, 261, 34, doi: 10.1016/j.icarus.2015.08.007
- Vereš & Chesley (2017) Vereš, P., & Chesley, S. R. 2017, AJ, 154, 12, doi: 10.3847/1538-3881/aa73d1
- Vokrouhlický et al. (2015) Vokrouhlický, D., Bottke, W. F., Chesley, S. R., Scheeres, D. J., & Statler, T. S. 2015, Asteroids IV, 509, doi: 10.2458/azu_uapress_9780816530595-ch027
- Vokrouhlický et al. (2017) Vokrouhlický, D., Pravec, P., Durech, J., et al. 2017, A&A, 598, A91, doi: 10.1051/0004-6361/201629670
- Walsh et al. (2008) Walsh, K. J., Richardson, D. C., & Michel, P. 2008, Nature, 454, 188, doi: 10.1038/nature07078
- Warner et al. (2009) Warner, B. D., Harris, A. W., & Pravec, P. 2009, Icarus, 202, 134, doi: 10.1016/j.icarus.2009.02.003
- Wisdom (1983) Wisdom, J. 1983, Icarus, 56, 51, doi: 10.1016/0019-1035(83)90127-6
- Ye et al. (2019a) Ye, Q., Masci, F. J., Lin, H. W., et al. 2019a, PASP, 131, doi: 10.1088/1538-3873/ab1b18
- Ye et al. (2019b) Ye, Q., Kelley, M. S. P., Bodewits, D., et al. 2019b, ApJ, 874, L16, doi: 10.3847/2041-8213/ab0f3c
- Ye et al. (2020) Ye, Q., Kelley, M. S. P., Bolin, B. T., et al. 2020, AJ, 159, 77, doi: 10.3847/1538-3881/ab659b
- Zappala et al. (1990) Zappala, V., Cellino, A., Barucci, A. M., Fulchignoni, M., & Lupishko, D. F. 1990, A&A, 231, 548
- Zhai et al. (2020) Zhai, C., Ye, Q., Shao, M., et al. 2020, PASP, 132, 064502, doi: 10.1088/1538-3873/ab828b
| Date1 | Filter2 | Exp3 | |
|---|---|---|---|
| (MJD UTC) | (s) | ||
| 58931.5452386 | R | 60 s | 31.39 0.11 |
| 58931.5456206 | g | 120 s | 31.91 0.17 |
| 58931.5465002 | R | 60 s | 32.33 0.17 |
| 58931.5477386 | R | 60 s | 32.11 0.16 |
| 58931.5484447 | g | 120 s | 32.13 0.21 |
| 58931.5489424 | R | 30 s | 32.00 0.13 |
| 58931.5498336 | R | 30 s | 31.50 0.2 |
| 58931.5520674 | B | 120 s | 31.90 0.12 |
| 58931.5544632 | B | 120 s | 32.35 0.15 |
| 58931.5599146 | B | 120 s | 31.94 0.12 |
| 58931.5617317 | B | 120 s | 31.89 0.11 |
| 58931.5643474 | g | 120 s | 31.36 0.11 |
| 58931.566153 | g | 120 s | 32.02 0.19 |
| 58931.5730511 | V | 120 s | 31.80 0.12 |
| 58931.5749956 | V | 120 s | 32.08 0.16 |
| 58931.5788613 | V | 120 s | 31.90 0.14 |
| Date1 | R.A2 | Dec.3 | 4 | 5 | 6 | 7 | Obs. code8 |
|---|---|---|---|---|---|---|---|
| (UTC) | (″) | (″) | (″) | (″) | |||
| 2020 Feb 15.511140 | 13 03 33.110 | +09 10 43.10 | 1.00 | 1.00 | -0.33 | -0.02 | G96 |
| 2020 Feb 15.516240 | 13 03 34.520 | +09 13 03.60 | 1.00 | 1.00 | +0.07 | +0.59 | G96 |
| 2020 Feb 15.521330 | 13 03 35.960 | +09 15 21.90 | 1.00 | 1.00 | -0.50 | +0.47 | G96 |
| 2020 Feb 15.545470 | 13 03 44.540 | +09 26 01.30 | 1.00 | 1.00 | -0.17 | -0.78 | G96 |
| 2020 Feb 15.545640 | 13 03 44.640 | +09 26 05.90 | 1.00 | 1.00 | +0.27 | -0.60 | G96 |
| 2020 Feb 15.545820 | 13 03 44.700 | +09 26 11.10 | 1.00 | 1.00 | +0.06 | -0.08 | G96 |
| 2020 Feb 15.545990 | 13 03 44.770 | +09 26 15.40 | 1.00 | 1.00 | +0.05 | -0.20 | G96 |
| 2020 Feb 15.995517 | 13 18 35.410 | +12 12 02.10 | 1.00 | 1.00 | -0.36 | +0.15 | L01 |
| 2020 Feb 15.997407 | 13 18 36.130 | +12 12 45.40 | 1.00 | 1.00 | +0.05 | +0.38 | L01 |
| 2020 Feb 15.999831 | 13 18 36.990 | +12 13 40.90 | 1.00 | 1.00 | +0.02 | +0.80 | L01 |
| 2020 Feb 16.004013 | 13 18 38.390 | +12 15 14.70 | 1.00 | 1.00 | -0.30 | -0.03 | L01 |
| 2020 Feb 16.005639 | 13 18 38.940 | +12 15 51.70 | 1.00 | 1.00 | -0.02 | +0.31 | L01 |
| 2020 Feb 16.363950 | 13 25 20.450 | +14 16 52.80 | 1.00 | 1.00 | +0.26 | +0.52 | 291 |
| 2020 Feb 16.366530 | 13 25 20.430 | +14 17 41.60 | 1.00 | 1.00 | +0.17 | +0.61 | 291 |
| 2020 Feb 16.369160 | 13 25 20.380 | +14 18 30.70 | 1.00 | 1.00 | +0.09 | +0.26 | 291 |
| 2020 Feb 16.437910 | 13 25 08.050 | +14 38 18.00 | 1.00 | 1.00 | +0.14 | +0.05 | I52 |
| 2020 Feb 16.439840 | 13 25 07.630 | +14 38 49.70 | 1.00 | 1.00 | +0.02 | +0.18 | I52 |
| 2020 Feb 16.441770 | 13 25 07.230 | +14 39 20.80 | 1.00 | 1.00 | +0.25 | -0.15 | I52 |
| 2020 Feb 16.443700 | 13 25 06.810 | +14 39 52.00 | 1.00 | 1.00 | +0.23 | -0.25 | I52 |
| 2020 Feb 17.040534 | 13 34 23.090 | +16 43 52.20 | 1.00 | 1.00 | +1.20 | +0.32 | L01 |
| 2020 Feb 17.046622 | 13 34 22.810 | +16 45 14.60 | 1.00 | 1.00 | -0.06 | -0.01 | L01 |
| 2020 Feb 17.051069 | 13 34 43.300 | +16 40 45.90 | 0.80 | 0.80 | -0.21 | -0.02 | J95 |
| 2020 Feb 17.054297 | 13 34 22.440 | +16 46 58.00 | 1.00 | 1.00 | +0.04 | +0.44 | L01 |
| 2020 Feb 17.070077 | 13 34 45.600 | +16 45 07.30 | 0.80 | 0.80 | +0.06 | -0.33 | J95 |
| 2020 Feb 17.084942 | 13 34 46.670 | +16 48 26.90 | 0.80 | 0.80 | -0.13 | -0.01 | J95 |
| 2020 Feb 17.100726 | 13 34 47.270 | +16 51 52.70 | 0.80 | 0.80 | +0.07 | -0.36 | J95 |
| 2020 Feb 17.508000 | 13 38 02.170 | +18 18 19.10 | 1.00 | 1.00 | +0.37 | +0.61 | G96 |
| 2020 Feb 17.510030 | 13 38 01.600 | +18 18 36.30 | 1.00 | 1.00 | +0.82 | +0.12 | G96 |
| 2020 Feb 17.512060 | 13 38 00.990 | +18 18 54.50 | 1.00 | 1.00 | +0.60 | +0.76 | G96 |
| 2020 Feb 17.514090 | 13 38 00.380 | +18 19 11.50 | 1.00 | 1.00 | +0.28 | +0.32 | G96 |
| 2020 Feb 17.980051 | 13 45 25.930 | +19 19 39.42 | 1.00 | 1.00 | -0.89 | +0.35 | Z84 |
| 2020 Feb 17.998253 | 13 45 29.233 | +19 23 16.64 | 1.00 | 1.00 | -0.80 | -0.04 | Z84 |
| 2020 Feb 18.016457 | 13 45 30.942 | +19 26 49.53 | 1.00 | 1.00 | -0.79 | -0.11 | Z84 |
| 2020 Feb 18.414650 | 13 47 52.480 | +20 25 18.00 | 1.00 | 1.00 | +0.09 | +0.40 | G96 |
| 2020 Feb 18.415230 | 13 47 52.300 | +20 25 23.20 | 1.00 | 1.00 | +0.17 | +0.51 | G96 |
| 2020 Feb 18.415810 | 13 47 52.140 | +20 25 27.20 | 1.00 | 1.00 | +0.54 | -0.57 | G96 |
| 2020 Feb 18.416390 | 13 47 51.930 | +20 25 33.00 | 1.00 | 1.00 | +0.21 | +0.16 | G96 |
| 2020 Feb 19.301670 | 13 55 16.820 | +21 55 58.10 | 1.00 | 1.00 | -0.51 | +0.82 | G96 |
| 2020 Feb 19.303920 | 13 55 16.910 | +21 56 17.50 | 1.00 | 1.00 | +0.23 | -0.70 | G96 |
| 2020 Feb 19.306180 | 13 55 16.960 | +21 56 39.00 | 1.00 | 1.00 | +0.71 | -0.15 | G96 |
| 2020 Feb 20.418810 | 14 00 29.620 | +23 35 56.90 | 1.00 | 1.00 | -0.02 | +0.59 | G96 |
| 2020 Feb 20.419560 | 14 00 29.390 | +23 36 00.70 | 1.00 | 1.00 | +0.44 | -0.01 | G96 |
| 2020 Feb 20.420320 | 14 00 29.140 | +23 36 05.20 | 1.00 | 1.00 | +0.69 | +0.05 | G96 |
| 2020 Feb 20.421070 | 14 00 28.880 | +23 36 11.00 | 1.00 | 1.00 | +0.76 | +0.97 | G96 |
| 2020 Feb 21.095901 | 14 03 49.976 | +24 21 03.47 | 1.00 | 1.00 | -0.39 | -0.35 | Z84 |
| 2020 Feb 21.120492 | 14 03 42.513 | +24 23 16.74 | 1.00 | 1.00 | -0.47 | -0.68 | Z84 |
| 2020 Feb 21.146268 | 14 03 33.897 | +24 25 23.50 | 1.00 | 1.00 | +0.03 | -0.04 | Z84 |
| 2020 Feb 21.172268 | 14 03 24.721 | +24 27 15.50 | 1.00 | 1.00 | +0.09 | -0.23 | Z84 |
| 2020 Feb 21.196581 | 14 03 16.142 | +24 28 46.33 | 1.00 | 1.00 | +0.54 | -0.46 | Z84 |
| 2020 Feb 27.642330 | 14 19 58.612 | +29 10 39.85 | 0.40 | 0.40 | +0.00 | +0.01 | T14 |
| 2020 Feb 27.643742 | 14 19 58.040 | +29 10 40.82 | 0.40 | 0.40 | -0.01 | +0.01 | T14 |
| 2020 Feb 27.645156 | 14 19 57.468 | +29 10 41.76 | 0.40 | 0.40 | -0.04 | +0.02 | T14 |
| 2020 Mar 01.477510 | 14 23 44.930 | +30 15 25.40 | 1.00 | 1.00 | +0.40 | -0.33 | G37 |
| 2020 Mar 01.479210 | 14 23 44.270 | +30 15 27.40 | 1.00 | 1.00 | -0.36 | -0.14 | G37 |
| 2020 Mar 01.480250 | 14 23 43.970 | +30 15 28.30 | 1.00 | 1.00 | +0.52 | -0.32 | G37 |
| 2020 Mar 22.483420 | 14 21 40.530 | +33 16 25.12 | 0.40 | 0.40 | -0.04 | +0.00 | T14 |
| 2020 Mar 22.487379 | 14 21 38.999 | +33 16 27.56 | 0.40 | 0.40 | +0.03 | +0.01 | T14 |
| 2020 Mar 23.544957 | 14 20 00.300 | +33 15 49.70 | 1.00 | 1.00 | +0.03 | +0.01 | 568 |
| 2020 Mar 23.548839 | 14 19 58.780 | +33 15 48.50 | 1.00 | 1.00 | -0.10 | -0.13 | 568 |
| 2020 Mar 23.549729 | 14 19 58.420 | +33 15 47.90 | 1.00 | 1.00 | +0.28 | +0.13 | 568 |
| Heliocentric Elements | |
| Epoch (JD) | 2,458,931.5 |
| Time of perihelion, (JD) | 2,458,907.045(0.019) |
| Semi-major axis, (au) | 1.01713(6.49x10⁻⁷) |
| Eccentricity, | 0.02858(6.58x10⁻⁷) |
| Perihelion, (au) | 0.98806(6.51x10⁻⁸) |
| Aphelion, (au) | 1.04620(1.34x10⁻⁶) |
| Inclination, (∘) | 0.55483(1.80x10⁻⁵) |
| Ascending node, (∘) | 116.954(1.70x10⁻³) |
| Argument of perihelion, (∘) | 357.557(1.30x10⁻³) |
| Mean Anomaly, (∘) | 65.1632(4.44x10⁻⁴) |
| Geocentric Elements | |
| Epoch (JD) | 2,458,931.5 |
| Time of perihelion, (JD) | 2,458,893.615(7.47x10⁻⁵) |
| Semi-major axis, (au) | 0.00752(3.72x10⁻⁷) |
| Eccentricity, | 0.95821(9.88x10⁻⁷) |
| Perihelion, (au) | 0.00031(2.05x10⁻⁸) |
| Aphelion, (au) | 0.01472(7.24x10⁻⁷) |
| Inclination, (∘) | 146.68615(7.24x10⁻⁷) |
| Ascending node, (∘) | 309.888(5.5x10⁻⁴) |
| Argument of perihelion, (∘) | 280.529(1.0x10⁻³) |
| Mean Anomaly, (∘) | 99.299(7.0x10⁻³) |
| Area-to-Mass ratio, AMR (m2/kg) | 6.96x10⁻⁴(2.41x10⁻⁴) |
| Absolute Magnitude, | 31.9(0.1) |