Strongly two-dimensional exchange interactions in the in-plane metallic antiferromagnet Fe2As probed by inelastic neutron scattering
Abstract
To understand spin interactions in materials of the Cu2Sb structure type, inelastic neutron scattering of Fe2As single crystals was examined at different temperatures and incident neutron energies. The experimental phonon spectra match well with the simulated phonon spectra obtained from density functional theory (DFT) calculations. The measured magnon spectra were compared to the simulated magnon spectra obtained via linear spin wave theory with the exchange coupling constants calculated using the spin polarized, relativistic Korringa-Kohn-Rostoker method in Zhang et al. (2013). The simulated magnon spectra broadly agree with the experimental data although, the energy values are underestimated along the direction. Exchange coupling constants between Fe atoms were refined by fits to the experimental magnon spectra, revealing stronger nearest neighbor Fe1-Fe1 exchange coupling than previously reported. The strength of this exchange coupling is almost an order of magnitude higher than other exchange interactions despite the three-dimensional nature of the phonon interactions. The lack of scattering intensity at energies above 60 meV makes unconstrained determination of the full set of exchange interactions difficult, which may be a fundamental challenge in metallic antiferromagnets.
I Introduction
With recent interest towards understanding the possibility of electrical switching behavior in metallic antiferromagnets,Baltz et al. (2018); Siddiqui et al. (2020); Jungfleisch et al. (2018); Železný et al. (2018) notably in CuMnAsWadley et al. (2016); Grzybowski et al. (2017); Wadley et al. (2018); Matalla-Wagner et al. (2019) and Mn2Au,Meinert et al. (2018); Bodnar et al. (2019) the relationships between their static magnetic orders,Wadley et al. (2013); Hills et al. (2015); Wadley et al. (2015); Saidl et al. (2017) in some cases are quite recently determined, and their spin dynamics Grzybowski et al. (2017); Bodnar et al. (2019); Yang et al. (2019, 2020) are of crucial interest. CuMnAs is a member of a larger family of easy-plane metallic antiferromagnets in the Cu2Sb structure type,Nateprov et al. (2011); Wadley et al. (2013) which includes Cr2As,Yuzuri (1960) Mn2As,Yuzuri and Yamada (1960) and Fe2As.Katsuraki and Achiwa (1966) The proposed switching involves a field-like torque from exchange interactions between the carrier spins and the moments of the magnetic atoms. The non-equilibrium current-induced spin polarization is staggered across the two sublattices and exerts a uniform torque on the Néel vector.Železný et al. (2014, 2017); Wadley et al. (2016) While the static spin arrangements of these easy-plane antiferromagnets are known, the underlying energy scales and dynamics are less so. Determination of fundamental exchange and anisotropy energies are essential to understand what energy barriers and resonances may dominate in these materials.
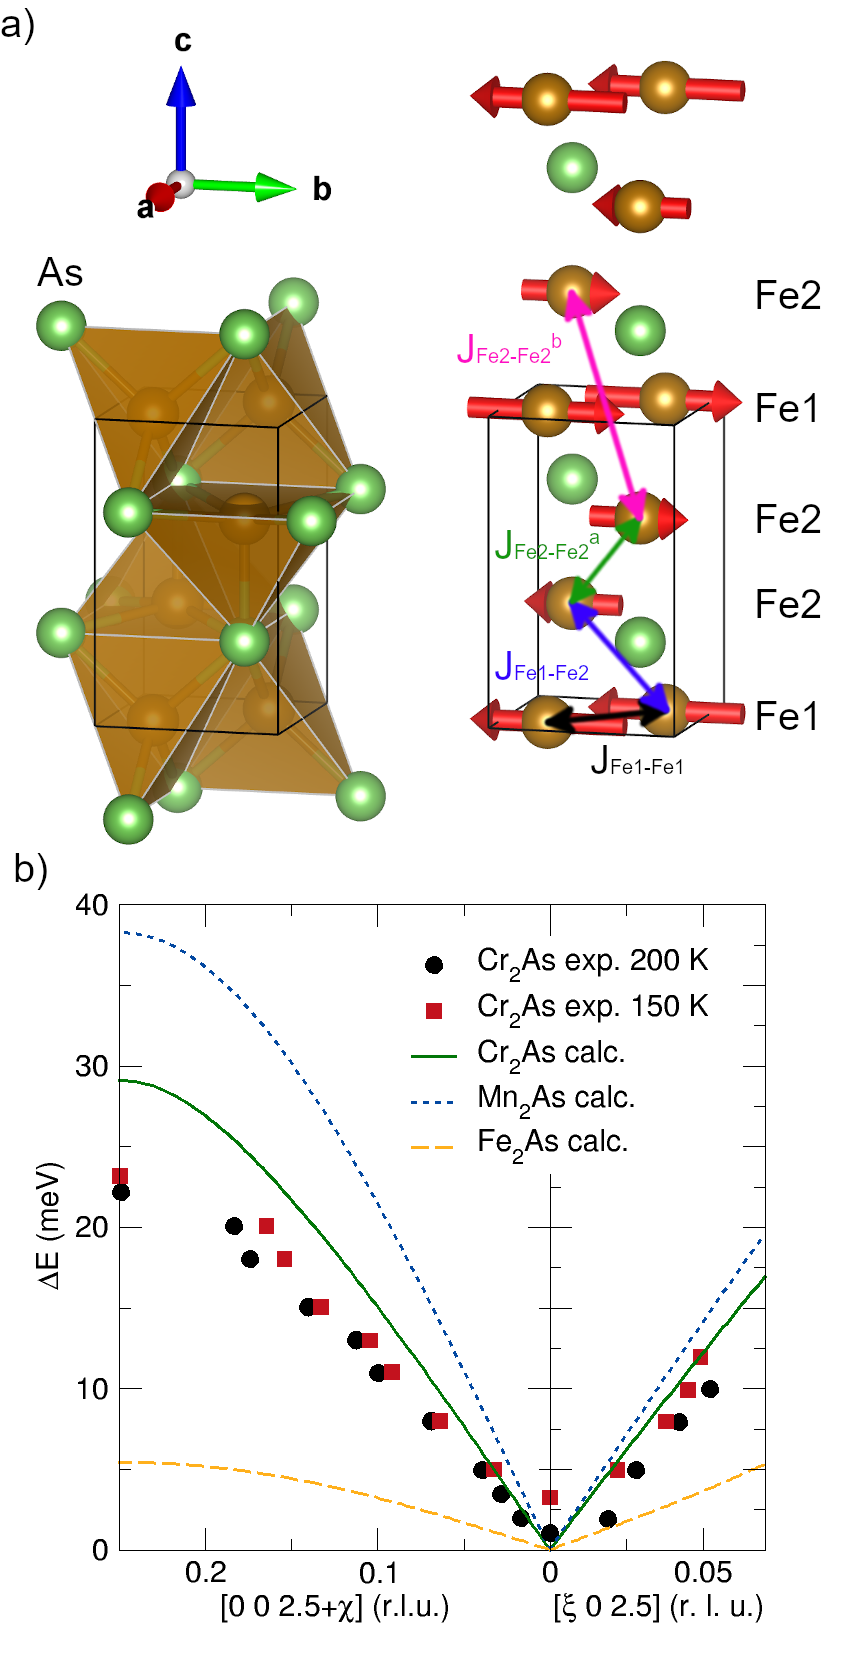
Fe2As contains two different metal atom sites, Fe1 and Fe2, as shown in Figure 1(a). Fe1 atoms are centered in FeAs4 tetrahedra, which are arranged to form a square planar grid similar to the anti-PbO type Fe–As layers in iron arsenide superconductors. Fe2 atoms form edge-sharing FeAs5 square pyramids. Fe2As has a magnetic unit cell that is twice the length of its chemical unit cell along .Zhang et al. (2013); Katsuraki and Achiwa (1966) It is the Fe moments that we are concerned about in the magnon spectrum, but the As contributes to the phonons. The magnetic ground state of Fe2As was determined using single crystal and powder neutron diffraction and consists of alternating slabs of ferromagnetically aligned trilayers of Fe atom planes (Fe2–Fe1–Fe2) as shown in Figure 1(a).Katsuraki and Achiwa (1966) Exchange interactions obtained from spin polarized, relativistic Korringa-Kohn-Rostoker (SPRKKR) calculations indicate a strong nearest-neighbor ferromagnetic (FM) Fe1-Fe1 coupling and a weak nearest-neighbor antiferromagnetic (AFM) Fe2-Fe2 interaction.Zhang et al. (2013) The Fe-Fe exchange interactions, modeled using SPRKKR calculations, have been explained based on crystal orbital Hamilton population (COHP) curves. The strong Fe1-Fe1 exchange coupling is a result of a strong Fe1-Fe1 anti-bonding orbital overlap as opposed to a weak non-bonding orbital overlap in Fe2-Fe2 nearest neighbor exchange interaction. This case is opposite for Mn2As.Zhang et al. (2013) Unlike Fe2As, there is frustration in Mn2As and Cr2As and the magnetic ground state is decided by the dominant exchange interactions.Zhang et al. (2013)
To date, the only direct measurements of exchange interactions in M2As compounds are triple-axis inelastic neutron scattering (INS) measurements on Cr2As single crystals.Yuzuri (1960); Ishimoto et al. (1995) Magnon spectra calculated from linear spin wave theory using SPRKKR-derived exchange coupling values from Zhang et al. are plotted on the experimental points from Ishimoto, et al. in Figure 1(b).Zhang et al. (2013); Ishimoto et al. (1995) The experimental magnon spectra roughly agrees with the calculated magnon spectra for the slice plotted in the limited range of reciprocal space. The corresponding magnon spectra for Fe2As and Mn2As from exchange constants in Zhang et al. are also shown in Figure 1(b). Since the transition temperature (TN or TC) is generally proportional to the strength of exchange interactions in a material,Krishnan (2016) the slope of the spin waves along both and direction is consistent with TN of the materials (TN = 573 K, 393 K and 373 K for Mn2As, Cr2As and Fe2As respectively).Zhang et al. (2013) Torque magnetometry measurements have been carried out on Fe2As single crystals at different temperatures to determine the four-fold in-plane anisotropy constants.Yang et al. (2020); Achiwa et al. (1967) From these measurements, it is clear that the in-plane anisotropy in Fe2As is very small ( 1 eV) and cannot be resolved using INS measurements.
Given the technological implications of possible data storage, and the limited momentum space previously examined, a full picture of magnon spectra in metallic antiferromagnets is needed to determine the exchange interactions, and to validate methods of their calculation. Such direct verification has been elusive, and is especially important in highly-correlated 3 systems. Fe2As single crystals have been grown in centimeter scale,Katsuraki and Achiwa (1966) making it an ideal candidate to study magnon spectra. In this paper, we report the growth of large Fe2As single crystals and carry out time-of-flight neutron scattering measurements at different temperatures. We identify phonon intensities by comparing with density functional theory-calculated phonon spectra and compare magnon spectra with the reported exchange coupling values. Finally, we refine the exchange coupling values against the INS data to obtain accurate values.
II Methods
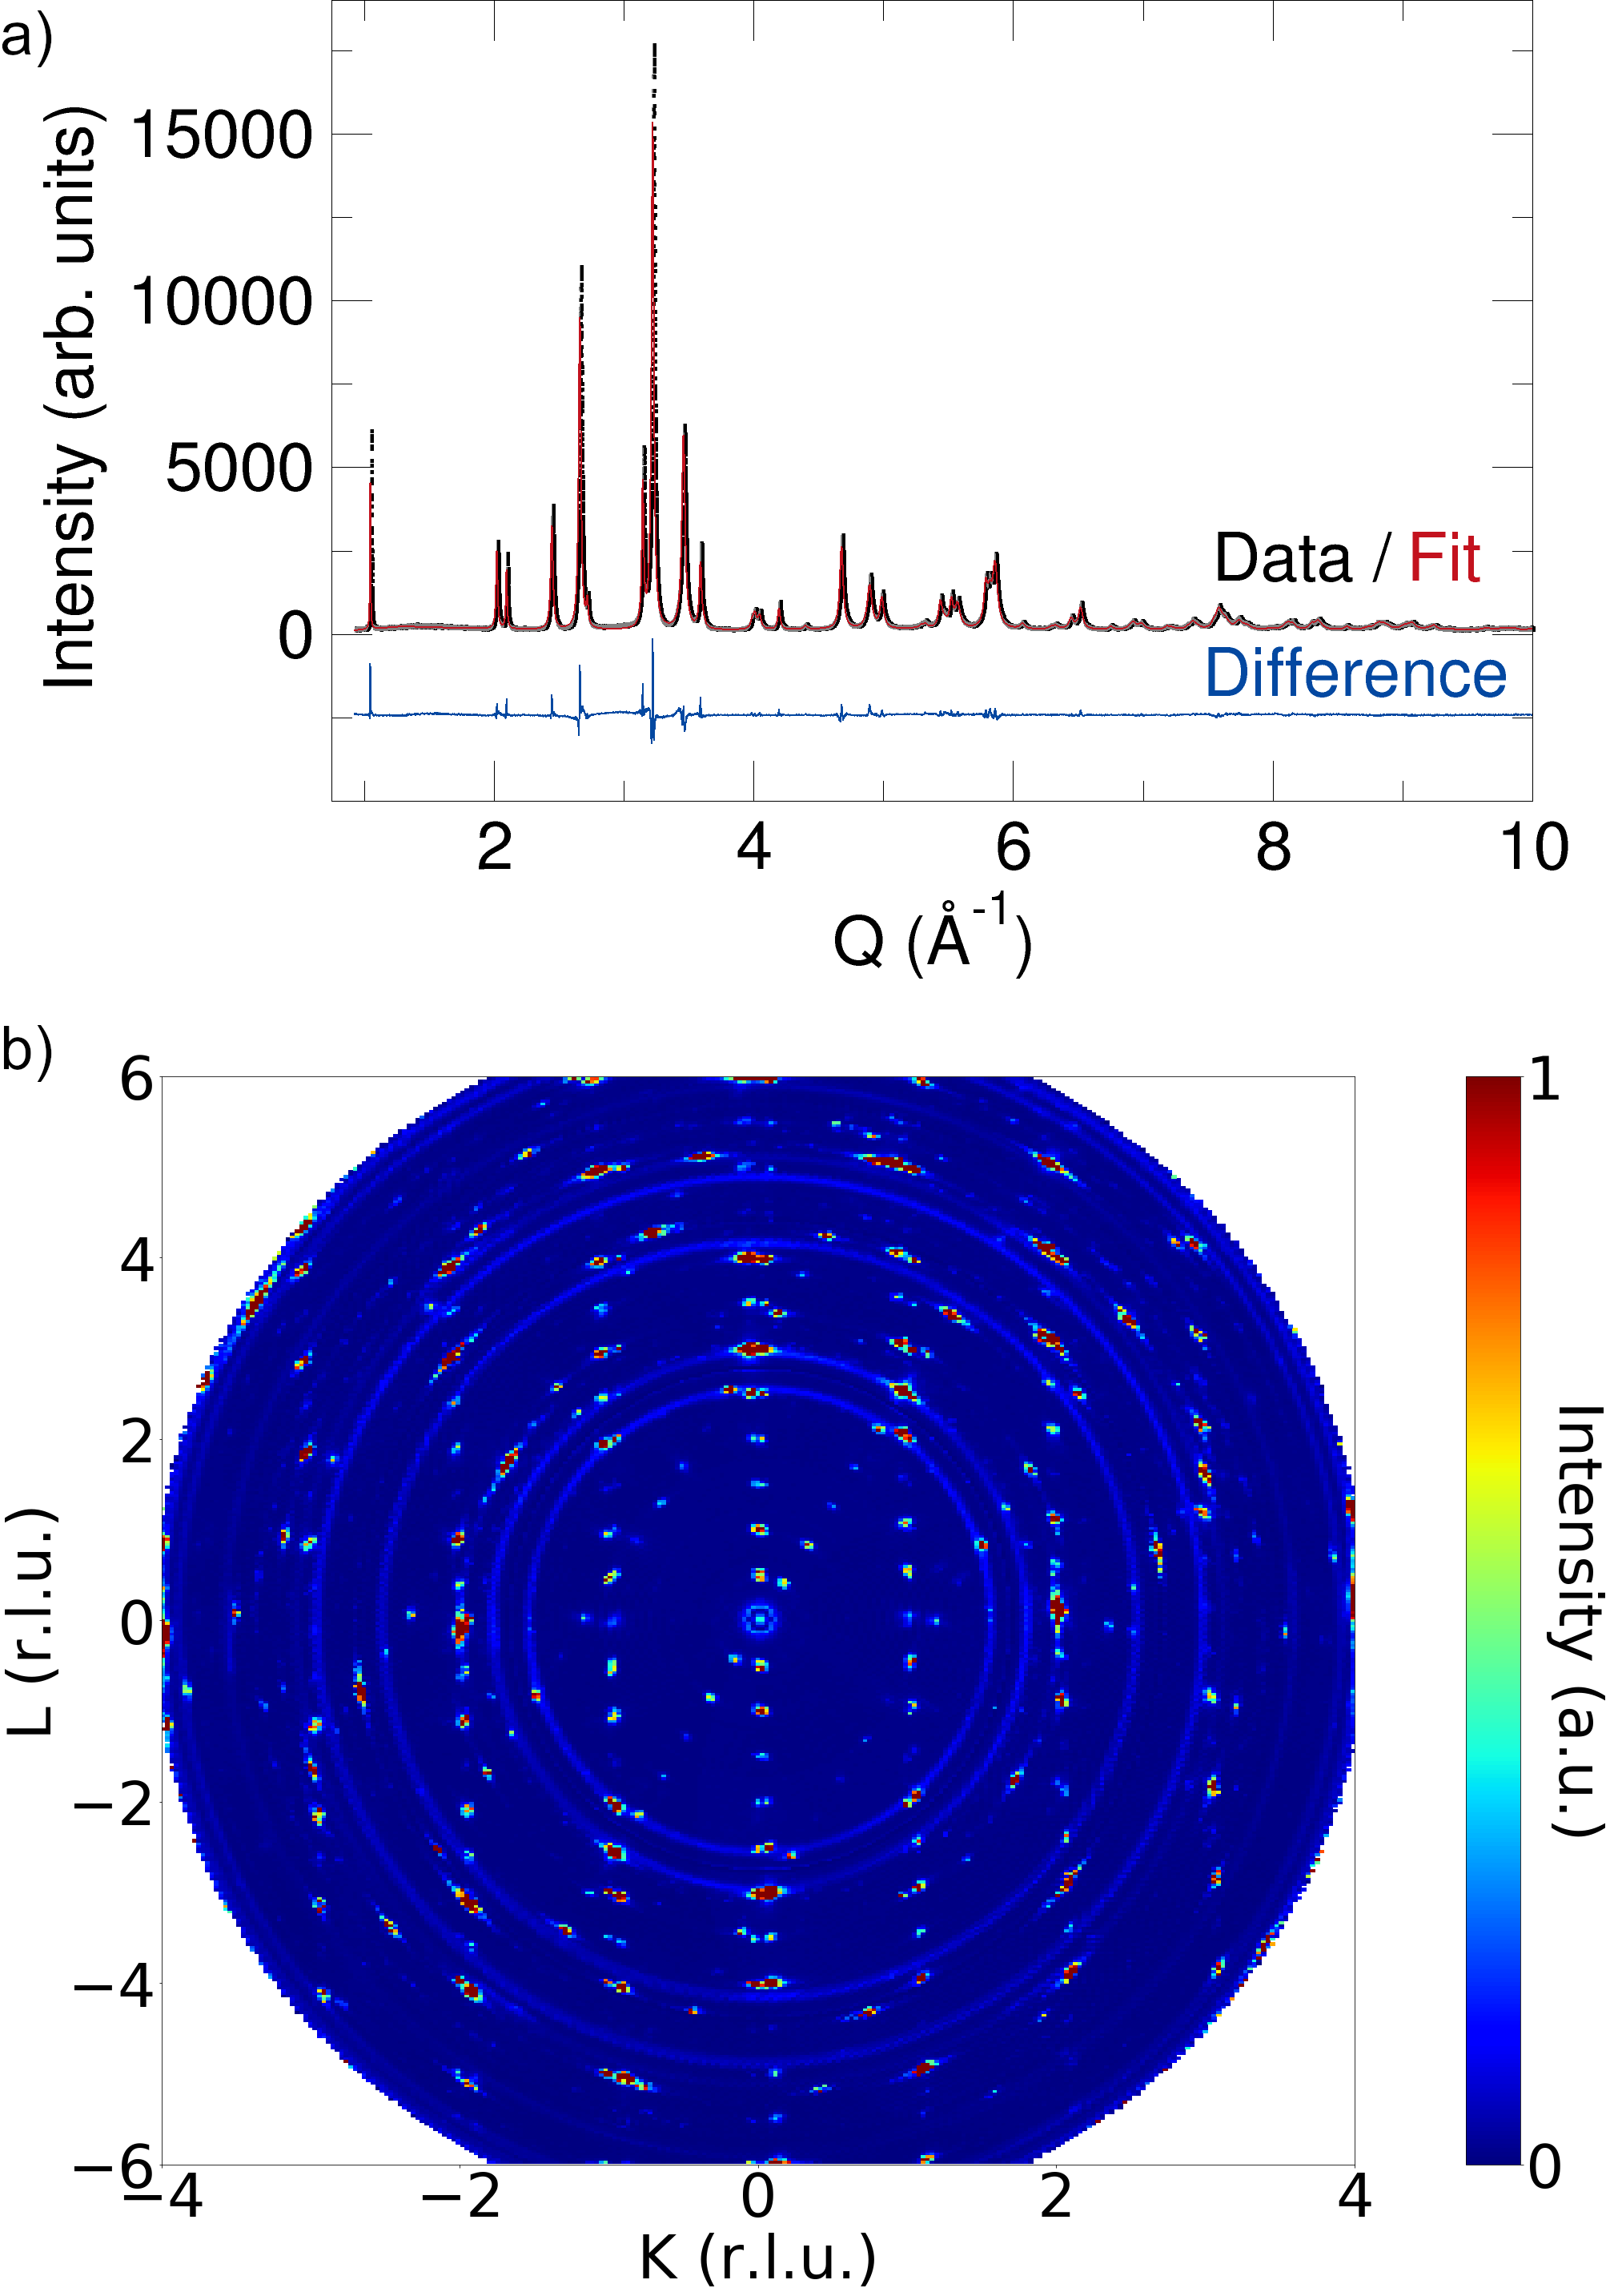

Large crystals (about 1 cm in length with a mass of about 3 g) were grown from the elements. Fe (99.99% metals basis) and As (99.9999% metals basis) powders were mixed in 2:1 molar ratio inside an Ar filled glove box and vacuum sealed inside a 7 mm inner diameter quartz tube. The tube was heated to 600∘C at 1∘C/min and held for 6 hours, heated to 975∘C at 1∘C/min and held for 1 hour, cooled to 900∘C at 1∘C/min and held for 1 hour, then allowed to furnace cool at approximately 10∘C/min to room temperature. The resulting crystals were silver-black in color and produced a mirror like finish when cleaved as shown in Figure S1. The phase purity was confirmed using synchrotron powder X-ray diffraction at beamline 11-BM of the Advanced Photon Source in Argonne National Laboratory. Rietveld analysis of the synchrotron data is shown in Figure 2(a).
The large Fe2As single crystals were gently tapped using a pestle to reveal sharp cleaved surfaces along the plane. Five cleaved crystals of Fe2As, with a total mass of 9 g, were co-aligned onto the base of an Al can and checked with a Multiwire Laue setup at the Spallation Neutron Source (SNS)Mason et al. (2006) in Oak Ridge National Laboratory (ORNL). The individual crystals were wrapped in Al foil and sewed to Al shims using Al wires as shown in Figure S2(a) and (b).sup One of the five crystals became misaligned, which can be seen in the elastic-scattering slice along plane in Figure 2(b). Accordingly, regions are selected here from constant energy slices where the effect of the misaligned crystal is minimized. The simulated phonon and magnon spectra do not include the intensity from the misaligned crystal to provide better clarity of the data. Details regarding the intensities from misalignment are provided in Supplementary Materials.sup
The inelastic neutron scattering measurement of Fe2As was carried out at the ARCS (Wide Angular-Range Chopper Spectrometer) beamlineAbernathy et al. (2012) of the SNS at ORNL. For measurements at base temperature (about 5 K) and 200 K, the can containing the crystal array was mounted onto a closed cycle refrigerator (CCR) such that the horizontal plane was perpendicular to the axis of rotation. For measurement at 400 K (above = 353 K), the crystal array was removed from the can and mounted directly to the CCR. The crystal array was rotated by 360∘ at 1∘ steps in the horizontal plane. At base temperature, measurements were performed at , 70, 200 and 300 meV. Additional measurements at 70 meV were performed at 200 and 400 K. Chopper settings were chosen to provide the optimum range and resolution conditions, based on Lin, et al. (2019).Lin et al. (2019) For and 70 meV, the 100 meV Fermi chopper was spun at 300 and 480 Hz respectively. For and 300 meV, the 700 meV chopper was spun at 540 and 420 Hz respectively. Both choppers have 1.5 mm slit spacing.
Data processing (slicing, folding, and gaussian smoothing) was performed using Mantid.Arnold et al. (2014) The reciprocal lattice units for Fe2As along (same as ) and correspond to 1.73 Å-1 and 1.05 Å-1, respectively. Simulated magnon spectra were calculated and refined using the SpinW MATLAB library module, which can solve the spin Hamiltonian using numerical methods and linear spin wave theory.Toth and Lake (2015) In SpinW, we use a spin-only () Hamiltonian based on isotropic exchange interactions : .
Density-functional theory (DFT) calculations were performed using the Vienna Ab-Initio Simulation Package Kresse and Furthmüller (1996); Kresse and Joubert (1999) (VASP). The projector-augmented wave Blöchl (1994) (PAW) scheme was used to describe the electron-ion interaction. Kohn-Sham states are expanded into a plane-wave basis up to a kinetic-energy cutoff of 600 eV. A Monkhorst-Pack (MP) Monkhorst and Pack (1976) -point grid was used to sample the Brillouin zone. Exchange and correlation was described using the generalized-gradient approximation (GGA) in the formulation by Perdew, Burke, and Ernzerhof.Perdew et al. (1996) The phonon dispersion was computed with the phonopy package Togo and Tanaka (2015) based on the finite displacement method with total energies from DFT. This calculation used a supercell and a MP -point grid. The simulated phonon INS spectra were computed using OCLIMAX Cheng et al. (2019) using all phonon eigenvalues from DFT, represented on a reciprocal-space grid. All simulations, in particular all atomic geometry relaxations and phonon dispersion calculations, were performed including noncollinear magnetism and the fully relativistic spin-orbit coupling interaction Steiner et al. (2016). The instrument parameters used in OCLIMAX correspond to a high resolution measurement at ARCS with an meV.
III Results and Discussion
Figures 3(a) and 3(d) show the inelastic neutron scattering spectra of Fe2As at K and 70 meV. The corresponding simulated phonon spectra are shown in Figures 3(b) and 3(e), respectively. Clearly, the phonon contributions form the majority of the experimental spectra, with intensity increasing with . The weak intensity below meV at and in the experimental data in Figure 3(a) is an overlapping phonon band from a misaligned crystal, as seen in Figure 2(b) and Figure S3(b).sup The group velocities extracted from the three acoustic phonon modes near along (1.215, 2.903, 5.002 km/s) and (1.745, 1.846, 5.762 km/s) indicate stiffness constants that are the same order of magnitude along perpendicular directions.
The clearest discrepancy between the experimental spectrum in Figure 3(a) and the calculated phonon spectrum in Figure 3(b) is the steep excitation arising from . To a first approximation, this magnon mode agrees with the calculated magnon spectrum in Figure 3(c), which has a single excitation visible at . When viewed along , the presence of two Fe atoms along and three Fe atoms along in the Fe2As chemical unit cell means that the periodicities of the observed phonon and magnon spectra are 2 and 3 along and , respectively.
| Fe1-Fe1 (JFe1-Fe1) | Fe1-Fe2 (JFe1-Fe2) | Fe2-Fe2 (J) | Fe2-Fe2* (J) | Reduced | |
|---|---|---|---|---|---|
| Distance (Å) | 2.547 | 2.6859 | 3.2774 | 4.7160 | |
| Zhang et al. | -25.4 | -6.52 | 3.52 | -8.52 | 54.55 |
| Fit | -48.37(25) | -4.42(25) | 5.16(12) | -8.52 | 6.47 |
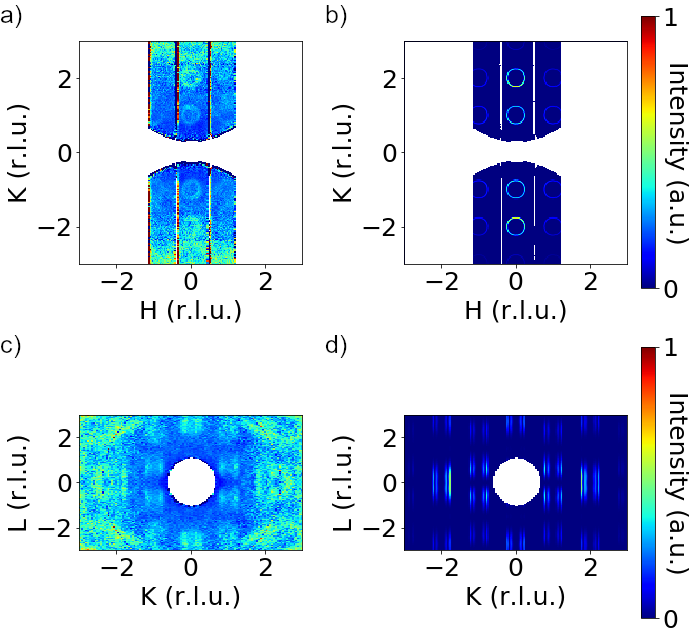
From DFT SPRKKR-derived exchange coupling values in Zhang et al.,Zhang et al. (2013) magnon spectra were calculated using the linear spin wave theory and simulated with an energy binning of 3 meV, which corresponds to our experimental resolution near the elastic limit with = 70 meV. Figures 3(c) and 3(f) show the magnon spectra along and directions, respectively. All the intensities in Figures 3(a) and 3(d) are accounted for in the simulated phonon and magnon spectra. The spectral weight of the magnons is mostly negligible along except for the locations shown in Figure 3(f). Constant-energy slices at = 25 meV in the and planes are shown in Figure 4(a,c). The simulated magnon spectra in Figure 4(b,d) give excellent reproduction of the corresponding INS data. Smaller magnon circles in Figure 4(a) as compared to the ones in Figure 4(b) indicate the possibility of stronger in-plane exchange interactions than those reported in Zhang et al.Zhang et al. (2013)
On quick inspection of Figure 3(c), the energy dependence along appears to be a simple 1-D Heisenberg FM spin chain where the magnon spectrum varies as ,Stancil and Prabhakar (2009) being the interatomic spacing for the FM chain along . Since the spins in Fe2As are all aligned parallel to each other along , the exchange interactions are consistent with the ground state. However, the spectrum is repeated every two reciprocal lattice units along since the unit cell contains two Fe atoms along . The magnon spectrum along in Figure 3(f) has a similar dependence as seen in a 1-D Heisenberg AFM spin chain where is the interatomic spacing for the AFM chain along . Unlike a 1-D Heisenberg AFM spin chain, however, Fe2As contains AFM-stacked trilayers of Fe atoms. The dispersion of the spin waves in Figure 3(a,d) indicate a strong FM coupling along and weak trilayer AFM coupling along as also confirmed from the exchange coupling values in Zhang et. al. (2013)Zhang et al. (2013) in Table 1.
From torque magnetometry measurements in the plane, the four-fold in-plane anisotropy in Fe2As at liquid nitrogen temperatures was reported to be around 700 erg/g, which is 0.3 eV/cell.Achiwa et al. (1967) Recent measurements at 5 K conclude that this quantity is much lower than previously reported at 0.074 eV/cell (150 J/m3) and it deceases to zero at around 150 K.Yang et al. (2020) The out-of-plane 2-fold anisotropy value was estimated using DFT calculations to be 410 eV/cell (-830 kJ/m3).Yang et al. (2020) A similarly small anisotropy was reported for CuMnAs using relativistic calculations where the in-plane anisotropy was calculated to be less than 1 eV/cell and the out-of-plane value was reported to be 127 eV/cell.Wadley et al. (2015) Our ARCS experimental resolution in near the elastic limit is around 3 - 5% of , so anisotropy in Fe2As can be neglected.
The calculated magnon spectra using exchange constants from Zhang et al.Zhang et al. (2013) underestimate the magnon energy along (by about 24% at ). Ideally, refinement of the magnon spectra with SpinWToth and Lake (2015) should extract more accurate exchange constant values. Along , as shown in Figure 3(f), even small integration of in the orthogonal directions causes significant bleeding over of intensity due to the steep magnon modes in the and directions. The same effect is seen for , shown in Figure S4(c).sup Hence, the calculated magnon spectra in Figure 3(f) was assumed to be correct and points were taken from the calculated magnon spectra along . This ensures a net weak AFM coupling along for the purpose of refinement. Higher-energy INS data collected at 5 K using meV and 300 meV are shown in Figures S5(a,b).sup As shown in Figures S5, we see that the scattering extends up beyond 120 meV. We did not use this data in the fits as the itinerant nature of the moments at this energy leads to significant damping that blurs the mode position. Nevertheless the results obtained from the fits are consistent with this scattering. Only the INS data obtained from meV and 70 meV were considered for refinement. From high temperature susceptibility measurements of Fe2As,Katsuraki and Achiwa (1966) the effective total moment per Fe is estimated as 4.66 averaged over the two sublattices. The ordered moment, which is estimated by neutron diffraction in Fe1 = 0.95 and Fe2 = 1.52 , is lower than 4.66 .Katsuraki and Achiwa (1966); Zhang et al. (2013) So, the rest of the moment can be assumed to be itinerant or short-ranged. The extracted average total moment of the Fe sublattices seems unusually high and well-calibrated high temperature susceptibility measurements are thus warranted. The set of experimental data points used to refine the exchange interactions is shown in Figure S6.sup Data points were collected by making horizontal line cuts across the magnon spectra along . Vertical line cuts were dominated by the flatter phonon modes. Hence, the standard deviation of energy for the purpose of refinement was assumed to be a constant of 1 meV.
Fe2As is expected to contain a strong Fe1-Fe1 exchange interaction due to a strong anti-bonding interaction as seen in crystal orbital Hamilton population curves.Zhang et al. (2013) The Fermi level crosses a narrow band along the – Brillouin zone boundary. Weak Fe2-Fe2 interaction is expected due to the weak antibonding and orbital overlap at point . However, there is a significant overlap of the Fe2 and As orbitals indicating a possibility of strong superexchange interaction.Zhang et al. (2013) The Fe1-Fe1 and Fe1-Fe2 nearest neighbor exchange interactions can be attributed to direct exchange and the nearest-neighbor and next-nearest-neighbor (NNN) Fe2-Fe2 exchange interactions can be attributed to indirect exchange although there is some direct exchange also possible in the nearest neighbor Fe2-Fe2 exchange interactions.Zhang et al. (2013) Strong indirect exchange interactions have been reported for MnFeAs, another compound in the Cu2Sb structure type, using SPRKKR calculations.Zhang and Miller (2015) From the study of MnFeAs, we can say that there are two possible contributions to the indirect exchange interactions in this material. One effect is due to superexchange interactions mediated by As atoms and the other effect arises from RKKY interactions due to the compound being metallic.Zhang and Miller (2015)
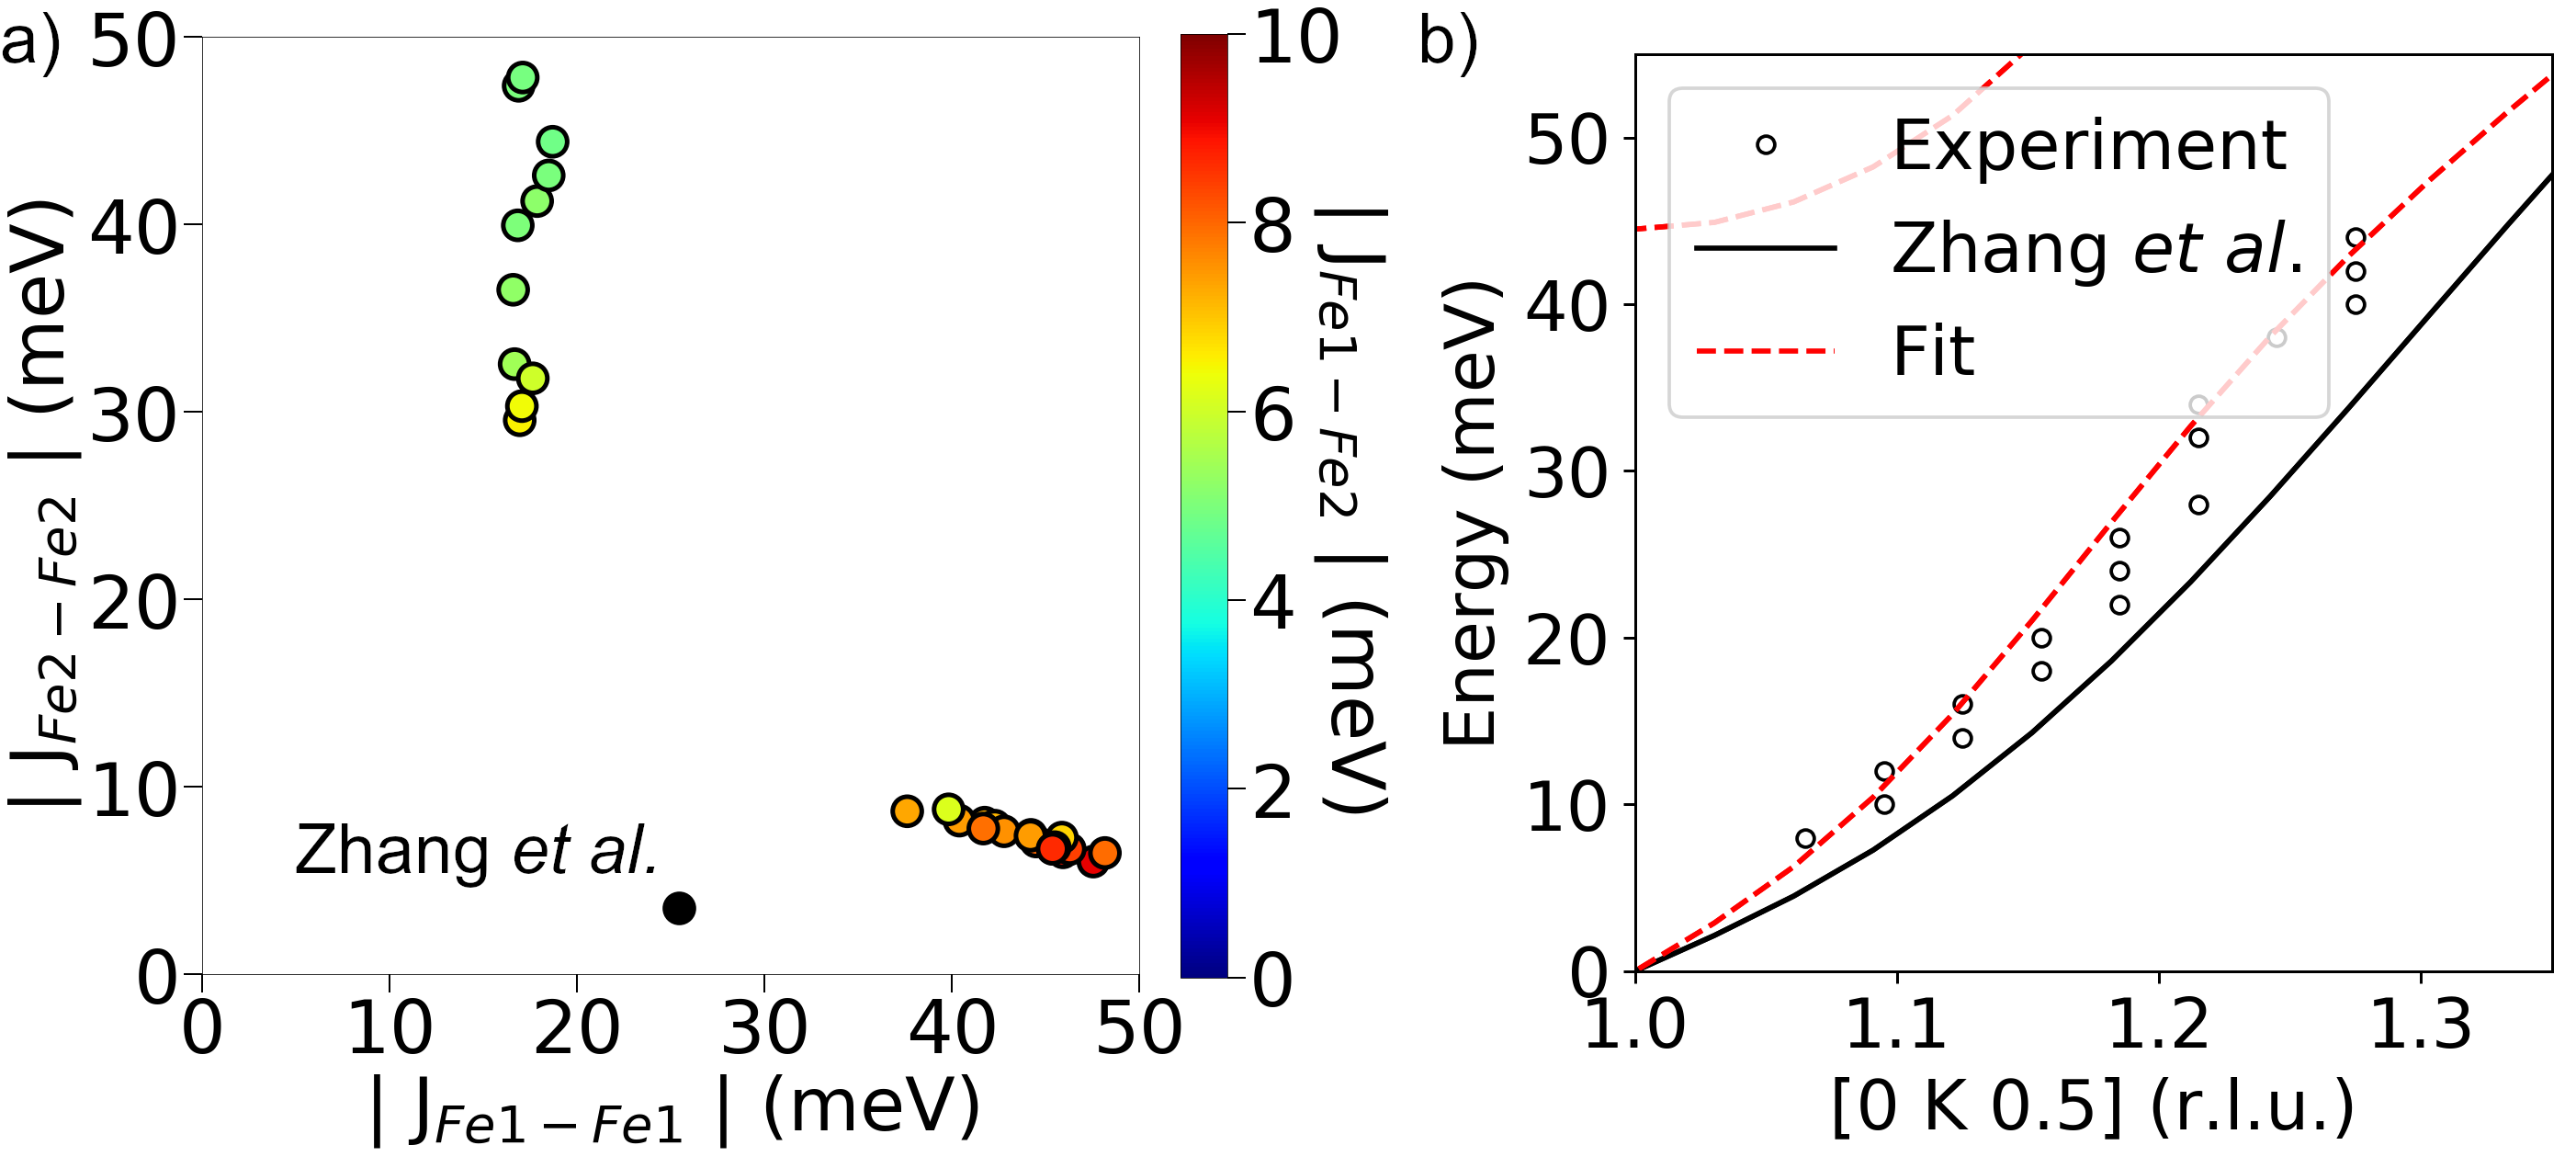
The smallest number of exchange coupling constants required to produce magnon modes along are the Fe1-Fe2 and Fe2-Fe2 nearest-neighbor interactions. However, the fit is poor (reduced = 9.03) and is greatly improved upon adding a third , the other nearest-neighbor exchange interaction Fe1-Fe1. The refinement with three was carried out using the particle swarm optimization technique with a limit of 20 iterations. Selecting points having reduced from the result of 50 runs, Figure 5(a) shows the exchange constants obtained when the magnon spectra is refined to a model containing only the three nearest-neighbor exchange interactions. We can roughly divide the points into two clusters. The cluster of exchange coupling values with strong Fe2-Fe2 nearest-neighbor interactions are incorrect since we know from previous computational studies that Fe2As should have nearest neighbor strong Fe1-Fe1 coupling and a weak Fe2-Fe2 coupling.Zhang et al. (2013) Also, the intensity of the magnon modes in the simulated magnon spectra for this set of arising from [0 1 0.5] is weak, as shown in Figure S7(a),sup which is invalidated by the experimental data. In the other cluster, the Fe1-Fe1 nearest neighbor exchange coupling seems much higher than the reported value of 25.4 meV. However, the simulated magnon spectra from any point in that three- cluster shows that the magnon spectra becomes mostly flat above 60 meV and also drops down below 60 meV near and 2 as shown in Figure S7(b).sup This is not seen in the experimental magnon spectra. The addition of a fourth is necessary to prevent the magnon spectra from flattening at high energies. Similar to Zhang et al.,Zhang et al. (2013) we can choose the NNN Fe2-Fe2 exchange interaction as the fourth exchange interaction for refinement.
The effect of adding a NNN Fe2-Fe2 exchange interaction is mainly at higher energies where the experimental spectra are unresolved. Thus a fourth is necessary, but not refinable from INS data. We fixed the value of the Fe2-Fe2 NNN exchange interaction to that of Zhang et al.Zhang et al. (2013) and the remaining three nearest-neighbor exchange interactions were refined 50 times. Four of the runs converged to a reduced , as compared to for the rest of the runs. The mean exchange coupling value from the four runs is shown in Table 1 and the calculated magnon spectrum using linear spin wave theory is plotted in Figure 5(b). We can see that the Fe1-Fe1 nearest-neighbor exchange interaction is much stronger than the SPRKKR value, which was also seen in the earlier model with only three nearest-neighbor exchange interactions. One should note that, for the sake of optimization, an upper limit of 50 meV was kept for all exchange coupling constants. The value for Fe1-Fe1 exchange coupling is close to this limit. Given that the Fe1-As bond is shorter than one of the Fe2-As bonds, it is possible that there is also some superexchange component in the NNN Fe1-Fe2 interaction. The Fe1-Fe2 distance of 4.4 Å is also shorter than the NNN Fe2-Fe2 distance (4.4716 Å), allowing for possible RKKY interactions. Although we do not have enough experimental data to elucidate the role of this exchange interaction, it may not be neglected.
If AF materials are to be used in future MRAM devices, it is essential that the 4-fold in-plane anisotropy values surpass 10 meV so that the domains are stable at operating temperatures. Unlike CuMnAs, Fe2As is complicated by the presence of two different magnetic atom sites with different point groups. When the current is parallel to the Néel vector, the effective fields on the two Fe sublattices from the field-like torque are perpendicular to each other and the strength of the Fe1-Fe2 exchange interaction may play a role in the electrical switching of the Néel vector. Hence, it is important that we are able to predict and measure these interactions accurately. Similar to refining the magnon spectra from the experiment, the exchange coupling values obtained from SPRKKR calculations are also contingent on the chosen model. Exchange interactions obtained from ab-initio calculations are known to give largely different values than the experiment, as seen in the case of Mn3Sn.Park et al. (2018) Hence, a more robust determination of exchange energies is warranted. Future efforts could be aided by developing the capability to refine these values while considering magnon intensity quantitatively, and by evaluating metallic antiferromagnets where the higher-energy magnon dispersion is experimentally resolvable.
IV Conclusions
The experimental phonon spectra of Fe2As matches the simulated phonon spectra from DFT calculations very well. The simulated magnon spectra calculated using exchange coupling values from Zhang et al. agrees qualitatively with the experimental magnon spectra. The energy values are underestimated by about 20% along direction. The anisotropy values were deemed small enough to be neglected for the purpose of refinement and the magnon spectra was refined using a Heisenberg Hamiltonian. For the model used in Zhang et al., keeping the value of Fe2-Fe2 nearest neighbor interaction to be a constant, the Fe1-Fe1 nearest neighbor exchange interaction was estimated to be much stronger than previously calculated. The in-plane and out-of-plane phonon group velocities are the same order of magnitude, but the magnetic interactions are strongly 2D in nature. This shows that the 2D nature of the magnetism does not arise from weak out-of-plane bonding.
V Acknowledgments
This work was undertaken as part of the Illinois Materials Research Science and Engineering Center, supported by the National Science Foundation MRSEC program under NSF Award No. DMR-1720633. The characterization was carried out in part in the Materials Research Laboratory Central Research Facilities, University of Illinois. This work made use of the Illinois Campus Cluster, a computing resource that is operated by the Illinois Campus Cluster Program (ICCP) in conjunction with the National Center for Supercomputing Applications (NCSA) and which is supported by funds from the University of Illinois at Urbana-Champaign. This research is part of the Blue Waters sustained-petascale computing project, which is supported by the National Science Foundation (Awards No. OCI-0725070 and No. ACI-1238993) and the state of Illinois. Blue Waters is a joint effort of the University of Illinois at Urbana-Champaign and its National Center for Supercomputing Applications. This research used resources of the Spallation Neutron Source, a DOE Office of Science User Facility operated by Oak Ridge National Laboratory, and the Advanced Photon Source, a DOE Office of Science User Facility operated for the DOE Office of Science by Argonne National Laboratory under Contract No. DE-AC02-06CH11357. The authors thank Yan Wu, Huibo Cao and Douglas Abernathy for helpful discussions regarding the experiment.
References
- Baltz et al. (2018) V. Baltz, A. Manchon, M. Tsoi, T. Moriyama, T. Ono, and Y. Tserkovnyak, Rev. Mod. Phys. 90, 15005 (2018).
- Siddiqui et al. (2020) S. A. Siddiqui, J. Sklenar, K. Kang, M. J. Gilbert, A. Schleife, N. Mason, and A. Hoffmann, J. Appl. Phys. 128 (2020).
- Jungfleisch et al. (2018) M. B. Jungfleisch, W. Zhang, and A. Hoffmann, Phys. Lett. A 382, 865 (2018).
- Železný et al. (2018) J. Železný, P. Wadley, K. Olejník, A. Hoffmann, and H. Ohno, Nat. Phys. 14, 220 (2018).
- Wadley et al. (2016) P. Wadley, B. Howells, J. Zelezny, C. Andrews, V. Hills, R. P. Campion, V. Novak, K. Olejnik, F. Maccherozzi, S. S. Dhesi, S. Y. Martin, T. Wagner, J. Wunderlich, F. Freimuth, Y. Mokrousov, J. Kunes, J. S. Chauhan, M. J. Grzybowski, A. W. Rushforth, K. W. Edmonds, B. L. Gallagher, and T. Jungwirth, Science 351, 587 (2016).
- Grzybowski et al. (2017) M. J. Grzybowski, P. Wadley, K. W. Edmonds, R. Beardsley, V. Hills, R. P. Campion, B. L. Gallagher, J. S. Chauhan, V. Novak, T. Jungwirth, F. Maccherozzi, and S. S. Dhesi, Phys. Rev. Lett. 118, 1 (2017).
- Wadley et al. (2018) P. Wadley, S. Reimers, M. J. Grzybowski, C. Andrews, M. Wang, J. S. Chauhan, B. L. Gallagher, R. P. Campion, K. W. Edmonds, S. S. Dhesi, F. Maccherozzi, V. Novak, J. Wunderlich, and T. Jungwirth, Nat. Nanotechnol. 13, 362 (2018).
- Matalla-Wagner et al. (2019) T. Matalla-Wagner, M. F. Rath, D. Graulich, J. M. Schmalhorst, G. Reiss, and M. Meinert, Phys. Rev. Appl. 12, 064003 (2019).
- Meinert et al. (2018) M. Meinert, D. Graulich, and T. Matalla-wagner, Phys. Rev. Appl. 9, 64040 (2018).
- Bodnar et al. (2019) S. Y. Bodnar, M. Filianina, S. P. Bommanaboyena, T. Forrest, F. Maccherozzi, A. A. Sapozhnik, Y. Skourski, M. Kläui, and M. Jourdan, Phys. Rev. B 99, 8 (2019).
- Wadley et al. (2013) P. Wadley, V. Novák, R. P. Campion, C. Rinaldi, X. Martí, H. Reichlová, J. Zelezný, J. Gazquez, M. A. Roldan, M. Varela, D. Khalyavin, S. Langridge, D. Kriegner, F. Máca, J. Masek, R. Bertacco, V. Holy, A. W. Rushforth, K. W. Edmonds, B. L. Gallagher, C. T. Foxon, J. Wunderlich, and T. Jungwirth, Nat. Commun. 4, 2322 (2013).
- Hills et al. (2015) V. Hills, P. Wadley, R. P. Campion, V. Novak, R. Beardsley, K. W. Edmonds, B. L. Gallagher, B. Ouladdiaf, and T. Jungwirth, J. Appl. Phys. 117, 172608 (2015).
- Wadley et al. (2015) P. Wadley, V. Hills, M. R. Shahedkhah, K. W. Edmonds, R. P. Campion, V. Novák, B. Ouladdiaf, D. Khalyavin, S. Langridge, V. Saidl, P. Nemec, A. W. Rushforth, B. L. Gallagher, S. S. Dhesi, F. MacCherozzi, J. Železný, and T. Jungwirth, Sci. Rep. 5, 17079 (2015).
- Saidl et al. (2017) V. Saidl, P. Nemec, P. Wadley, V. Hills, R. P. Campion, V. Novák, K. W. Edmonds, F. Maccherozzi, S. S. Dhesi, B. L. Gallagher, F. Trojánek, J. Kunes, J. Železny, P. Malý, and T. Jungwirth, Nat. Photonics 11, 91 (2017).
- Yang et al. (2019) K. Yang, K. Kang, Z. Diao, A. Ramanathan, M. H. Karigerasi, D. P. Shoemaker, A. Schleife, and D. G. Cahill, Phys. Rev. Materials 3, 124408 (2019).
- Yang et al. (2020) K. Yang, K. Kang, Z. Diao, M. H. Karigerasi, D. P. Shoemaker, A. Schleife, and D. G. Cahill, arXiv (2020), arXiv:2006.04192 .
- Nateprov et al. (2011) A. N. Nateprov, V. C. Kravtsov, V. Fritsch, and H. von Löhneysen, Surf. Eng. Appl. Elect. 47, 540 (2011).
- Yuzuri (1960) M. Yuzuri, J. Phys. Soc. Jpn. 15, 2007 (1960).
- Yuzuri and Yamada (1960) M. Yuzuri and M. Yamada, J. Phys. Soc. Jpn. 15, 1845 (1960).
- Katsuraki and Achiwa (1966) H. Katsuraki and N. Achiwa, J. Phys. Soc. Jpn. 21, 2238 (1966).
- Železný et al. (2014) J. Železný, H. Gao, K. Výborný, J. Zemen, J. Mašek, A. Manchon, J. Wunderlich, J. Sinova, and T. Jungwirth, Phys. Rev. Lett. 113, 1 (2014).
- Železný et al. (2017) J. Železný, H. Gao, A. Manchon, F. Freimuth, Y. Mokrousov, J. Zemen, J. Mašek, J. Sinova, and T. Jungwirth, Phys. Rev. B 95, 1 (2017).
- Zhang et al. (2013) Y. Zhang, J. Brgoch, and G. J. Miller, Inorg. Chem. 52, 3013 (2013).
- Ishimoto et al. (1995) K. Ishimoto, M. Okonogi, K. Ohoyama, K. Nakajima, M. Ohashi, H. Yamauchi, Y. Yamaguchi, and S. Funahashi, Physica B 213-214, 336 (1995).
- Krishnan (2016) K. M. Krishnan, Oxford University Press, Vol. First Edit (2016).
- Achiwa et al. (1967) N. Achiwa, S. Yano, and M. Yuzuri, J. Phys. Soc. Jpn. 22, 156 (1967).
- Mason et al. (2006) T. E. Mason, D. Abernathy, I. Anderson, J. Ankner, T. Egami, G. Ehlers, A. Ekkebus, G. Granroth, M. Hagen, K. Herwig, J. Hodges, C. Hoffmann, C. Horak, L. Horton, F. Klose, J. Larese, A. Mesecar, D. Myles, J. Neuefeind, M. Ohl, C. Tulk, X.-L. Wang, and J. Zhao, Physica B 385, 955 (2006).
- (28) See Supplemental Material for information on T0 choppers, Fe2As single crystals and crystal array, sample misalignment, INS spectra from high-energy neutrons and simulated magnon spectra.
- Abernathy et al. (2012) D. L. Abernathy, M. B. Stone, M. J. Loguillo, M. S. Lucas, O. Delaire, X. Tang, J. Y. Y. Lin, and B. Fultz, Rev. Sci. Instrum. 83, 015114 (2012).
- Lin et al. (2019) J. Y. Lin, A. Banerjee, F. Islam, M. D. Le, and D. L. Abernathy, Physica B 562, 26 (2019).
- Arnold et al. (2014) O. Arnold, J. C. Bilheux, J. M. Borreguero, A. Buts, S. I. Campbell, L. Chapon, M. Doucet, N. Draper, R. Ferraz Leal, M. A. Gigg, V. E. Lynch, A. Markvardsen, D. J. Mikkelson, R. L. Mikkelson, R. Miller, K. Palmen, P. Parker, G. Passos, T. G. Perring, P. F. Peterson, S. Ren, M. A. Reuter, A. T. Savici, J. W. Taylor, R. J. Taylor, R. Tolchenov, W. Zhou, and J. Zikovsky, Nucl. Instrum. Meth. A 764, 156 (2014).
- Toth and Lake (2015) S. Toth and B. Lake, J. Phys-Condens. Mat. 27, 166002 (2015).
- Kresse and Furthmüller (1996) G. Kresse and J. Furthmüller, Phys. Rev. B 54, 11169 (1996).
- Kresse and Joubert (1999) G. Kresse and D. Joubert, Phys. Rev. B 59, 1758 (1999).
- Blöchl (1994) P. E. Blöchl, Phys. Rev. B 50, 17953 (1994).
- Monkhorst and Pack (1976) H. J. Monkhorst and J. D. Pack, Phys. Rev. B 13, 5188 (1976).
- Perdew et al. (1996) J. P. Perdew, K. Burke, and M. Ernzerhof, Phys. Rev. Lett. 77, 3865 (1996).
- Togo and Tanaka (2015) A. Togo and I. Tanaka, Scr. Mater. 108, 1 (2015).
- Cheng et al. (2019) Y. Q. Cheng, L. L. Daemen, A. I. Kolesnikov, and A. J. Ramirez-Cuesta, J. Chem. Theory Comput. 15, 1974 (2019).
- Steiner et al. (2016) S. Steiner, S. Khmelevskyi, M. Marsmann, and G. Kresse, Phys. Rev. B 93, 224425 (2016).
- Stancil and Prabhakar (2009) D. D. Stancil and A. Prabhakar, Springer US, Vol. First Edit (2009).
- Zhang and Miller (2015) Y. Zhang and G. J. Miller, J. Phys. Chem. C 119, 580 (2015).
- Park et al. (2018) P. Park, J. Oh, K. Uhlírova, J. Jackson, A. Deák, L. Szunyogh, K. H. Lee, H. Cho, H.-l. Kim, H. C. Walker, D. Adroja, V. Sechovský, and J.-G. Park, npj Quantum Mater. 3, 63 (2018).