Predicting the Citations of Scholarly Paper
Abstract
Citation prediction of scholarly papers is of great significance in guiding funding allocations, recruitment decisions, and rewards. However, little is known about how citation patterns evolve over time. By exploring the inherent involution property in scholarly paper citation, we introduce the Paper Potential Index (PPI) model based on four factors: inherent quality of scholarly paper, scholarly paper impact decaying over time, early citations, and early citers’ impact. In addition, by analyzing factors that drive citation growth, we propose a multi-feature model for impact prediction. Experimental results demonstrate that the two models improve the accuracy in predicting scholarly paper citations. Compared to the multi-feature model, the PPI model yields superior predictive performance in terms of range-normalized RMSE. The PPI model better interprets the changes in citation, without the need to adjust parameters. Compared to the PPI model, the multi-feature model performs better prediction in terms of Mean Absolute Percentage Error and Accuracy; however, their predictive performance is more dependent on the parameter adjustment.
keywords:
Scholarly Paper , Paper Potential Index , Multi-feature Model1 Introduction
There is an increasing interest in understanding the citation dynamics of scholarly paper and the evolution in science (Xia et al., 2017). So far, studies in this field have primarily been focused on success of science (Xia et al., 2016; Bai et al., 2016; Cao et al., 2016; Fiala and Tutoky, 2018; Zhang et al., 2017), academic collaboration networks (Panagopoulos et al., 2017), team science (Heidi, 2015) and scientific impact prediction (Bai et al., 2017). While citation serves as a popular indicator for measuring the research outcome, it is often required to estimate the future impact as well. For instance, research impact prediction helps in effective allocation of research funds (Clauset et al., 2017). An important challenge in scientific impact prediction is to characterize the change in citations over time, and it is important to identify the factors that affect citations of scholarly papers.
Previous studies have mainly focused on predicting the citations or analyzing future citation distributions. Some studies utilize machine learning algorithms such as Gradient Boosting Decision Tree (Sandulescu and Chiru, 2016), Support Vector Machine (Adankon and Cheriet, 2010), and XGBoost (Chen and Guestrin, 2016). To train the validity of the predictive models, crucial features have been identified for citation prediction, including early citations, journal impact factor, authors’ authority, journal reputation, topic of scholarly paper, and age (Petersen et al., 2014; Sarigöl et al., 2014; Yu et al., 2014). Some citation prediction studies have applied generative model to reflect the observation that older papers typically attracted higher citations (Newman, 2008), or to address some citation patterns that come with an initial period of growth followed by a gradual declined over time (Wang et al., 2008, 2013). More recently, Xiao et al. (2016) proposed a point process model to predict the long-term impact of individual publications based on early citations. Furthermore, Singh et al. (2017) has found that early influential citers negatively affected long-term scientific impact, possibly due to attention stealing, whereas non-influential early citers positively affected long-term scientific impact.
Inspired by the prior work Wang et al. (2008, 2013); Xiao et al. (2016); Singh et al. (2017), we model the Paper Potential Index (PPI) by considering the following factors: inherent quality of scholarly paper, scholarly paper impact decaying over time, early citations, and early citers’ impact. The PPI predictive model combines these factors and expands the Hawkes process, and it mainly depends on the inherent involution mechanism of paper citations with the following three properties: (1) Paper citation declines along with the decay of paper novelty over time; (2) The early citer’s impact can increase scholarly paper impact in the predictive model; (3) Early citations help retaining long term citations.
In addition, we propose a multi-feature predictive model, which considers author-based features, journal-based features, and citations feature. We compare the prediction results of the two models in terms of mean absolute error, root mean squared error, range-normalized RMSE, mean absolute percentage error and accuracy.
Main contributions of this paper include: (1) Introduction of PPI which reflects the potential impact of a scholarly article; (2) Consideration of scholarly paper impact decaying over time, scholarly papers’ quality, early citations, and early citing authors’ impact, to quantify the potential impact of scholarly articles; (3) Discussions on how PPI outperforms the existing multi-feature models in citation prediction.
2 Related work
Citation prediction of scholarly papers has been extensively investigated, and these studies are mostly based on the analysis of mixture of features, including author-based features (the number of authors, the country of the author’s institution, authors’ authority, etc.), journal-based features (the total citations of the journal, journal impact factor, keyword frequency of each journal, etc.), paper-based features (the topic of scholarly paper, scholarly paper length, keyword repetition in the abstract of a paper, the number of references, etc.), and other features such as institutional features (institutional rankings and reputation, etc.) In addition, Altmetrics are also employed to predict the citations of scholarly paper. Various investigations have been conducted to explore the correlation between Twitter activities and citation patterns (Peoples et al., 2016; Timilsina et al., 2016; Erdt et al., 2016). Seminal examples in citation prediction using mixture of features are summarized in Table 1. The three categories of features: author-based features, journal-based features, and citations feature are used in our multi-feature predictive model. In order to improve the performance of prediction, Author Impact Factor (AIF), Q value, H-index, Journal Impact Factor and citations are used to predict the citations of scholarly paper. The main difference between our multi-feature predictive model and the prior studies is the selection of features.
| source | author features | journal features | paper features | other features |
| Haslam et al. (2008) | the number of authors, first author gender | journal prestige | title length, the number of references | first author institution’s prestige |
| bornmann et al. (2012) | the number of authors, the reputation of the authors | the language of the publishing journal | citation count | citation performance of the cited references, reviewers’ ratings of importance |
| Livne et al. (2013) | H-index, g-index | journal prestige | citations | content similarity, graph density, clustering coefficient |
| Yu et al. (2014) | the number of authors, the country of the author’s institution, H-index | journal impact factor, total citations, 5-year impact factor, the cited half-life | the number of references, the reciprocal of the first-cited age of this paper | the document type |
| Singh et al. (2015) | H-index, author rank, past influence of authors, productivity, sociality, authority, versatility | journal rank, journal centrality, past influence of journals | publication count, citation count, novelty, topic rank, diversity | average countX, average citeWords |
| Robson and Mousquès (2016) | the number of authors, author name | the number of journal pages, journal prestige | the year of publication, title length, abstract length | special issue |
| Sohrabi and Iraj (2017) | the number of authors | title length, abstract length | SCImago quartile |
In order to analyze the efficiency of multi-feature for citation prediction, regression models are often used. Popular regression models for citation prediction include quantile regression (Robson and Mousquès, 2016), semi-continuous regression (Sohrabi and Iraj, 2017) and Gradient Boosted Regression Trees (GBDT) (Chen and Zhang, 2015). Generative models can also be used to predict the citations of scholarly papers (Li et al., 2015; Zhang et al., 2016). Wang et al. (2013) proposed a point process by identifying three fundamental mechanisms in paper impact prediction: preferential attachment (highly cited papers are more likely be cited again), decay rate, and fitness (capturing the inherent differences between papers) to predict the probability of a paper being cited. To characterize the citation dynamics of scientific papers, a nonlinear stochastic model of citation dynamics based on the copying-redirection-triadic closure mechanism was reported by Golosovsky and Solomon (2017).
3 Modeling citing behavior as a point process
3.1 Dataset
The American Physical Society (APS) dataset includes all papers published in 9 journals, including Physical Review A, Physical Review B, Physical Review C, Physical Review D, Physical Review E, Physical Review I, Physical Review L, Physical Review ST and Review of Modern Physics, from 1970 to 2013 (http://publish.aps.org/datasets). Each record in the APS dataset includes paper title, author names, author affiliations, date of publication, and a list of cited papers. Because the APS dataset does not provide unique author identifiers, we first do name disambiguation based on the method proposed by Sinatra et al. (2016) in our experiments. Two authors are considered to be the same individual if all of the following three conditions are fulfilled: (1) Last names of two authors are identical; (2) First names are identical or with the matched initial; (3) One of the following is true: the two authors cited each other at least once; the two authors share at least one co-author; The two authors share at least one similar affiliation. We select 183,336 papers as experimental data in the APS dataset from 1978 to 1998. Scholarly papers with greater or equal to 5 citations within the first 5 years of publication are used as the training data, and their citations in the subsequent 10 years are used as the testing data.
3.2 Prediction model
Intrinsic potential Citations reflect the impact of a research paper, which correspond to the authors’ impact which can be quantified as for an author (Sinatra et al., 2016). A scholar with high is expected to publish high-impact publications. In this paper, we use the parameter to indicate the intrinsic potential of a paper’s impact.
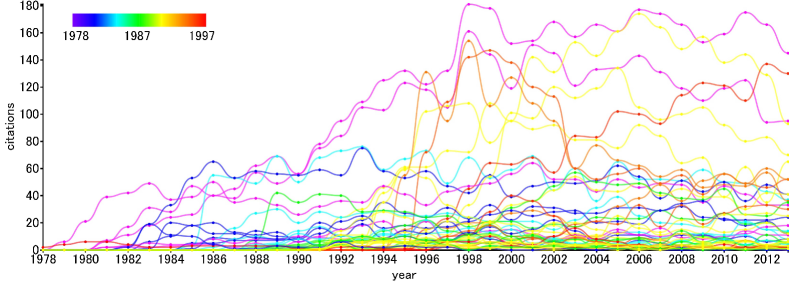
Paper impact decaying over time As new ideas presented of each paper further grow in follow-up studies, the novelty fades away eventually and the impact of papers decays over time (Wang et al., 2013). Figure 1 shows the citation pattern of individual scholarly papers over time. The vertical axis is the yearly citations of 100 randomly selected scholarly papers published between 1978 and 1997 in the APS dataset. The color represents to the publication year of each scholarly paper. According to Figure 1, each paper has its own inherent citation trend and the pattern may not correlate to one another.
Early citers’ impact Some prior studies have ignored the citers’ impact to the citation dynamics (Wang et al., 2013). According to the study in Singh et al. (2017), influential early citers might negatively affect long-term scientific impact of papers due to attention stealing, whereas non-influential early citers could positively affect the long-term scientific impact of papers. Inspired by this idea, the early citers’ impact is used in PPI to model the citation pattern of a scholarly paper.
Early citation Based on the behavior that high early citations lead to more citations in the future, we model the Paper Potential Index of a scholarly paper by extending a self-exciting Hawkes process:
| (1) |
where parameter is the coefficient of paper impact decaying over time. indicates the maximum value of authors’ impact of paper , and indicates the decay of a paper impact over time. Parameter is the coefficient that triggers the current impact of paper . indicates the early citers’ impact on paper ’s citations. indicates the decay of the current citation.
In equation (1), the value reflects an author’s influence to the impact of a paper (Sinatra et al. (2016)), and it is a constant in a scientist’s career.
| (2) |
where represents the value of author . represents the average logarithmic citations of all papers published by author . represents author ’s -th paper. is equal to .
In order to explore the correlation between early citers’ impact and paper citations, we conduct experiments based on the method proposed by (Singh et al., 2017). We first get the maximum value among citers for each paper since it is published for two years. Next, we verify the correlation between the maximum value for citers with high impact and citations of paper published for 5, 8, 10, 12 and 15 years. We also verify the correlation between the maximum value for citers with low impact and citations of paper. Our experimental results show that early citing authors with low impact is more relevant to the long-term scientific impact of papers than early citing authors with high impact. The results are consistent with the finding in Singh et al. (2017) that attention stealing exists. In accordance with the positive correlation between them, we define in equation (2) as:
| (3) |
where is the maximum value among all authors of a citing paper , and represents the highest impact among all citers.
3.3 Model learning and prediction
In order to obtain the optimal values of parameters , , , in the PPI model, we adopt the maximum likelihood estimation method. Namely, given that the reached probability of the th citation at time , we maximize the reached probability of the th citation at time . The concept can be formulated as follows:
| (4) |
then we use the maximum likelihood estimation method to calculate the likelihood function on the cited sequence of each article, and take the logarithmic function of the maximum likelihood estimate:
| (5) |
where is the citation count of a scholarly paper, is the time that the citation occurs, and is a period of time that a paper is cited. The maximum value of the log-likelihood function is obtained by calculating the minimum of its dual equation. Equation (4) is brought into the above formula, and add a sparse regularized term , we get the objective function :
| (6) | |||
where is the number of papers in the experimental data, is the features of a paper. Adding the regularization term makes the objective function non-differentiable, we use the Alternating Direction Method of Multipliers (ADMM) to decompose the original optimization problem into a few simpler sub-problems. By introducing the auxiliary variable , the optimization problem in equation (6) can be formulated by the following constraint optimization:
| (7) |
The corresponding augmented Lagrangian is:
| (8) |
where is the dual variable or Lagrange multiplier; is the penalty coefficient, which is usually used as an iterative step to update the dual variable. The steps to solve the above augmented Lagrange optimization problem using the ADMM algorithm are as follows:
| (9) |
| (10) |
| (11) |
where is a soft critical value function. The ADMM algorithm is similar to the dual ascent algorithm, including a parameter minimization process, such as equation (9); an auxiliary parameter minimization process, such as equation (10); and a dual parameter update process, such as equation (11). In order to efficiently solve the optimization problem in equation (9), we use the EM framework to update the parameters and . Given the probability that feature activates event is , the probability that event activates event is , the EM algorithm is as follows:
| (12) |
| (13) |
| (14) |
| (15) |
where . Equation (12) represents the probability that the value of the th feature and the coefficient corresponding to the feature affect the citations of the paper when a paper is cited times. Equation (13) represents the probability that the -th () citation affects the citations of a paper when it is cited times. Therefore, indicates the expectation that the coefficient corresponding to the feature affects citations of the paper on the entire data set. indicates the expectation that the number of existing citations of the paper affects its citations. In equation (8), we find the maximum of these two expectations and derive the partial derivatives for and . When the partial derivative is zero, equations (14) and (15) are obtained. By iterating until convergence, we get the optimal values of the parameters and . After that, the new values of and are brought back to the values of and in the ADMM algorithm.
After obtaining the parameters and , the parameters and of each paper are solved by the gradient descent method. The gradient of the objective function with respect to and is as follows:
| (16) |
| (17) | ||||
After obtaining the optimal values of all parameters , , and , we estimate the citations of a scholarly paper after a certain period of time by taking the integral of the intensity function .
4 Multi-features predictive model
4.1 Features that drive the increase of citations
Author-based features.
-
1.
Author Impact Factor (AIF).
Similar to the concept of journal impact factor, an author’s AIF in year is the average citations of published papers in a period of years before year . Based on the APS dataset, we compute each author’s AIF value according to the author’s publishing history and use the statistics of all authors’ AIF of a given institution as a group of its features, including sum, maximum, minimum, median, average and deviation. We briefly explore and report the authors’ AIF features in this work. -
2.
value.
The value is calculated according to equation 2. -
3.
H-index.
A scholar has an index value of if the scholar has papers with at least citations. H-index can give an estimate of the impact of a scholar’s cumulative research contributions.
Journal-based feature.
Journal Impact Factor is a quantitative index to evaluate the impact of journal. It is actually the ratio of citations of a journal and papers published of the journal.
Citations feature.
The historical citations of each paper are used to predict the impact of a paper.
4.2 Feature selection
In order to investigate the effect of author-based feature, journal-based feature and citations feature, we evaluate the importance of features (see Table 2).
| Feature | Description | Feature | Description |
|---|---|---|---|
| c1 | one-year citations | max(H-index) | maximum of H-index |
| c2 | two-year citations | min(H-index) | minimum of H-index |
| c3 | three-year citations | avg(H-index) | average of H-index |
| c4 | four-year citations | med(H-index) | median of H-index |
| c5 | five-year citations | dev(H-index) | deviation of H-index |
| sum(Q) | sum of Q value | sum(AIF) | sum of AIF |
| max(Q) | maximum of Q value | max(AIF) | maximum of AIF |
| min(Q) | minimum of Q value | min(AIF) | minimum of AIF |
| avg(Q) | average of Q value | avg(AIF) | average of AIF |
| med(Q) | median of Q value | med(AIF) | median of AIF |
| dev(Q) | deviation of Q value | dev(AIF) | deviation of AIF |
| sum(H-index) | sum of H-index | JIF | journal impact factor |
4.3 Learning algorithm
In this section, we describe the multi-feature predictive model, which integrates author-based feature, journal-based feature and citations to the Gradient boosting decision trees (GBDT). The GBDT model suits for a mass of features and no-linear relationships between the predictor variables and the target variable. In terms of the multi-feature predictive model, parameters adjustment is crucial for the performance of predictive model. Main parameters include:
(1) learning rate: namely the model’s learning speed on the distribution characteristics of the sample, expressed as the weight of the regression tree for each iteration in the algorithm. The larger the learning rate is, the faster the algorithm converges. The smaller the learning rate is, the slower the algorithm converges, but the prediction accuracy may increase.
(2) number of iterations: the number of iterations is the number of weak learners obtained in the model. In general, the number of iterations depends on the learning rate.
(3) minimum samples of leaf nodes: this parameter defines the conditions under which the subtree continues to be divided. If the number of samples on the leaf node is smaller than the set value, the node will not be further divided.
(4) maximum depth of decision tree: this parameter is used to control the maximum depth of the decision tree generated by each round iteration. The purpose is to prevent over-fitting.
(5) Sampling rate: this parameter indicates the proportion of training samples used in each training, and its value ranges from 0 to 1. When the value is 1, it indicates that all the samples are involved training. The main role of this parameter is to add sample perturbation to prevent over-fitting. The sampling rate of general samples is set between 0.5 and 0.8. If the value is too large, the risk of over-fitting will be increased. If the value is too small, correct samples may not be learned due to too few samples, and the model deviations will increase.
We used the Grid Search method to adjust the above mentioned parameters. The value of the learning rate ranges from 0.0005 to 0.5 and the step size is 0.0005. The number of iterations ranges from 500 to 3000 and the step size is 500. The value of leaf node minimum sample number value ranges from 10 to 80 and the step size is 10. The maximum depth of the decision tree ranges from 5 to 7 and the step size is 1. Sampling rate ranges from 0.5 to 1.0 and the step size is 0.1.
According to the range of values and the step size of each parameter, the grid covered parameter space is generated for grid search. Each point on the grid is traversed, and the parameter combination corresponding to the point is used to train the model on the training set. Correspondingly, prediction is performed on the validation set, and the predictive accuracy is calculated as an estimate of the prediction performance of the model under the set of parameters. After traversing all the parameter combinations, the set of parameters with the highest prediction accuracy on the corresponding verification set is taken as the parameter of the final model.
5 Results and discussion
5.1 Evaluation metrics
In this subsection, we introduce several evaluation metrics for validating the PPI prediction model.
Mean absolute error (MAE).
MAE quantifies how close the predictions is to the ground truth. MAE is given by:
| (18) |
The mean absolute error is an average of the absolute errors , which is equal to , where is the prediction, and is the true value. represents the number of predictions.
Root mean squared error (RMSE).
RMSE is similar to MAE, which is defined as follows:
| (19) |
RMSE also provides the average error and quantify the overall error rate. In some cases, we need to compare results across activities, but RMSE can not give an indication of the relative error. We need a normalized error, such as Range-normalized RMSE.
Range-normalized RMSE (NRMSE).
| (20) |
where and represent the maximum and minimum functions, which are calculated by all ground-truth values of the test instances.
Mean absolute percentage error (MAPE)
An useful normalized metric is MAPE, which normalizes each error value for each prediction. This metric shows the average deviation between predicted output and true output from the experimental data. MAPE is defined as follows:
| (21) |
Accuracy
Accuracy shows the fraction of papers correctly predicted for a given error tolerance :
| (22) |
5.2 Feature importance analysis
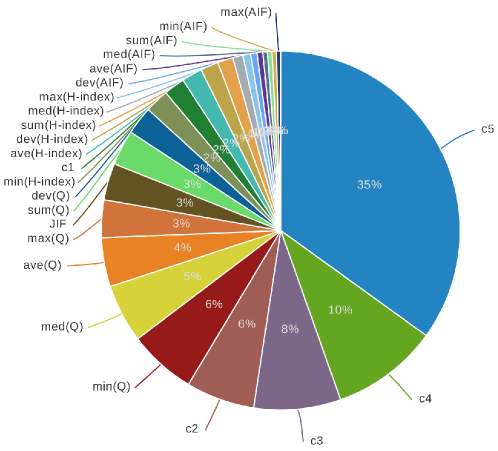
Figure 2 shows the feature importance score of all features to predict the 15th year’s citations of the published papers. The features , , and rank first to fourth in the feature importance rankings, and their values are 0.3495, 0.0963, 0.0783 and 0.0618. The minimum, median, average, maximum of authors’ value, JIF, authors’ value’ sum, respectively, their values are 0.0608, 0.0527, 0.0441, 0.0338, 0.0331, and 0.0317. The feature importance score for predicting 6th-14th year citations of the published papers are shown in the appendix.
Based on all features’ importance in predicting 6th-15th year citations of papers, we selected the top 10 feature retraining model, the prediction accuracy remains high. There are differences in feature importance scores for different predictive years (see appendix). Figure 3 shows the top 10 feature importance score for predicting the 15th year citations of the published papers. The features and rank first to third in the feature importance rankings. Their importance scores are 0.3425 and 0.1079, respectively. The authors’ value’s minimum ranks fourth, and its value is 0.0969. Other feature importance scores are less than 0.0950.
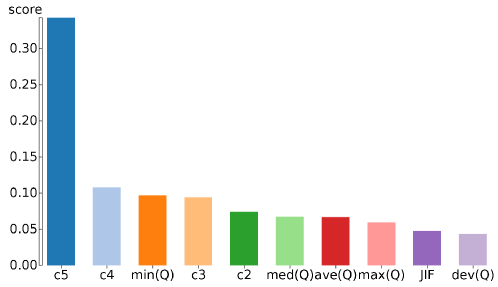
According to Figure 2 and Figure 3, we observe that citations in the first five years after the publication of the paper, author’s value, and JIF are ranked in the top 10 of the list of feature importance ranking. Author H-index related features and author AIF related features are located behind the list of feature importance rankings.
In summary, we observe that historical citations play an important role for predicting the impact of the paper. Besides, author-based features are important in predicting the paper impact, especially the authors’ value.
5.3 Comparing performances of different models and discussion
To test the validity of PPI prediction model, its predictive performance is compared against four competing models: PPI_NECAI, GBDT_All, GBDT_10 and PLI_Science published by Wang et al. (2013). The comparison is made in terms of MAE, RMSE, NRMSE, MAPE, and accuracy.
Figure 4 shows the MAE value of the five models. According to Figure 4, we observe that PPI outperforms all competing models with lower MAE values for predicting citations after a scholarly paper is published for 5 years. We also observe that MAE values of all five models increase along with the year, indicating that the predictive performance of all five models degrades over time.
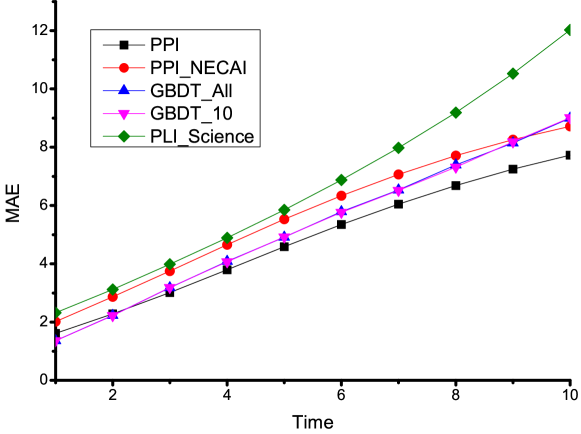
Figure 5 shows the RMSE value of the five models. Similar to the MAE comparisons, that the PLI_Science model falls behind all competing models in terms of RMSE. RMSE performance of all other models are mixed, with PPI yields lower RMSE than other models between 2 to 6 years, indicating it performs well in short term citation prediction but its performance fails behind GBDT_All and GBDT_10 for long term citation prediction. Similar to study based on MAE, the predictive performance in terms of RMSE of all five models gradually declines over time.
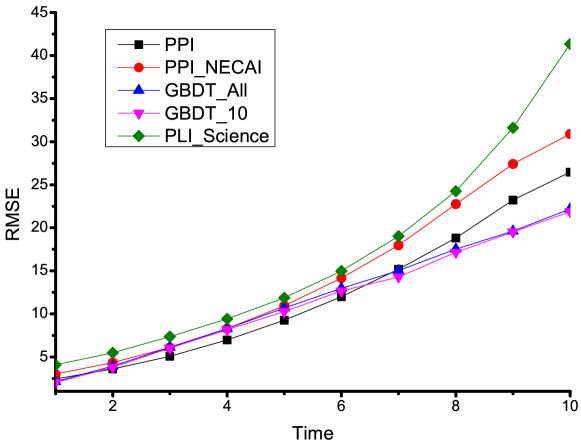
Figure 6 shows NRMSE values of the five models. For PPI model and PPI_NECAI model, their NRMSE values are about 0.006. The NRMSE values of GBDT_All model and GBDT_10 model shows increasing trends, and their NRMSE values are about 0.018 in future the 10th years after the fifth year of scholarly paper published. The NRMSE values of the PLI_Science model show a decaying trend. In term of NRMSE, the predictive performance of the PPI model is better than other four models.
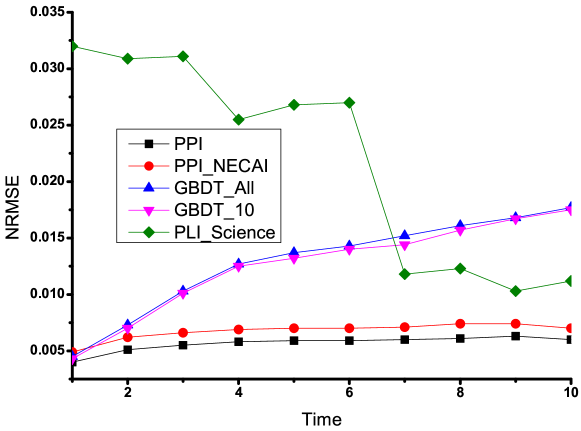
Figure 7 shows the MAPE values of the five models. We observe that the MAPE values of GBDT_All model and GBDT_10 model are below the other three models. The MAPE value of the PPI model is slightly higher than GBDT_All model and GBDT_10 model.
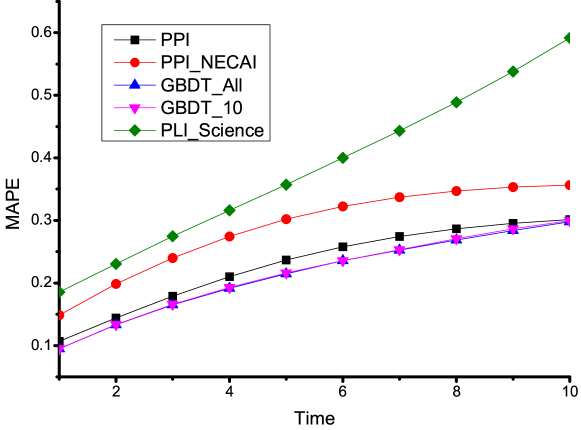
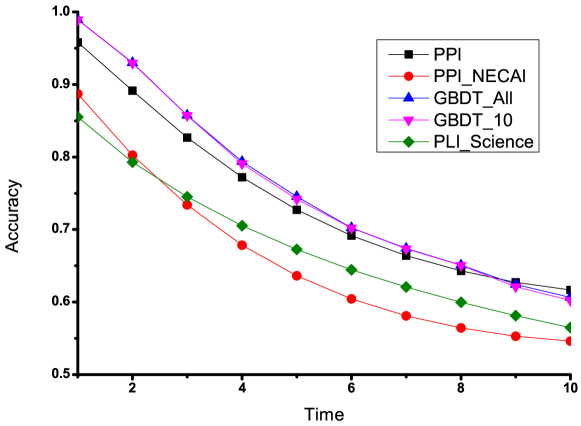
Figure 8 shows the accuracy of the five models. The accuracy values of PPI prediction model are higher than PPI_NECAI model and PLI_Science model, but are slightly below than GBDT_All model and GBDT_10 model. From 3 to 10 years after the fifth year of scholarly paper published, the predictive accuracy of PPI_NECAI model is lower than other four models. The predictive accuracy of all models shows a decaying trend.
By comparing PPI and PPI-NECAI, we observe that early citing authors’ impact contributes to improved prediction of scholarly paper impact. PPI yields superior citation prediction over PPI-NECAI, GBDT_All, GBDT_10 and PLI-Science in terms of MAE and NRMSE. Although the predictive performances of the GBDT_All model and the GBDT_10 model are better than other three models in terms of MAPE and accuracy, the proposed PPI prediction model gives a clear explanation for the predictive effect of the model by the following factors: inherent quality of scholarly paper, scholarly paper impact decaying over time, early citations, and early citers’ impact.
Compared to PPI-NECAI and PLI_Science, PPI more accurately predicts the scholarly paper impact. Although considering early citers’ impact can improve the predictive performance of PPI model, other factors exist, such as author’s team impact, journal impact, authors’ cooperation relationship, and disciplinary differences. In addition, due to the fact that the APS dataset only contains local citations, this might limit the predictive accuracy of this work. Uncovering the essence of paper potential index is a promising future work, which might improve the predictive performance of PPI model, and it could provide a better understanding of the evolution of scholarly paper impact.
6 Conclusion
Based on point estimation process, we present the PPI predictive model, which considers the following four factors: (1) inherent quality of scholarly paper; (2) scholarly paper impact decaying over time; (3) early citations; and (4) early citers’ impact. Experimental results indicate that the PPI model improves citation prediction of scholarly papers. The predictive performance of PPI is better than PPI-NECAI, which reflects that early citing author’s impact is important for predicting the citations of scholarly paper. Although the predictive performance of the GBDT_All model and GBDT_10 model is better than other three models in terms of MAPE and accuracy, the proposed PPI predictive model give a clear explanation for the predictive effect, indicating that an ultimate understanding of long-term impact of scholarly paper will benefit from understanding the inherent evolutionary mechanism of citations of scholarly papers.
Acknowledgement
We thank Feng Xia and Jie Hou from School of Software, Dalian University of Technology for valuable discussions on this work. This work was partially supported by Liaoning Provincial Key R&D Guidance Project (2018104021) and Liaoning Provincial Natural Fund Guidance Plan (20180550011).
References
- Adankon and Cheriet (2010) Adankon, M. M., Cheriet, M. (2010). Support vector machine. In: International Conference on Intelligent Networks and Intelligent Systems. pp. 418–421.
- Bai et al. (2017) Bai, X., Liu, H., Zhang, F., Ning, Z., Kong, X., Lee, I., Xia, F. (2017). An overview on evaluating and predicting scholarly article impact. Information 8(3), 73.
- Bai et al. (2016) Bai, X., Xia, F., Lee, I., Zhang, J., Ning, Z. (2016). Identifying anomalous citations for objective evaluation of scholarly article impact. Plos One 11(9), e0162364.
- bornmann et al. (2012) Bornmann, L., Schier, H., Marx, W., Daniel, H. (2012). What factors determine citation counts of publications in chemistry besides their quality? Journal of Informetrics 6(1), 11–18.
- Cao et al. (2016) Cao, X., Chen, Y., Liu, K. J. R. (2016). A data analytic approach to quantifying scientific impact. Journal of Informetrics 10(2), 471–484.
- Chen and Zhang (2015) Chen, J., Zhang, C. (2015). Predicting citation counts of papers. In: IEEE International Conference on Cognitive Informatics & Cognitive Computing. pp. 434–440.
- Chen and Guestrin (2016) Chen, T., Guestrin, C. (2016). Xgboost: A scalable tree boosting system. In: ACM SIGKDD International Conference on Knowledge Discovery and Data Mining. pp. 785–794.
- Clauset et al. (2017) Clauset, A., Larremore, D. B., Sinatra, R. (2017). Data-driven predictions in the science of science. Science 355(6324), 477–480.
- Erdt et al. (2016) Erdt, M., Nagarajan, A., Sin, S. C. J., Theng, Y. L. (2016). Altmetrics: an analysis of the state-of-the-art in measuring research impact on social media. Scientometrics 109(2), 1117–1166.
- Fiala and Tutoky (2018) Fiala, D., Tutoky, G. (2018). Pagerank-based prediction of award-winning researchers and the impact of citations. Journal of Informetrics 11(4), 1044–1068.
- Golosovsky and Solomon (2017) Golosovsky, M., Solomon, S. (2017). Growing complex network of citations of scientific papers: Modeling and measurements. Phys.rev.e 95(1): 012324.
- Haslam et al. (2008) Haslam, N., Ban, L., Kaufmann, L., Loughnan, S., Peters, K., Whelan, J., Wilson, S. (2008). What makes an article influential? predicting impact in social and personality psychology. Scientometrics 76(1), 169–185.
- Hawkes and Oakes (1974) Hawkes, A. G., Oakes, D. (1974). A cluster process representation of a self-exciting process. Journal of Applied Probability 11(3), 493–503.
- Heidi (2015) Heidi, L. (2015). Team science. Nature 525(7569), 308–222.
- Li et al. (2015) Li, C. T., Lin, Y. J., Yan, R., Yeh, M. Y. (2015). Trend-Based Citation Count Prediction for Research Articles. In: Springer, Cham, pp. 659-671.
- Liu et al. (2017) Liu, X., Yan, J., Xiao, S., Wang, X., Zha, h., Chu, S. M. (2017). On predictive patent valuation: Forecasting patent citations and their types. In: AAAI. pp. 1438–1444.
- Livne et al. (2013) Livne, A., Adar, E., Teevan, J., Dumais, S. (2013). Predicting citation counts using text and graph mining. In: Proc. the iConference 2013 Workshop on Computational Scientometrics: Theory and Applications. pp. 1-4.
- Newman (2008) Newman, M. E. J. (2008). The first-mover advantage in scientific publication. Epl 86(6), 68001–68006.
- Panagopoulos et al. (2017) Panagopoulos, G., Tsatsaronis, G., Varlamis, I. (2017). Detecting rising stars in dynamic collaborative networks. Journal of Informetrics 11(1), 198–222.
- Peoples et al. (2016) Peoples, B. K., Midway, S. R., Sackett, D., Lynch, A., Cooney, P. B. (2016). twitter predicts citation rates of ecological research. Plos One 11(11), e0166570.
- Petersen et al. (2014) Petersen, A. M., Fortunato, S., Pan, R. K., Kaski, K., Penner, O., Rungi, A., Riccaboni, M., Stanley, H. E., Pammolli, F. (2014). Reputation and impact in academic careers. Proceedings of the National Academy of Sciences 111(43), 15316–15321.
- Pobiedina and Ichise (2016) Pobiedina, N., Ichise, R. (2016). Citation count prediction as a link prediction problem. Applied Intelligence 44(2), 252–268.
- Robson and Mousquès (2016) Robson, B. J., Mousquès, A. (2016). Can we predict citation counts of environmental modelling papers? Fourteen bibliographic and categorical variables predict less than 30% of the variability in citation counts. Environmental Modelling & Software 75, 94–104.
- Sandulescu and Chiru (2016) Sandulescu, V., Chiru, M. (2016). Predicting the future relevance of research institutions-the winning solution of the KDD Cup 2016. arXiv preprint arXiv:1609.02728.
- Sarigöl et al. (2014) Sarigöl, E., Pfitzner, R., Scholtes, I., Garas, A., Schweitzer, F. (2014). Predicting scientific success based on coauthorship networks. EPJ Data Science 3(1), 9.
- Sinatra et al. (2016) Sinatra, R., Wang, D., Deville, P., Song, C., Barabási, A.-L. (2016). Quantifying the evolution of individual scientific impact. Science 354(6312), aaf5239.
- Singh et al. (2017) Singh, M., Jaiswal, A., Shree, P., Pal, A., Mukherjee, A., Goyal, P. (2017). Understanding the impact of early citers on long-term scientific impact. In: Digital Libraries. pp.59–68.
- Singh et al. (2015) Singh, M., Patidar, V., Kumar, S., Chakraborty, T., Mukherjee, A., Goyal, P., (2015). The role of citation context in predicting long-term citation profiles: An experimental study based on a massive bibliographic text dataset. In: ACM Conference on Information & Knowledge Management. pp. 1271–1280.
- Sohrabi and Iraj (2017) Sohrabi, B., Iraj, H. (2017). The effect of keyword repetition in abstract and keyword frequency per journal in predicting citation counts. Scientometrics 110(1), 1–9.
- Stegehuis et al. (2015) Stegehuis, C., Litvak, N., Waltman, L. (2015). Predicting the long-term citation impact of recent publications. Journal of informetrics 9(3), 642–657.
- Tahamtan et al. (2016) Tahamtan, I., Safipour Afshar, A., Ahamdzadeh, K. (2016). Factors affecting number of citations: a comprehensive review of the literature. Scientometrics 107(3), 1195–1225.
- Timilsina et al. (2016) Timilsina, M., Davis, B., Taylor, M., Hayes, C. (2016). Towards predicting academic impact from mainstream news and weblogs: A heterogeneous graph based approach. In: IEEE/ACM International Conference on Advances in Social Networks Analysis and Mining. pp.1388–1389.
- Wang et al. (2013) Wang, D., Song, C., Barabási, A.-L. (2013). Quantifying long-term scientific impact. Science 342(6154), 127–132.
- Wang et al. (2008) Wang, M., Yu, G., Yu, D. (2008). Measuring the preferential attachment mechanism in citation networks. Physica A Statistical Mechanics & Its Applications 387(18), 4692–4698.
- Xia et al. (2016) Xia, F., Su, X., Wang, W., Zhang, C., Ning, Z., Lee, I. (2016). Bibliographic analysis ofnaturebased on Twitter and facebook altmetrics data:. Plos One 11(12), e0165997.
- Xia et al. (2017) Xia, F., Wang, W., Bekele, T. M., Liu, H. (2017). Big scholarly data: A survey. IEEE Transactions on Big Data 3(1), 18–35.
- Xiao et al. (2016) Xiao, S., Yan, J., Li, C., Jin, B., Wang, X., Yang, X., Chu, S. M., Zha, H. (2016). On modeling and predicting individual paper citation count over time. In: Proceedings of the Twenty-Fifth International Joint Conference on Artificial Intelligence (IJCAI-16). pp. 2676–2682.
- Yu et al. (2014) Yu, T., Yu, G., Li, P.-Y., Wang, L. (2014). Citation impact prediction for scientific papers using stepwise regression analysis. Scientometrics 101(2), 1233–1252.
- Zhang et al. (2016) Zhang, C., Yu, L., Lu, J., Zhou, T., Zhang, Z. K. (2016). Adawirl: A novel bayesian ranking approach for personal big-hit paper prediction. In: International Conference on Web-Age Information Management. pp. 342–355.
- Zhang et al. (2017) Zhang, J., Ning, Z., Bai, X., Kong, X., Zhou, J., Xia, F. (2017). Exploring time factors in measuring the scientific impact of scholars. Scientometrics 112(3), 1301–1321.
- Zhao et al. (2015) Zhao, Q., Erdogdu, M. A., He, H. Y., Rajaraman, A., Leskovec, J. (2015). Seismic: A self-exciting point process model for predicting tweet popularity. In: ACM SIGKDD International Conference on Knowledge Discovery and Data Mining. pp. 1513–1522.