SN Ia DDT Explosions Powered by the Zel’dovich Reactivity Gradient Mechanism
Abstract
The aim of this work is to identify and explain the necessary conditions required for an energetic explosion of a Chandrasekhar-mass white dwarf. We construct and analyze weakly compressible turbulence models with nuclear burning effects for carbon/oxygen plasma at a density expected for deflagration-to-detonation transition (DDT) to occur. We observe formation of carbon deflagrations and transient carbon detonations at early times. As turbulence becomes increasingly inhomogeneous, sustained carbon detonations are initiated by the Zel’dovich reactivity gradient mechanism. The fuel is suitably preconditioned by the action of compressive turbulent modes with wavelength comparable to the size of resolved turbulent eddies; no acoustic wave is involved in this process. Oxygen detonations are initiated either aided by reactivity gradients or by collisions of carbon detonations. The observed evolutionary timescales are found sufficiently short for the above process to occur in the expanding, centrally ignited massive white dwarf. The inhomogeneous conditions produced prior to DDT might be of consequence for the chemical composition of the outer ejecta regions of SN Ia from the single degenerate channel, and offer potential for validation of the proposed model.
keywords:
stars: white dwarfs — supernovae:general — hydrodynamics, turbulence, shock waves — nuclear reactions1 Introduction
The deflagration-to-detonation transition (DDT) mechanism remains one of the major unsolved problems of theoretical and computational combustion. It has been directly observed in a number of laboratory experiments and has been extensively studied by means of computer simulations (Oran & Gamezo, 2007, and references therein). In the context of astrophysics and stellar evolution, it has now been suspected for almost 30 years that DDT is directly responsible for at least a subclass of white dwarf explosions responsible for luminous Type Ia supernovae (SN Ia). In this case, however, evidence for the DDT is only indirect, relying on post-explosion observational data and speculative physics models such as delayed-detonation (DD; Höflich et al., 1995). This particular early study was suggestive of DDT occurring at relatively low densities, g/cc, which was quickly linked to a morphological change from the flamelet to stirred flame regime (FSF; Niemeyer & Woosley, 1997; Khokhlov et al., 1997) expected of centrally-ignited deflagrations. Then, as theorized by Khokhlov (1991), a DDT might be possible provided that (Rayleigh-Taylor-driven and flame-generated) turbulent perturbations satisfy certain minimal amplitude and size requirements.
The above basic DD explosion scenario was refined in the course of major research efforts. S. Woosley and collaborators used a one-dimensional model of a turbulent flame to study the flame evolution in various burning regimes, including the FSF transition. They provided firmer constraints on conditions for DDT, speculated about possible collective effects in multidimensions (Woosley et al., 2009), and assessed the role of realistic composition (Woosley et al., 2011). Schmidt et al. (2010) adopted a probabilistic DDT framework originally developed by Pan et al. (2008) to account for intermittency of turbulence as a possible source of large-scale fluctuations at the flame front. They provided an independent set of DDT constraints and discussed their dependence on the adopted intermittency model. More recently Poludnenko et al. (2019) postulated a similarity between the terrestrial and astrophysical DDT mechanisms. In that scheme, interaction between a deflagration with nearly incompressible turbulence produces a shock and ultimately results in a detonation. However, neither this nor other briefly discussed here efforts demonstrated DDT to operate under conditions expected for SNe Ia.
In this work, and in contrast to the previous SN Ia DDT studies, we consider a situation in which no flame is initially present, nuclear burning is solely due to self-heating, and turbulence is created and sustained in a fully controlled manner. The use of a minimal set of physics makes our results free of numerous assumptions present in other models. This also makes the presented results easily reproducible as the required computational model is simple and can be built using readily available software packages
2 Methods and initial conditions
We performed computer simulations using Proteus, a fork of the FLASH code (Fryxell et al., 2000). We used the PPM method (Colella & Woodward, 1984) to solve the hydrodynamic equations of stellar plasma with thermodynamics described by the Helmholtz equation of state (Timmes & Swesty, 2000). The hydrodynamics solver was supplemented by equations for advection of nuclear species and nuclear burning source terms for energy and species evolution due to nuclear reactions. In the course of trial simulations, we found that the results obtained with a small nuclear network of 7 species, Iso7, did not differ in any appreciable way from the results obtained with larger (but more expensive) 19 isotope network, Aprox19. Consequently, we adopted Iso7 for the remaining set of simulations.
Simulations were performed on periodic domains with length on each side. Because of our interest in DDT, we assumed an initial plasma density of and plasma temperature of , with a 50/50 carbon/oxygen composition. This particular choice of the initial conditions, especially density slightly lower than the observationally-calibrated DDT value of (Höflich et al., 1995), does not affect major conclusions of this work.
We produced a turbulent quasi-steady state using the spectral forcing method (Eswaran & Pope, 1988; Federrath, C. et al., 2010) to allow for compressibility in the drive. The forcing spectrum contained per cent of energy in compressible modes and was flat in shape, extending from to . The individual modes were assumed to decay on a time-scale of while the spectrum shape was updated in time with resolution of . The evolution towards quasi-steady state was performed over the initial of simulations, which amounts to about three turbulent eddy turnover times. During that transient stage, the total internal energy in the simulations was kept constant (Fenn & Plewa, 2017).
Because we were interested in the dependence of the model outcomes on the characteristic turbulence Mach number in the weakly compressible regime, we systematically varied the turbulence forcing kinetic energy in the range . For the model with and background sound speed of , the corresponding characteristic flow velocity is . This value results in a dynamical timescale on the energy injection scale of , which is consistent with the assumed decay time of the forcing modes.
3 Results and Discussion
In order to probe the behavior of model turbulence, we constructed a database of 2D and 3D models. Table LABEL:t:models \ctable[ cap = model binary systems table, caption = Parameters and main properties of resolution models., label = t:models, nostar ] l c c c c \tnote[a]Injection rate of turbulence forcing kinetic energy. \tnote[b]Root-mean-square turbulence Mach number averaged averaged over one turbulent turnover time before the end of the transient phase. \tnote[c]Simulated time of carbon ignition. \tnote[d]Simulated time of oxygen ignition. \FLModel & \tmark[a] \tmark[b] \tmark[c] \tmark[d] \NNdesignation () () () \MLH11 0.358 51.7 56.1 \NNH13 0.377 45.8 50.7 \LL presents the parameters and main properties of two high-resolution models obtained in this study (supporting several 2D models and 17 lower resolution 3D models are not listed). These models differ in terms of the amount of kinetic energy used to sustain turbulence and the resulting model turbulence Mach number, . In our high-resolution models, H11 and H13, reached about 0.36 and 0.38, respectively, in agreement with the values obtained in lower resolution models.
After the quasi-steady state was achieved, nuclear burning was enabled at . Fig. 1
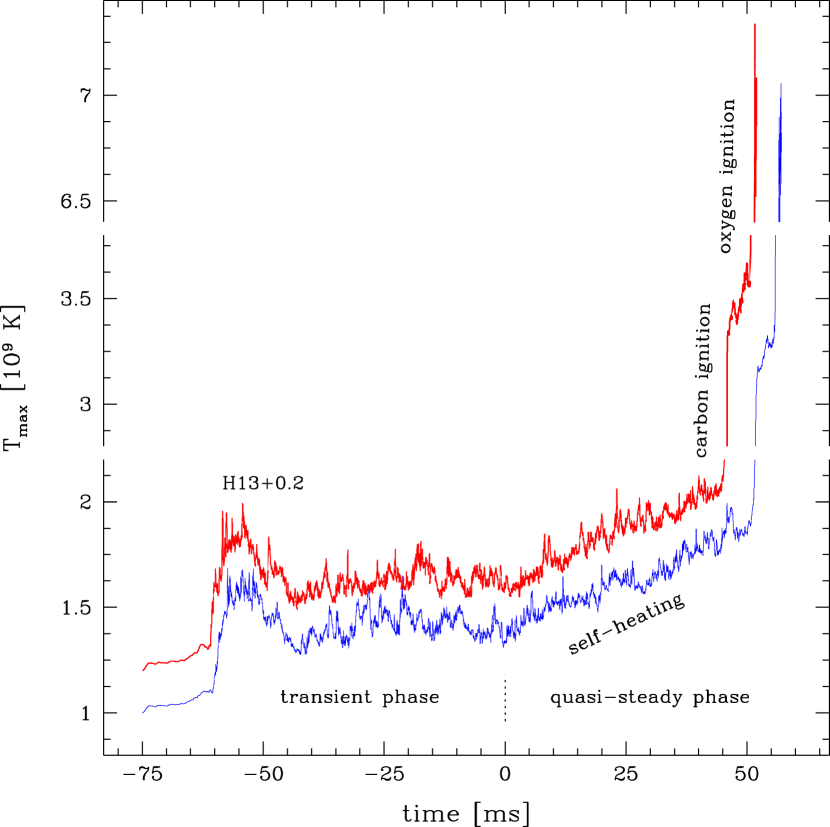
shows the evolution of maximum temperature in the high resolution models. We found that the mean maximum model temperature gradually increased with time due to self-heating and dissipation of turbulent kinetic energy. At the same time, it fluctuated with a typical amplitude of up to about per cent around its mean value. The rapid increase in the maximum model temperatures seen around marks the moment of carbon ignition, with the mean mass-weighted temperature for both models of .
3.1 Birth and Growth of Carbon Deflagrations
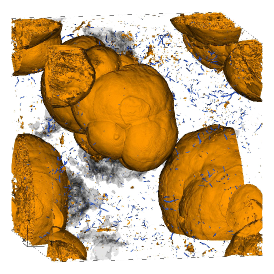
In the left-hand panel of Fig. 2
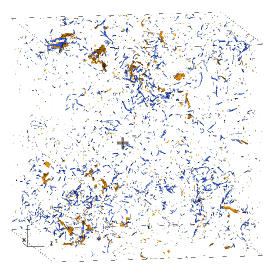
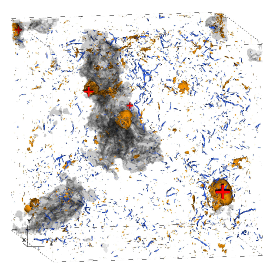
we show the structure of the divergence and vorticity fields in model H11 at ms into the quasi-steady phase of the evolution and just prior to carbon ignition (an approximate location of the ignition point is marked with a cross symbol in the figure). At this time, the turbulent flow field is populated with randomly located vortex tubes with occasionally present segments of weak shock fronts. However, the ignition region is not directly associated with compression while the amount of vorticity in that region seems low. Instead, we found mild ignitions forming in regions with temperature elevated by superposition of acoustic perturbations and productive self-heating thanks to inefficient mixing (as evidenced by the relatively low values of vorticity) and lack of adiabatic cooling (thanks to strong plasma degeneracy; for typical density and temperature, , thermal contribution to the pressure is about per cent).
Over the next few milliseconds of simulated time, we observed a series of carbon ignitions taking place at several well-separated locations (middle panel in Fig. 2). Each such ignition event was accompanied by emission of a relatively weak acoustic signal. As time progressed, individual deflagrations grew in size making the flow increasingly inhomogeneous. Although we did not observe carbon deflagrations to directly produce detonations at this time in the evolution, carbon ignitions contributed to the acoustic background as evidenced by emission of weak acoustic waves from the ignition points. Therefore, this phase of the evolution might be considered as an early stage of the SWACER mechanism (Lee et al., 1978). Here temporal coherence of ignitions is on average improved by self-heating and modulated by acoustic perturbations contributed by previous ignition events.
3.2 Initiation and Role of Transient Carbon Detonations
We observed the formation of carbon detonations a few milliseconds into the carbon deflagration phase. These detonations can be seen as strongly compressed, nearly spherical regions located near the three smallest crosses in the middle panel in Fig. 2. They were initiated by intermittently present, strong shocklets created by turbulence. Upon entering highly convoluted regions of partially burned material, these shocklets were able to acoustically couple with burning (inside carbon-rich pockets) and detonate carbon as a result. Therefore, these detonations were a direct consequence of turbulence becoming strongly inhomogeneous at this intermediate time.
Because these carbon detonations were formed inside regions occupied by deflagrating material, they quickly weakened after entering carbon-depleted fuel. Furthermore, these detonations were not supported in their evolution toward oxygen detonations as reactivity of the unburned material remained at low at this time. As we will see later (see Section 3.3), suitable preconditioning of the environment is indeed required for oxygen to ignite. Despite their disappointing fate, these early detonations nevertheless played an important role in the evolution toward the supernova explosion. This is because the acoustic signal that they produced was much stronger than that of the perturbations created by mild carbon ignitions. Therefore, these transient carbon detonations constituted one of the key components of the participating SWACER mechanism.
3.3 Zel’dovich-driven Carbon Detonations
At a later time, the maximum temperature continued to fluctuate, but now with reference to the temperature of the carbon ash of . The second rapid increase in the maximum temperature seen in Fig. 1 around into the quasi-steady phase marks the time of oxygen ignition. We studied this process in detail in a series of 2-dimensional models with resolution systematically increased to slightly less than one meter. (The corresponding mesh dynamic range in the best resolved model was .) We found that only at that level of resolution can we truthfully describe the gradual transition from mild carbon ignition to carbon detonation.
Although the initial stages of explosion involved transient carbon detonations (cf. Section 3.2), the carbon detonation described here had a sustained character. This difference was due to naturally occurring preconditioning of the cold fuel. Note, that during about the that elapsed after the first deflagration was born, several more deflagrations were produced. Even though in this work we do not model the flame, deflagrations gradually grew in size in our simulations due to numerical mixing between the hot carbon ash and the cold fuel. We cannot claim the observed flame growth to be realistic, but it is conceivable that a qualitatively similar effect occurs in nature.
The presence of turbulent perturbations and active burning, as described in Section 3.1, had profound consequences for the evolution of the remaining cold fuel. In the left-hand panel of Fig. 3,
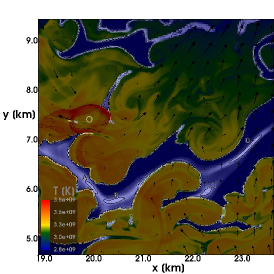
we show the morphology and dynamics of a partially deflagrating region of the 2-dimensional model. As one can note, the narrow (width ), meandering channel of fuel trapped between chunks of carbon deflagrations stretches from to . The channel material displays variation in the temperature and the related variations in the ignition time (reactivity), with color brightness indicating regions with higher reactivity. The variations take the form of elongated structures generally aligned with the channel shape. They were created by adiabatic compression on the scale of resolved turbulent eddies, which is several times larger than the channel width.
The presence of such perturbations is evident after examining the velocity field. We note the existence of a velocity gradient along the direction from to in the left-hand panel of Fig. 3. This velocity gradient compressed the channel material and produced a prominent maximum of reactivity near (see region labelled B in the figure). We also note the presence of additional maxima of reactivity, regions labelled A, C, and D in the figure. It is conceivable that additional compression might be due the potential velocity perturbations induced by thermal expanding deflagrations (Sabelnikov et al., 2019). This effect could be important especially in narrow segments of fuel channels (e.g. near region A). In any event, rapid and spatially localized increase in plasma reactivity is a direct consequence of strong plasma degeneracy as the fuel temperature is allowed to increase under nearly constant density.
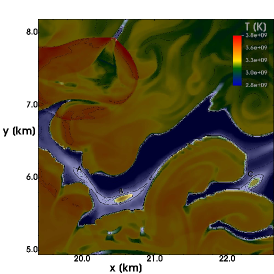
The evolution of region B is of primary interest in the subsequent evolution. Fig. 4
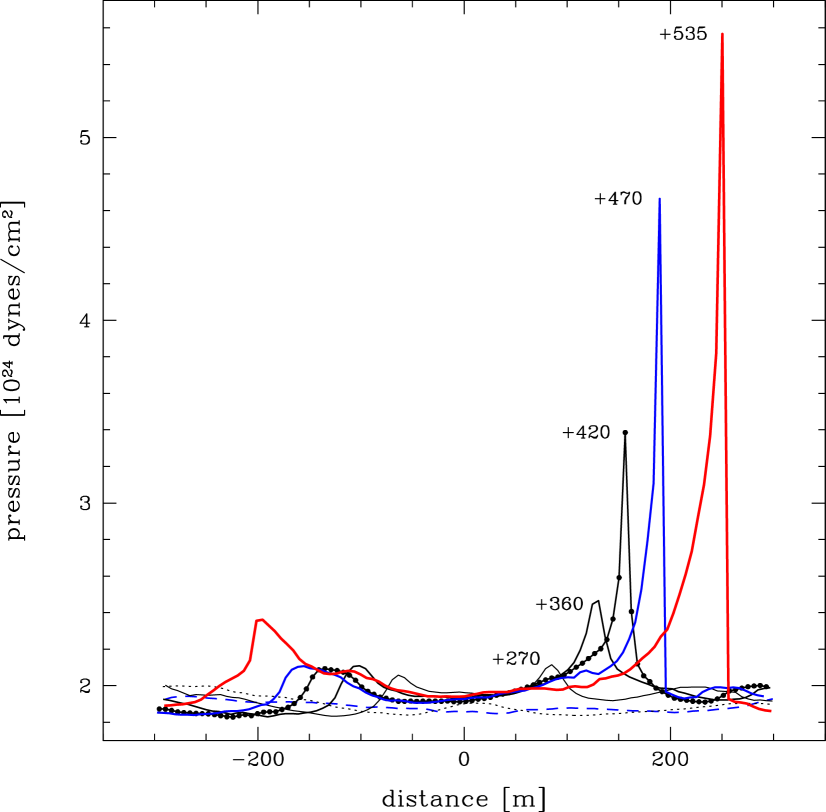
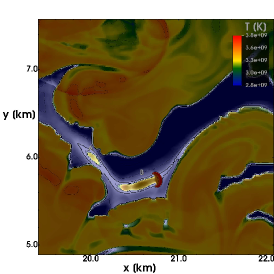
shows a series of pressure line-outs centered at the midsection of this region, and extending over (Khokhlov et al., 1997, cf. Fig. 3 in). Initially (reference time; shown with a dashed line in Fig. 4), the pressure in this region is smooth and nearly constant. After s (dotted line in Fig. 4), the pressure shows elevated values over the central -long section. Thanks to continuing energy deposition, the local nuclear burning time eventually becomes shorter than the mesh cell sound-crossing time marking the onset of detonation initiation (Glasner et al., 2018). At that time, a weak acoustic perturbation is formed (middle panel in Fig. 3). As the self-heating accelerates, the plasma degeneracy is lifted and the energized perturbation rapidly steepens into a shock. Because the reaction zone remains acoustically coupled to the wave at all times, a fully fledged carbon detonation is eventually born (pressure profile at time offset of 535 s in Fig. 4). The leading segment of this detonation front continues to expand steered in its evolution by the reactivity gradient, however, the wave is sufficiently strong to ignite carbon also in the surrounding fuel (cf. the right-hand panel in Fig. 3).
The described mechanism bears all the signatures of the Zel’dovich-Neumann-Döring detonation model (Fickett & Davis, 1979). The reason why earlier carbon detonations were transient (cf. Section 3.2) was the lack of a suitably preconditioned environment. Such an environment is a product of inhomogeneous turbulence. It consists of extended regions of cold fuel which are subject to adiabatic heating on a scale of resolved turbulent eddies. This process is further aided by acoustic energy contributed by preceding events of mild carbon ignition and of transient carbon detonations, as postulated in the SWACER model (Lee et al., 1978). Because early shocklet-initiated carbon detonations were found to fail in the absence of suitably preconditioned regions, we conclude that preconditioning is, indeed, a necessary condition for successful carbon detonation to occur.
3.4 Paths Toward Oxygen Detonations
We observed oxygen detonations to form when an inert shock produced by a carbon detonation exits carbon ash and enters a preconditioned region. Such preconditioned regions are associated with cusps of "carbon flame" where fuel is compressed by thermal expansion of the partially burned material (see Sabelnikov et al., 2019, and Section 3.3). This interaction results in carbon ignition and allows for the oxygen reaction zone to couple with the shock.
Also, we observed oxygen detonations due to the collision of carbon detonations. Such collisions were enabled by the highly unsteady evolution of the original carbon detonation through the cold fuel channel (Section 3.3) and its subsequent propagation as a nearly inert shock through incompletely burned carbon ash. As various segments of the shock exited the deflagrating mass at nearby locations, carbon detonations were produced and their collision was sufficient to detonate oxygen.
4 Conclusions
We studied the evolution of weakly compressible turbulence in carbon/oxygen mixtures to identify the necessary condition for a delayed detonation to occur in a single degenerate SN Ia formation channel. We found the DDT to occur naturally with a mild ignition of carbon followed by a two-stage detonation. Transient carbon detonations are initiated directly by shocks while sustained carbon detonations are initiated with help of the Zel’dovich reactivity gradient mechanism induced by compressive turbulence modes on intermediate scales. The subsequent oxygen detonations are due to either gradual strengthening of a nearly inert shock by reactivity gradient, or interaction between carbon detonations as they emerge from the partially burned material. The evolution toward DDT is accelerated by the SWACER mechanism.
Turbulent mixing and interaction between different types of detonations with the inhomogeneous fuel may produce observational signatures helpful in validating the proposed explosion model. In particular, the results hint at a complete carbon burn but leave a possibility for oxygen enhancement or an incomplete oxygen burn.
We found the model DDT timescale increasing as the turbulent intensity decreases. Because in a centrally ignited scenario stellar layers with density g cm-3 expand on a timescale ms before the density becomes too low for ignition, we do not expect DDT to occur when turbulence is too weak. On the other hand, some intensification of pre-existing turbulence might be possible due to compression caused by the rising flame plumes. These possibilities lend support to future studies of structure and evolution of outer layers of accreting massive white dwarfs.
Acknowledgements
This research used resources of the National Energy Research Scientific Computing Center, which is supported by the Office of Science of the U.S. Department of Energy under Contract No. DE-AC02-05CH11231. The software used in this work was in part developed by the DOE Flash Center at the University of Chicago. Data visualization was performed in part using VisIt (Childs et al., 2012). This research has made use of NASA’s Astrophysics Data System Bibliographic Services.
Data availability
The data underlying this article will be shared on reasonable request to the corresponding author.
References
- Childs et al. (2012) Childs H., et al., 2012, in Bethel E. W., Childs H., Hansen C., eds, , High Performance Visualization–Enabling Extreme-Scale Scientific Insight. CRC Press/Francis–Taylor Group, Boca Raton, p. 357
- Colella & Woodward (1984) Colella P., Woodward P. R., 1984, J. Comput. Phys., 54, 174
- Eswaran & Pope (1988) Eswaran V., Pope S. B., 1988, Phys. Fluids, 31, 506
- Federrath, C. et al. (2010) Federrath, C. Roman-Duval, J. Klessen, R. S. Schmidt, W. Mac Low, M.-M. 2010, A&A, 512, A81
- Fenn & Plewa (2017) Fenn D., Plewa T., 2017, MNRAS, 468, 1361
- Fickett & Davis (1979) Fickett W., Davis C., 1979, Detonation. Univ. California Press, Berkeley
- Fryxell et al. (2000) Fryxell B., et al., 2000, ApJS, 131, 273
- Glasner et al. (2018) Glasner S. A., Livne E., Steinberg E., Yalinewich A., Truran J. W., 2018, MNRAS, 476, 2238
- Höflich et al. (1995) Höflich P., Khokhlov A. M., Wheeler J. C., 1995, ApJ, 444, 831
- Khokhlov (1991) Khokhlov A. M., 1991, A&A, 246, 383
- Khokhlov et al. (1997) Khokhlov A. M., Oran E. S., Wheeler J. C., 1997, ApJ, 478, 678
- Lee et al. (1978) Lee J. H., Knystautas R., Yoshikawa N., 1978, Acta Astronautica, 5, 971
- Niemeyer & Woosley (1997) Niemeyer J. C., Woosley S. E., 1997, ApJ, 475, 740
- Oran & Gamezo (2007) Oran E. S., Gamezo V. N., 2007, Combust. Flame, 148, 4
- Pan et al. (2008) Pan L., Wheeler J. C., Scalo J., 2008, ApJ, 681, 470
- Poludnenko et al. (2019) Poludnenko A. Y., Chambers J., Ahmed K., Gamezo V. N., Taylor B. D., 2019, Science, 366, eaau7365
- Sabelnikov et al. (2019) Sabelnikov V. A., Lipatnikov A. N., Nishiki S., Hasegawa T., 2019, J. Fluid Mech., 867, 45
- Schmidt et al. (2010) Schmidt W., Ciaraldi-Schoolmann F., Niemeyer J. C., Röpke F. K., Hillebrandt W., 2010, ApJ, 710, 1683
- Timmes & Swesty (2000) Timmes F. X., Swesty F. D., 2000, ApJS, 126, 501
- Woosley et al. (2009) Woosley S. E., Kerstein A. R., Sankaran V., Aspden A. J., Röpke F. K., 2009, ApJ, 704, 255
- Woosley et al. (2011) Woosley S. E., Kerstein A. R., Aspden A. J., 2011, ApJ, 734, 37