Spatially Resolved Ultraviolet Spectroscopy of the Great Dimming of Betelgeuse
Abstract
The bright supergiant, Betelgeuse (Alpha Orionis, HD 39801) experienced a visual dimming during 2019 December and the first quarter of 2020 reaching an historic minimum 2020 February 713. During 2019 September-November, prior to the optical dimming event, the photosphere was expanding. At the same time, spatially resolved ultraviolet spectra using the Hubble Space Telescope/Space Telescope Imaging Spectrograph revealed a substantial increase in the ultraviolet spectrum and Mg II line emission from the chromosphere over the southern hemisphere of the star. Moreover, the temperature and electron density inferred from the spectrum and C II diagnostics also increased in this hemisphere. These changes happened prior to the Great Dimming Event. Variations in the Mg II k-line profiles suggest material moved outwards in response to the passage of a pulse or acoustic shock from 2019 September through 2019 November. It appears that this extraordinary outflow of material from the star, likely initiated by convective photospheric elements, was enhanced by the coincidence with the outward motions in this phase of the 400 day pulsation cycle. These ultraviolet observations appear to provide the connecting link between the known large convective cells in the photosphere and the mass ejection event that cooled to form the dust cloud in the southern hemisphere imaged in 2019 December, and led to the exceptional optical dimming of Betelgeuse in 2020 February.
August 13, 2020
1 Introduction
Betelgeuse, (Alpha Orionis, HD 39801), a bright nearby M2Iab supergiant star, has long been known to have modulations in both visible light and radial velocity with a 2000 day period, coupled with semiregular fluctuations varying from 300 to 500 days (Stothers & Leung, 1971; Goldberg, 1984; Guinan, 1984; Dupree et al., 1987; Ridgway, 2013; Chatys et al., 2019). The shorter period of optical modulation is believed to represent radial pulsations in a fundamental or low-overtone mode, while the long period of variation has been attributed to non-radial gravity modes, binarity, or magnetic activity (Kiss et al., 2006; Stothers, 2010; Soszyński & Udalski, 2014).
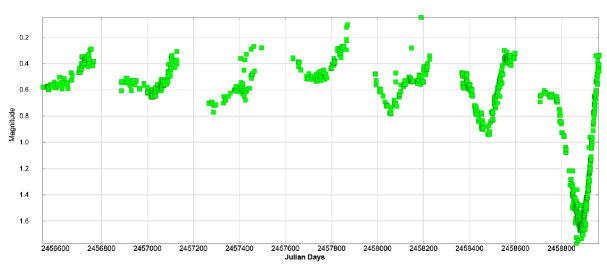
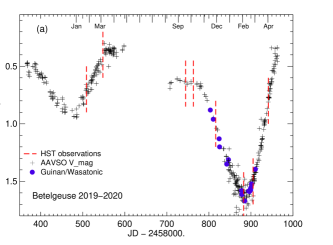
Semiregular photometric variability of Betelgeuse has been documented for over 180 yr. However, in 2019 November, the V magnitude of the star started to fall precipitously (Fig. 1) below its expected values (Guinan et al., 2019). During 2020 February 713, Betelgeuse reached an historic minimum of more than a magnitude dimmer (Guinan et al., 2020), than its typical value of V 0.42 (Johnson et al., 1966). Subsequently, the optical magnitude began to recover.
This dimming attracted enormous public attention. Even the casual observer could see with the naked eye that the star appeared comparable to or fainter than Bellatrix (Gamma Orionis, V=1.64, HD 35468) markedly changing the appearance of the constellation Orion. Additionally, Betelgeuse is a candidate to become a core-collapse Type II supernova (Wheeler et al., 2017) and suspicions were raised that its unusual behavior could be a harbinger to a massive supernova event.
A visible light image of Betelgeuse, taken with SPHERE using the Very Large Telescope Interferometer (VLTI/SPHERE) on 2019 December 26 (Montargès et al., 2020a), revealed a substantial dimming of the star in the southern hemisphere causing a change in its apparent shape as compared to a previous image taken in 2019 January. Observations made on 2020 January 23 (Dharmawardena et al., 2020) suggest a decrease in sub-millimeter flux when compared to previous epochs that could result from changes in the photosphere, either a change in temperature or stellar radius, the former perhaps resulting from the presence of cool spots. However, an optical spectrum obtained on 2020 February 15 suggests a temperature decrease of 100K at most which cannot explain the dimming event (Levesque & Massey, 2020). Possibly the asymmetric appearance resulted from dust forming in the atmosphere. Differential speckle polarimetry of Betelgeuse (Safonov et al., 2020) revealed that the polarized flux of the circumstellar nebulae around the star remained constant from 2019 October until 2020 mid-February when polarization increased. This strengthens the inferred presence of a dust cloud.
Here we report spatially resolved ultraviolet (UV) spectroscopy obtained with the Space Telescope Imaging Spectrograph (STIS) on the Hubble Space Telescope (HST) spanning the Great Dimming Event as well as times prior and subsequent to the Event. We first review the radial-velocity measures followed by the flux changes found in the spatially resolved Mg II emission and the UV spectrum. Electron-density diagnostics from C II are evaluated. Changes in the Mg II k-line profiles are compared to models of pulsations or acoustic shocks passing through a stellar atmosphere. And we consider a scenario not associated with the star to understand the dimming, but resulting from the presence of interstellar dust clouds.
2 Radial Velocity
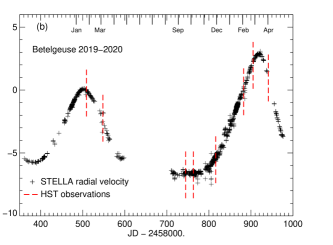
Of particular import is the radial velocity during the time of the Great Dimming (Fig. 2). Radial-velocity measurements of the photosphere were made from optical high-resolution spectra obtained with the fiber-fed STELLA Echelle Spectrograph (SES) mounted on the robotic 1.2m STELLA-II telescope located at Izana Observatory, Tenerife, Spain (Strassmeier et al., 2004). Beginning, in 2019 January, contemporaneously with the start of the HST program, the photosphere began accelerating outwards from a value near its average velocity, reaching in 2019 SeptemberOctober, a maximum outflow velocity of 7 km s-1 relative to the average. Outflowing photospheric material was present for almost one year, from 2019 January to 2019 November. At the time of the HST visit on 2019 November 28, the photospheric velocity had reversed and inflow continued until 2020 mid-March. By 2020 April, the photosphere was moving outward again.
3 HST Observations
Time on HST was awarded for a program of spatially resolved UV spectroscopy of Betelgeuse with four visits to the star each year over three Guest Observer cycles (Dupree, 2018). The UV observations are augmented with multifrequency observations in the radio, infrared, and optical bands to investigate the process of mass loss from the supergiant originating in the photosphere and continuing to the circumstellar environment. These will be reported elsewhere. The historic dimming of the star occurred at precisely an opportune time for the scheduled HST observations during the first two HST cycles. Figure 2 displays the time of the HST observations with respect to the optical light curve. The first visits in 2019 January and March, occurred during times of typical photometric behavior and provide baseline spectra. Beginning in 2019 September, the HST visits captured the optical fading with visits continuing through to 2020 February, followed by the photometric recovery in late 2020 February, and 2020 April 1 (Table 1).
| UTaaAt start of first exposure. | Julian DateaaAt start of first exposure. | Position AnglebbPosition angle of the long axis of the aperture. | HST Data Set |
|---|---|---|---|
| (YYYY-mm-dd) | (-2,458,000) | (deg E of N) | |
| 2019 Jan 25 | 508.80 | 35.1 | ODXG01 |
| 2019 Mar 5 | 548.01 | 40.5 | ODXG02 |
| 2019 Sep 18 | 744.76 | 136.5 | ODXG07 |
| 2019 Oct 6 | 763.25 | 131.5 | ODXG08 |
| 2019 Nov 28 | 816.32 | 102.4 | OE1I01 |
| 2020 Feb 3 | 882.82 | 35.3 | OE1I52 |
| 2020 Feb 25 | 905.26 | 38.1 | OE1I03 |
| 2020 Apr 1 | 941.48 | 50.6 | OE1I04 |

Each visit of HST to Betelgeuse began with a target acquisition, followed by two peakup maneuvers with the small slit (25 100 mas) using the dispersed UV spectrum. During the spectral observations, the 25100 mas aperture of STIS was placed across the UV disk of Betelgeuse at seven or eight positions (Figure 3). An offset pattern of 75 mas, 50 mas, 25 mas, centered, 25, 50, and 75 mas was executed for subsequent exposures. Exposure times for the spectra ranged from 372s at the center position to 1337s or 2813s at the outer positions. A near-UV spectrum was obtained at each offset position. The E230M grating yields a resolution of 30,000 and spans 22753070Å with the 2707Å setting. This spectral region contains the strong Mg II chromospheric emission lines and many other weaker transitions that can trace the dynamics as well as the atmospheric structure.
During 2019, HST had several problems with acquisition or reacquisition of guide stars, and the position of the aperture was not known. We do not use those spectra. New visits were successful, and are only used here. Table 1 contains a summary of the visits and data sets. In the second HST cycle, we were also able to acquire an additional spectrum at an offset position of 100 mas during each visit. Because the orientation of the spacecraft changes (see Table 1), five scans proceed from the northwest to the southeast across the star, and three others move in approximately the reverse direction. Figure 3 shows the positions of the aperture center and direction of motion for each of the eight visits.
4 Chromospheric Mg II Emission
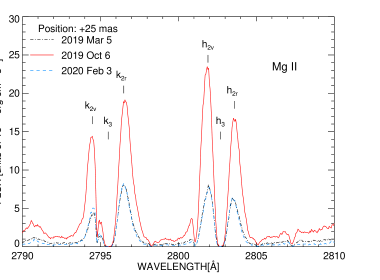
The Mg II emission lines, 2795.528Å (k-line) and 2802.705Å (h-line) provide evidence of plasma at chromospheric temperatures (4000K8000K). The shapes of the Mg II h- and k-lines in Betelgeuse (Fig. 4) differ from one another, which is unusual among luminous cool stars (Robinson & Carpenter, 1995). Modeling of the Mg II profiles in a semiempirical spherical atmosphere, with a multilevel atom, and non-LTE formulation (Lobel & Dupree, 2000) suggests that the intrinsic shape of the k-line should mimic that of the h-line. Circumstellar absorption from Mn I (2794.817Å) and Fe I (2795.006Å) can reduce the flux in the blue component of the k-line, but it is not at all clear that these lines can reduce the flux sufficiently to match the observed profiles. It may be that wind absorption also plays a role, because the k-line would be affected more than the h-line (Uitenbroek et al., 1998) due to its larger opacity.
The aperture-integrated intensity of each Mg II line as a function of position across the UV disk is shown in Figure 5a for the eight visits spanning 2019 January 25 through 2020 April 1. A strong enhancement in the chromospheric emission, by factors of two to four appeared in the southeast quadrant of the star during the three visits spanning 2019 September 18 through 2019 November 28. The flattened image of the UV spectrum on the MAMA detector (the files with extension flt) at the brightest position (25 mas) during the outburst (September to November) appears symmetric in the cross-dispersion direction111The cross-dispersion direction is parallel to the long axis of the aperture., mimicking the known response of the point-spread function. This suggests that the source of the excess emission was not positioned at one or the other end of the aperture, but reasonably centered in the southeast. Following the enhancement event, the Mg II flux observed on 2020 February 3 had returned to a level consistent with that in 2019 January and 2019 March. During the ‘normal’ times for the ultraviolet (2019 January2019 March and 2020 February2020 April), the spatial distribution of the flux appears reversed, becoming stronger towards the northwest than towards the southeast. But note that the optical V magnitude was historically faint during early 2020 February.
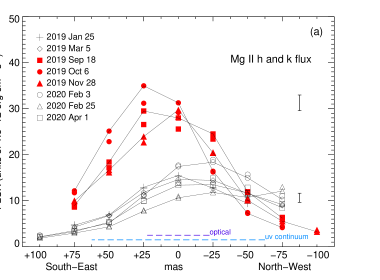
The line fluxes differ from those recorded by Dupree et al. (1987) using IUE. Particularly intriguing is the ratio of the total line fluxes: k-line to h-line. During 1984-1986, the disk-integrated k-line flux was consistently equal to or stronger than the h-line flux by factors ranging from 1.01.4. However the spatially resolved STIS spectra, beginning in 2019 March and extending through 2019 October exhibit a k-line that has a lower flux than the h-line. The largest decrease in the spatially resolved Mg II k flux, namely 11% (leading to a k/h ratio of 0.89) occurs in the southern hemisphere (position +25mas) in 2019 October. By 2020 February 3, the lines revert back to their ‘normal’ ratio: namely the flux in the k-line becomes comparable (to within 3%) to that in the h-line.222Creation of a disk-integrated flux in the h and k-lines, by summation over all the STIS pointings at each visit produces a ratio of the k-line to h-line flux that is consistent with 1.0 to within 6%. The disk-integrated ratio from the 2019 October pointing is the lowest at 0.94. We speculate that increased absorption, either from the circumstellar Mn I and Fe I features or from outflowing material or both, could cause this weakening of the k-line flux. Alternatively, the structure of the chromosphere changed substantially from earlier times to produce the different flux ratio.
5 UV Broad-Band Emission
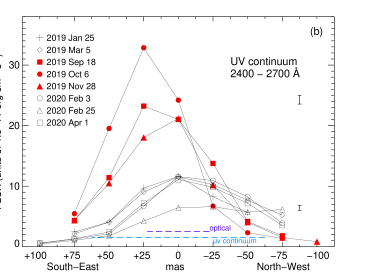
The near-UV flux from 2400-2700Å is shown in Figure 5b as a function of position for the eight visits. An enhancement in the southern hemisphere, similar to that found in the Mg II emission, also occurs in these broad band observations in 2019 SeptemberNovember. The flux at the 25 mas position, at maximum in 2019 October, is a factor of 3.5 larger than in the 2019 JanuaryMarch observations. Contrast this with the enhancement of the h-line of 2.9 and the k-line of a factor of 2.4. Because the broadband UV is formed closest to the stellar photosphere, the Mg II h-line above that, and the Mg II k-line highest of all in the atmosphere, such a systematic change suggests the presence of a substantial photospheric phenomenon. A similar behavior was noted (Uitenbroek et al., 1998) in the near-UV spectra obtained with the larger aperture of the GHRS, which was accompanied by a contemporaneous HST Faint Object Camera (FOC) ultraviolet image. The UV image revealed a single large unresolved bright area in the southwest quadrant of the disk (Gilliland & Dupree, 1996), and a systematic enhancement in Mg II was present. Thus we conclude that during the months of 2019 September through November, a similar bright area was present in the southeast quadrant. We identify the position of maximum flux in the southeast because in the majority of offset pointings that position marks the aperture center. Additionally, as noted earlier, the spectrum in the direction of the long axis of the aperture appears symmetric across the 4 pixel aperture.
Under typical conditions, the spectrum near 2500Å approximates a blackbody with T 5000K (Gilliland & Dupree, 1996). An enhancement of a factor of 3.5 at maximum, such as occurred in the south in 2019 October, interpreted as a temperature change above the photosphere, suggests an increase in temperature of about 600K, to 5600K. This exceeds the enhancement found in 1995 in which the bright area on the UV disk image was a factor 1.31.8 brighter than the surrounding disk, and suggested a temperature differential of 200K. The event in the fall of 2019 appears to be more energetic.
6 Electron Densities
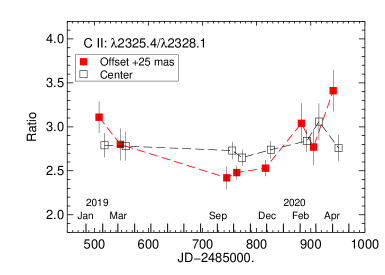
Near-UV transitions of C II offer a direct measure of the electron density (Judge & Carpenter, 1998; Harper & Brown, 2006). The ratio of two transitions, 2325.398 and 2328.122Å between the configurations and is sensitive to electron density. These lines are not significantly blended and are easily deconvolved. The flux ratios from the spectra at the center and at position +25 mas (the pointing with maximum flux in the southeast) are shown in Figure 6. While the central position appears consistent with a constant ratio, the ratio at the +25 mas position is lower in 2019 SeptemberNovember than prior or subsequent to this time. This lower value signals an increase in the electron density. Atomic calculations from Harper & Brown (2006), assuming a temperature of 6300K, suggest a density increase by 0.5 dex or more during the chromospheric outburst in the fall of 2019 depending on the optical depth of the lines. The density returned to preoutburst value by 2020 February. Thus the southern hemisphere displayed a warmer denser plasma during the 2019 SeptemberNovember outburst as compared with prior and subsequent times. A detailed examination of other members of the multiplet and different offset positions is underway.
7 Temporal Changes in Profiles
The near-UV spectrum contains transitions that can indicate atmospheric dynamics by the shape and changing appearance of the line profiles. Chromospheric Ca II and Mg II lines in cool stars have been scrutinized and modeled intensely, particularly with respect to high-resolution solar observations (Leenaarts et al., 2013). Diagnostics based on line strengths, asymmetries, or Doppler shifts in the Sun cannot be easily transferred to the spectrum of a supergiant, partly because of narrow absorption features in the Betelgeuse Mg II spectrum (Fig. 4) that cross the line profile and the broad deep central reversal (h3 and k3). And of course, atmospheric conditions and radiative transfer effects in a luminous supergiant star differ substantially from those of a dwarf star. However, several models of the Sun consider the simple response of the Mg II k-line profile to the passage of a pulse or an acoustic shock through the atmosphere (Gouttebroze & Leibacher, 1980; Carlsson & Stein, 1992). These models demonstrate that the pulse produces enhanced emission on the short-wavelength side of the line (k2v) due to the increased temperature and density of the material moving outward. And in fact, the observed ratio, k2v/k2r in Betelgeuse spectra (Fig. 7) does show such an increase during 2019 SeptemberNovember, suggesting the presence of an outwardly moving disturbance in the southeast quadrant of the star.

The disk-integrated Ca II K-line generally shows a similar profile and behavior during 2019 and 2020. Echelle spectra obtained at the Tillinghast Reflector Echelle Spectrograph (TRES) at the Fred Lawrence Whipple Observatory (FLWO), reveal a similar change in Ca II K-line as the Mg II k-line. The short-wavelength emission peak (K2v) generally becomes stronger then the long-wavelength emission peak (K2r) beginning in 2019 April 18 and continuing though 2019 October. However, both prior (2019 March 5) and subsequent to the chromospheric outburst (2020 January 17), the strength of the peaks is reversedthat is, K2v K2r. This asymmetry suggests that a stable outflow has returned to the chromosphere.
8 A Transiting Cloud?
The VLT/SPHERE optical image of Betelgeuse (Montargès et al., 2020a, b) made in 2019 December revealed an oddly shaped stellar image displaying a faint southern hemisphere. That image was reminiscent of an earlier image of the Epsilon Aur system (Kloppenborg et al., 2010). Epsilon Aurigae is an eclipsing binary star system, in which the primary is an F-type star, and the secondary is a single B5V-type star surrounded by an opaque dust disk. The dust disk transited the primary star, causing a large dark region to move across the southeast to southwest quadrant of the F star over 1 month. Currently Betelgeuse is not believed to have a companion.333Karovska et al. (1986) reported that Betelgeuse has 2 companions using a new photon-counting camera and speckle imaging reconstruction. However subsequent high resolution imaging has failed to confirm the presence of companions (Hebden et al., 1986; Christou et al., 1988; Buscher et al., 1990; Kervella et al., 2009). The region surrounding Betelgeuse contains complex bow shocks as revealed by the Herschel satellite (Decin et al., 2012).
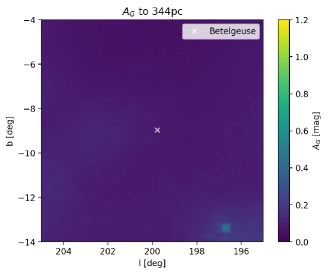
An alternate scenario to explain the anomalous image is that Betelgeuse moved behind an interstellar dust cloud not produced by the star, that obscured the southern hemisphere. Recent three-dimensional mapping of nearby interstellar dust clouds was constructed by Leike et al. (2020) by using combined data from Gaia, the Two Micron All Sky Survey, PANSTARRS, and ALLWISE. They modeled dust densities in clouds up to a distance of 400 pc with a resolution of 1 pc amounting to 15 arcminutes at 222 pc, the distance of Betelgeuse (Harper et al., 2017). Figure 8 shows the expected integrated G-band extinction for a 10 degree field on the sky centered on Betelgeuse. The figure displays the extinction at the maximum distance of Betelgeuse indicated by the lower error bound on the parallax, corresponding to 344 pc. No sign of dust is apparent. Calculation of the extinction at the distance of the star (222 pc) and the higher error bound on the parallax (164 pc) produces images that replicate the image at 344 pc with no indication of any dust features. Extinction in other directions as displayed in Leike et al. (2020) clearly demonstrates the generally unobscured line of sight to Betelgeuse. While these observations cannot exclude the presence of isolated dust features at the scale of 1 pc or below, they do suggest that Betelgeuse is located in a generally dust-free region. It does not appear likely that the star moved behind a dust cloud. This confirms the results from Levesque & Massey (2020), who show that the optical spectrum of Betelgeuse is attenuated more uniformly than would be expected from typical extinction by interstellar dust.
9 Discussion
These results reveal the connection between the photosphere, the chromosphere, and the subsequent dust production that appeared to obscure Betelgeuse in 2019 December leading to the deep optical dimming in 2020 February. The UV observations clearly indicate a bright, hot, dense structure appeared in the upper photosphere and low chromosphere in the southern hemisphere of the star during 2019 September through November. This bright structure was present before the onset of the optical dimming event. During this time the photosphere was expanding (Fig. 2) following its 420 day pulsation period. The UV line profiles signaled the passage of a pressure wave outwards through the atmosphere. The photosphere and chromosphere of Betelgeuse are well-documented to exhibit large variable bright areas most likely arising from large convective cells in the photosphere (Haubois et al., 2009; Kervella et al., 2009; Montargès et al., 2016) creating hot regions in the chromosphere (Gilliland & Dupree, 1996; Dupree & Stefanik, 2013).
We speculate that a convective upflow in the photosphere initiated a major outflow event, and its effect was enhanced by the coincidence with outward motion present at this phase of the pulsation cycle, combining the upward motion of these two distinct physical mechanisms into an extraordinary strong upflow. This plasma produced the substantial increase in UV line and continuum emission 2019 SeptemberNovember. Eventually the material cooled, forming the dust that obscured the southern hemisphere of the star revealed in the VLTI/SPHERE optical images from 2019 December 26 (Montargès et al., 2020a, b). The dust opacity increased rapidly over the next 6 weeks, causing the exceptional deep optical dimming in 2020 February by which time the stellar atmosphere had returned to its previous state.
Kervella et al. (2018) suggested that ’rogue’ convective cells in the photosphere observed in the submillimeter range emitted a focused molecular plume that could condense into dust. A molecular plume associated with this event should be sought - and would provide added confirmation of this scenario.
The spatial location of the 2019 chromospheric event reported here is of particular interest. Previous spatially resolved spectroscopy in both the UV (Uitenbroek et al., 1998) and the submillimeter ranges (Kervella et al., 2018) have given indications of the rotational axis of Betelgeuse. Based on velocity shifts of photospheric lines and the presence of a bright spot in the south, Uitenbroek et al. (1998) identified the spot with the pole of the rotation axis, placing the rotation axis at 55∘ E of N. This is in harmony with polarization measures and early theoretical models (Asida & Tuchman, 1995) of the emergence of convective elements in the photosphere. Moreover, extended ’plumes’ have been observed in the southwest from the star (Kervella et al., 2009). ALMA measurements of SiO emission in the submillimeter region (Kervella et al., 2018) suggest that the north pole of the star is directed toward 483.5 (E of N). Again, the presence of a hot spot, a molecular plume and a pre-existing dust shell toward the north indicated that the north pole was a source of a mass outflow event. Association with the rotation pole may indicate the presence and effect of a dipole magnetic field. However, the source of this 2019 chromospheric event does not appear aligned with either rotational pole of Betelgeuse. This brightening occurred in the southeast quadrant, and at a location different from the position of either stellar pole. Other bright spots in the photosphere (Haubois et al., 2009), chromosphere (Dupree & Stefanik, 2013), and extended atmosphere (O’Gorman et al., 2017) have occurred on the disk and away from the polar regions. Previous UV spatially resolved spectra (Lobel, 2002) revealed the presence of large scale global nonradial oscillations in the chromosphere of Betelgeuse. It seems likely that large photospheric convective cells, chromospheric events, and subsequent mass outflow exhibit no preference to originate at the rotation poles.
The Great Dimming of Betelgeuse may be similar to the R Cor Borealis phenomenon. R Cor Bor objects are post-AGB supergiants that undergo substantial dust-formation episodes and rapid fading of optical light. The fading in the optical can occur over several days or weeks (Clayton et al., 2013). Observations suggest the dust forms in the atmosphere and then is radiatively accelerated to high velocities (220 km s-1). The chromospheric outflow as measured in the He I 10830Å transition appears during the decline when radiation pressure accelerates the dust and gas. Unfortunately, Betelgeuse does not exhibit this He I transition, and its radiation field is weaker than the warmer R Cor Bor objects. We have not yet measured any such rapid acceleration in the atmosphere of Betelgeuse. However, the time scale for the inferred dust formation in Betelgeuse, namely 1-2 months, is comparable to the R Cor Bor stars.
We are fortunate that Betelgeuse is relatively close by so that features on the star and in its extended atmosphere can be resolved to probe the mass-loss process and the circumstellar environment of a supergiant. We anticipate the next minimum in 420 days from 2020 February which will happen in 2021 April, unfortunately as Betelgeuse moves into the daylight hours for observations from Earth. However, the presence of spacecraft, such as STEREO, at different positions in the Earth’s orbit, and landers on Mars, may fortunately allow us to follow the next minimum.
We acknowledge with thanks the variable star observations from the AAVSO International Database contributed by observers worldwide and used in this research. Results are based partly on data obtained with the STELLA robotic telescope in Tenerife, an AIP facility jointly operated by the AIP and the IAC. We appreciate the work of Michael Leveille at STScI for facilitating the HST visits. We also thank members of the.MOB (Months of Betelgeuse) for helpful and spirited discussion. This work was supported in part by STScI Grant HST-G0-15641.001 to the Smithsonian Astrophysical Observatory. MM acknowledges support from the ERC consolidator grant 646758 AEROSOL.
References
- Asida & Tuchman (1995) Asida, S. M., & Tuchman, Y. 1995, ApJ, 455, 286
- Buscher et al. (1990) Buscher, D. F., Haniff, C. A., Baldwin, J. E., et al. 1990, MNRAS, 245, 7P
- Carlsson & Stein (1992) Carlsson, M., & Stein, R. F. 1992, ApJ, 397, L59
- Chatys et al. (2019) Chatys, F. W., Bedding, T. R., Murphy, S. J., et al. 2019, MNRAS, 487, 4832
- Christou et al. (1988) Christou, J. C., Hebden, J. C., & Hege, E. K. 1988, ApJ, 327, 894
- Clayton et al. (2013) Clayton, G. C., Geballe, T. R., & Zhang, W. 2013, AJ, 146, 23
- Decin et al. (2012) Decin, L., Cox, N. L. J., Royer, P., et al. 2012, A&A, 548, A113
- Dharmawardena et al. (2020) Dharmawardena, T. E., Mairs, S., Scicluna, P., et al. 2020, ApJ, 897, L9
- Dupree (2018) Dupree, A. K. 2018, HST Proposal, 15641
- Dupree et al. (1987) Dupree, A. K., Baliunas, S. L., Guinan, E. F., et al. 1987, ApJ, 317, L85
- Dupree & Stefanik (2013) Dupree, A. K., & Stefanik, R. P. 2013, in Betelgeuse Workshop 2012, ed. P. Kervella, T. LeBertre, & G. Perrin, EAS Publications Series, 60, 77-84
- Famaey et al. (2005) Famaey, B., Jorissen, A., Luri, X., et al. 2005, A&A, 430, 165
- Gilliland & Dupree (1996) Gilliland, R. L., & Dupree, A. K. 1996, ApJ, 463, L29
- Goldberg (1984) Goldberg, L. 1984, PASP, 96, 366
- Gouttebroze & Leibacher (1980) Gouttebroze, P., & Leibacher, J. W. 1980, ApJ, 238, 1134
- Guinan (1984) Guinan, E. F. 1984, in Cool Stars, Stellar Systems, and the Sun, Proc. Third Cambridge Workshop on Cool Stars, Stellar Systems and the Sun, ed. S. Baliunas & L. Hartmann, Lecture Notes in Physics, 193, 336
- Guinan et al. (2019) Guinan, E. F., Wasatonic, R. J., & Calderwood, T. J. 2019, The Astronomer’s Telegram 13341, 1
- Guinan et al. (2020) Guinan, E., Wasatonic, R., Calderwood, T., et al. 2020, The Astronomer’s Telegram 13512, 1
- Harper & Brown (2006) Harper, G. M., & Brown, A. 2006, ApJ, 646, 1179
- Harper et al. (2017) Harper, G. M., Brown, A., Guinan, E. F., et al. 2017, AJ, 154, 11
- Haubois et al. (2009) Haubois, X., Perrin, G., Lacour, S., et al. 2009, A&A, 508, 923
- Hebden et al. (1986) Hebden, J. C., Christou, J. C., Cheng, A. Y. S., et al. 1986, ApJ, 309, 745
- Johnson et al. (1966) Johnson, H. L., Mitchell, R. I., Iriarte, B., et al. 1966, Communications of the Lunar and Planetary Laboratory, 4, 99
- Judge & Carpenter (1998) Judge, P. G., & Carpenter, K. G. 1998, ApJ, 494, 828
- Kafka (2020) Kafka, S. 2020, Observations from the AAVSO International Database (https://www.aavso.org)
- Karovska et al. (1986) Karovska, M., Nisenson, P., & Noyes, R. 1986, ApJ, 308, 260
- Kervella et al. (2018) Kervella, P., Decin, L., Richards, A. M. S., et al. 2018, A&A, 609, A67
- Kervella et al. (2009) Kervella, P., Verhoelst, T., Ridgway, S. T., et al. 2009, A&A, 504, 115
- Kiss et al. (2006) Kiss, L. L., Szabó, G. M., & Bedding, T. R. 2006, MNRAS, 372, 1721
- Kloppenborg et al. (2010) Kloppenborg, B., Stencel, R., Monnier, J. D., et al. 2010, Nature, 464, 870
- Leenaarts et al. (2013) Leenaarts, J., Pereira, T. M. D., Carlsson, M., et al. 2013, ApJ, 772, 89
- Leike et al. (2020) Leike, R. H., Glatzle, M., & Enßlin, T. A. 2020, arXiv e-prints, arXiv:2004.06732
- Levesque & Massey (2020) Levesque, E. M., & Massey, P. 2020, ApJ, 891, L37
- Lobel (2002) Lobel, A. 2002, In12th Cambridge Workshop on Cool Stars, Stellar Systems, and the Sun, arXiv 0211506, online at http://origins.colorado.edu/cs12/
- Lobel & Dupree (2000) Lobel, A., & Dupree, A. K. 2000, ApJ, 545, 454
- Lobel & Dupree (2001) Lobel, A., & Dupree, A. K. 2001, ApJ, 558, 815
- Montargès et al. (2020a) Montargès, M., Cannon, E., Kervella, P., et al. 2020a, ESO Press release ESO2003
- Montargès et al. (2016) Montargès, M., Kervella, P., Perrin, G., et al. 2016, A&A, 588, A130
- Montargès et al. (2020b) Montargès, M., et al., 2020b, in prep.
- O’Gorman et al. (2017) O’Gorman, E., Kervella, P., Harper, G. M., et al. 2017, A&A, 602, L10
- Ridgway (2013) Ridgway, S. T. 2013, in Betelgeuse Workshop 2012, ed. P. Kervella, T. LeBertre, & G. Perrin, EAS Publications Series, 60, 5-16
- Robinson & Carpenter (1995) Robinson, R. D., & Carpenter, K. G. 1995, ApJ, 442, 328
- Safonov et al. (2020) Safonov, B., Dodin, A., Burlak, M., et al. 2020, arXiv e-prints, arXiv:2005.05215
- Soszyński & Udalski (2014) Soszyński, I., & Udalski, A. 2014, ApJ, 788, 13
- Stothers & Leung (1971) Stothers, R., & Leung, K. C. 1971, A&A, 10, 290
- Stothers (2010) Stothers, R. B. 2010, ApJ, 725, 1170
- Strassmeier et al. (2004) Strassmeier, K. G., Granzer, T., Weber, M., et al. 2004, Astronomische Nachrichten, 325, 527
- Uitenbroek et al. (1998) Uitenbroek, H., Dupree, A. K., & Gilliland, R. L. 1998, AJ, 116, 2501
- Wheeler et al. (2017) Wheeler, J. C., Nance, S., Diaz, M., et al. 2017, MNRAS, 465, 2654