Sensei: Aligning Video Streaming Quality with Dynamic User Sensitivity
Abstract
This paper aims to improve video streaming by leveraging a simple observation—users are more sensitive to low quality in certain parts of a video than in others. For instance, rebuffering during key moments of a sports video (e.g., before a goal is scored) is more annoying than rebuffering during normal gameplay. Such dynamic quality sensitivity, however, is rarely captured by current approaches, which predict QoE (quality-of-experience) using one-size-fits-all heuristics that are too simplistic to understand the nuances of video content, or that are biased towards the video content they are trained on (in the case of learned heuristics).
The problem is that none of these approaches know the true dynamic quality sensitivity of a video they have never seen before. Therefore, instead of proposing yet another heuristic, we take a different approach: we run a separate crowdsourcing experiment for each video to derive users’ quality sensitivity at different parts of the video. Of course, the cost of doing this at scale can be prohibitive, but we show that careful experiment design combined with a suite of pruning techniques can make the cost negligible compared to how much content providers invest in content generation and distribution. For example with a budget of just $31.4 per min video, we can predict QoE up to 37.1% more accurately than state-of-the-art QoE models.
Our ability to accurately profile time-varying user sensitivity inspires a new approach to video streaming—dynamically aligning higher (lower) quality with higher (lower) sensitivity periods. We present a new video streaming system called Sensei that incorporates dynamic quality sensitivity into existing quality adaptation algorithms. We apply Sensei to two state-of-the-art adaptation algorithms, one rule-based and one based on deep reinforcement learning. Sensei can take seemingly unusual actions: e.g., lowering bitrate (or initiating a rebuffering event) even when bandwidth is sufficient so that it can maintain a higher bitrate without rebuffering when quality sensitivity becomes higher in the near future. Compared to state-of-the-art approaches, Sensei improves QoE by 15.1% or achieves the same QoE with 26.8% less bandwidth on average.
1 Introduction
An inflection point in Internet video traffic is afoot, driven by more ultra-high resolution videos, more large-screen devices, and ever-lower user patience for low quality [3, 10]. At the same time, the video streaming industry over its several decades of evolution has largely saturated the room for improvement: recent adaptive bitrate (ABR) algorithms (e.g., [41, 33, 60]) achieve near-optimal balance between bitrate and rebuffering events, and recent video codecs (e.g., [52, 40]) improve encoding efficiency but require an order of magnitude more computing power than their predecessors. The confluence of these trends means that the Internet may soon be overwhelmed by online video traffic,111This is vividly illustrated by the recent actions taken by YouTube and Netflix (and many others) to lower video quality in order to save ISPs from collapsing as more people stay at home and binge watch online videos [12]. and new ways are needed to attain fundamentally better tradeoffs between bandwidth usage and user-perceived QoE (quality of experience).
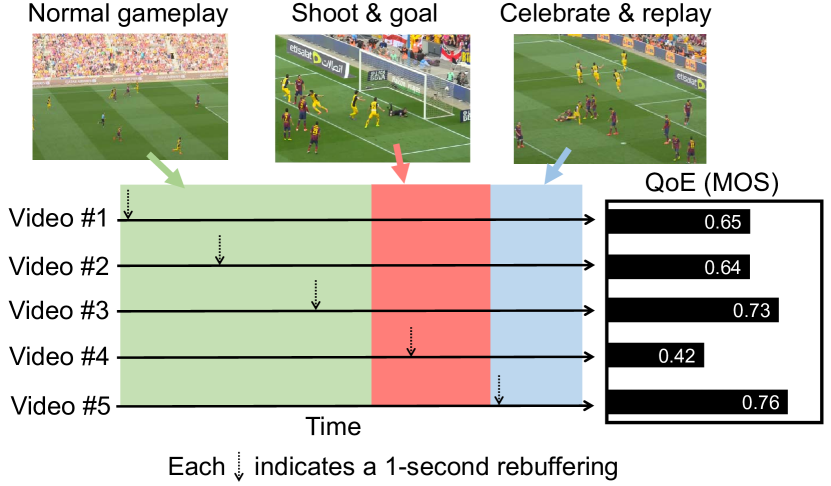
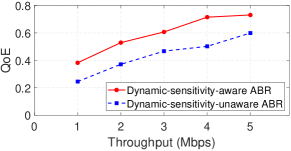
We argue that a key limiting factor is the conventional wisdom that users care about quality in the same way throughout a video, so video quality should be optimized using the same standard everywhere in a video. This means that lower quality—due to rebuffering, low visual quality, or quality switches—should be avoided identically from the beginning to the end. We argue that this assumption is not accurate. In sports videos, a rebuffering event that coincides with scoring tends to inflict more negative impact on user experience than rebuffering during normal gameplay, as shown in Figure 1. Similarly, bitrate switches or rebuffering during key moments of a movie, when tensions have built up, tend to be more noticeable to viewers. In other words, user sensitivity to lower quality varies with the video content dynamically over time.
Unfortunately, both the literature on ABR algorithms and the literature on QoE modeling adopt the conventional wisdom. Most ABR algorithms completely ignore the content of each video chunk: they focus on balancing the bitrate with the available network bandwidth, and thus consider only the size and download speed of the chunks. Traditional ways of modeling QoE are also agnostic to the video content, although recent QoE models (e.g., PSNR [30], SSIM [57], VMAF [11], and deep-learning models [26, 35]) try to predict which content users will be more sensitive to by studying pixel-level differences between frames. These models seek heuristics that generalize across all videos and thus resort to generic measures (like pixel-level differences), but it is unclear if any heuristic can capture the diverse and dynamic influence a video’s content can have on users’ sensitivity to quality.
For example, models like LSTM-QoE [26] assume that users are more sensitive to rebuffering events in more “dynamic” scenes. In sports videos, however, non-essential content like ads and quick scans of the players can be highly dynamic, but users may care less about quality during those moments. In the video in Figure 1, LSTE-QoE considers normal gameplay to be the most dynamic part, but the most quality sensitive part of the video according to the user study is the goal. This shows that quality sensitivity can vary depending on the content, and may be unique for each video.
The dynamic nature of quality sensitivity suggests a new opportunity for QoE improvement and bandwidth savings:
-
Similar bandwidth, higher QoE: If users are about to become more quality sensitive, we can carefully lower the current quality—e.g., lower the bitrate or add a short rebuffering event—to save bandwidth and ensure higher quality when users become more sensitive. Similarly, we can also increase the current bitrate for a few chunks if quality sensitivity is expected to drop in the near future.
-
Similar QoE, lower bandwidth: When quality sensitivity is low, we can judiciously lower the bitrate to save bandwidth while minimally impacting the perceived QoE. perceived.
In short, we seek to align higher (lower) quality of video chunks with higher (lower) quality sensitivity of users.
We present Sensei, a video streaming system that incorporates dynamic quality sensitivity into its QoE model and video quality adaptation. Sensei addresses two key challenges.
Challenge 1: How do we profile the unique dynamic quality sensitivity of each video in an accurate and scalable manner? As we observed, existing QoE models use general heuristics that are unable to predict the differences in quality sensitivity between chunks of the same video, or across videos.
Crowdsourcing the true quality sensitivity per video: Instead of proposing yet another heuristic, Sensei takes a different approach. We run a separate crowdsourcing experiment for each video to derive the quality sensitivity of users at different parts of the video. Specifically, we elicit quality ratings directly from real users (obtaining a “ground truth” of their QoE) for multiple renderings of the same video, where each rendering involves some degradation in quality. We use these ratings to estimate a weight for each video chunk that encodes its quality sensivity. Sensei automates and scales this process out using a public crowdsourcing platform (Amazon MTurk), which provides a large pool of raters. Our empirical results show that the relative quality sensitivity of chunks is robust to any particular low-quality incident, allowing us to encode each chunk’s quality sensitivity using a single weight, independent of the quality of other chunks. We combine this with a suite of cost-cutting techniques to reduce the number of rendered videos that need to be rated.
Challenge 2: How do we incorporate dynamic quality sensitivity into a video streaming system to enable new decisions? Today’s video players are designed to be “greedy”: they pick a bitrate that maximizes the quality of the next chunk while avoiding rebuffering events. But in order to utilize dynamic quality sensitivity, a player must “schedule” bitrate choices over multiple future chunks, each having a potentially different quality sensitivity. This means that some well-established behaviors of video players, e.g., only rebuffer when the buffer is empty, may prohibit the envisioned optimizations.
Refactoring video streaming to align quality adaptation with quality sensitivity: Instead of proposing a new video streaming protocol, Sensei takes a pragmatic approach by working within the popular DASH framework, but introduces two practical modifications. First, it integrates the per-chunk weights mentioned above into the existing DASH protocol in a natural way. These weights are then incorporated into an existing ABR algorithm to leverage the dynamic quality sensitivity of upcoming video chunks when making quality adaptation decisions. We apply Sensei to two state-of-the-art ABR algorithms: Fugu [60], a more traditional rule-based algorithm, and Pensieve [41], a deep reinforcement learning algorithm. Second, Sensei enables new adaptation actions that “borrow” resources from low-sensitivity chunks and give them to high-sensitivity chunks. For example, it can lower the bitrate (or initiate a rebuffering event) even when bandwidth is sufficient (or the buffer is not empty), in order to maintain a higher bitrate when quality sensitivity becomes higher.
Using its scalable crowdsourcing approach, Sensei can predict QoE more accurately than state-of-the-art QoE models. For example, with a budget of just $31.4 per min video, Sensei achieves 55% less QoE prediction errors than existing models. Compared to state-of-the-art ABR algorithms, Sensei improves QoE on average by 15.1% or achieves the same QoE with 32% less bandwidth.
Contributions and roadmap: Our key contributions are:
-
A measurement study revealing substantial temporal variability in users’ quality sensitivity and the potential of improving video streaming QoE and bandwidth efficiency by embracing this variable sensitivity (§2).
-
The design and implementation of Sensei, including:
2 Motivation
We begin by showing that existing approaches to modeling video streaming QoE (2.1) fail to accurately capture the true user-perceived QoE (2.2). We then present user studies that reveal a missing piece in today’s QoE modeling—users’ quality sensitivity varies dynamically throughout a video (2.3). Finally, we show that by introducing dynamic quality sensitivity to ABR algorithms, we could significantly improve QoE and save bandwidth (2.4).
2.1 Prior approaches to QoE modeling
Taxonomy of QoE models: QoE models are a key component of modern video streaming systems. A QoE model takes a streamed video as input and returns a predicted QoE as output. When streaming a video, the video player optimizes the predicted QoE (explicitly [60, 41] or implicitly [33]) by adapting the bitrate of each video chunk to the available bandwidth. QoE is often measured by mean opinion score (MOS), or the mean rating (e.g., on a scale of 1 to 5) assigned by a group of users to the quality of a video.333QoE is sometimes measured by other metrics, such as user engagement (how long users watch a video). Our methodology extends to other metrics.
Current QoE models focus on two aspects:
-
Pixel-based visual quality tries to capture the impact of visual distortion on QoE, based on the differences in pixel values between the encoded frames and the original (uneconded) frames. Metrics of pixel-based quality, sometimes called visual quality assessment (VQA), include quantization parameter (QP) [45], PSNR [30], SSIM [57, 56], STRRED [49], VMAF [11] and DeepVQA [35].
-
Streaming quality incidents include events during the streaming process that negatively impact user experience, such as rebuffering, low bitrate, and visual quality switches. The impact of these incidents is modeled via summary metrics, such as rebuffering ratio, average bitrate, frequency of bitrate switches during a video (e.g., [22, 14]).
Some work also takes into account contextual factors (e.g., viewer’s emotion, acoustic conditions, etc.), which are orthogonal to our focus on the impact of objective quality on QoE.
State-of-the-art QoE models: The latest QoE models combine pixel-based visual quality metrics and quality-incident metrics to achieve better QoE prediction. We focus on three such QoE models: KSQI, P.1203, and LSTM-QoE, which were proposed within the past two years and have open-source implementations. KSQI [23] combines VMAF, rebuffering ratio, and quality switches in a linear regression model. P.1203 [48] combines QP values and quality incident metrics in a random-forest model. More recently, LSTM-QoE [26] takes STRRED and individual quality incidents as input to a long short-term memory (LSTM) network designed to capture the “memory effect” of human perception of past quality incidents. (We discuss related work in §8.)
2.2 QoE prediction accuracy today
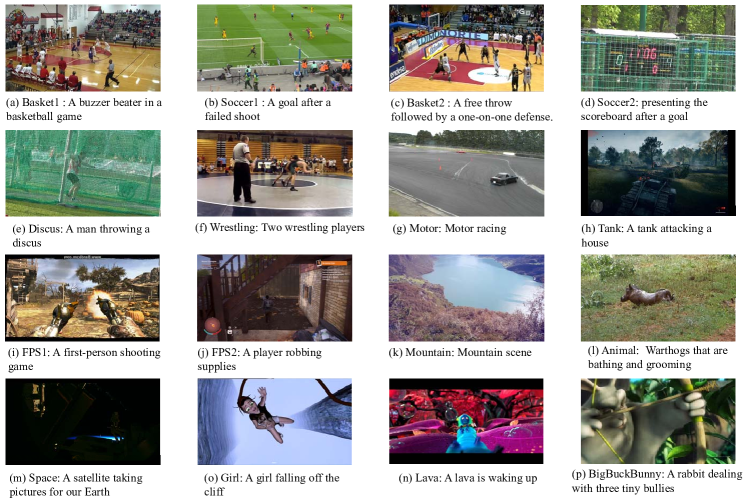
To evaluate the prediction accuracy of these QoE models, we created a video set of 16 source videos randomly selected from four public datasets [28, 17, 24, 55] and 7 throughput traces randomly selected from real-world cellular networks [47, 6]. The source videos (summarized in Table 1) cover a wide range of content genres (sports, scenic, movies, etc.), and the throughput traces exhibit bandwidths from 200Kbps to 6Mbps. Following recent work (e.g., [23, 41]), we replay each trace and emulate the process of streaming each video using different ABR algorithms: Fugu [60], Pensieve [41], and BBA [33]. This creates 336 (1673) rendered videos.
Using this dataset, we train KSQI and LSTM-QoE on a subset of 315 videos and test them on the remaining 21 videos. (We ensure that our trained versions have higher accuracy on the test set than the pre-trained models.) To obtain the ground truth, we elicit QoE ratings from crowdsourced workers on Amazon MTurk [1] following the methodology described in §4. We use the MOS over a sufficient number of ratings (>30) as the true QoE for each of the 336 videos. We normalize the output range of the QoE models (and the true QoE) to .
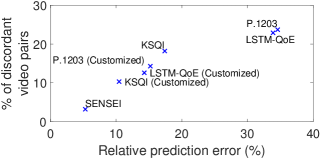
The x-axis of Figure 2 shows the mean relative prediction error of each QoE model on our test set, where the relative prediction error is defined as for each video; and are the predicted and true QoE of the video. We see that these errors are nontrivial; even the most accurate QoE model has over 10.4% error on average.
We also examine whether these models can correctly rank the QoE achieved by two different ABR algorithms. For each pair of source video and throughput trace, we first rank every two of the three ABR algorithms using their true QoE and then rank them using the predicted QoE. If the rank is different, this pair is called a discordant pair. The y-axis of Figure 2 shows the fraction of discordant pairs among all possible pairs (a common measure used in rank correlation metrics). We see that over 10.2% of pairs are discordant even for the most accurate QoE model. This has significant implications, because content providers and academic researchers heavily rely on QoE models to design and compare different ABR algorithms [41, 60, 33].
2.3 Temporal variability of quality sensitivity
Unlike the prior methods, Figure 2 shows that our QoE model (which we present in §4) can predict QoE and rank ABRs significantly more accurately when evaluated on the same train/test set. We argue that the source of this gap is an underlying premise shared by all previous QoE models, which is that all factors affecting QoE can be captured by a handful of objective metrics. This premise ignores the impact of high-level video content (rather than low-level pixels and frames) on users’ subjective sensitivity to video quality at different parts of the video. We now demonstrate how this quality sensitivity varies as video content changes.
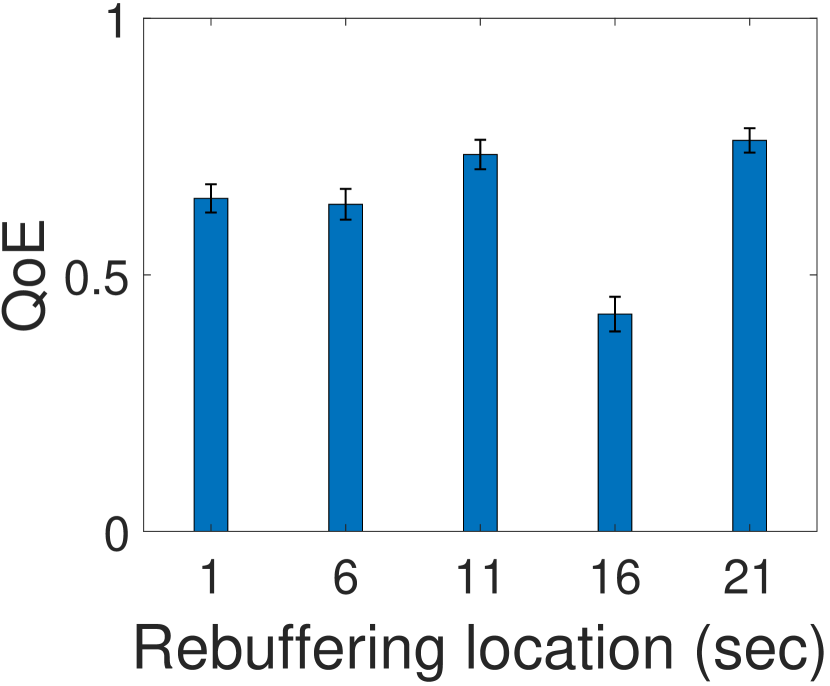
Revealing dynamic quality sensitivity: To measure the true quality sensitivity of users at different parts of a video, we create a video series for each source video and quality incident as follows. Videos in a video series have the same source content and highest quality (highest bitrate without rebuffering), except that a low-quality incident (a rebuffering event or a bitrate drop) is deliberately added at different positions (e.g., at the second, second, and so forth). Then, as before, we use Amazon MTurk to crowdsource the true QoE of each video, measured by MOS (see §4).
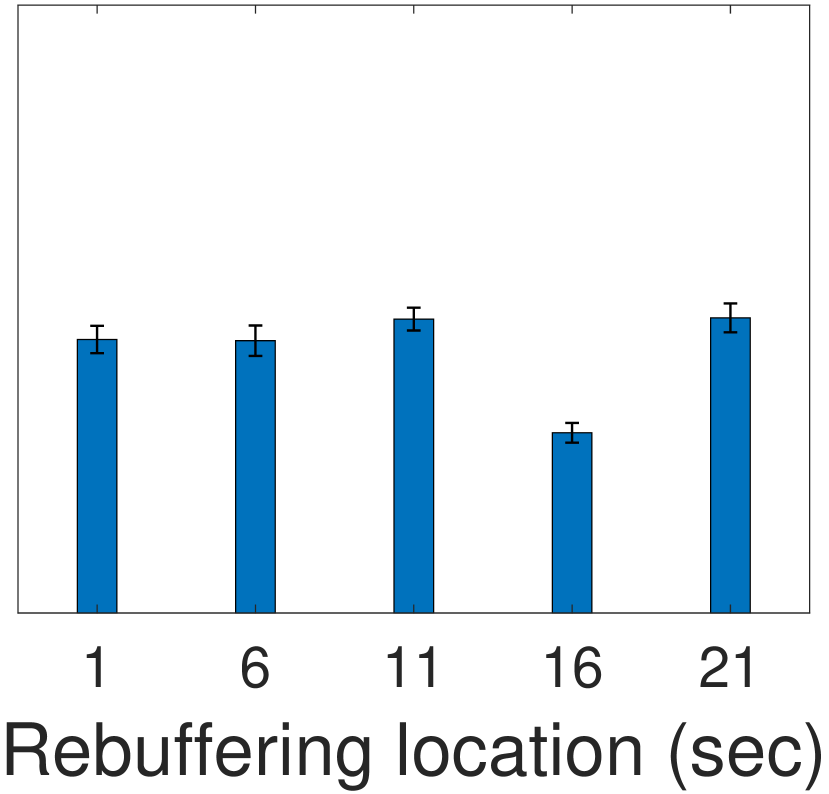
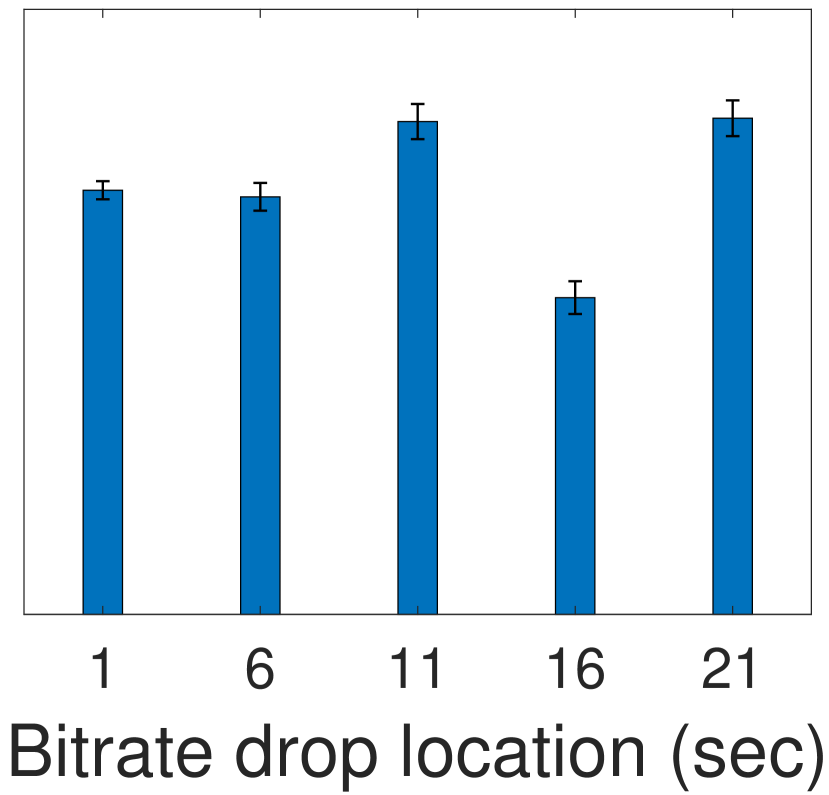
Figure 1 shows an example video series created using a 25-second soccer video as the source video and a one-second rebuffering event as the low-quality incident. We observe significant differences between the QoE of these videos. The gap between the highest QoE (rebuffering at the second) and lowest QoE (rebuffering at the second) is over 40%. Notice that the quality sensitivity varies in just a few seconds, which suggests that the same low-quality incident can have significantly higher/lower impact on user experience if it occurs a few seconds earlier or later.
In contrast, most prior QoE models would predict the same QoE for all videos in the series. The few QoE models that do give different ratings to the videos yield ratings that have little correlation with the videos’ true ratings. For example, VMAF [11] (the visual quality metric used by KSQI) gives lower QoE estimates if a bitrate drop occurs when the frame pixels are more “complex”, and LSTM-QoE [26] gives lower QoE estimates if rebuffering occurs at more “dynamic” scenes. In Figure 1, the true lowest QoE occurs when the low-quality incident occurs during the goal, but both VMAF and LSTM-QoE predict the lowest QoE when low-quality incidents occur during normal gameplay. We confirm this phenomenon in other videos as well. The inaccuracy of these models is symptomatic of their assumption that the impact of video content can be captured by pixels and motions between frames.
Another alternative is to use computer vision models [27] to identify temporal key moments in a video. We show in Appendix D, however, that these models also fall short.
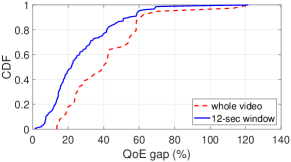
Dynamic quality sensitivity is common: We repeat the same experiment on all 16 source videos in our dataset and three low-quality incidents: 1-second rebuffering, 4-second rebuffering, and a bitrate drop from 3Mbps to 0.3Mbps for 4 seconds. This creates 48 video series in total. As summarized in Figure 3, we observe a similar temporal variability in quality sensitivity. The figure plots for each video series, where and are the maximum and minimum QoE of the videos in a series. We see that 21 of the 48 video series have a max-min QoE gap of over 40.1%. A similar trend holds even if we localize the low-quality incident and max-min QoE gap measurement to a 12-second window (repeated for all such windows at 4-second boundaries). This shows that quality sensitivity varies substantially even among very nearby chunks.
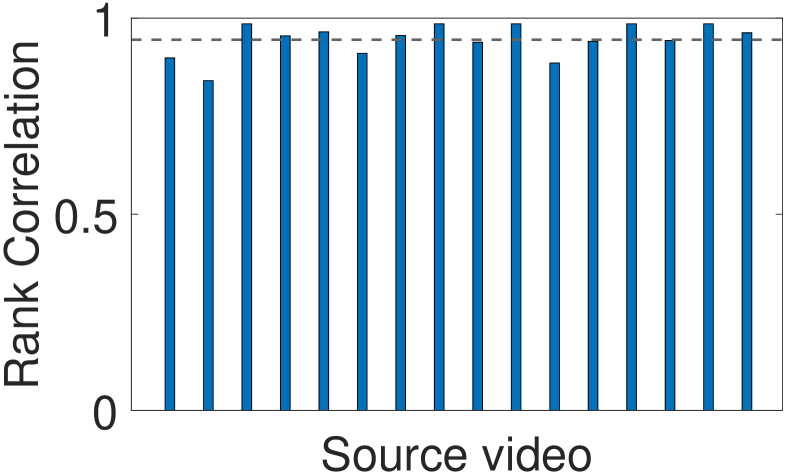
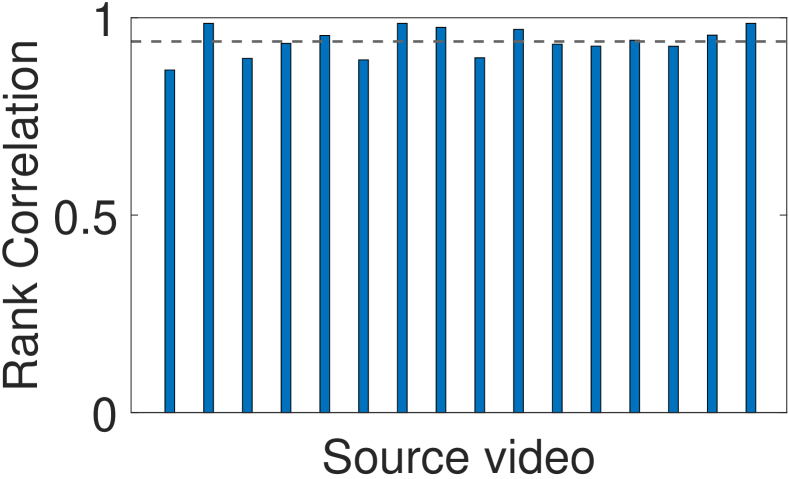
Quality sensitivity is inherent to video content: Our user study also suggests that, although the type of low-quality incident does affect absolute QoE, the QoE ranking within a video series is largely agnostic to the particular incident. Instead, quality sensitivity seems to be inherent to different parts (contents) of the video. In other words, if users are more sensitive to a 1-second rebuffering event at chunk than at chunk , they tend to be more sensitive to other low-quality incidents at chunk than at chunk . Figure 4 shows the dynamic user sensitivity of three low-quality incidents: 1-second rebuffering, 4-second rebuffering, and a bitrate drop. Although the absolute values of the QoE depend on the quality incident, the relative rankings are identical. To generalize this finding, we also calculate the rank correlation (Spearman’s rank coefficient) between the QoE values of two video series from the same source video generated using different low-quality incidents. Figure 5 shows the rank correlation between rebuffering for different lengths of time, and between rebuffering and a bitrate drop. Both show strong rank correlation.
Sources of dynamic quality sensitivity: We speculate that the source of dynamic quality sensitivity stems from users paying different degrees of attention to different parts of a video. In our dataset, we identify at least three types of moments when users tend to be more (or less) attentive to video quality than usual. The first are key moments in the storyline of a video when tensions have built up; e.g., in one of the animation videos (BigBuckBunny) when the tiny bullies fall into a trap designed by the bunny, or when a goal is scored in the soccer video (Soccer1). The second are moments when users must pay attention to get important information; e.g., change of the scoreboard in a sports video (Soccer2), or obtaining supplies after killing an enemy (FPS2). The third are transitional periods with scenic backgrounds, when users tend to be less attentive to quality; e.g., the universe background in Space. One can expect many more cases.
2.4 Potential gains
Finally, we show that the temporal variability of quality sensitivity could be leveraged by ABR algorithms to optimize QoE and save bandwidth, by aligning quality adaptation with dynamic user sensitivity.
We show the potential gains using an idealistic but clean experiment. We create two simple ABR algorithms whose only difference is the QoE model they explicitly optimize: one algorithm optimizes KSQI, the most accurate QoE model from Figure 2 that is unaware of dynamic quality sensitivity, and the other optimizes our eventual QoE model from §4, which is aware of dynamic quality sensitivity. Both algorithms take as input an entire throughput trace and the same video chunks encoded in the same available bitrate levels (we assume 4-second chunks). They then decide a bitrate-to-chunk assignment that maximizes their respective QoE model. (We assume throughput is not affected by bitrate selections.) Note that these ABR algorithms are idealistic because they have access to the entire throughput trace in advance, and hence know the future throughput variability. However, this allows us to eliminate the confounding factor of throughput prediction. We pick one of the throughput traces (results are similar with other throughput traces) and rescale it to to emulate different average network throughput.
For each source video, we create the rendered video as if it were streamed by each ABR algorithm (with rebufferings, bitrate switches, etc.). We use Amazon MTurk as before (see §4) to assess the true QoE of the rendered video. Figure 6 reports the average QoE of the two ABR algorithms across 16 source videos and different average bandwidths. We can see that being aware of dynamic quality sensitivity could improve QoE by 22-52% while using the same bandwidth, or save 39-49% bandwidth while achieving the same QoE.
2.5 Summary of findings
Our findings can be summarized as follows:
-
Existing QoE models have substantial room for improving their accuracy. In our dataset, recent models predict QoE with up to 35% errors, which could mislead the design and choice of ABR algorithms.
-
A common source of error in these QoE models is that they fail to capture content-induced variability in quality sensitivity. Quality sensitivity varies by 42% on average in our videos and up to 121% for some videos.
-
By making QoE models aware of the temporal variability of quality sensitivity, we could potentially improve QoE by up to 52% while using the same bandwidth, or save up to 49% bandwidth while achieving the same QoE.
3 Sensei overview
So far we have shown that true quality sensitivity is a key missing piece in today’s QoE models that could significantly enhance the performance of ABR algorithms. To unleash this potential in practice, we present Sensei, a video streaming system with two main components (Figure 7):
-
Scalable QoE modeling (§4): As we observed in §2.3, current approaches to QoE modeling are unable to capture the complex relationship between video content (e.g., key moments in storylines) and user sensitivity to various video quality incidents. Instead, we advocate for directly asking human viewers to rate the quality of a streamed video. This reveals the true user sensitivity to various quality incidents, rather than inferring it indirectly through heuristics. Since quality sensitivity is influenced by each video’s content, this user study must scale out many videos. Sensei leverages crowdsourcing to automate the QoE profiling process per video while maintaining reliable user rating quality.
-
Sensitivity-aware ABR (§5): Video players today are designed to greedily maximize quality (high bitrate without rebuffering) of each chunk. This tenet is ill-suited to our goal of aligning quality adaptation with dynamic quality sensitivity—quality should be optimized in proportion to the quality sensitivity of the content. To achieve this, Sensei refactors the control layer of video players to enable new adaptation actions that “borrow” resources from low-sensitivity chunks and give them to high-sensitivity chunks.
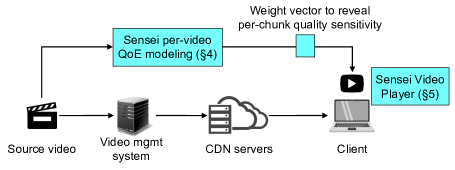
Key abstraction of per-chunk weights: The enabler behind Sensei is the abstraction of video chunk-level weights that describe the inherent quality sensitivity of different parts of a video. It is inspired by the property of quality sensitivity that it is inherent to video content and largely agnostic to the type of quality incident (§2.3). At a high level, this abstraction has two practical benefits. First, it allows us to reuse existing QoE models but reweight the quality of different chunks based on their true quality sensitivity. This drastically cuts the cost and delay of QoE crowdsourcing. Second, by using the sensitivity weights as input, the same Sensei ABR algorithm can be used to optimize QoE for any new video.
Cost-benefit analysis: Compared to existing video streaming systems, Sensei essentially trades per-video profiling overhead for improved QoE-bandwidth tradeoffs. We argue that this is a favorable tradeoff, because the additional cost of profiling is negligible compared to the overhead large content providers pay for the content and its distribution. For instance, the bid for the copyright of each popular TV episode (or making such an episode) can cost on the order of $10 billion [5], and the cost to distribute these videos to users can cost on the order of thousands for each minute of video (e.g., at $0.05/GB [2], streaming a 1-minute video at 2.8Mbps to 1M users costs $1K). Compared to this, all of Sensei’s overhead amounts to just $30 per 1-minute worth of video (§7). In return, Sensei on average achieves 15.1% higher real user ratings (which can increase user engagement and revenue) or 32% bandwidth savings (which reduces content distribution cost). These benefits apply for all users who watch the video, and possibly each viewing of it (e.g., if ads are shown).
Note that this cost-benefit analysis does not apply to videos with low viewership, as Sensei’s benefits may not outweight the costs, or to live videos, which have stringent delay requirements. Sensei is a good fit for popular videos that contribute majority viewership (e.g., 10% of YouTube videos account for 79% viewership [9]).
4 Profiling dynamic quality sensitivity at scale
This section builds an accurate and cost-efficient QoE model using two key ideas: crowdsourcing to scalably profile the true quality sensitivity of each new video (4.1), and chunk-level reweighting to reduce the cost of this profiling (4.2).
4.1 Scaling out via crowdsourcing
Instead of relying on complex, indirect heuristics, Sensei advocates for directly eliciting quality ratings from human viewers to reveal their quality sensitivity to various quality incidents. However, the user ratings must be elicited per video and the sheer scale of this feedback can be prohibitive! To put it into perspective, QoE models are usually built on user ratings from just a handful of source videos (15-20[17, 25]), but to get enough user ratings, a lab environment (or survey platform) must be set up to recruit participants and have them watch at least two orders of magnitude more video than the source videos (i.e., 2000 the total length of source videos444For instance, in the WaterlooSQOE-III dataset [25], each video is streamed over 13 throughput traces with 6 ABR algorithms, and each rendered video is then rated by 30 users.). This does not scale if we repeat the process per video.
Why crowdsourcing? Sensei leverages commercial crowdsourcing platforms like Amazon MTurk [1] to automate the user studies and scale them out to handle more videos. Our rationale behind this design choice is two-fold:
-
First, crowdsourcing reduces the overhead of participant recruitment and survey dissemination (to about 78 minutes) and provides a large pool of participants. This allows for repeated experiments to help control for human-related statistical noise.
-
Second, although the cost of crowdsourcing experiments grows linearly with videos, crowdsourcing platforms offer predictable and elastic pricing (more participants can be added on-demand), allowing content providers to decide whether and how to initiate a profiling given their budgets.
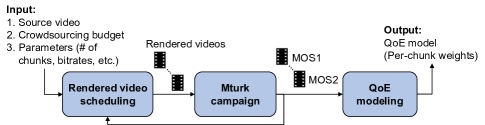
Survey methodology: Figure 8 shows the workflow of QoE profiling in Sensei. At a high level, Sensei takes a source video and a monetary budget as input and returns a QoE model that incorporates dynamic quality sensitivity (customized for this video) as output.
-
Rendered video scheduling: We first generate a set of rendered videos from the source video. Each rendered video is created by injecting a carefully selected low-quality incident (rebuffering event, bitrate drop, etc.) at a certain point in the video (§4.3).
-
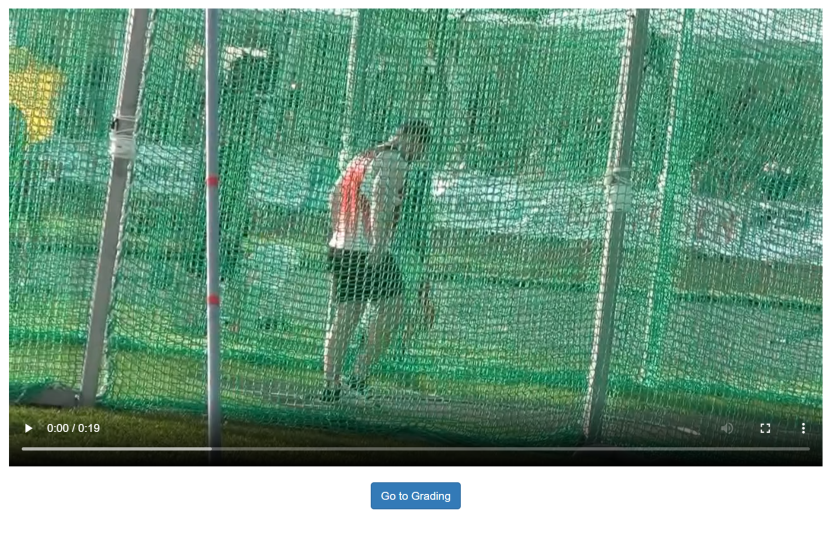
MTurk campaign: The rendered videos are then published on the MTurk platform and we specify how many Turkers, or participants, we would like to recruit for this campaign. Anytime a participant signs up, they will automatically start a survey during which they will be asked to watch rendered videos and, after each video, rate its QoE on a scale of 1 to 5 (i.e., Likert Scale). Figure 9 shows screenshots of the video player and rating page. Once enough participants have signed up, the campaign automatically terminates.
-
QoE modeling: Finally, we use the mean opinion score (MOS) of each rendered video as its QoE and run a simple regression to derive the chunk-level weights. These weights are then incorporated into an existing QoE model to generate the final QoE model for this video (§4.2).
Quality control of user ratings: We take several principled measures to prevent and filter out spurious user ratings. We overview them here but provide more details in §B. The rendered videos are created with low-quality incidents as part of the rendering process. To minimize the influence of other quality incidents that may occur (e.g., due to poor connections or browser issues), we ask participants to confirm the quality incident they observed after each video and eliminate inconsistent responses. Importantly, we randomize the order in which the rendered videos are shown to different participants. This eliminates biases due to viewing order and which videos were previously watched. Additional measures we take include limiting the number/length of videos watched per participant (to prevent fatigue), presenting the goals and rejection criteria of the survey upfront, calibrating rating ability using a "reference" video whose QoE is known, and logging whether a participant has watched all videos in full length (§6).
As a sanity check, we run an MTurk campaign with three 12-second video clips from a public dataset [25], which used an in-lab survey. We compare the QoE measured from MTurk participants with the QoE recorded in the dataset and find that they highly agree with each other: after normalizing them to the same range, the relative difference between the MTurk rating and in-lab rating on the same video is less than 3%. That said, we acknowledge that our MTurk survey methodology is not perfect and user ratings are always susceptible to human factors, but these issues affect all QoE measurement studies.
4.2 Cutting cost via chunk-level reweighting
While crowdsourcing helps us scale profiling to more videos, profiling an individual video can still be prohibitively expensive. Consider a strawman solution that build a QoE model for each chunk. If the quality sensitivity of a chunk depends on the quality incident as well as the quality of other chunks, such a model could require parameters, where is the number of chunks and is the number of parameters in the QoE model. Eliminating the dependence on other chunks reduces this to , but this may still be prohibitive—e.g., KSQI has tens of parameters. Fortunately, we can leverage the insights from §2.3 to vastly reduce this complexity.
Encoding quality sensitivity in per-chunk weights: To cut the profiling cost and delay without hurting profiling accuracy, Sensei exploits the fact that quality sensitivity is inherent to the video content and largely agnostic to the type of quality incident (§2.3). This allows us to assume a single weight per chunk that encodes its quality sensitivity, reducing the number of model parameters to !
With this insight, Sensei can incorporate the per-chunk weights into an existing QoE model. If the QoE model is additive, i.e., overall QoE is the average of the QoE estimates of individual chunks, Sensei can directly reweight the chunks by their quality sensitivity. Though not all QoE models are additive (e.g., LSTM-QoE), many state-of-the-art models including KSQI and its variants [61, 41] can be written as
| (1) |
where is the estimated QoE of the chunk. For KSQI, this takes into account the impact of visual quality, rebuffering, and quality switches. Note that is the contribution of the chunk inferred by the model which, in theory, could incorporate information about other chunks too. Sensei reweights the QoE model as follows:
| (2) |
where is the weight of the chunk, reflecting how much more sensitive users are to quality incidents in this chunk compared to other chunks.
Weight inference: Given any rendered videos, if is the QoE (MOS) of the rendered video and is the estimated QoE of the chunk of the rendered video, then we can write equations, for . We can then infer the using a linear regression.
In the remainder of the paper, we assume that KSQI reweighted by Equation 2 is the QoE model of Sensei.
4.3 Crowdsourcing scheduler
Having reduced our parameters to the per-chunk weights, we now turn our attention to reliably estimating these weights by asking users to rate as few rendered videos as possible.
Two-step scheduling: For a given source video, Sensei’s rendered video scheduler uses a two-step process to decide which rendered videos to publish and how many participants to elicit ratings from.
-
First, Sensei creates a set of rendered videos, each with a single 1-second rebuffering event at a different chunk ( is the number of chunks). It then publishes these videos and asks participants to rate each video. The total rendered video duration is . Once the videos are rated, we infer the per-chunk weights as described above.
-
Second, we pick chunks whose inferred weights are -high or low (e.g., 6 % higher or lower than the average weight). We then repeat the first step with two differences: (1) low-quality incidents are added only to these chunks, and (2) the quality incidents include bitrates (below the highest bitrate) and rebuffering events (1,2,…seconds). We publish the rendered videos and ask participants to rate them, for a total video duration of .
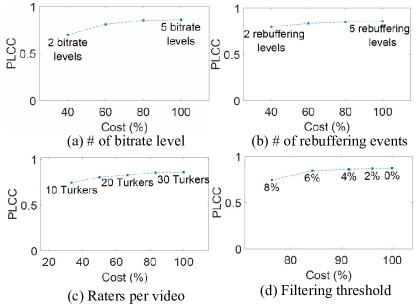
We microbenchmark the key parameters of the scheduler (Figure 16) and empirically select the values that balance accuracy and cost: =2 incidents, =1 rebuffering incidents, and =10 and =5 participants per rendered video.
Intuition: The rationale behind the two-step scheduler is as follows. With a small (e.g., 10), the estimated weights will have nontrivial variance. But these estimates are already indicative enough to identify a subset of chunks whose quality sensitivity is very high or low, so we can focus the second iteration on these chunks. In general, for an ABR algorithm to improve QoE-bandwidth tradeoffs, it is more important to identify which chunks have very high/low quality sensitivity than to precisely estimate the quality sensitivity of each chunk.
Cutting the total rendered video duration and the number of participants directly impacts the cost and delay of the QoE profiling step. Cost is proportional to the total length of videos watched by all participants, because each participant is paid by a predetermined hourly rate. Delay is proportional to the number of participants, because it takes longer for participants to sign up asynchronously (on the order of tens of minutes to get 100 participants) than it takes to complete the survey, which can happen in parallel. See Appendix B for further discussion. We can ignore the delay of familiarizing themselves with the system and providing the ratings, which account for a small fraction of the time spent by each participant.
5 Sensei’s ABR logic
The key difference between Sensei’s ABR logic and traditional ABR logic is that it aligns quality adaptation with the temporal variability of quality sensitivity. We first show how Sensei modifies a traditional ABR framework (5.1). Since these changes are external to the core ABR logic, existing ABR algorithms only require marginal changes to benefit from Sensei (§5.2).
5.1 Enabling new adaptation actions
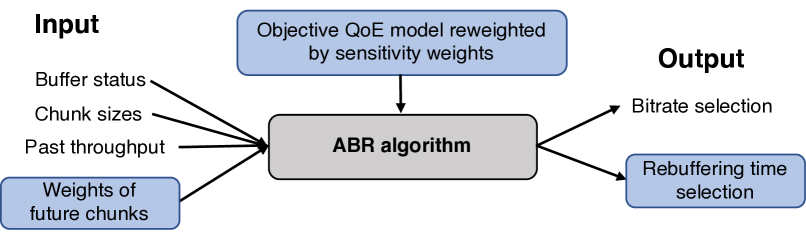
Sensei takes a pragmatic approach by working within the framework of existing players. It proposes specific changes to their input and output, as highlighted in Figure 10.
Input: Besides the current buffer length, next chunk sizes, and history of throughput measurements, Sensei’s ABR algorithm takes as input the sensitivity weights of the next chunks. A larger allows us to look farther into the horizon for opportunities to trade current quality for future quality, or vice versa, depending on the quality sensitivity of chunks. In practice, we are also constrained by the reliability of our bandwidth prediction for future chunks. We pick since we observe that QoE gains flatten beyond a horizon of 4 chunks.
Output: Sensei’s ABR algorithm selects the bitrate for future chunks as well as when the next rebuffering event should occur.555In practice, Sensei only makes adaptation decisions for the next chunk. This is a practical choice to shrink the action space, but it is not fundamental. Note that since the player invokes the ABR algorithm after each chunk is downloaded, Sensei can still plan adaptations for multiple chunks in the future even if it only acts on one chunk at a time. In contrast, traditional players only initiate rebuffering events when the buffer is empty.
Objective QoE model: If the ABR algorithm explicitly optimizes an additive QoE model, Sensei can modify its objective as described in §4.2. While Sensei can be applied to many recent ABR algorithms (e.g., [41, 60, 61]), some ABR algorithms (e.g., BBA) do not have explicit QoE objectives and thus cannot be optimized by Sensei as is.
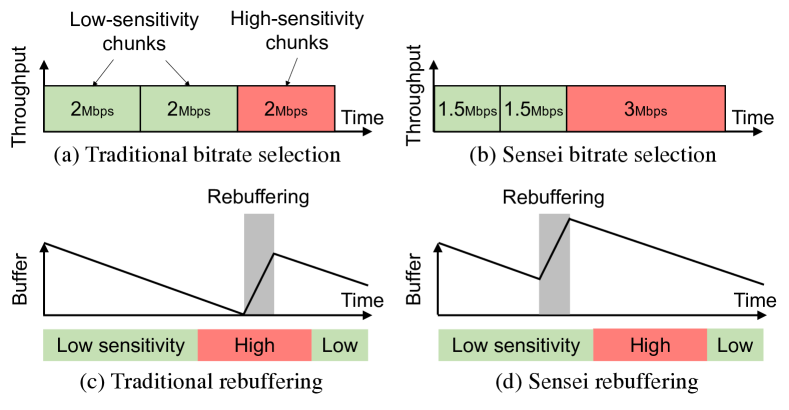
In theory, these changes are sufficient to enable at least the following optimizations, which traditional ABR algorithms are unlikely to explicitly do. (1) Lowering the current bitrate so that it can raise the bitrate in the next few chunks, if they have higher quality sensitivity (Figure 11(a) and (b)); (2) Raising the current bitrate slightly over the sustainable level if quality sensitivity is expected to decrease in the next few chunks; and (3) Initiating a short rebuffering event now in order to ensure smoother playback for the next few chunks, if they have higher quality sensitivity (Figure 11(c) and (d)).
5.2 Refactoring current ABR algorithms
We apply Sensei to two ABR algorithms: Pensieve [41], based on deep reinforcement learning, and Fugu [60], a more traditional algorithm based on bandwidth prediction.
Applying Sensei to Pensieve: Sensei leverages the flexibility of deep neural networks (DNNs) and augments Pensieve’s input, output and QoE objective—its states, actions, and reward, in the terminology of reinforcement learning—as described in §5.1. It then retrains the DNN model in the same way as Pensieve; we call this variation Sensei-Pensieve. Sensei-Pensive makes two minor changes to reduce the action space (which now includes rebuffering). First, we restrict possible rebuffering times to three levels ({0,1,2} seconds) that can only happen at chunk boundaries. Second, instead of choosing among combinations of bitrates and rebuffering, Sensei-Pensieve either selects a bitrate or initiates a rebuffering event at the next chunk. If it chooses the latter, Sensei-Pensieve will increment the buffer state by the chosen rebuffering time and rerun the ABR algorithm immediately.
Applying Sensei to Fugu: Let us first explain how Fugu works. At a high level, before downloading the chunk, Fugu considers the throughput prediction for the next chunks. For any throughput variation (with predicted probability ) and bitrate selection , where is the bitrate of the chunk, it simulates when each of the next chunks will be downloaded and estimates the rebuffering time of the chunk (which could be zero). It then picks the bitrate vector that maximizes the expected total quality over the next chunks and possible throughput variations.
| (3) |
Here estimates the quality of a chunk with the bitrate and rebuffering time using a simplified model of KSQI.
Now, the Sensei variation of Fugu, which we call Sensei-Fugu, uses Fugu’s throughput prediction and the sensitivity weights of the next chunks. Sensei-Fugu picks the bitrate vector and rebuffering time vector , where is the rebuffering time of the chunk, that maximizes the expected total quality over the next chunks and possible throughput variations.666We omit further details that are orthogonal to Sensei’s modifications
| (4) |
Here, the rebuffering times must be feasible, i.e., the buffer length can never be negative.
In short, Sensei-Pensieve and Sensei-Fugu add an extra action (rebuffering time per chunk), and their objective function reweights the contribution of each chunk’s quality using the sensitivity weights provided by our QoE model.
6 Implementation
Automation of MTurk tests: We implement the pipeline shown in Figure 8 in an (almost) fully automated manner. It uses a combination of Python (for logic) and Javascript (for the video server). Given a source video, it first uses FFmpeg to create the rendered videos by adding specific low-quality incidents. It then uploads the rendered videos to a video server, from which Turkers (participants) will later download the video. After that, it generates a unique link for this campaign and posts it on the MTurk website (this is the only step that needs manual intervention). Turkers can join the test by clicking the link, which redirects them to our video server. Once a Turker completes a survey (i.e., having rated all assigned videos), our server logs it and notifies us. When enough ratings have been collected, the server uses a script to train the quality sensitivity weights, as described in §4.2. Appendix C describes useful lessons we learned from MTurk experiments.
Video player integration: We implement Sensei on DASH.js [4], an open source video player from which many commercial players are developed. We augment the DASH manifest file with per-chunk sensitivity weights (by adding a new XML field under Representation) and change the manifest file parser ManifestLoader to parse the weights of the chunks. Compared to other ABR algorithms, a unique challenge faced by Sensei is to actively initiate rebuffering when the buffer is not empty. We use Media Source Extensions (MSE) [7] (an API that allows browsers to change player states) to delay a downloaded chunk that is in the browser buffer from being loaded into the player buffer. To initiate a short rebuffering, Sensei sets a callback to trigger SourceBufferSink function (which loads a chunk from the browser buffer into the player buffer) after a controlled delay.
7 Evaluation
Our evaluation of Sensei shows several key findings:
-
Compared to recent proposals, Sensei can improve QoE by 7.7-52.5% without using more bandwidth or can save 12.1-50.3% bandwidth while achieving the same QoE. Note that these improvements are on par with those of recent ABR algorithms that use complex ABR logic.
-
The performance gains of Sensei come at a cost of $31.4 for a one-minute long video, which is marginal compared to the investments made by content providers.
-
Sensei can improve QoE prediction accuracy by 11.8-37.1% over state-of-the-art QoE models.
-
Sensei’s ABR algorithm consistently outperforms baseline ABR algorithms even when bandwidth fluctuates.
| Name | Genre | Length | Source dataset |
|---|---|---|---|
| (a) Basket1 | Sports | 3:40 | LIVE-MOBILE |
| (b) Soccer1 | Sports | 3:20 | LIVE-NFLIX-II |
| (c) Basket2 | Sports | 3:40 | YouTube-UGC |
| (d) Soccer2 | Sports | 3:40 | YouTube-UGC |
| (e) Discus | Sports | 3:40 | YouTube-UGC |
| (f) Wrestling | Sports | 3:40 | YouTube-UGC |
| (g) Motor | Sports | 3:40 | YouTube-UGC |
| (h) Tank | Gaming | 3:40 | YouTube-UGC |
| (i) FPS1 | Gaming | 3:40 | YouTube-UGC |
| (j) FPS2 | Gaming | 3:40 | YouTube-UGC |
| (k) Mountain | Nature | 1:24 | LIVE-MOBILE |
| (l) Animal | Nature | 3:40 | YouTube-UGC |
| (m) Space | Nature | 3:40 | YouTube-UGC |
| (o) Girl | Animation | 3:40 | YouTube-UGC |
| (n) Lava | Animation | 3:40 | LIVE-NFLIX-II |
| (p) BigBuckBunny | Animation | 9:56 | WaterlooSQOE-III |
7.1 Experimental Setup
Test video set and throughput traces: Table 1 summarizes the genres, lengths and source datasets of our test video set. The videos are selected from four popular datasets. LIVE-MOBILE [28], LIVE-NFLX-II [17] and WaterlooSQOE-III [25] are professional-grade datasets sometimes used to train QoE models in the literature. We complement these sources with videos from a user-generated dataset (YouTube-UGC [55]). The videos are randomly selected to cover four video genres. To create an adaptive video streaming setup, we chop videos into 4-second chunks and encode each chunk with H.264/MPEG-4 AVC [58] in five bitrate levels: Kbps (which correspond to p on YouTube). We randomly select 10 throughput traces from two public datasets, FCC [20] and 3G/HSDPA [47]. We restrict our selection to those whose average throughput is between 0.2Mbps and 6Mbps, so that the ABR algorithms will make non-trivial bitrate selection decisions.
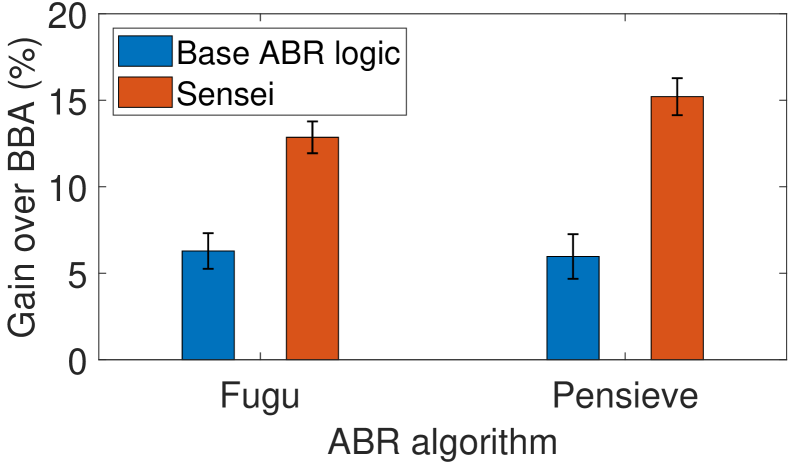
Baselines: We compare Sensei with the following ABR algorithms: Buffer-based adaptation (BBA) [33], Fugu [60], and Pensieve [41]. We keep their default settings (e.g., same DNN architecture and training network traces for Pensieve, etc). For fairness, we use KSQI as the QoE model for Pensieve, Fugu, and the base QoE model of the Sensei variants. This modification strictly improves the quality of Pensieve and Fugu, because the QoE models used in their original implementation are special cases of KSQI. Also, we restrict the intentionally chosen rebuffering time levels to be the same as those selected in the video sequences rated by crowdsourcing workers, i.e., {0, 1, 2} seconds rebuffering time. We use Sensei-Pensieve (i.e., the application of Sensei to Penseive) as Sensei, but we confirm that the improvements of Sensei-Fugu are on par with Sensei-Pensieve (Figure 18(a)).
Performance metrics: We compare ABR algorithms using three metrics. We evaluate their QoE (normalized to [0,1]) using the same source video and throughput trace, and report the QoE gain of one ABR algorithm () over another (), i.e., . We scale down a given throughput trace by different ratios and, given a target QoE, calculate the bandwidth savings by determining the minimum throughput under which each ABR algorithm achieves the target QoE. We measure the crowdsourcing cost paid to MTurk to get enough ratings to profile a 1-minute video. Other than Sensei, this cost is zero. We also evaluate the performance of the our model by accuracy prediction in Pearson’s Coefficient (PLCC) and the rank correlation in Spearman’s Coefficient (SRCC).
7.2 End-to-end evaluation
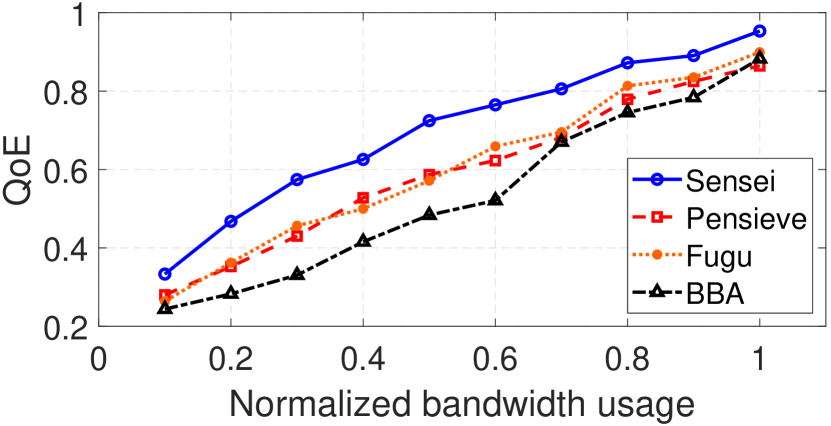
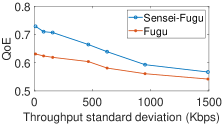
Overall QoE gains: Figure 12(a) shows the distributions of QoE gains of Sensei, Pensieve, and Fugu over BBA, across all combinations of the 16 source videos and 10 network traces. Compared to BBA, Sensei has at least 14.4% QoE gain for half of the trace-video combinations, whereas Pensieve’s and Fugu’s median QoE gains are around 5.7%. The tail improvement of Sensei is greater: Sensei’s QoE gain at the 80th percentile is 5.9%, whereas Pensieve’s and Fugu’s are 0.1% and 1.3% respectively.
Bandwidth savings: Figure 12(b) shows the average QoE of different ABR algorithms across the source videos, under one throughput trace scaled down by different ratios (x-axis). We confirm the results are consistent across different throughput traces. We see that when setting a target QoE of 0.8, the bandwidth savings of Sensei is about 27.9% compared to Pensieve and Fugu, and 32.1% compared to BBA.

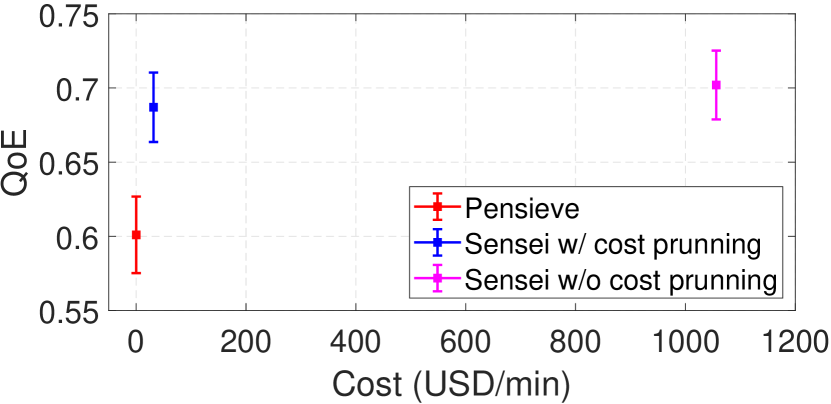
QoE vs. crowdsourcing cost: Sensei’s QoE gains and bandwidth savings come at a cost. Figure 12(c) shows the crowdsourcing cost and resulting QoE of Sensei relative to Penseive, both with and without the cost-pruning optimization (which is evaluated separately in Figure 16). Compared to enumerating all combinations of the quality incidents, we see that costs can be pruned by 96.7% with only a 3.1% degradation in QoE, and Sensei is still 14.7% better on average than its base ABR logic (Pensieve with KSQI). This cost amounts so $31 per 1-minute video, which is negligible compared to the other expenses incurred by content providers (see discussion in §3).
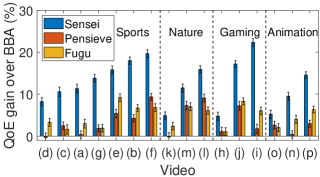
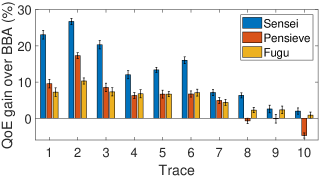
Improvements by video and trace: Figure 13 shows the QoE gains for each video. Each bar shows the average QoE gain on the same video across all throughput traces. We can see there is a significant variability in the QoE gains across videos even within the same genre, which shows that the dynamic quality sensitivity of a video is hardly determined by its content genre. Figure 14 shows the QoE gains for each network trace. Each bar shows the average QoE gain on the same trace across all videos. Overall, Sensei yields more improvement when the average throughput is lower (towards the left). This confirms our intuition that, by leveraging dynamic quality sensitivity, Sensei is better at maintaining high QoE even when the network is under stress.
Implications: The video streaming literature has largely focused on developing new ABR algorithms (BBA vs. Pensieve vs. Fugu). However, the fact that Sensei’s gains over Pensieve (its base ABR logic) are similar to Pensieve’s gains over BBA suggests that there is significant untapped potential in making an existing ABR algorithm aware of dynamic quality sensitivity!
7.3 Sensei’s QoE model
We now microbenchmark Sensei’s QoE model (§4). For each source video in our dataset, we divide it into multiple 4-second chunks and randomly select each chunk’s bitrate from 300, 750, 1200, 1850, 2850Kbps, and also select a rebuffering time (the start-up delay for the first chunk) from seconds. We obtain the ground truth QoE of video sequences using our MTurk survey methodology (§4.1). We compare Sensei’s QoE model with KSQI [23], LSTM-QoE [26], and P.1203 [48] (introduced in §2.1). We randomly split the 640 rendered videos generated by the combination of ABR algorithms, source videos, and network traces into a train set (400) and a test set (240), which are used to train and test these QoE models.
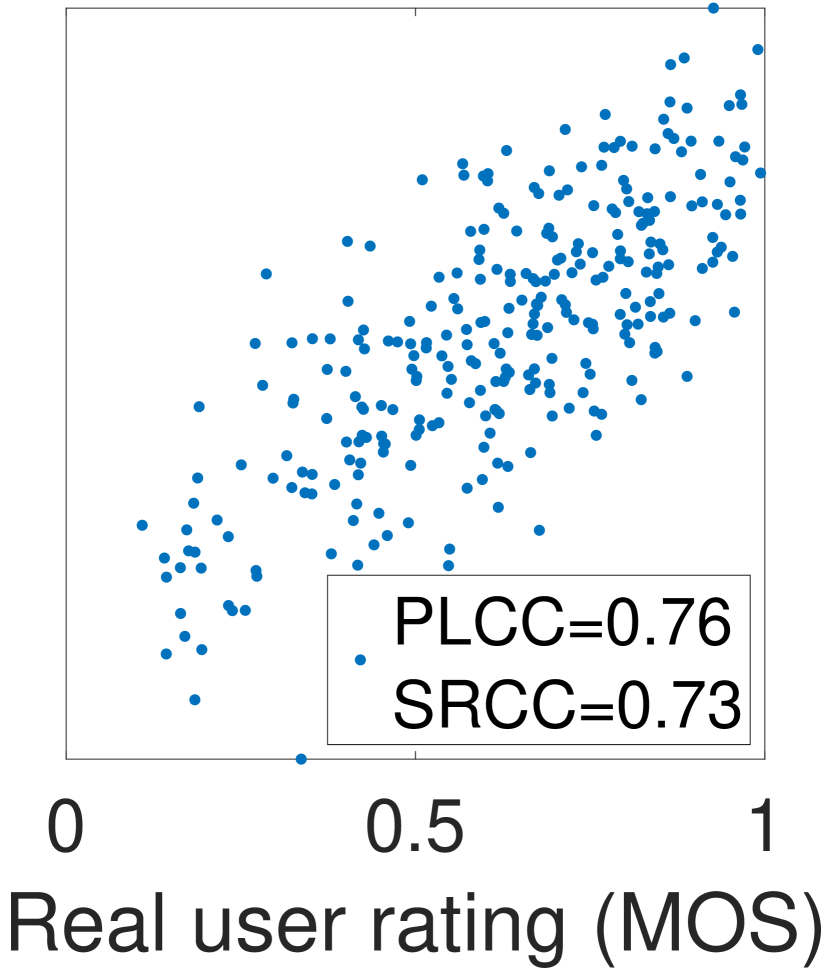
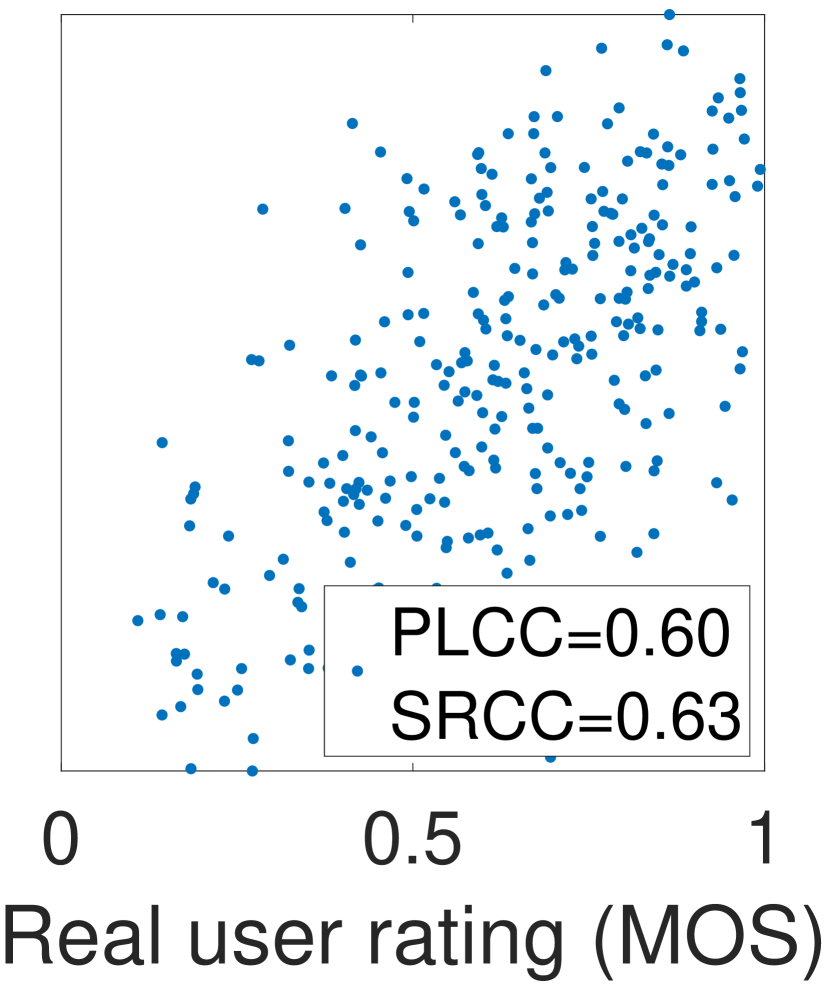
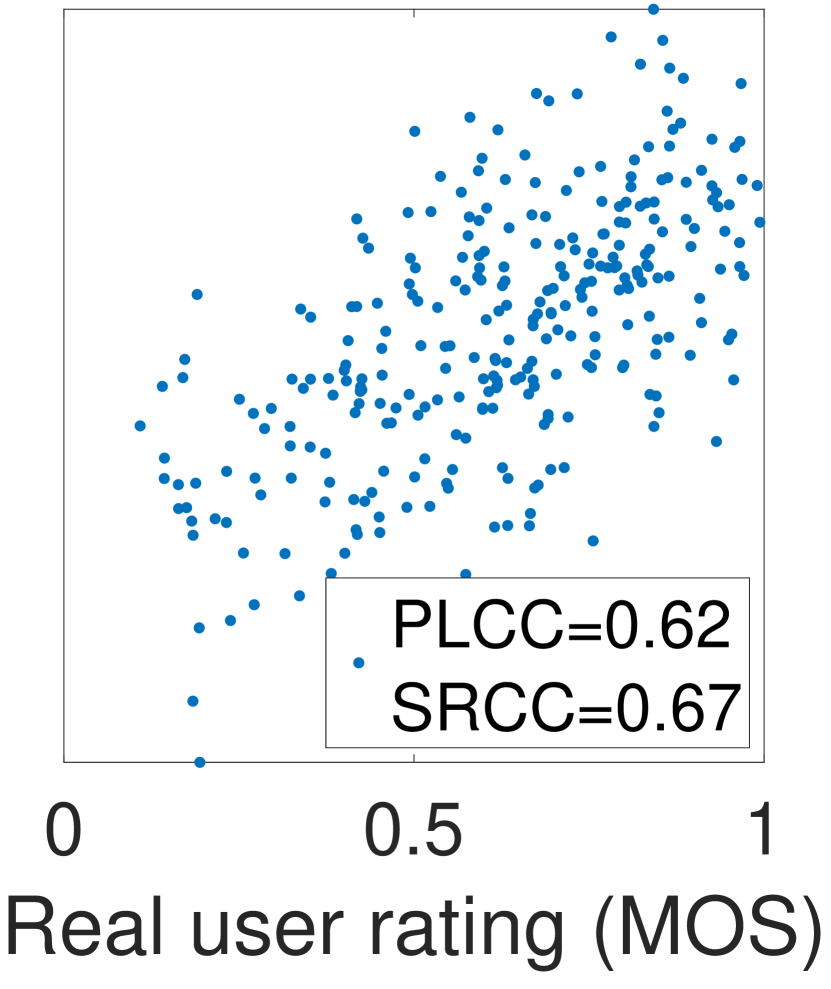
QoE prediction accuracy: Figure 15 shows the QoE scores estimated by Sensei’s QoE model and the baseline models. Each dot is a generated rendered video. We can see that Sensei’s QoE model is visually more concentrated along the diagonal (indicating high correlation with the ground truth) than any of the baselines. On average, Sensei is over 0.85 in PLCC and 0.84 in SRCC, whereas the baselines are below 0.76 in PLCC and 0.73 in SRCC.
MTurk cost pruning: Figure 16 evaluates our MTurk cost-pruning optimization and its impact on QoE prediction accuracy (measuring using PLCC). We examine four parameters (introduced in §4.3): the number of bitrate levels () and the number of rebuffering lengths () that affect a rendered video, the number of ratings per rendered video across the two steps () , and the difference threshold used to pick which chunks to investigate in the second step. As the figure shows, by lowering each parameter from its highest value, we can greatly reduce the cost while incurring less than 3% drop in accuracy. This holds if we reduce the number of bitrates from 5 to 3, the number of rebuffering times from 5 to 2, the number of ratings per video from 30 to 10, or raise the difference threshold from 0% to 6%. We conclude that MTurk costs can be dramatically reduced by setting these parameters at the desired “sweet spot” between cost savings and QoE prediction accuracy.
7.4 Sensei’s ABR logic
Next, we microbenchmark Sensei’s ABR logic (§5). To scale our experiment out, we use real videos and throughput traces but use the QoE predicted by Sensei (instead of real user ratings) to evaluate QoE. This modification yields the same QoE estimation on average compared to real user ratings under the same setting (see Figure 15 (a)).
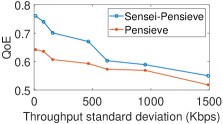
Impact of bandwidth variance: Figure 17 shows the performance of Sensei under different levels of throughput variance. We pick one throughput trace and increase its throughput variance by adding a Gaussian noise with zero mean. We confirm the results are similar for other throughput traces. The graph begins at the variance of the original throughput trace; as variance increases, Sensei’s QoE degrades, but it still maintains a significant gain over its base ABR logic. Sensei is robust because it relies on the ability to predict how likely low quality is to occur on only high quality-sensitivity chunks, not all future chunks. So as long as the average throughput between now and the next high quality-sensitivity chunk is stable, Sensei will work well.
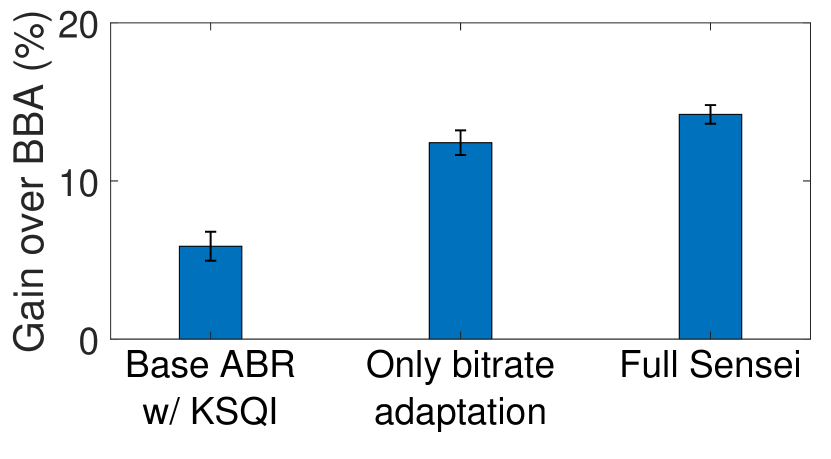
Understanding Sensei’s improvements: Figure 18(a) shows that Sensei achieves comparable improvement when either Pensieve or Fugu are the base ABR logic. This suggests that Sensei’s effectiveness does not depend on the design of the base ABR logic. Figure 18(b) separates the two sources of Sensei’s improvement: (1) making the QoE objective aware of dynamic quality sensitivity, shown by the gap between the 1 and 2 bars, and (2) additional new adaptation actions (e.g., initiating rebuffering proactively), shown by the gap between the 2 and 3 bars. We see that both sources improve QoE, but changing the QoE objective has a greater contribution. So even if a content provider cannot control rebuffering, it can still benefit significantly from Sensei by incorporating dynamic user sensitivity.
Systems overhead: We confirm empirically that compared to a video player without Sensei, the runtime overhead of Sensei is less than 1% in both CPU cycles and RAM usage.
8 Related Work
Video QoE modeling: Video QoE modeling takes two general forms: visual quality assessment (VQA) and adaptation quality assessment (AQA). Classic VQA (e.g., [30, 56, 46, 49]) focuses on the user’s perception of pixel value changes due to encoding. Recent work uses more data-driven models, including SVM [11] and deep learning models (e.g., [35]). AQA considers streaming-related incidents (join time, quality switches, rebuffering, etc.) which can influence user experience and engagement (e.g., [22, 14, 36]). Various models have been developed to capture their effect [16, 15, 25, 23, 21, 18, 26] as well as users’ attention over space (e.g., [43, 42, 59]) and time (e.g., [29, 24, 27]). Sensei is complementary to these efforts: they apply the same heuristics to all videos, but Sensei customizes itself for each video (in a cost-efficient way) to capture the true user sensitivity to video quality.
Adaptive bitrate (ABR) algorithms: ABR algorithms can be grouped into buffer-based (e.g., [34, 37]) and rate-based algorithms (e.g., [33, 51, 50]). More recent ABR algorithms combine the two approaches to optimize for explicit QoE objectives, via control theory [61], machine learning-based throughput prediction [53, 60], or deep reinforcement learning [41]. Key parameters of the ABR logic can be customized to the network conditions or device [13]. Though Sensei reuses existing ABR algorithms, its contribution is to identify a minimal set of changes (such as adaptation actions they never would have taken) needed for these algorithms to fully leverage dynamic quality sensitivity.
QoE research using crowdsourcing: Some prior studies explore the use of crowdsourcing platforms to obtain direct QoE feedback. Some of these works (e.g., [32, 19, 44]) provide methodologies for using commercial crowdsourcing platforms, e.g.,, Amazon MTurk [1] and Microworkers [8], to systematically model user perception using objective quality metrics. Other works build crowdsourcing platforms themselves for similar purposes (e.g., [54, 60]). Compared to these efforts, Sensei faces a unique challenge of scaling crowdsourcing to a per-video basis. While our cost pruning techniques are conventional, we enable them through the insight that per-chunk sensitivity weights provide minimal yet sufficient information to embrace dynamic quality sensitivity.
9 Conclusion
We have descried Sensei, a video streaming system that optimizes video quality by exploiting dynamic quality sensitivity. Sensei scales out the profiling of quality sensitivity, which is unique to each video, through a combination of crowdsourcing and the insight that quality sensitivity is inherent to the video content. We show that with minor modifications to state-of-the-art video adaptation algorithms, Sensei can improve their QoE by 15.1% or save bandwidth by 26.8% on average.
References
- [1] Amazon Mechanical Turk. https://www.mturk.com/.
- [2] CDN Pricing Comparison. https://cdn.reviews/cdn-pricing-comparison/.
- [3] Cisco Annual Internet Report (2018–2023) White Paper. https://www.cisco.com/c/en/us/solutions/collateral/executive-perspectives/annual-internet-report/white-paper-c11-741490.html/.
- [4] DASH.js. https://github.com/Dash-Industry-Forum/dash.js/wiki.
- [5] How Netflix Pays for Movie and TV Show Licensing. https://www.investopedia.com/articles/investing/062515/how-netflix-pays-movie-and-tv-show-licensing.asp.
- [6] HSDPA dataset. http://skuld.cs.umass.edu/traces/mmsys/2013/pathbandwidth/.
- [7] Media Source Extensions. https://www.w3.org/TR/media-source/.
- [8] Microworkers. https://www.microworkers.com/.
- [9] Pew Research Center: 10 facts about Americans and YouTube. https://www.pewresearch.org/fact-tank/2019/12/04/10-facts-about-americans-and-youtube/.
- [10] Video Quality of Experience: Requirements and Considerations for Meaningful Insight. https://www.sandvine.com/hubfs/downloads/archive/whitepaper-video-quality-of-experience.pdf.
- [11] VMAF - Video Multi-Method Assessment Fusion. https://github.com/Netflix/vmaf.
- [12] YouTube joins Netflix in reducing video quality in Europe. https://www.theverge.com/2020/3/20/21187930/youtube-reduces-streaming-quality-european-union-coronavirus-bandwidth-internet-traffic.
- [13] Zahaib Akhtar, Yun Seong Nam, Ramesh Govindan, Sanjay Rao, Jessica Chen, Ethan Katz-Bassett, Bruno Ribeiro, Jibin Zhan, and Hui Zhang. Oboe: auto-tuning video abr algorithms to network conditions. In Proceedings of the 2018 Conference of the ACM Special Interest Group on Data Communication, pages 44–58, 2018.
- [14] Athula Balachandran, Vyas Sekar, Aditya Akella, Srinivasan Seshan, Ion Stoica, and Hui Zhang. Developing a predictive model of quality of experience for internet video. ACM SIGCOMM Computer Communication Review, 43(4):339–350, 2013.
- [15] Christos G Bampis and Alan C Bovik. An augmented autoregressive approach to http video stream quality prediction. arXiv preprint arXiv:1707.02709, 2017.
- [16] Christos G Bampis, Zhi Li, and Alan C Bovik. Continuous prediction of streaming video qoe using dynamic networks. IEEE Signal Processing Letters, 24(7):1083–1087, 2017.
- [17] Christos G Bampis, Zhi Li, Ioannis Katsavounidis, Te-Yuan Huang, Chaitanya Ekanadham, and Alan C Bovik. Towards perceptually optimized end-to-end adaptive video streaming. arXiv preprint arXiv:1808.03898, 2018.
- [18] Chao Chen, Lark Kwon Choi, Gustavo De Veciana, Constantine Caramanis, Robert W Heath, and Alan C Bovik. Modeling the time—varying subjective quality of http video streams with rate adaptations. IEEE Transactions on Image Processing, 23(5):2206–2221, 2014.
- [19] Kuan-Ta Chen, Chi-Jui Chang, Chen-Chi Wu, Yu-Chun Chang, and Chin-Laung Lei. Quadrant of euphoria: a crowdsourcing platform for qoe assessment. IEEE Network, 24(2):28–35, 2010.
- [20] Federal Communications Commission et al. Raw data-measuring broadband america. https://www.fcc.gov/reports-research/reports/. Retrieved June, 19:2018, 2016.
- [21] Johan De Vriendt, Danny De Vleeschauwer, and David Robinson. Model for estimating qoe of video delivered using http adaptive streaming. In 2013 IFIP/IEEE International Symposium on Integrated Network Management (IM 2013), pages 1288–1293. IEEE, 2013.
- [22] Florin Dobrian, Vyas Sekar, Asad Awan, Ion Stoica, Dilip Joseph, Aditya Ganjam, Jibin Zhan, and Hui Zhang. Understanding the impact of video quality on user engagement. ACM SIGCOMM Computer Communication Review, 41(4):362–373, 2011.
- [23] Zhengfang Duanmu, Wentao Liu, Diqi Chen, Zhuoran Li, Zhou Wang, Yizhou Wang, and Wen Gao. A knowledge-driven quality-of-experience model for adaptive streaming videos. arXiv preprint arXiv:1911.07944, 2019.
- [24] Zhengfang Duanmu, Abdul Rehman, and Zhou Wang. A quality-of-experience database for adaptive video streaming. IEEE Transactions on Broadcasting, 64(2):474–487, 2018.
- [25] Zhengfang Duanmu, Kai Zeng, Kede Ma, Abdul Rehman, and Zhou Wang. A quality-of-experience index for streaming video. IEEE Journal of Selected Topics in Signal Processing, 11(1):154–166, 2016.
- [26] Nagabhushan Eswara, S Ashique, Anand Panchbhai, Soumen Chakraborty, Hemanth P Sethuram, Kiran Kuchi, Abhinav Kumar, and Sumohana S Channappayya. Streaming video qoe modeling and prediction: A long short-term memory approach. IEEE Transactions on Circuits and Systems for Video Technology, 2019.
- [27] Guanyu Gao, Linsen Dong, Huaizheng Zhang, Yonggang Wen, and Wenjun Zeng. Content-aware personalised rate adaptation for adaptive streaming via deep video analysis. In ICC 2019-2019 IEEE International Conference on Communications (ICC), pages 1–8. IEEE, 2019.
- [28] Deepti Ghadiyaram, Janice Pan, and Alan C Bovik. A subjective and objective study of stalling events in mobile streaming videos. IEEE Transactions on Circuits and Systems for Video Technology, 29(1):183–197, 2017.
- [29] Deepti Ghadiyaram, Janice Pan, and Alan C Bovik. Learning a continuous-time streaming video qoe model. IEEE Transactions on Image Processing, 27(5):2257–2271, 2018.
- [30] Rafael C Gonzalez, Richard Eugene Woods, and Steven L Eddins. Digital image processing using MATLAB. Pearson Education India, 2004.
- [31] Michael Gygli, Yale Song, and Liangliang Cao. Video2gif: Automatic generation of animated gifs from video. In Proceedings of the IEEE Conference on Computer Vision and Pattern Recognition, pages 1001–1009, 2016.
- [32] Tobias Hoßfeld, Michael Seufert, Matthias Hirth, Thomas Zinner, Phuoc Tran-Gia, and Raimund Schatz. Quantification of youtube qoe via crowdsourcing. In 2011 IEEE International Symposium on Multimedia, pages 494–499. IEEE, 2011.
- [33] Te-Yuan Huang, Ramesh Johari, Nick McKeown, Matthew Trunnell, and Mark Watson. A buffer-based approach to rate adaptation: Evidence from a large video streaming service. In Proceedings of the 2014 ACM conference on SIGCOMM, pages 187–198, 2014.
- [34] Junchen Jiang, Vyas Sekar, and Hui Zhang. Improving fairness, efficiency, and stability in http-based adaptive video streaming with festive. In Proceedings of the 8th international conference on Emerging networking experiments and technologies, pages 97–108, 2012.
- [35] Woojae Kim, Jongyoo Kim, Sewoong Ahn, Jinwoo Kim, and Sanghoon Lee. Deep video quality assessor: From spatio-temporal visual sensitivity to a convolutional neural aggregation network. In Proceedings of the European Conference on Computer Vision (ECCV), pages 219–234, 2018.
- [36] S Shunmuga Krishnan and Ramesh K Sitaraman. Video stream quality impacts viewer behavior: inferring causality using quasi-experimental designs. IEEE/ACM Transactions on Networking, 21(6):2001–2014, 2013.
- [37] Zhi Li, Xiaoqing Zhu, Joshua Gahm, Rong Pan, Hao Hu, Ali C Begen, and David Oran. Probe and adapt: Rate adaptation for http video streaming at scale. IEEE Journal on Selected Areas in Communications, 32(4):719–733, 2014.
- [38] Yao Liu, Sujit Dey, Fatih Ulupinar, Michael Luby, and Yinian Mao. Deriving and validating user experience model for dash video streaming. IEEE Transactions on Broadcasting, 61(4):651–665, 2015.
- [39] Matt Lovett, Saleh Bajaba, Myra Lovett, and Marcia J Simmering. Data quality from crowdsourced surveys: A mixed method inquiry into perceptions of amazon’s mechanical turk masters. Applied Psychology, 67(2):339–366, 2018.
- [40] Guo Lu, Wanli Ouyang, Dong Xu, Xiaoyun Zhang, Chunlei Cai, and Zhiyong Gao. Dvc: An end-to-end deep video compression framework. In Proceedings of the IEEE Conference on Computer Vision and Pattern Recognition, pages 11006–11015, 2019.
- [41] Hongzi Mao, Ravi Netravali, and Mohammad Alizadeh. Neural adaptive video streaming with pensieve. In Proceedings of the Conference of the ACM Special Interest Group on Data Communication, pages 197–210, 2017.
- [42] Anh Nguyen, Zhisheng Yan, and Klara Nahrstedt. Your attention is unique: Detecting 360-degree video saliency in head-mounted display for head movement prediction. In Proceedings of the 26th ACM international conference on Multimedia, pages 1190–1198, 2018.
- [43] Cagri Ozcinar, Julian Cabrera, and Aljosa Smolic. Visual attention-aware omnidirectional video streaming using optimal tiles for virtual reality. IEEE Journal on Emerging and Selected Topics in Circuits and Systems, 9(1):217–230, 2019.
- [44] Benjamin Rainer, Markus Waltl, and Christian Timmerer. A web based subjective evaluation platform. In 2013 Fifth International Workshop on Quality of Multimedia Experience (QoMEX), pages 24–25. IEEE, 2013.
- [45] ITUT Rec. H. 264: Advanced video coding for generic audiovisual services. ITU-T Rec. H. 264-ISO/IEC 14496-10 AVC, 2005.
- [46] Abdul Rehman, Kai Zeng, and Zhou Wang. Display device-adapted video quality-of-experience assessment. In Human Vision and Electronic Imaging XX, volume 9394, page 939406. International Society for Optics and Photonics, 2015.
- [47] Haakon Riiser, Paul Vigmostad, Carsten Griwodz, and Pål Halvorsen. Commute path bandwidth traces from 3g networks: analysis and applications. In Proceedings of the 4th ACM Multimedia Systems Conference, pages 114–118, 2013.
- [48] Werner Robitza, Marie-Neige Garcia, and Alexander Raake. A modular http adaptive streaming qoe model—candidate for itu-t p. 1203 (“p. nats"). In 2017 Ninth International Conference on Quality of Multimedia Experience (QoMEX), pages 1–6. IEEE, 2017.
- [49] Rajiv Soundararajan and Alan C Bovik. Video quality assessment by reduced reference spatio-temporal entropic differencing. IEEE Transactions on Circuits and Systems for Video Technology, 23(4):684–694, 2012.
- [50] Kevin Spiteri, Ramesh Sitaraman, and Daniel Sparacio. From theory to practice: Improving bitrate adaptation in the dash reference player. ACM Transactions on Multimedia Computing, Communications, and Applications (TOMM), 15(2s):1–29, 2019.
- [51] Kevin Spiteri, Rahul Urgaonkar, and Ramesh K Sitaraman. Bola: Near-optimal bitrate adaptation for online videos. In IEEE INFOCOM 2016-The 35th Annual IEEE International Conference on Computer Communications, pages 1–9. IEEE, 2016.
- [52] Gary J Sullivan, Jens-Rainer Ohm, Woo-Jin Han, and Thomas Wiegand. Overview of the high efficiency video coding (hevc) standard. IEEE Transactions on circuits and systems for video technology, 22(12):1649–1668, 2012.
- [53] Yi Sun, Xiaoqi Yin, Junchen Jiang, Vyas Sekar, Fuyuan Lin, Nanshu Wang, Tao Liu, and Bruno Sinopoli. Cs2p: Improving video bitrate selection and adaptation with data-driven throughput prediction. In Proceedings of the 2016 ACM SIGCOMM Conference, pages 272–285, 2016.
- [54] Matteo Varvello, Jeremy Blackburn, David Naylor, and Konstantina Papagiannaki. Eyeorg: A platform for crowdsourcing web quality of experience measurements. In Proceedings of the 12th International on Conference on emerging Networking EXperiments and Technologies, pages 399–412, 2016.
- [55] Yilin Wang, Sasi Inguva, and Balu Adsumilli. Youtube ugc dataset for video compression research. In 2019 IEEE 21st International Workshop on Multimedia Signal Processing (MMSP), pages 1–5. IEEE, 2019.
- [56] Zhou Wang, Alan C Bovik, Hamid R Sheikh, and Eero P Simoncelli. Image quality assessment: from error visibility to structural similarity. IEEE transactions on image processing, 13(4):600–612, 2004.
- [57] Zhou Wang, Eero P Simoncelli, and Alan C Bovik. Multiscale structural similarity for image quality assessment. In The Thrity-Seventh Asilomar Conference on Signals, Systems & Computers, 2003, volume 2, pages 1398–1402. Ieee, 2003.
- [58] Thomas Wiegand, Gary J Sullivan, Gisle Bjontegaard, and Ajay Luthra. Overview of the h. 264/avc video coding standard. IEEE Transactions on circuits and systems for video technology, 13(7):560–576, 2003.
- [59] Mai Xu, Ali Borji, Ce Zhu, Edward Delp, Marta Mrak, and Patrick Le Callet. Introduction to the issue on perception-driven 360 video processing. IEEE Journal of Selected Topics in Signal Processing, 14(1):2–4, 2020.
- [60] Francis Y Yan, Hudson Ayers, Chenzhi Zhu, Sadjad Fouladi, James Hong, Keyi Zhang, Philip Levis, and Keith Winstein. Learning in situ: a randomized experiment in video streaming. In 17th USENIX Symposium on Networked Systems Design and Implementation (NSDI 20), pages 495–511, 2020.
- [61] Xiaoqi Yin, Abhishek Jindal, Vyas Sekar, and Bruno Sinopoli. A control-theoretic approach for dynamic adaptive video streaming over http. In Proceedings of the 2015 ACM Conference on Special Interest Group on Data Communication, pages 325–338, 2015.
- [62] Kaiyang Zhou, Yu Qiao, and Tao Xiang. Deep reinforcement learning for unsupervised video summarization with diversity-representativeness reward. In Thirty-Second AAAI Conference on Artificial Intelligence, 2018.
Appendix A Dataset
Figure 19 provides screenshots and descriptions of the 16 source videos used in our dataset.
Appendix B MTurk rating sanitization
As mentioned in §4.1, the user ratings can be noisy and biased for multiple reasons. To get reliable quality ratings, we take the following steps.
-
Rejection criteria: There is always one reference video as one (at a random position) of the rendered videos in each survey. The reference video has the highest quality (highest bitrate and no rebuffering) and if a Turker gives any other rendered video a higher rating than the reference video, we will reject the scores of this Turker. We will reject a Turker if one of the rendered videos is viewed for less than its length (i.e., the video is not fully watched). The rejection criteria help to ensure that the Turkers give quality-induced ratings after watching each video in full. When a Turker’s data is rejected, the Turker will not receive payment.777Of course, this criteria is highlighted on the first page of the survey and we have received disputes from Turkers but not often.
-
Randomizing viewing orders: Every time a Turker joins the survey, we randomize the order in which rendered videos are shown. This allows us to perform postanalysis to check (and confirm) that the position of a video within a survey has little impact on its rating.
-
Biases by Turker population: We also check that about 43.8% (or 67.3%) ratings from Turkers who participate our survey only once (or at most twice). This confirms that the Turker pool is large enough avoid small population bias. This corroborate with the sanity-check result in §4.1 that on average MTurk quality ratings are strongly correlated with in-lab survey results.
To prevent people from gaming the system by sitting on a job for too long, we pay each participant a fixed amount equal to the fixed hourly rate times the estimated amount of time needed for the survey (which is proportional to the total length of the videos per participant). We use an hourly rate of $10 (roughly matching the minimum wage standard in our state), though we have not explored the impact of raising/lowering this wage. Of course, participants will not get paid if they only watch part of the videos.
Appendix C Lessons from MTurk Experiments
We conclude with key lessons learned from running MTurk experiments and focus on the difference between in-lab and crowdource-based QoE studies.
How many Turkers are needed: An essential tradeoff between crowdsourcing and in-lab study (e.g., [25, 17]) is crowdsourcing can easily find more participants for us but their work is less reliable. So in chooseing between in-lab and crowdsourcing, a key parameter is how many Turkers are needed to get a reliable signal. We did a head-to-head comparison with WaterlooSQOE-III [25] and found that as far as QoE assessment is concerned, we need 17% more Turkers to reduce the variance of QoE rating down to the same level if the same video is rated in an in-lab study.
Reputation matters: MTurk platform (and other crowdsourcing tools) dramatically cuts the cost of making our survey visible to potential Turkers, but if Turkers sign up slowly this can slow down the whole process. The speed at which they sign up depends largely on the reputation of the publisher (us) and in general, Turkers are more willing to sign up if the publisher historically has a low rejection rate. This means we must be very clear upfront about the studies rejection criteria.
Reputation is crucial to get quality feedback. We follow a common practice (e.g., [39]) and restrict ourselves to master Turkers, a class of reliable Turkers who have at least participated in 1000 surveys and whose overall rejection rate is lower than 1%. It also corroborates our experience: rejection rate from these Turkers over lower than normal Turkers, though their hourly rate is generally higher than normal Turkers.
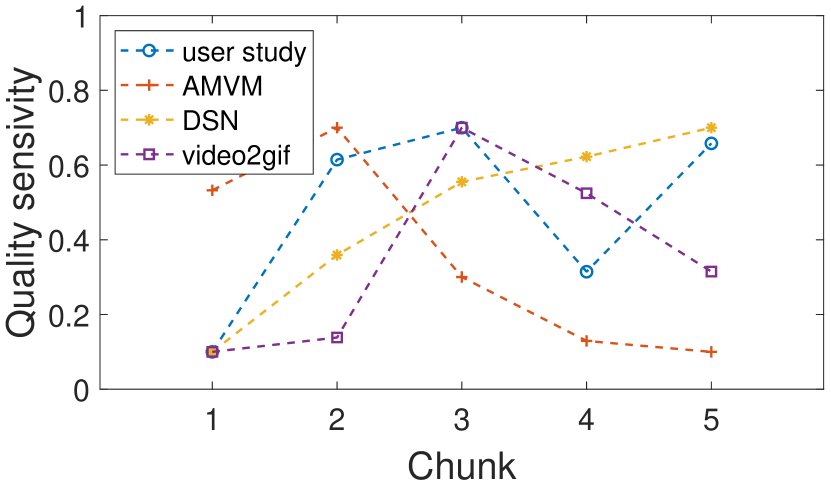
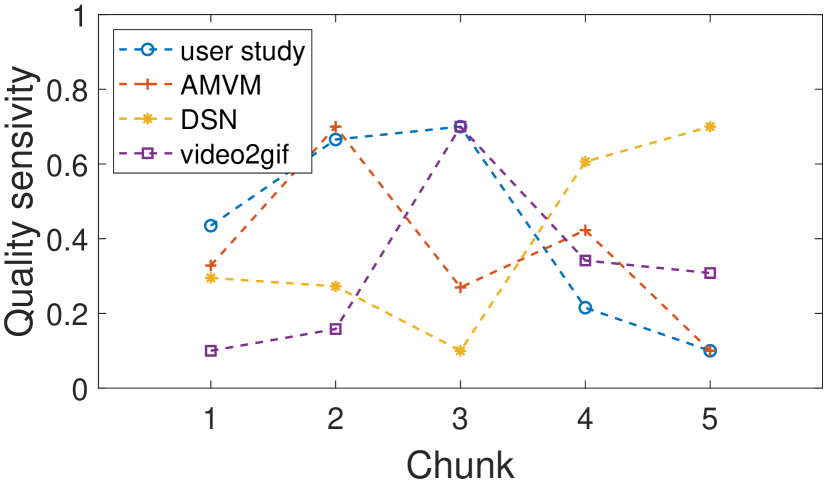
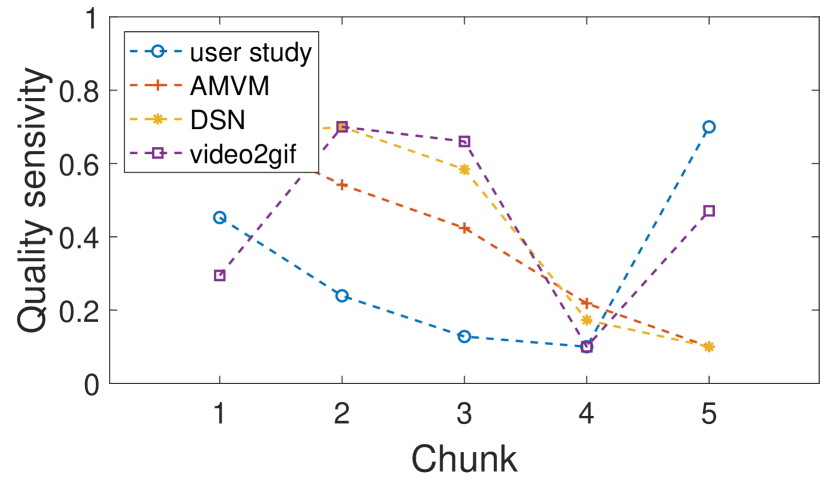
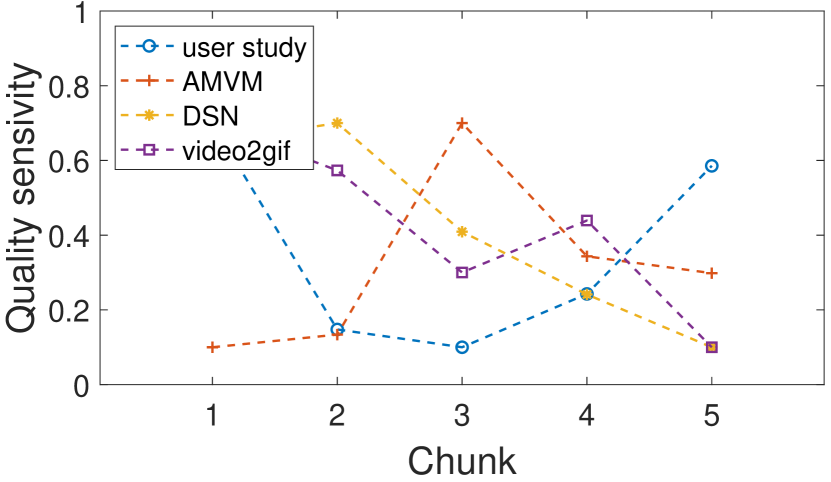
Appendix D Why not use vision-based techniques?
A stronger alternative for inferring the per-chunk quality sensitivity, which goes beyond the visual quality metrics discussed in §2.3, are computer vision (CV) models such as those for video highlights detection and video summarization. We tested three recent computer vision models, AMVM [38], DSN [62] and Video2GIF [31], but their results do not correlate well with the quality sensitivity weights inferred by Sensei. However, as we show in Figure 20, the trend of the quality sensitivity of the chunks is not aligned with that predicted from CV-based models. We speculate two reasons for this. First, these models tend to highlight video segments that are information-rich (e.g., lots of objects), but information richness does not necessarily imply higher quality sensitivity. For example in the soccer video in Figure 1, the period leading up to the goal is the most quality sensitive, but the CV models believe the scenes showing the audience (a lot of people) are the most important. Second, as we observed in §2.3, quality sensitivity can be influenced by different factors in different videos, so learning-based methods may not be a good fit because they are biased towards the data they were trained on.