Ultraviolet Line Identifications and Spectral Formation Near Max-Light in Type Ia Supernovae 2011fe
Abstract
We present ultraviolet line identifications of near maximum-light HST observations of SN 2011fe using synthetic spectra generated from both SYNOW and PHOENIX. We find the spectrum to be dominated by blends of iron group elements Fe, Co, and Ni (as expected due to heavy line blanketing by these elements in the UV) and for the first time identify lines from C IV and Si IV in a supernova spectrum. We also find that classical delayed detonation models of Type Ia supernovae are able to accurately reproduce the flux levels of SN 2011fe in the UV. Further analysis reveals that photionization edges play an important role in feature formation in the far-UV, and that temperature variations in the outer layers of the ejecta significantly alter the Fe III/Fe II ratio producing large flux changes in the far-UV and velocity shifts in mid-UV features. SN 2011fe is the best observed core-normal SNe Ia, therefore analysis its of UV spectra shows the power of UV spectra in discriminating between different metalicities and progenitor scenarios of Type Ia supernovae, due to the fact that the UV probes the outermost layers of the Type Ia supernova, which are most sensitive to metalicity and progenitor variations.
1 Introduction
The UV spectrum of Type Ia supernovae (SNe Ia) is important for understanding the nature of the explosion, since it both forms throughout the supernova atmosphere (Bongard et al., 2008) and probes the outermost layers (Lentz et al., 2000; Hoeflich et al., 2017). Variations in the UV spectra with redshift have been observed (Ellis et al., 2008; Foley et al., 2012; Maguire et al., 2012). Foley & Kirshner (2013) used a comparison of the “twins” SN 2011by and SN 2011fe to deduce a variation in progenitor metalicity of the two supernovae, using the models of Lentz et al. (2000) to infer that progenitors of SN 2011by and SN 2011fe were supersolar and subsolar, respectively. Brown et al. (2015) found that they could reproduce the same results as those of Foley & Kirshner (2013) using only photometry obtained by the Neil Gehrels Swift Observatory, hereafter Swift. However, they found that the UV flux levels of the Lentz et al. (2000) models were far too high, due to the structure of W7 model (Nomoto et al., 1984). Recently, Pan et al. (2020) used grism spectroscopy of a sample of SNe Ia obtained with Swift and correlated it with the progenitor metalicity. Using Swift photometry, this result has been challenged (Brown & Crumpler, 2019).
Several studies have identified UV features in Type Ia SNe using a variety of models and methods, but few line identifications are consistent across these works (Section 3 lists the identified features from the literature). Branch & Venkatakrishna (1986) used an early version of the parameterized SYNOW code to identify features in the near-UV of an IUE spectrum of SN 1981B at -2 days relative to maximum light. Kirshner et al. (1993) analyzed the first high-quality near-maximum light spectrum of a Type Ia; a combined IUE and HST spectrum of SN 1992A at +5 days. Using a parameterized synthetic LTE spectrum of a delayed-detonation explosion model, they were able to identify many of the mid-UV features, although some identifications are described as tentative. Hachinger et al. (2013) studied the HST spectrum of SN 2010jn at -0.3 days. Using an updated version of the Monte Carlo spectrum-synthesis code of Mazzali & Lucy (1993), they calculated synthetic spectra using the density profiles of the W7 model (Nomoto et al., 1984) and the WDD3 delayed-detonation model from Iwamoto et al. (1999) with abundances determined via abundance tomography. Mazzali et al. (2014) (hereafter M14) performed a similar analysis to Hachinger using the WDD1 delayed-detonation model of Iwamoto et al. (1999) on a time series of HST spectra of SN 2011fe covering from -13.1 to +40.8 days, including the first spectrum to have significant coverage of the far-UV (+3.4 days).
Other factors influencing the UV spectra of Type Ia SNe, such as density and model luminosity, have also been investigated. Using much of the same methodology as Hachinger et al. (2013) and M14, Sauer et al. (2008) altered the power law index of the density profile in the outer layers of the W7 model, concluding that steeper density profiles result in more UV flux and a better match to observed UV spectra than those with shallower density profiles; all without producing large changes in the optical spectra. Walker et al. (2012) varied the luminosity of their models, finding that high luminosity models produce more UV flux, but more featureless UV spectra. The interpretation of these results is made more complex since they simultaneously changed the density structure of their models when varying the luminosity.
We present synthetic spectra from SYNOW and PHOENIX which are used to identify all major features from the far-UV to the near-UV in the +3.4 day HST spectrum of SN 2011fe first presented in Mazzali et al. (2014). A suite of PHOENIX spectra are then used to further examine the impact of different mechanisms that combine to form the UV spectrum, and to determine the temperature dependence of multiple features, which may be useful in constraining physical parameters within the ejecta. Section 2 outlines the models and spectral synthesis codes used in this work, with the line identifications from these spectra presented in Section 3. Section 4 further examines line formation mechanisms that play an important role in the UV. Section 5 places these results into the broader context of work on UV spectra of Type Ia SNe. Section 6 summarizes our conclusions.
2 Spectral Modeling
This work makes use of two different spectral synthesis codes, SYNOW and PHOENIX, capable of making line identifications in supernova spectra. Both codes rely on different assumptions and underlying physics to synthesize the spectra, providing a useful check on the other and improving our confidence in each line identification. The two codes are briefly summarized below.
2.1 SYNOW
SYNOW is designed to simulate supernova spectra and relies on simple assumptions that describe the supernova during the photospheric phase, including: spherical symmetry, homologous expansion (), a sharp photosphere that emits a blackbody continuum, and lines formed via resonance scattering, which are treated in the Sobolev approximation. SYNOW does not perform continuum transport; nor does it calculate ionization ratios or solve rate equations. Its primary purpose is to account for multiple line scattering so that it can be used in the empirical spirit to make line identifications, estimate the photospheric (or pseudo-photospheric) velocity, and roughly determine the velocity interval within which each ion is detected. The synthetic supernova spectrum generated by SYNOW consists of blended P-Cygni profiles (consisting of an unshifted emission component with a blueshifted absorption component) superimposed on the blackbody continuum.
For each ion included in the fit, the optical depth of a reference line at one velocity (typically the photospheric velocity) is a fit parameter, and the optical depths of the other lines of the ion at that velocity are calculated assuming a Boltzmann excitation temperature . Typically, the strongest optical line of an ion is chosen as the reference line. To limit the parameter space of the fit, is chosen to have the same value for each ion, 8000 K for the fit shown here. All line optical depths decrease exponentially with velocity, according to , where the e-folding velocity is generally taken to be 1000 km s-1. Therefore, the important parameters of the fit are the photospheric velocity , the optical depths of the ion reference lines, the velocity extent of each ion, and the e-folding velocity of each ion. The fit is optimized by eye, as is standard within the community. More information on SYNOW can be found in Jeffery & Branch (1990) and Branch et al. (2005, 2006).
2.2 PHOENIX
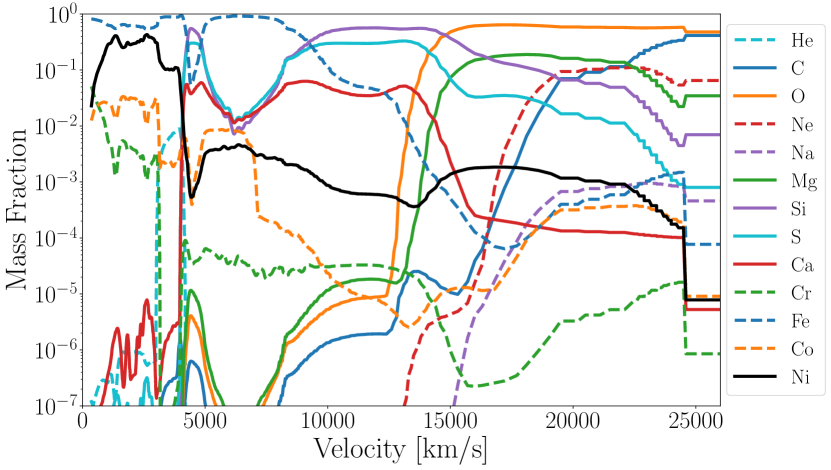
This work makes use of a generalized 1-D delayed detonation (DD) model first presented in Domínguez et al. (2001) which reproduces the light curves and spectra of Branch-normal supernovae and was previously shown to well match the pre-maximum light spectra of SN 2011fe in Baron et al. (2015) (specifically, we use the prompt DDT model whose density structure is shown in their Figure 1). The model starts with a C/O white dwarf taken from the core of an evolved 5M⊙ main-sequence star. This core approaches the Chandrasekhar mass through accretion, and an explosion is spontaneously triggered when the central density reaches g cm-3. The deflagration-to-detonation transition occurs at a density of g cm-3. The metalicity of the model is where the metalicity is defined as the ratio of the iron abundance to the solar iron abundance. The abundance structure of the model is shown in Fig. 1. Here, we recalculate the spectra using PHOENIX at 23 days after explosion, corresponding to the +3.4 day HST spectrum of SN 2011fe first presented in M14.
PHOENIX/1D version 18 is a general purpose stellar atmospheres program. It solves the radiative transfer equation along characteristic rays in spherical symmetry including all special relativistic effects. PHOENIX/1D solves the non-LTE (NLTE) rate equations. The effects of ionization due to non-thermal electrons produced from the -rays produced from the radioactive decay of 56Ni synthesized during the supernova explosion are included. The ions treated in NLTE are He I-II, C I-IV, O I-III, Ne I, Na I-II, Mg I-III, Si I-IV, S I-III, Ca II, Ti II, Cr I-III, Mn I-III, Fe I-III, Co I-III, and Ni I-III. These should encompass all the ions that have features that significantly form the observed spectral features in SNe Ia.
Each model atom includes primary NLTE transitions, which are used to calculate the level populations and opacity, however, all the opacity is included even if the levels of those lines are not in the model atom. These weaker lines are treated in LTE using the true NLTE occupation of the ground state. This opacity implicitly affects the rate equations via their effect on the solution to the transport equation (Hauschildt & Baron, 1999) and ensures that no line transition is excluded. For ions not treated in NLTE the line opacities are treated with the equivalent two-level atom source function, using a thermalization parameter, (Baron et al., 1996). The atmospheres are iterated to energy balance in the comoving frame; while we neglect the explicit effects of time dependence in the radiation transport equations, we do implicitly include these effects, via explicitly including work and the rate of gamma-ray deposition in the generalized equation of radiative equilibrium and in the rate equations for the NLTE populations.
The outer boundary condition is the total bolometric luminosity in the observer’s frame, and is the main tunable parameter in the simulations. The inner boundary condition is that the flux at the innermost zone (here ) is given by the diffusion equation. Converged models require 256 optical depth points to correctly obtain the Si II 6355 profile. The model is simulated at several different target luminosities, after which the spectra are examined and the best fit determined, again via“chi-by-eye”.
Baron et al. (2015) use PHOENIX/1D version 16, however the changes from version 16 to version 18 are confined to the PHOENIX/3D mode, updates to the molecular line lists (not included in either the previous or current calculations) and various bug fixes.
3 Line Identifications
Guided by the previous line identifications in near maximum-light spectra of Type Ia SNe outlined in Section 3, we generate synthetic spectra to fit the +3.4 day HST observations of SN 2011fe. Our goal is to provide a complete set of line identifications for the spectral features in the near max-light UV spectra of Type Ia SNe, and in particular to address the disagreement over whether singly or doubly ionized iron group elements (IGEs) like Fe and Co are responsible for UV feature formation.
| (Å) | 1981B (-2 d)aafootnotemark: | 1992A (+5/6 d)bbfootnotemark: | 2010jn (+4.8 d)ccfootnotemark: | 2011fe (+0.1/+3.4 d)ddfootnotemark: |
|---|---|---|---|---|
| 3300 | Co II | - | Co II, Co III, Fe III | Co III, Fe III |
| 3090 | Fe II | - | - | Si III, Co III, Fe III |
| 3010 | - | Fe II, Co II, Si III | - | Si III, Co III, Fe III |
| 2820 | - | Mg II, Fe II | Fe II, Mg II, Fe III | Co III, Fe III |
| 2650 | - | Mg II, Fe II | - | Mg II, Fe II |
| 2470 | - | Fe II | - | Fe II, Co II |
| 2250 | - | Fe II | - | Fe II, Co II, Ni II |
| 1950 | - | Cr II | - | - |
| 1580 | - | - | - | - |
| 1430 | - | - | - | Si II, Co II, Fe III |
| 1290 | - | - | - | - |
Note. — Line identifications that are described as tentative/weak by the original authors are italicized.
3.1 SYNOW Line ID’s
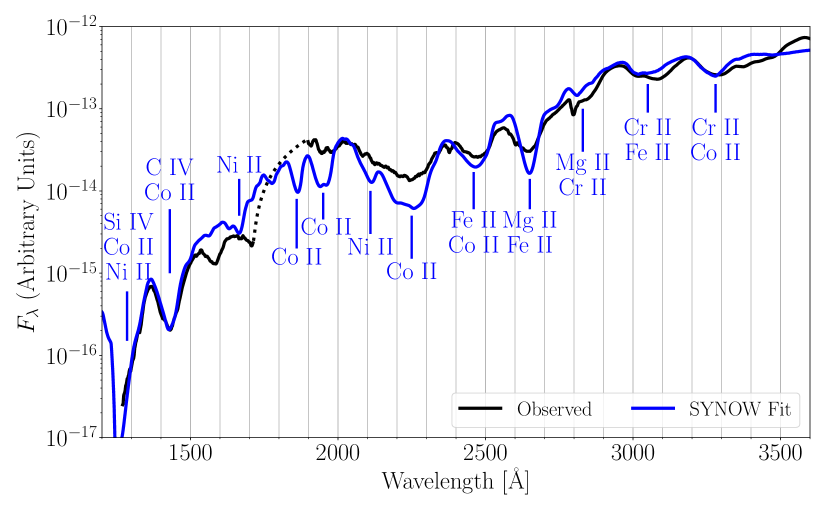
Fig. 2 shows the SYNOW spectrum and corresponding line identifications. Overall the SYNOW spectrum fits the observations well, although the lines are too strong in some mid-UV features. Compared to previous line identifications in near-max light UV spectra of Type Ia SNe (see Section 3), the identifications of UV features differ significantly in the both the near and far-UV. For the first time, Cr II is identified in the near max-light UV spectrum of a Type Ia, and the features centered around Å Å and Å features.111M14 identify Cr II in both the near-UV features at early times, but argue that these features change to blends of Fe III and Co III around -7 days Additionally, the contributions from Fe and Co throughout the UV are attributed solely to the singly ionized states, not partially or wholly to the double ionized states as found previously. In the mid-UV, we find better agreement with previous work, where the prominent features are identified as blends primarily of Fe II, Co II, and Ni II, with the Å and Å features requiring contributions from Mg II lines. In the far-UV, the main features are caused by the strong resonance lines of C IV and Si IV blended with weaker Co II and Ni II lines as the primary iron group element contributors.
3.2 PHOENIX Line ID’s
Previously, line identifications made with PHOENIX were determined via “single-ion spectra”, where the converged model has all line opacities artificially set to zero, except for the ion of interest (Bongard et al., 2008). However, in the UV line blanketing from IGEs and blending of strong lines of intermediate mass elements (IMEs), unburned material, and IGEs in the UV contribute to the formation of the broad UV spectral features making the use of single-ion spectra difficult. Instead, we adopt the inverse approach, setting the line opacities in our ion of interest to zero and looking for changes in the flux near the spectral features by subtracting the spectra without the ion of interest from the full fit. While spectra are not additive in this manner, this approach provides us with the minimal contribution of the strong lines for each ion of interest to the spectrum. Another relatively minor complication is that PHOENIX iterates the scattering problem when generating spectra so the mean intensity , is readjusted for the new (diagnostic) opacity and source function. Since the opacity changes less in the inverse single-ion approach than in the single-ion approach, the inverse approach should be preferable for this particular effect. The relative line strengths of “inverse single-ion spectra” for the ion of interest will be underestimated in blended features due to photons scattering into the other lines comprising the blend. Locally normalized spectra (Jeffery et al., 2007) are used in the line identification process to account for the flux change of over four orders of magnitude from the near to far-UV. We only identify lines with a residual greater than 0.1 in order to avoid identifying weak lines that contribute to the line blanketing in the region but not the feature itself. While this choice of residual value is somewhat arbitrary, residuals less than 0.1 are hard to distinguish when visually comparing spectra with and without the ion of interest, and typically do not change the line shapes when excluded from the best fit spectrum (see the weak Cr II lines within Fig. 5 for example).
Fig. 3 shows the line identifications in the UV according the PHOENIX inverse single-ion spectra plotted in Figs. 4 and 5. Overall, the model replicates the observed spectrum well in the near and far-UV, but overestimates the flux levels in the mid-UV.
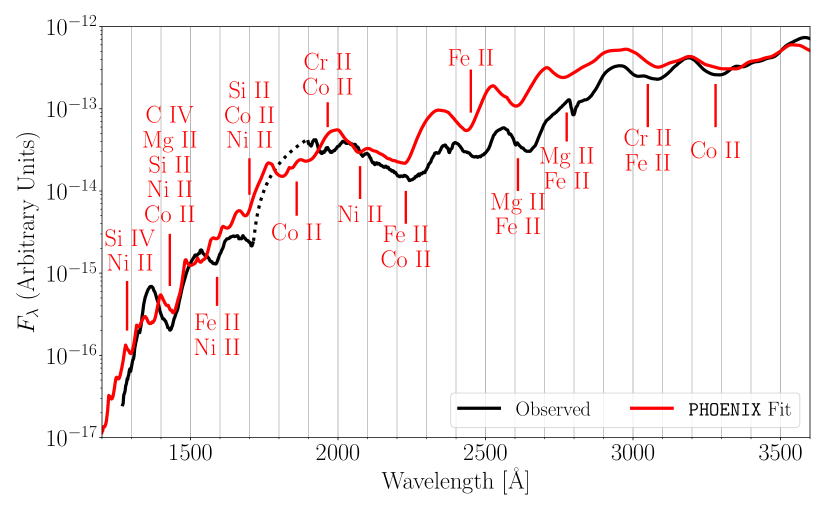
Near-UV features are blends of IGEs including Fe II and Co II with the exception of the Å feature which includes a contribution from Mg II (). In the mid-UV, features are similarly due to Fe II and Co II, again with a contribution from Mg II () to the Å feature. There is also an isolated Ni II feature at Å. The Å and Å features have the correct shape but are blueshifted relative to the observations. M14 also had difficulties in fitting sections of the UV spectrum with their WDD1 model, with the mid-UV fit showing a similar blueshift in the feature minima, albeit with flux values that were too low. This suggests that these blueshifts in the mid-UV feature minima are inherent in all delayed-detonation models, possibly due to the shape of the density profiles in the regions where these features form. The likely cause of the mid-UV flux differences are differing metalicities in the models ( in M14 compared to here). This would support the conclusions of Foley & Kirshner (2013) that 2011fe and 2011by differ in flux in the mid-UV due to differing metalicities. However, full exploration of the impacts of varying the metalicity in delayed-detonation models is beyond the scope of this work.
In the far-UV, blends are much more complicated, with lines from Fe II and Ni II blending with a complex of Mg II lines with rest wavelengths of Å and Si II() near the resonance lines from highly ionized species like C IV () and Si IV (). Determining the location of the C IV and Si IV resonance lines from the minimum of the residual yields velocities of km s-1 and km s-1. Similarly, the Si II and Mg II UV features are also formed in the outer layers of the ejecta with velocities of and , , and for the Å , and lines respectively. This indicates that the UV resonance lines can be an important probe of the nature of the outermost part of SNe Ia ejecta. Particularly the C IV line can give information on both the carbon abundance and the highest velocity of the ejecta, providing clues to the SNe Ia environment.
To our knowledge C IV and Si IV have never before been identified in a SN. While lines of singly and triply ionized C and Si are seen, very little, if any doubly ionized lines are identified in the UV. Unlike the doubly ionized states, where the paired valence electrons increase the excitation energies and force the resonance lines into the unobservable UV, the triply ionized states have only one easily excited valence electron, which allows the resonance lines to be located in the far-UV. All other lines of the triply ionized state are high excitations and therefore unobserved.
3.3 Agreement with SYNOW Line ID’s
In general, the line identifications from the SYNOW and PHOENIX fits agree with each other, with a few exceptions. In the near-UV, both fits agree that the observed features are due to blends mainly consisting of Fe II and Co II. However, the PHOENIX model disagrees that Cr II is a significant contributor to the Å and Å features. While a Cr II line is present at the Å in the residual in Fig. 5, the line at this location is too weak to be considered a detection. This is perhaps due to the relatively small amount of Cr present in the model, but may also be due to line blanketing or NLTE effects included in PHOENIX but not SYNOW. Both synthetic spectra find that the mid-UV can be modeled by blends of Mg II, Cr II, Fe II, and Co II, although there is some disagreement over the specific compositions of individual blends (ex. Fe II and Co II in the Å and Å features). Both fits also find support for an isolated Ni II feature at Å. In the far-UV, both fits agree on the necessity of C IV and Si IV to fit the observed features, however they disagree slightly on the weaker components of the blends, with the PHOENIX fit showing evidence of Si II, Mg II and Ni II in the Å blend, while not finding significant Co II in the Å feature. Throughout the UV, both the SYNOW and PHOENIX fits find doubly ionized iron group species make no significant contributions to any features.
3.4 Model Agreement in Optical and NIR
An important test for the validity of delayed-detonation models is the ability to simultaneously reproduce observed spectra across a large wavelength range. Fig. 6 shows the best fit model is able to match the observed spectrum not only in the UV, but the optical and NIR as well. While the model is able to reproduce the spectrum in the UV and optical, there is a consistent flux excess in the NIR, extending to 2.5 microns. Using the same model, Baron et al. (2015) were able to replicate the optical and NIR spectra (see their Fig. 11) at max light but did not attempt to simultaneously fit the UV, which suggests the underlying model is limited in its ability to recreate the spectra in all three regions at once. This particular model seems to produce the Ca H+K line significantly stronger than observed, which is likely due to the structure of the explosion model itself. Potential causes of these flux mismatches are further explored in Section 4.3.
4 Other Spectral Formation Mechanisms
4.1 Photoionization Edges
At the threshold wavelength for a bound-free transition, the opacity jumps, since redward of that wavelength the opacity in that transition is zero, and as one reaches the threshold energy, the opacity is finite. This jump in opacity is not dissimilar to what happens in a line, and thus at the threshold wavelength of bound-free (photoionization edges), one sees P-Cygni like features, with only continuum opacity and all line transitions ignored (Baron et al., 1999). These photoionization edges are easily seen in “continuum-only spectra”, which are generated in a manner similar to “single-ion spectra” but with the opacities of all lines artificially set to zero, leaving only the bound-free and free-free processes to determine the opacity. The continuum-only spectra of Bongard et al. (2008) show in the W7 model near maximum light several photoionization edges form blue-wards of 2000 Å (see their Figure 5).
Examining the ionization energies of elements present in the model reveals two potential sources of the edges. The first is ionization of C and O from low excitation states in the outer layers of the ejecta. The second is ionization from higher excitation states of Fe II located deep within the ejecta. We create continuum-only spectra of our DD model, shown in Fig. 7 with panel (a) showing the wavelengths of ionization edges from C I, C III, and O II; while panel (b) shows the ionization locations of Fe II. All photoionization edges in our model form in the far-UV, and some are coincident with the features that form at Å and Å. In both cases, not all excited states correspond to an observed edge in the model, and several edges seen in the model may in fact be combinations of edges from different ions (ex. the edge at Å is located near ionizations of C I, O II, and Fe II).
4.2 Line Blanketing
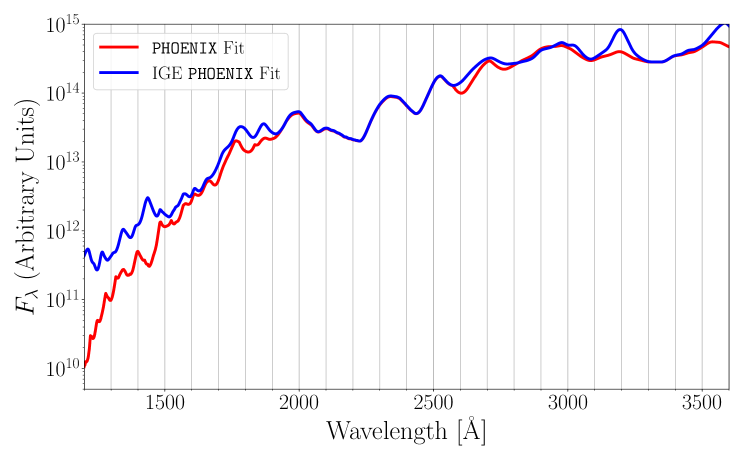
Line blanketing from IGE’s has long been thought a dominant factor in determining the flux levels in the UV spectra of Type Ia SNe. Utilizing PHOENIX’s ability to artificially remove elements from the spectra by setting the opacities of specific elements to zero, we create an IGE-only spectrum, containing only the lines of Cr I-III, Mn I-III, Fe I-III, Co I-III, and Ni I-III to determine the importance of this effect. The IGE-only spectrum is shown in Fig. 8 compared to the best fit spectrum. In the near and mid-UV, the IGE only-spectrum is able to reproduce almost exactly the observed features and flux levels, excluding the contribution of Mg II in the mid-UV and the emission peak around 3200 Å. The tight agreement of the IGE-only spectrum with that of the full fit suggests that the IGE’s are the primary drivers of spectral formation in this region, and measurements of this region can provide insight into quantities related to the velocity extent of iron group elements as well as their abundances.
However, in the far-UV the flux of the IGE-only fit slowly deviates from that of the full fit until it is an order of magnitude too high, indicating that lines from unburned and partially burned material in the outermost layers of the ejecta play an important role in the formation of this region of the spectrum. Further insights into this material may be gained from additional observations of Type Ia spectra in the far-UV.
4.3 Temperature Dependences
Several spectral features, both in the optical and ultraviolet demonstrate strong temperature dependence in our models. We briefly describe a few of these ultraviolet features here, while a more complete analysis of all temperature dependent features in our models from ultraviolet to near-infrared is left to future work (J. DerKacy, et al., in prep). We should note that we use temperature in a very general sense to denote variations in the spectral energy distribution and ionization state throughout the atmosphere. Our models, are highly NLTE and thus one cannot capture either the state of the radiation field or the ionization state of the ions with one simple quantity, temperature.
To better understand this temperature dependence we created several runs of our underlying DD model, each with a different target luminosity. The underlying density and abundance structure was held constant in each run. Changing the target luminosity between runs alters the temperature structure, opacities, and ionization balance of the runs, while they are iterated to radiative equilibrium. The most temperature sensitive regions of the spectra are the far-UV, where variations are seen in both the overall flux level and the C IV blend near 1430 Å, and the mid-UV Fe II blends near Å and Å, and the full UV spectrum are shown in Fig. 10.
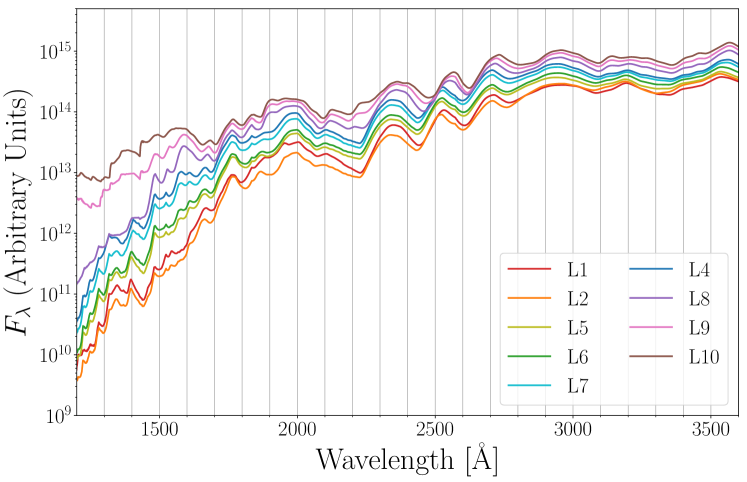
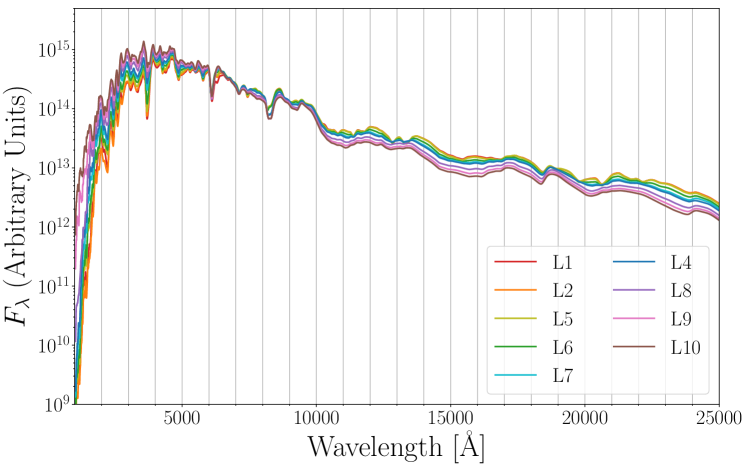
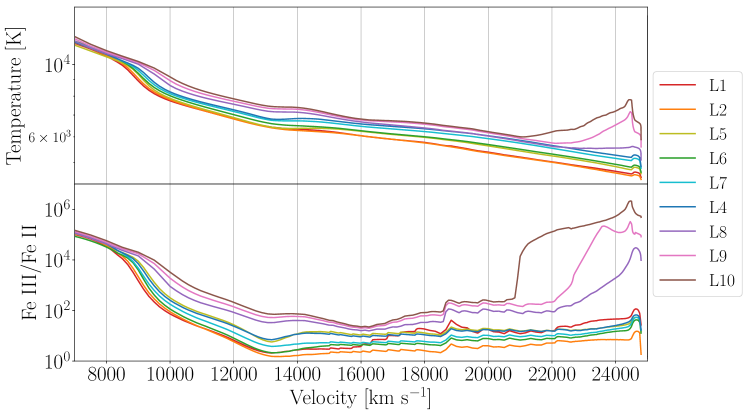
The most noticeable difference in the spectra appears in the far-UV where the flux level of the spectra varies by three orders of magnitude across the runs. This drastic change in flux is caused by the changing ratio of Fe III/Fe II above the photosphere, as seen in Fig. 14. Because Fe II is more efficient at redistributing flux from blue to red than Fe III, runs with lower temperatures that have a higher fraction of Fe II in the outer layers have lower UV flux levels and increased NIR fluxes. The variations in the NIR spectra can be seen in Fig. 12. As the temperature in the outer layers is increased, the the UV (and especially far-UV) flux begins to deviate more from the observed spectrum while the NIR flux levels slowly come into agreement with observations.
5 Discussion
The ability of the model to match either the UV or NIR spectra, but not both, in addition to the optical spectra suggests several potential changes that may help to bring the model into better agreement with the observations. One potential change is to adjust the model’s metalicity. This adjustment may prove difficult however, as any potential decrease in UV flux due to increased metalicity must be balanced against any increases in flux that result from higher opacities pushing the photosphere farther out in the ejecta and higher temperatures in the outer layers altering the ionization balance of the outer layers; in particular the Fe III/Fe II ratio. This is the subject of future work, where we will self-consistently study the metalicity dependence and compare to a broad range of observed SNe Ia.
Secondly, an incorrect distribution of 56Ni could also play a role in the flux mismatch. Broad wavelength coverage can provide clues as to the velocity extent of (Ashall et al., 2019a, b). From the SN 2011fe light curve Piro (2012) concluded that was required in the outer of the supernova, however, Baron et al. (2015) found that at such high velocities did not affect the spectra, but they were focused on the optical and infrared and not the UV.
Finally, the density structure of the model, which beyond 18,000 km s-1 closely approximates an power-law, may not accurately describe the density profile in the outer layers. Sauer et al. (2008) were able to produce similar results in their simulations of W7 by varying the power law exponent above 15000 km s-1. Models with steeper density gradients produced lower flux values in the far-UV as they had a lower Fe III/Fe II ratio. However, the increased density in the outer layers result in smoother, almost featureless spectra. Models with shallower density gradients produced higher flux values due to high Fe III/Fe II ratios and appropriate spectral features. Taken together with our results, this suggests that temperature and density variations in the outer ejecta layers are degenerate with respect to the far-UV spectra. However, we stress that the full investigations of these effects needed to break this degeneracy are beyond the scope of this work.
The variation in the Fe III/Fe II ratio also partially explains the velocity shift in the Fe II blends in the mid-UV. As the amount of Fe II at higher velocities decreases with the increased temperature, the Fe II lines form deeper in the ejecta at lower velocities, bringing the model into better agreement with the observed velocities of the feature. This change in the wavelength of the Fe II feature forming the blend at Å could also be the result of the higher temperature favoring a different combination of Fe II lines in the region. Additionally, the higher temperatures drive an increase in the strength and width of the emission peak of the Mg II feature at Å due to . This in turn causes the absorption minima of the Å feature to appear redder, in better agreement with the observations. Fig. 15 shows the evolution of the Fe II and Mg II residuals with increasing temperature.
6 Conclusions
We fit the UV spectrum SN 2011fe at +3.4 days after maximum light with synthetic spectra generated by both SYNOW and PHOENIX (with a DD model) to provide line identifications for all major features. Both codes generally agree in their identifications, with both the near and mid-UV spectra comprised of blends of Cr II, Fe II, Co II and Ni II. Features in the far-UV are formed by strong resonance lines of C IV, Si II, and Si IV combined with the now less dominant lines from singly ionized IGE’s that dominate the rest of the UV spectra. Leveraging the ability of PHOENIX to generate “single-ion spectra”, we further investigate the impact of other spectral formation mechanisms on the UV spectra. We find several photoionization edges coincident with the far-UV features which significantly contribute to determining the flux level in this region. We also examine an IGE-only spectrum, which is able to reproduce both the features and flux levels of a significant portion of the UV spectrum, further confirming the utility of mid-UV measurements as a probe of IGEs in Type Ia SNe. Finally, using a suite of PHOENIX models with different target luminosities, we identify several regions of the UV spectrum with strong temperature dependence. In the far-UV, the Fe III/Fe II ratio in the outermost portion of the ejecta changes rapidly with temperature and results in a flux levels that vary by almost four orders of magnitude across the models. In the mid-UV, the features centered at Å and Å, which are too fast in DD models, begin to recede in velocity and better match observations.
DD models both here and elsewhere have shown the ability to replicate the spectra of Type Ia SNe in the UV and future work using DD models which implicitly account for metalicity and density variations are needed to investigate the UV diversity of Type Ia SNe in greater detail.
References
- Ashall et al. (2019a) Ashall, C., Hsiao, E. Y., Hoeflich, P., et al. 2019a, ApJ, 875, L14, doi: 10.3847/2041-8213/ab1654
- Ashall et al. (2019b) Ashall, C., Hoeflich, P., Hsiao, E. Y., et al. 2019b, ApJ, 878, 86, doi: 10.3847/1538-4357/ab204b
- Baron et al. (1999) Baron, E., Branch, D., Hauschildt, P. H., Filippenko, A. V., & Kirshner, R. P. 1999, ApJ, 527, 739, doi: 10.1086/308107
- Baron et al. (1996) Baron, E., Hauschildt, P. H., Nugent, P., & Branch, D. 1996, MNRAS, 283, 297, doi: 10.1093/mnras/283.1.297
- Baron et al. (2015) Baron, E., Hoeflich, P., Friesen, B., et al. 2015, MNRAS, 454, 2549, doi: 10.1093/mnras/stv1951
- Bongard et al. (2008) Bongard, S., Baron, E., Smadja, G., Branch, D., & Hauschildt, P. H. 2008, ApJ, 687, 456, doi: 10.1086/590107
- Branch et al. (2005) Branch, D., Baron, E., Hall, N., Melakayil, M., & Parrent, J. 2005, PASP, 117, 545, doi: 10.1086/430135
- Branch & Venkatakrishna (1986) Branch, D., & Venkatakrishna, K. L. 1986, ApJ, 306, L21, doi: 10.1086/184696
- Branch et al. (2006) Branch, D., Dang, L. C., Hall, N., et al. 2006, PASP, 118, 560, doi: 10.1086/502778
- Brown et al. (2015) Brown, P. J., Baron, E., Milne, P., Roming, P. W. A., & Wang, L. 2015, ApJ, 809, 37, doi: 10.1088/0004-637X/809/1/37
- Brown & Crumpler (2019) Brown, P. J., & Crumpler, N. R. 2019, arXiv e-prints, arXiv:1909.05445. https://arxiv.org/abs/1909.05445
- Domínguez et al. (2001) Domínguez, I., Höflich, P., & Straniero, O. 2001, ApJ, 557, 279, doi: 10.1086/321661
- Ellis et al. (2008) Ellis, R. S., Sullivan, M., Nugent, P. E., et al. 2008, ApJ, 674, 51, doi: 10.1086/524981
- Fisher (2000) Fisher, A. K. 2000, PhD thesis, THE UNIVERSITY OF OKLAHOMA
- Foley & Kirshner (2013) Foley, R. J., & Kirshner, R. P. 2013, ApJ, 769, L1, doi: 10.1088/2041-8205/769/1/L1
- Foley et al. (2012) Foley, R. J., Filippenko, A. V., Kessler, R., et al. 2012, AJ, 143, 113, doi: 10.1088/0004-6256/143/5/113
- Hachinger et al. (2013) Hachinger, S., Mazzali, P. A., Sullivan, M., et al. 2013, MNRAS, 429, 2228, doi: 10.1093/mnras/sts492
- Hauschildt & Baron (1999) Hauschildt, P. H., & Baron, E. 1999, Journal of Computational and Applied Mathematics, 109, 41. https://arxiv.org/abs/astro-ph/9808182
- Hoeflich et al. (2017) Hoeflich, P., Hsiao, E. Y., Ashall, C., et al. 2017, ApJ, 846, 58, doi: 10.3847/1538-4357/aa84b2
- Iwamoto et al. (1999) Iwamoto, K., Brachwitz, F., Nomoto, K., et al. 1999, ApJS, 125, 439, doi: 10.1086/313278
- Jeffery & Branch (1990) Jeffery, D. J., & Branch, D. 1990, in Supernovae, Jerusalem Winter School for Theoretical Physics, ed. J. C. Wheeler, T. Piran, & S. Weinberg, Vol. 6, 149
- Jeffery et al. (2007) Jeffery, D. J., Ketchum, W., Branch, D., et al. 2007, ApJS, 171, 493, doi: 10.1086/518423
- Kirshner et al. (1993) Kirshner, R. P., Jeffery, D. J., Leibundgut, B., et al. 1993, ApJ, 415, 589, doi: 10.1086/173188
- Lentz et al. (2000) Lentz, E. J., Baron, E., Branch, D., Hauschildt, P. H., & Nugent, P. E. 2000, ApJ, 530, 966, doi: 10.1086/308400
- Maguire et al. (2012) Maguire, K., Sullivan, M., Ellis, R. S., et al. 2012, MNRAS, 426, 2359, doi: 10.1111/j.1365-2966.2012.21909.x
- Mazzali & Lucy (1993) Mazzali, P. A., & Lucy, L. B. 1993, A&A, 279, 447
- Mazzali et al. (2014) Mazzali, P. A., Sullivan, M., Hachinger, S., et al. 2014, MNRAS, 439, 1959, doi: 10.1093/mnras/stu077
- Nomoto et al. (1984) Nomoto, K., Thielemann, F.-K., & Yokoi, K. 1984, apj, 286, 644
- Pan et al. (2020) Pan, Y. C., Foley, R. J., Jones, D. O., Filippenko, A. V., & Kuin, N. P. M. 2020, MNRAS, 491, 5897, doi: 10.1093/mnras/stz3391
- Piro (2012) Piro, A. L. 2012, ApJ, 759, 83
- Sauer et al. (2008) Sauer, D. N., Mazzali, P. A., Blondin, S., et al. 2008, MNRAS, 391, 1605, doi: 10.1111/j.1365-2966.2008.14018.x
- Walker et al. (2012) Walker, E. S., Hachinger, S., Mazzali, P. A., et al. 2012, MNRAS, 427, 103, doi: 10.1111/j.1365-2966.2012.21928.x