soft open fences
Segmentation analysis and the recovery of queuing parameters via the Wasserstein distance: a study of administrative data for patients with chronic obstructive pulmonary disease
Abstract
This work uses a data-driven approach to analyse how the resource requirements of patients with chronic obstructive pulmonary disease (COPD) may change, quantifying how those changes impact the hospital system with which the patients interact. This approach is composed of a novel combination of often distinct modes of analysis: segmentation, operational queuing theory, and the recovery of parameters from incomplete data. By combining these methods as presented here, this work demonstrates that potential limitations around the availability of fine-grained data can be overcome. Thus, finding useful operational results despite using only administrative data.
The paper begins by finding a useful clustering of the population from this granular data that feeds into a multi-class model, whose parameters are recovered from the data via parameterisation and the Wasserstein distance. This model is then used to conduct an informative analysis of the underlying queuing system and the needs of the population under study through several what-if scenarios.
The analyses used to form and study this model consider, in effect, all types of patient arrivals and how those types impact the system. With that, this study finds that there are no quick solutions to reduce the impact of COPD patients on the system, including adding capacity to the system. In this analysis, the only effective intervention to reduce the strain caused by those presenting with COPD is to enact external policies which directly improve the overall health of the COPD population before they arrive at the hospital.
1 Introduction
Population health research is increasingly based on data-driven methods (as opposed to those designed solely by clinical experts) for patient-centred care through the advent of accessible software and a relative abundance of electronic data. However, many such methods rely heavily on detailed data — about both the healthcare system and its population — which may limit research where sophisticated data pipelines are not yet in place.
This work demonstrates a method of overcoming this, using routinely gathered, administrative hospital data to build a clustering that feeds into a multi-class queuing model, allowing for better understanding of the healthcare population and the system with which they interact. Specifically, this work examines records of patient spells from the National Health Service (NHS) Wales Cwm Taf Morgannwg University Health Board (UHB) presenting chronic obstructive pulmonary disease (COPD). COPD is a condition of particular interest to population health research, and to Cwm Taf Morgannwg UHB, as it is known to often present as a comorbidity in patients [15], increasing the complexity of treatments among those with the condition. Moreover, an internal report by NHS Wales found the Cwm Taf Morgannwg UHB had the highest prevalence of the condition across all the Welsh health boards.
This work draws upon several overlapping sources within mathematical research, and this work contributes to the literature in three ways: to theoretical queuing research by the estimation of missing queuing parameters with the Wasserstein distance; to operational healthcare research through the weaving together of the combination of methods used in this work despite data constraints; and to public health research by adding to the growing body of mathematical and operational work around a condition that is vital to understand operationally, socially and medically.
The remainder of the paper is structured as follows: Section 1 provides a literature review, and an overview of the dataset and its clustering; Section 2 describes the queuing model used and the estimation of its parameters; Section 3 presents several what-if scenarios with insight provided by the model parameterisation and the clustering; Section 4 concludes the paper. Although the data is confidential and may not be published, a synthetic analogue has been archived [43] along with all the source code used in this paper [40].
1.1 Literature review
Given the subject matter of this work, the relevant literature spans much of operational research in healthcare, and the focus of this review is on the critical topics of segmentation analysis, queuing models applied to hospital systems, and the handling of missing or incomplete data for such queues.
1.1.1 Segmentation analysis
Segmentation analysis allows for the targeted analysis of otherwise heterogeneous datasets and encompasses several techniques from operational research, statistics and machine learning. One of the most desirable qualities of this kind of analysis is the ability to glean and communicate simplified summaries of patient needs to stakeholders within a healthcare system [38, 49]. For instance, clinical profiling often forms part of the broader analysis where each segment is summarised in a phrase or infographic [39, 47].
The review for this work identified three commonplace groups of patient characteristics used to segment a patient population: system utilisation metrics; clinical attributes; and the pathway. The last is not used to segment the patients directly, instead of grouping their movements through a healthcare system, typically via process mining. [1] and [6] demonstrate how this technique can be used to improve the efficiency of a hospital system as opposed to tackling the more relevant issue of patient-centred care. The remaining characteristics can be segmented in a variety of ways, but recent works tend to favour unsupervised methods — typically latent class analysis (LCA) or clustering [46].
LCA is a statistical, model-based method used to identify groups (called latent classes) in data by relating its observations to some unobserved (latent), categorical attribute. This attribute has multiple possible categories, each corresponding to a latent class. The discovered relations enable the observations to be separated into latent classes according to their maximum likelihood class membership [13, 22]. This method has proved useful in the study of comorbidity patterns as in [20, 21] where combinations of demographic and clinical attributes are related to various subgroups of chronic diseases.
Similarly to LCA, clustering identifies groups (clusters) in data to produce labels for its instances. However, clustering includes a wide variety of methods where the common theme is to maximise homogeneity within, and heterogeneity between, each cluster [10]. The -means paradigm is the most popular form of clustering in literature. The method iteratively partitions numerical data into distinct parts where is fixed a priori. This method has proved popular as it is easily scalable, and its implementations are concise [26, 45]. In addition to -means, hierarchical clustering methods can be useful if a suitable number of parts cannot be found initially [39]. However, supervised hierarchical segmentation methods such as classification and regression trees (as in [14]) have been used where an existing, well-defined, label is of particular significance.
1.1.2 Queuing models
Since the seminal works by Erlang [8, 9] established the core concepts of queuing theory, the application of queues and queuing networks to real services has become abundant, including the healthcare service. By applying these models to healthcare settings, many aspects of the underlying system can be studied. A common area of study in healthcare settings is of service capacity. [23] is an early example of such work where acute bed capacity was determined using hospital occupancy data. Meanwhile, more modern works such as [28, 29] consider more extensive sources of data to build their queuing models. Moreover, the output of a model is catered more towards being actionable — as is the prerogative of operational research. For instance, [29] devises new categorisations for both hospital beds and arrivals that are informed by the queuing model. A further example is [18] where queuing models are used to measure and understand satisfaction among patients and staff.
In addition to these theoretic models, healthcare queuing research has expanded to include computer simulation models. The simulation of queues, or networks thereof, have the benefit of adeptly capturing the stochastic nuances of hospital systems over their theoretic counterparts. Example areas include the construction and simulation of Markov processes via process mining [1, 31], and patient flow [3]. Regardless of the advantages of simulation models, a prerequisite is reliable software with which to construct those simulations. A common approach to building simulation models of queues is to use a graphical user interface such as Simul8. These tools have the benefits of being highly visual, making them attractive to organisations looking to implement queuing models without necessary technical expertise, including the NHS. [4] discusses the issues around operational research and simulation being taken up in the NHS despite the availability of intuitive software packages like Simul8. However, they do not address a core principle of good simulation work: reproducibility. The ability to reliably reproduce a set of results is of great importance to scientific research but remains an issue in simulation research generally [11]. When considering issues with reproducibility in scientific computing (simulation included), the source of any concerns is often with the software used [17]. Using well-developed, open-source software can alleviate issues around reproducibility and reliability as how they are used involve less uncertainty and require more rigour than ‘drag-and-drop’ software. One example of such a piece of software is Ciw [27]. Ciw is a discrete event simulation library written in Python that is fully documented and tested. The simulations constructed and studied in Sections 2 and 3 utilise this library and aid the overall reproducibility of this work.
1.1.3 Handling incomplete queue data
As is discussed in other parts of this section, the data available in this work is not as detailed as in other comparative works. Without access to such data — but intending to gain insight from what is available — it is imperative to bridge the gap left by the incomplete data.
Moreover, it is often the case that in practical situations where suitable data is not (immediately) available, further inquiry in that line of research will stop. Queuing models in healthcare settings appear to be such a case; the line ends at incomplete queue data. [2] is a bibliographic work that collates articles on the estimation of queuing system characteristics — including their parameters. Despite its breadth of almost 300 publications from 1955, only two articles have been identified as being applied to healthcare: [24, 48]. Both works are concerned with customers who can re-enter services during their time in the queuing system, which is mainly of value when considering the effect of unpredictable behaviour in intensive care units, for instance. [24] seeks to approximate service and re-service densities through a Bayesian approach and by filtering out those customers seeking to be serviced again. On the other hand, [48] considers an extension to the queue with direct re-entries. The devised model is then used to determine resource requirements in two healthcare settings.
Aside from healthcare-specific works, the approximation of queue parameters has formed a part of relevant modern queuing research. However, the scope is primarily focused on theoretic approximations rather than by simulation. [7, 12] are two such recent works that consider an underlying process to estimate a general service time distribution in single server and infinite server queues respectively.
1.2 Overview of the dataset and its clustering
The Cwm Taf Morgannwg UHB provided the dataset used in this work. The dataset contains an administrative summary of 5,231 patients presenting COPD from February 2011 through March 2019 totalling 10,861 spells. A patient (hospital) spell is defined as the continuous stay of a patient using a hospital bed on premises controlled by a healthcare provider and is made up of one or more patient episodes [25]. The following attributes describe the spells included in the dataset:
-
•
Personal identifiers and information, i.e. patient and spell ID numbers, and identified gender;
-
•
Admission/discharge dates and approximate times;
-
•
Attributes summarising the clinical path of the spell including admission/discharge methods, and the number of episodes, consultants and wards in the spell;
-
•
International Classification of Diseases (ICD) codes and primary Healthcare Resource Group (HRG) codes from each episode;
-
•
Indicators for any COPD intervention. The value for any given instance in the dataset (i.e. a spell) is one of no intervention, pulmonary rehabilitation (PR), specialist nursing (SN), and both interventions;
-
•
Charlson Comorbidity Index (CCI) contributions from several long term conditions (LTCs) as well as indicators for some other conditions such as sepsis and obesity. CCI is useful in anticipating hospital utilisation as a measure for the burdens associated with comorbidity [34];
- •
In addition to the above, the following attributes were engineered for each spell:
-
•
Age and spell cost data were linked to approximately half of the spells in the dataset from another administrative dataset provided by the Cwm Taf Morgannwg UHB;
-
•
The presenting ICD codes were generalised to their categories according to NHS documentation and counts for each category were attached. This reduced the number of values from 1,926 codes to 21 categories;
-
•
A measure of admission frequency was calculated by taking the number of COPD-related admissions in the last twelve months linked to the associated patient ID number.
Although there is a fair amount of information here, it is limited to COPD-related admissions. Therefore, rather than segmenting the patients themselves, the spells will be. The clustering algorithm of choice is a variant of -means, called -prototypes, allows for the clustering of mixed-type data by performing - means on the numeric attributes and -modes on the categoric. Both -prototypes and -modes were presented in [16].
The attributes included in the clustering encompass both utilisation metrics and clinical attributes relating to the spell. They comprise the summative clinical path attributes, the CCI contributions and condition indicators, the WIMD rank, length of stay (LOS), COPD intervention status, and the engineered attributes (not including age and costs due to lack of coverage).
To determine the optimal number of clusters, , the knee point detection algorithm introduced in [32] was used with a range of potential values for from two to 10. This range was chosen based on what may be considered feasibly informative to stakeholders. The knee point detection algorithm can be considered a deterministic version of the widely known ‘elbow method’ for determining the number of clusters. Applying this algorithm revealed an optimal value for of four, but both three and five clusters were considered. Both of these cases were eliminated due to a lack of clear separation in the characteristics of the clusters. Additionally, the initialisation method used for -prototypes was presented in [42] as it was found to give an improvement in the clustering over other initialisation methods.
| Cluster | Population | |||||
|---|---|---|---|---|---|---|
| 0 | 1 | 2 | 3 | |||
| Characteristics | Percentage of spells | 9.91 | 19.27 | 69.39 | 1.44 | 100.00 |
| Mean spell cost, £ | 8051.23 | 2309.63 | 1508.41 | 17888.43 | 2265.40 | |
| Percentage of recorded costs | 29.01 | 19.38 | 48.20 | 3.40 | 100.00 | |
| Median age | 77.00 | 77.00 | 71.00 | 82.00 | 73.00 | |
| Minimum LOS | 12.82 | -0.00 | -0.02 | 48.82 | -0.02 | |
| Mean LOS | 25.30 | 6.46 | 4.11 | 75.36 | 7.68 | |
| Maximum LOS | 51.36 | 30.86 | 16.94 | 224.93 | 224.93 | |
| Median COPD adm. in last year | 2.00 | 1.00 | 1.00 | 2.00 | 1.00 | |
| Median no. of LTCs | 2.00 | 3.00 | 1.00 | 3.00 | 1.00 | |
| Median no. of ICDs | 9.00 | 8.00 | 5.00 | 11.00 | 6.00 | |
| Median CCI | 9.00 | 20.00 | 4.00 | 18.00 | 4.00 | |
| Intervention prevalence | None, % | 80.20 | 83.42 | 65.76 | 89.74 | 70.94 |
| PR, % | 15.80 | 13.43 | 27.97 | 8.97 | 23.69 | |
| SN, % | 3.81 | 2.87 | 4.63 | 1.28 | 4.16 | |
| Both, % | 0.19 | 0.29 | 1.63 | 0.00 | 1.21 | |
| LTC prevalence | Pulmonary disease, % | 100.00 | 100.00 | 100.00 | 100.00 | 100.00 |
| Diabetes, % | 19.05 | 28.14 | 14.84 | 25.00 | 17.96 | |
| AMI, % | 13.85 | 22.93 | 8.76 | 16.03 | 12.10 | |
| CHF, % | 12.45 | 53.85 | 0.00 | 26.28 | 11.99 | |
| Renal disease, % | 7.53 | 19.54 | 1.92 | 17.95 | 6.10 | |
| Cancer, % | 7.62 | 12.23 | 2.93 | 10.90 | 5.30 | |
| Dementia, % | 6.88 | 21.26 | 0.00 | 26.92 | 5.17 | |
| CVA, % | 8.64 | 13.33 | 0.70 | 19.87 | 4.20 | |
| PVD, % | 4.37 | 7.69 | 2.27 | 5.77 | 3.57 | |
| CTD, % | 5.11 | 4.25 | 3.11 | 4.49 | 3.54 | |
| Obesity, % | 2.51 | 3.01 | 1.49 | 7.69 | 1.97 | |
| Metastatic cancer, % | 1.58 | 4.49 | 0.00 | 0.64 | 1.03 | |
| Paraplegia, % | 1.30 | 3.73 | 0.24 | 0.64 | 1.02 | |
| Diabetic compl., % | 0.19 | 0.86 | 0.48 | 1.92 | 0.54 | |
| Peptic ulcer, % | 1.58 | 0.81 | 0.23 | 1.28 | 0.49 | |
| Sepsis, % | 1.77 | 0.91 | 0.15 | 1.92 | 0.48 | |
| Liver disease, % | 0.28 | 0.48 | 0.23 | 0.00 | 0.28 | |
| C. diff, % | 0.74 | 0.10 | 0.01 | 0.64 | 0.11 | |
| Severe liver disease, % | 0.19 | 0.43 | 0.00 | 0.00 | 0.10 | |
| MRSA, % | 0.28 | 0.05 | 0.03 | 1.28 | 0.07 | |
| HIV, % | 0.00 | 0.00 | 0.03 | 0.00 | 0.02 |
A summary of the spells is provided in Table 1. This table separates each cluster and the overall dataset (referred to as the population). From this table, helpful insights can be gained about the segments identified by the clustering. For instance, the needs of the spells in each cluster can be summarised succinctly:
-
•
Cluster 0 represents those spells with relatively low clinical complexity but high resource requirements. The mean spell cost is almost four times the population average, and the shortest spell is almost two weeks long. Moreover, the median number of COPD-related admissions in the last year is elevated, indicating that patients presenting in this way require more interactions with the system.
-
•
Cluster 1, the second-largest segment, represents the spells with complex clinical profiles despite lower resource requirements. Specifically, the spells in this cluster have the highest median CCI and number of LTCs, and the highest condition prevalence across all clusters but the second-lowest length of stay and spell costs.
-
•
Cluster 2 represents the majority of spells and those where resource requirements and clinical complexities are minimal; these spells have the shortest lengths, and the patients present with fewer diagnoses and a lower median CCI than any other cluster. In addition to this, the spells in Cluster 2 have the highest intervention prevalence. However, they have the lowest condition prevalence across all clusters.
-
•
Cluster 3 represents the smallest section of the population but perhaps the most critical: spells with high complexity and high resource needs. The patients within Cluster 3 are the oldest in the population and are some of the most frequently returning despite having the lowest intervention rates. The lengths of stay vary between seven and 32 weeks, and the mean spell cost is almost eight times the population average. This cluster also has the second-highest median CCI, and the highest median number of concurrent diagnoses.
The attributes listed in Table 1 can be studied beyond summaries such as these, however. Figures 1 through 5 show the distributions for some clinical characteristics for each cluster. Each of these figures also shows the distribution of the same attributes when splitting the population by intervention. While this classical approach — of splitting a population based on a condition or treatment — can provide some insight into how the different interventions are used, it has been included to highlight the value added by segmenting the population via data without such a prescriptive framework.
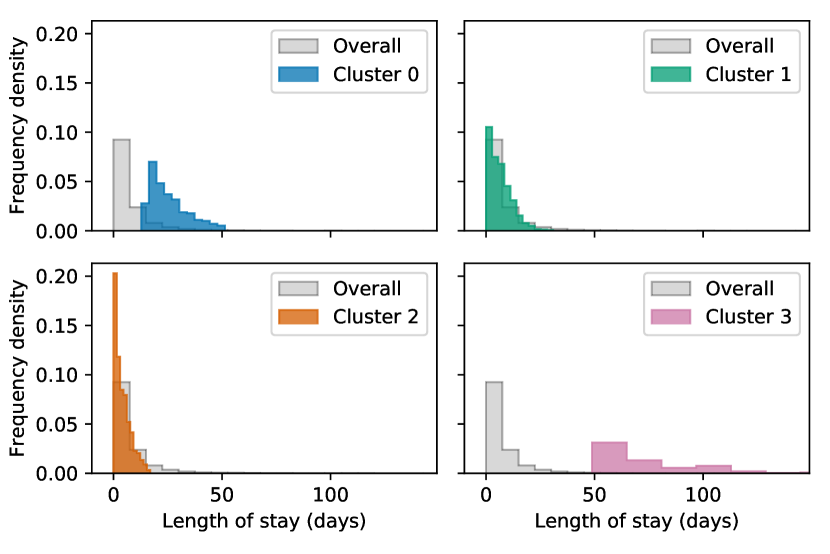

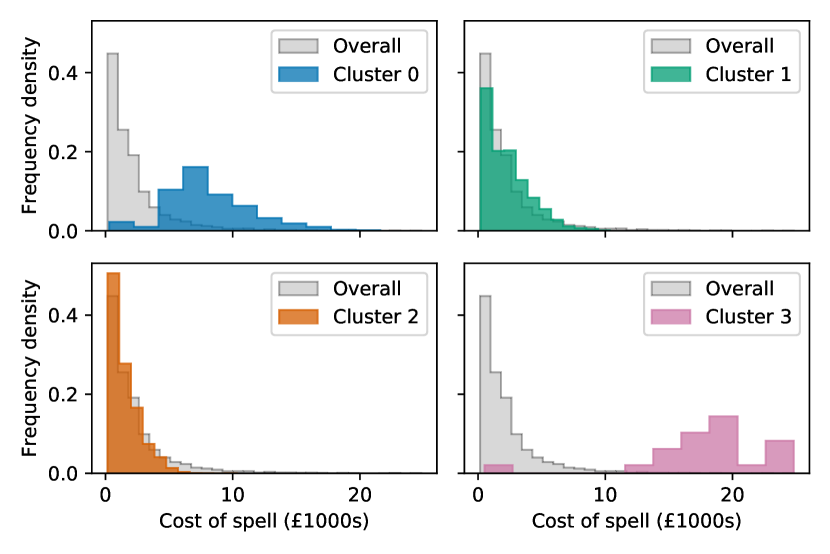
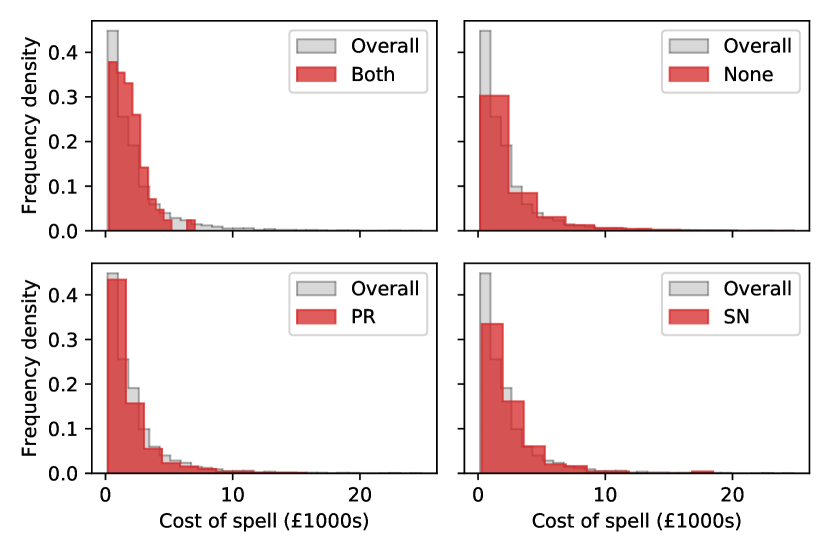
Figure 1 shows the length of stay distributions as histograms. Figure 1(a) demonstrates the different bed resource requirements well for each cluster — better than Table 1 might — in that the difference between the clusters is not just a matter of varying means and ranges, but entirely different shapes to their respective distributions. Indeed, they are all positively skewed, but there is no real consistency beyond that. When comparing this to Figure 1(b), there is undoubtedly some variety, but the overall shapes of the distributions are generally similar. The exception is the spells with no COPD intervention where binning could not improve the visualisation due to the widespread distribution of their lengths of stay.
The same conclusions can be drawn about spell costs from Figure 2; there are distinct patterns between the clusters in terms of their costs, and they align with the patterns seen in Figure 1. Such patterns are expected given that length of stay is a driving force of healthcare costs. Equally, there does not appear to be any immediately discernible difference in the distribution of costs when splitting by intervention.
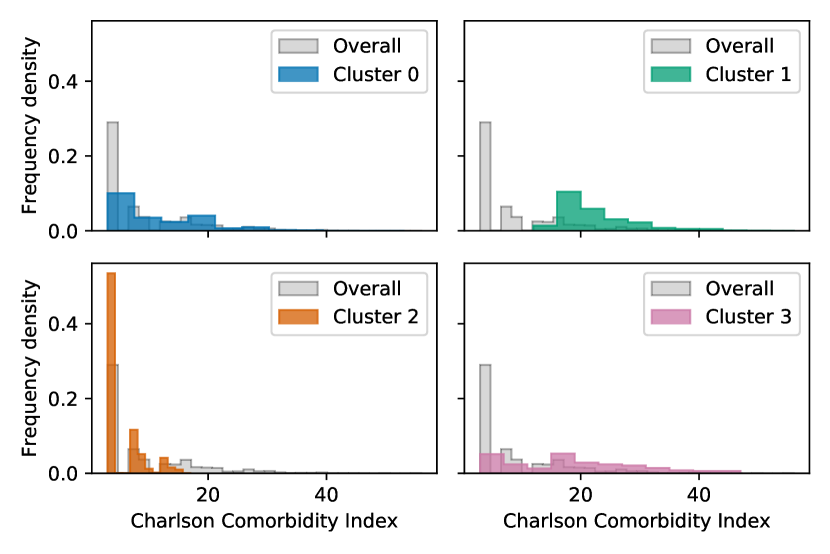
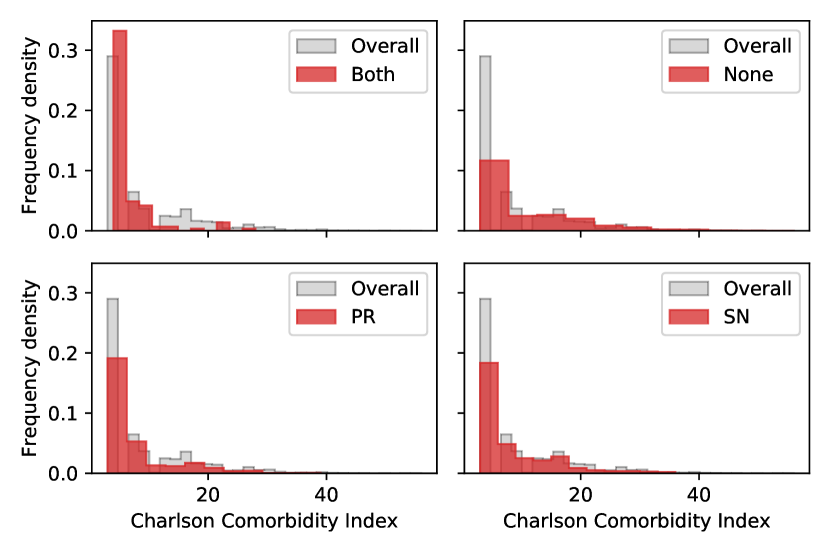
Similarly to the previous figures, Figure 3 shows that clustering has revealed distinct patterns in the CCI of the spells within each cluster, whereas splitting by intervention does not. All clusters other than Cluster 2 show clear, heavy tails, and in the cases of Clusters 1 and 3, the body of the data exists far from the origin as indicated in Table 1. In contrast, the plots in Figure 3(b) all display similar, highly skewed distributions regardless of intervention.
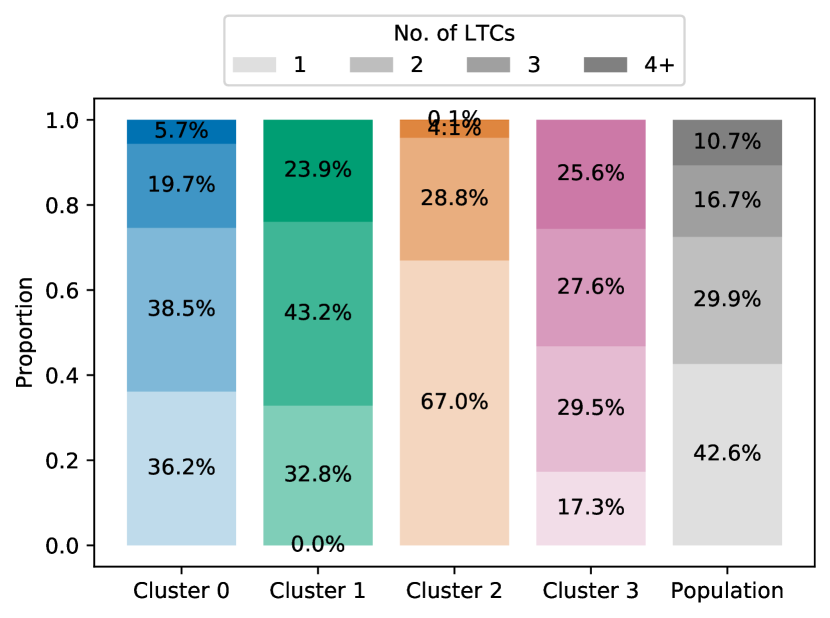
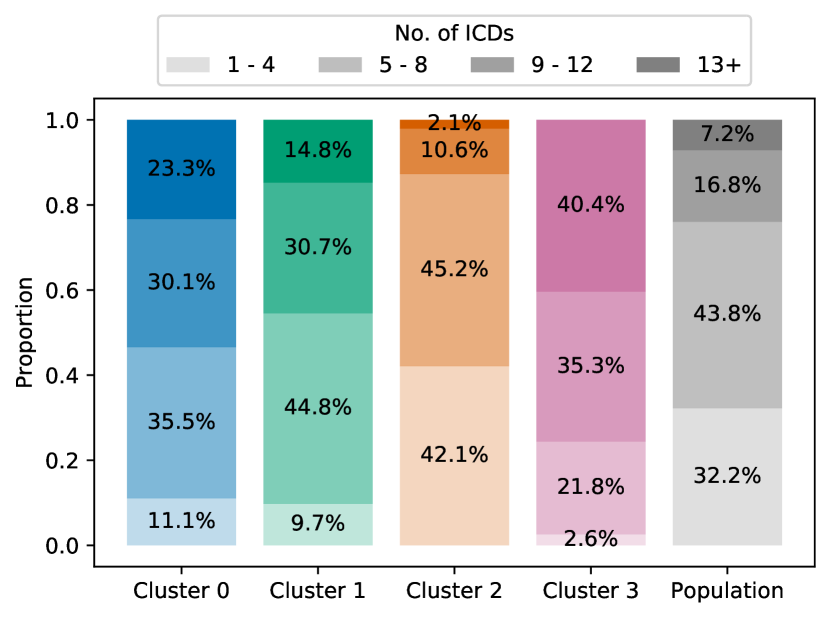
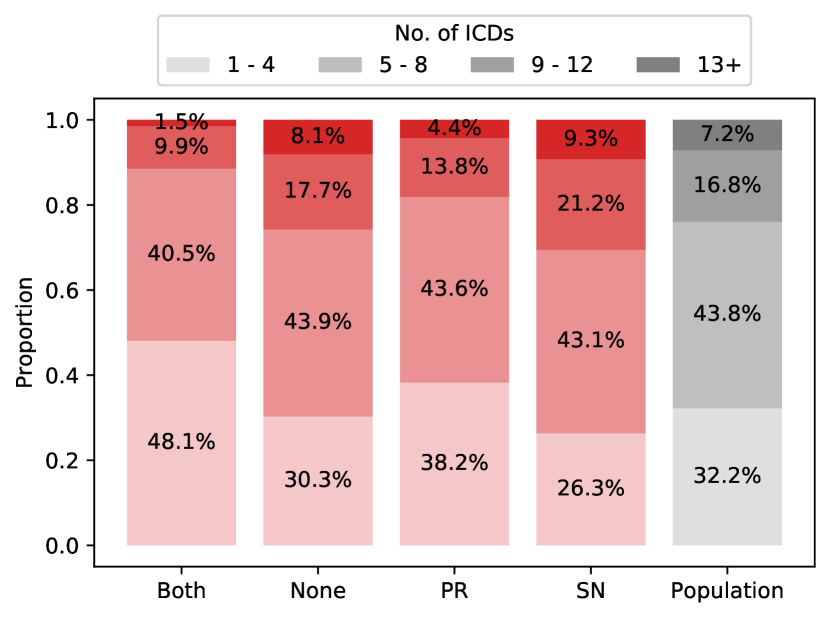
Figures 4 and 5 show the proportions of each grouping presenting levels of concurrent LTCs and ICDs, respectively. By exposing the distribution of these attributes, some notion of the clinical complexity for each cluster can be captured better than with Table 1 alone. In Figure 4(a), for instance, there are distinct LTC count profiles among the clusters: Cluster 0 is typical of the population; Cluster 1 shows that no patient presented COPD solely as an LTC in their spells, and more than half presented at least three; Cluster 2 is similar in form to the population but is severely biased towards patients presenting COPD as the only LTC; Cluster 3 is the most uniformly spread among the four bins despite the increased length of stay and CCI suggesting a diverse array of patients in terms of their long term medical needs.
Figure 5(a) largely mirrors these cluster profiles with the number of concurrent ICDs. Some points of interest, however, are that Cluster 1 has a relatively low-leaning distribution of ICDs that does not marry up with the high rates of LTCs, and that the vast majority of spells in Cluster 3 present with at least nine ICDs suggesting a likely wide range of conditions and comorbidities beyond the LTCs used to calculate CCI.
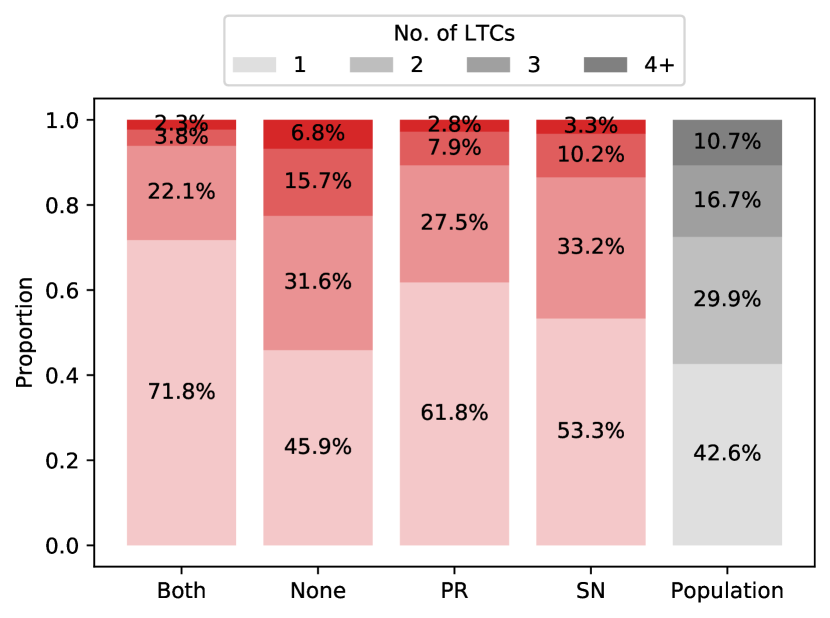
However, little can be drawn from the intervention counterparts to these figures (i.e. Figures 4(b) and 5(b)), regarding the corresponding spells. One thing of note is that patients receiving both interventions for their COPD (or either, in fact) have disproportionately fewer LTCs and concurrent ICDs when compared to the population. Aside from this, the profiles of each intervention are similar to one another.
As discussed earlier, the purpose of this work is to construct a queuing model for the data described here. Insights have already been gained into the needs of the segments that have been identified in this section. However, to glean further insights, some parameters of the queuing model must be recovered from the data.
2 Constructing the queuing model
The scarcity of data limits the options for the queuing model. However, there is a precedent for simplifying healthcare systems to a single node with parallel servers that emulate resource availability. [36] and [44] provide examples of how this approach, when paired with discrete event simulation, can expose the resource needs of a system beyond deterministic queuing theory models. In particular, [44] shows how a single node, multiple server queue can be used to accurately predict bed capacity and length of stay distributions in a critical care unit using administrative data.
In order to follow in the suit of recent literature, this work employs a single node using the queue to model a hypothetical ward of patients presenting COPD. In addition to this, the grouping found in Section 1.2 provides a set of patient classes in the queue. Under this model, the following assumptions are made:
-
1.
Inter-arrival and service times of patients are each exponentially distributed with some mean. This distribution is used despite the system time distributions shown in Figure 1(a) in order to simplify the model parameterisation.
-
2.
There are servers available to arriving patients at the node representing the overall resource availability, including bed capacity and hospital staff.
-
3.
There is no queue or system capacity. In [44], a queue capacity of zero is set under the assumption that any surplus arrivals would be sent to another suitable ward or unit. As this hypothetical ward represents COPD patients potentially throughout a hospital, this assumption is not held.
-
4.
Without the availability of expert clinical knowledge, a first-in-first-out service policy is employed in place of some patient priority framework.
Each group of patients has its arrival distribution, the parameter of which is the reciprocal of the mean inter-arrival times for that group. This parameter is denoted by for each cluster .
Like arrivals, each group of patients has its service time distribution. Without full details of the process order or idle periods during a spell, some assumption must be made about the actual ‘service’ time of a patient in the hospital. It is assumed here that the mean service time of a group of patients may be approximated via their mean length of stay, i.e. the mean time spent in the system. For simplicity, this work assumes that for each cluster, , the mean service time of that cluster, , is directly proportional to the mean total system time of that cluster, , such that:
| (1) |
where is some parameter to be determined for each group.
One of the few ground truths available in the provided data is the distribution of the total length of stay. Given that the length of stay and resource availability are connected, the approach here will be to simulate the length of stay distribution for a range of values and , to find the parameters that best match the observed data. Figure 6 provides a diagrammatic depiction of the process described in this section.
Several methods are available for the statistical comparison of two or more distributions, such as the Kolmogorov-Smirnov test, a variety of discrepancy approaches such as summed mean-squared error, and -divergences. A popular choice among the last group (which may be considered distance-like) is the Kullback-Leibler divergence which measures relative information entropy from one probability distribution to another [19]. A key issue with many of these methods is that they lack interpretability, something which is paramount when conveying information to stakeholders, not just from explaining how something works but also how its results may be explained.
As such, a reasonable candidate is the (first) Wasserstein metric, also known as the ‘earth mover’ or ‘digger’ distance [37]. The Wasserstein metric satisfies the conditions of a formal mathematical metric (like the typical Euclidean distance), and its values take the units of the distributions under comparison (in this case: days). These characteristics can aid understanding and explanation. In simple terms, the distance measures the approximate ‘minimal work’ required to move between two probability distributions where ‘work’ can be loosely defined as the product of how much of the distribution’s mass moves and the distance by which it must be moved. More formally, the Wasserstein distance between two probability distributions and is defined as:
| (2) |
where and are the cumulative density functions of and , respectively. A proof of (2) is presented in [30]. The parameter set with the smallest maximum distance between any cluster’s simulated system time distribution and the overall observed length of stay distribution is then taken to be the most appropriate. To be specific, let denote the system time distribution of all of the observed data and let denote the system time distribution for cluster obtained from a simulation with servers and . Then the optimal parameter set is given by:
| (3) |
The parameter sweep included values of each from to with a granularity of and values of from to at steps of five. These choices were informed by the assumptions of the model and formative analysis to reduce the parameter space given the computational resources required to conduct the simulations. Each parameter set was repeated 50 times with each simulation running for four years of virtual time. The warm-up and cool-down periods were taken to be approximately one year each leaving two years of simulated data from each repetition.
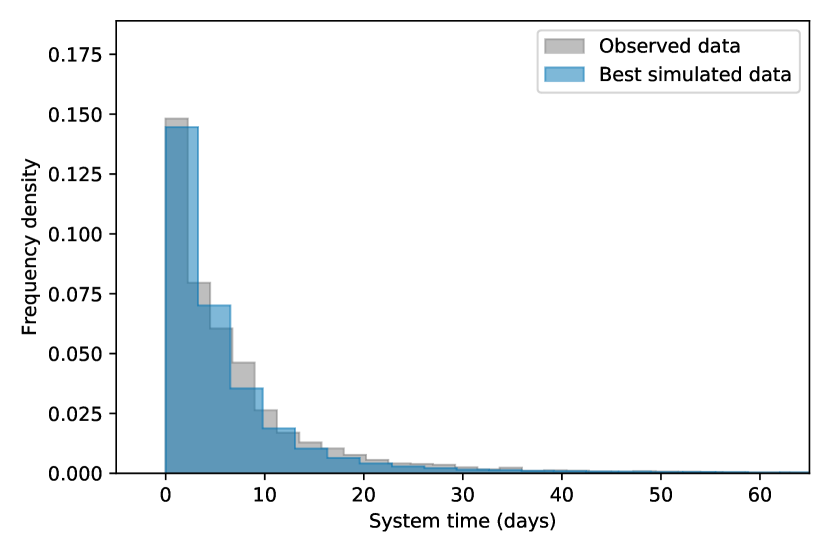
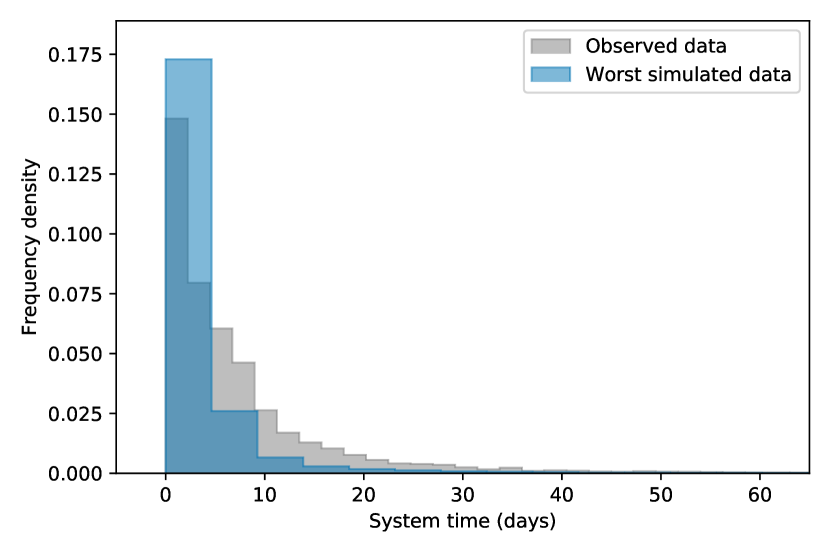
The results of this parameter sweep can be summarised in Figure 7. Each plot shows a comparison of the observed lengths of stay across all groups and the newly simulated data with the best and worst parameter sets, respectively. In the best case, a very close fit has been found. Meanwhile, Figure 7(b) highlights the importance of good parameter estimation under this model since the likelihood of short-stay patient arrivals has been inflated disproportionately against the tail of the distribution. Table 2 reinforces these results numerically, showing a precise fit by the best parameters across the board.
| Model parameter and result | LOS statistic | ||||||||||||
|---|---|---|---|---|---|---|---|---|---|---|---|---|---|
| Max. distance | Mean | Std. | Min. | 25% | Med. | 75% | Max. | ||||||
| Observed | NaN | NaN | NaN | NaN | NaN | 0.00 | 7.70 | 11.86 | -0.02 | 1.49 | 4.20 | 8.93 | 224.93 |
| Best simulated | 0.95 | 1.0 | 1.0 | 0.5 | 40.0 | 1.28 | 7.00 | 12.09 | 0.00 | 1.44 | 3.57 | 7.65 | 326.46 |
| Worst simulated | 0.50 | 0.5 | 0.5 | 1.0 | 40.0 | 4.25 | 4.36 | 13.40 | 0.00 | 0.72 | 1.78 | 3.84 | 463.01 |
In this section, the previously identified clustering enriched the overall queuing model and was used to recover the parameters for several classes within that. Now, using this model, the next section details an investigation into the underlying system by adjusting the parameters of the queue with the clustering.
3 Adjusting the queuing model
This section comprises several what-if scenarios — a classic component of healthcare operational research — under the novel parameterisation of the queue established in Section 2. The outcomes of interest in this work are server (resource) utilisation and system times. These metrics capture the driving forces of cost and the state of the system. Specifically, the objective of these experiments is to address the following questions:
-
•
How would the system be affected by a change in overall patient arrivals?
-
•
How is the system affected by a change in resource availability (i.e. a change in )?
-
•
How is the system affected by patients moving between clusters?
Given the nature of the observed data, the queuing model parameterisation and its assumptions, the effects on the chosen metrics in each scenario are in relative terms with respect to the base case. The base case being those results generated from the best parameter set recorded in Table 2. In particular, the data from each scenario is scaled by the corresponding median value in the base case, meaning that a metric having a value of 1 is ‘normal’.
As mentioned in Section 1, the source code used throughout this work is available has been archived online [40]. Also, the datasets generated from the simulations in this section, and the parameter sweep, have been archived online [41].
3.1 Changes to overall patient arrivals
Changes in overall patient arrivals to a queue reflect real-world scenarios where some stimulus is improving (or worsening) the condition of the patient population. Examples of stimuli could include an ageing population or independent life events that lead to a change in deprivation, such as an accident or job loss. Within this model, overall patient arrivals are altered using a scaling factor denoted by . This scaling factor is applied to the model by multiplying each cluster’s arrival rate by . That is, for cluster , its new arrival rate, , is given by:
| (4) |


Figure 8 shows the effects of changing patient arrivals on (8(a)) relative system times and (8(b)) relative server utilisation for values of from 0.5 to 2.0 at a precision of . Specifically, each plot in the figure (and the subsequent figures in this section) shows the median and interquartile range (IQR) of each relative attribute. These metrics provide an insight into the experience of the average user (or server) in the system. Furthermore, they reveal the stability or variation of the body of users (servers).
What is evident from these plots is that things are happening as one might expect: as arrivals increase, the strain on the system increases. However, it should be noted that it also appears that the model has some amount of slack relative to the base case. Looking at Figure 8(a), for instance, the relative system times (i.e. the relative length of stay for patients) remains unchanged up to , or an approximate 20% increase in arrivals of COPD patients. Beyond that, relative system times rise to an untenable point where the median time becomes orders of magnitude above the norm.
However, Figure 8(b) shows that the situation for the system’s resources reaches its worst-case near to the start of that spike in relative system times (at ). That is, the median server utilisation reaches a maximum (this corresponds to constant utilisation) at this point, and the variation in server utilisation disappears entirely.
3.2 Changes to resource availability
As is discussed in Section 2, the resource availability of the system is captured by the number of parallel servers, . Therefore, to modify the overall resource availability, only the number of servers needs to be changed. This kind of sensitivity analysis is usually done to determine the opportunity cost of adding service capacity to a system, e.g. would an increase of servers increase efficiency without exceeding a budget?
To reiterate the beginning of this section: all suitable parameters are given in relative terms, including the number of servers here. By doing this, the changes in resource availability are more easily seen, and do away with any concerns as to what a particular number of servers precisely reflects in the real world.
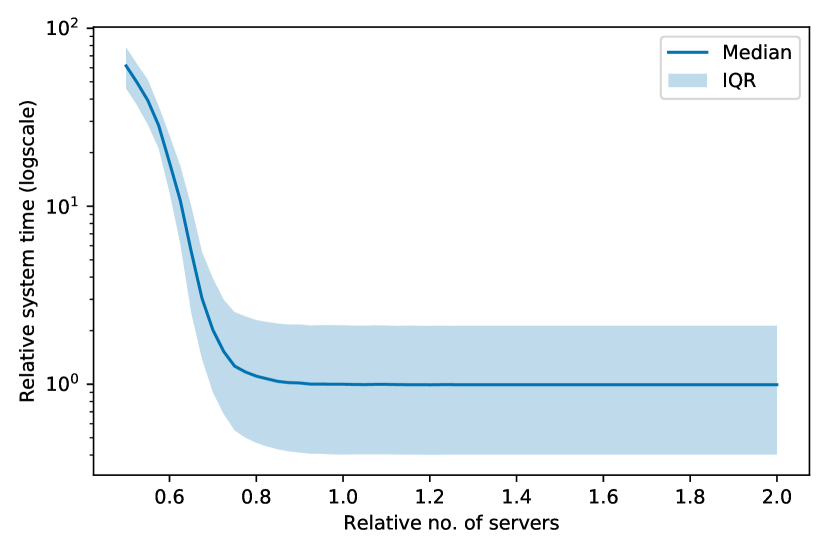
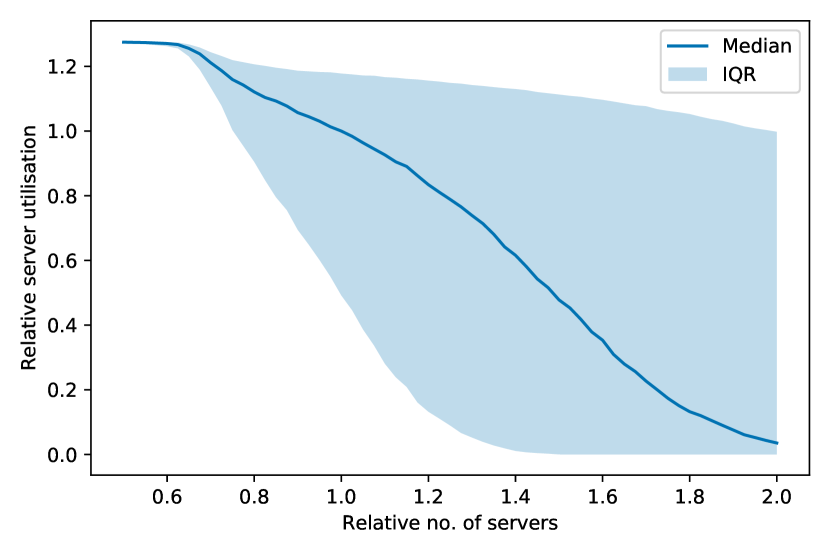
Figure 9 shows how the relative resource availability affects relative system times and server utilisation. In this scenario, the relative number of servers took values from 0.5 to 2.0 at steps of — this is equivalent to a step size of one in the actual number of servers. Overall, these figures fortify the claim from the previous scenario that there is some room to manoeuvre so that the system runs ‘as normal’ but pressing on those boundaries results in massive changes to both resource requirements and system times.
In Figure 9(a) this amounts to a maximum of 20% slack in resources before relative system times are affected; further reductions quickly result in a potentially tenfold increase in the median system time, and up to 50 times once resource availability falls by 50%. Moreover, the variation in the body of the relative times (i.e. the IQR) decreases as resource availability decreases. The reality of this is that patients arriving at a hospital are forced to consume more significant amounts of resources (by merely being in a hospital) regardless of their condition, putting added strains on the system.
Meanwhile, it appears that there is no tangible change in relative system times given an increase in the number of servers. This indicates that the model carries sufficient resources to cater to the population under normal circumstancesand that adding service capacity will not necessarily improve system times.
Again, Figure 9(b) shows that there is a substantial change in the variation in the relative utilisation of the servers. In this case, the variation dissipates as resource levels fall and increase as they increase. While the relationship between real hospital resources and the number of servers is not exact, having variation in server utilisation would suggest that parts of the system may be configured or partitioned away in the case of some significant public health event (such as a global pandemic) without overloading the system.
3.3 Moving arrivals between clusters
This scenario is perhaps the most relevant to actionable public health research of those presented here. The clusters identified in this work could be characterised by their clinical complexities and resource requirements, as done in Section 1.2. Therefore, being able to model the movement of some proportion of patient spells from one cluster to another will reveal how those complexities and requirements affect the system itself. The reality is then that if some public health policy could be implemented to enact that movement informed by a model such as this, then real change would be seen in the real system.
In order to model the effects of spells moving between two clusters, the assumption is that services remain the same (and so does each cluster’s ), but their arrival rates are altered according to some transfer proportion. Consider two clusters indexed at , and their respective arrival rates, , and let denote the proportion of arrivals to be moved from cluster to cluster . Then the new arrival rates for each cluster, denoted by respectively, are:
| (5) |
By moving patient arrivals between clusters in this way, the overall arrivals are left the same since the sum of the arrival rates is the same. Hence, the (relative) effect on server utilisation and system time can be measured independently.
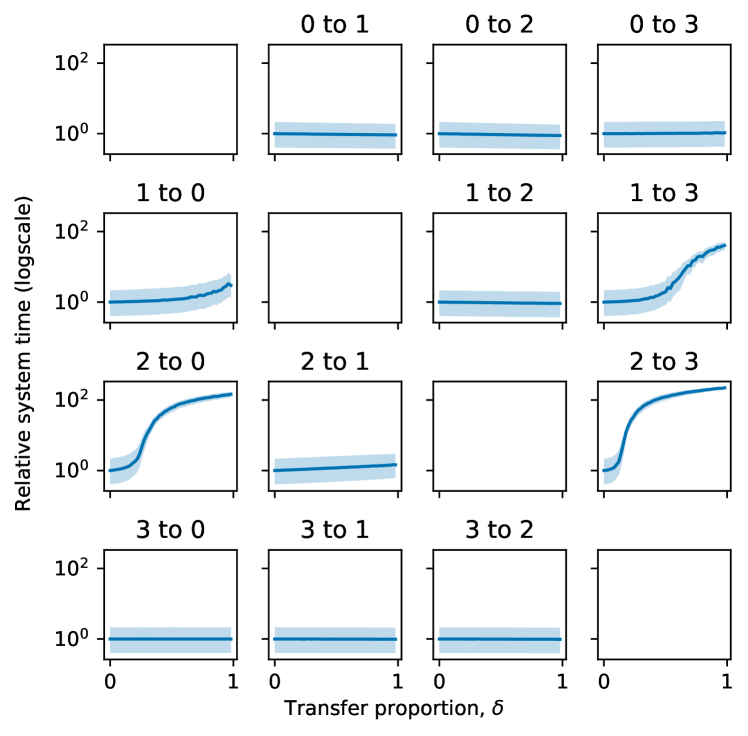
Figures 10 and 11 show the effect of moving patient arrivals between clusters on relative system time and relative server utilisation, respectively. In each figure, the median and IQR for the corresponding attribute is shown, as in the previous scenarios. Each scenario was simulated using values of from 0.0 to 1.0 at steps of .
Considering Figure 10, it is clear that there are some cases where reducing particular types of spells (by making them like another type of spell) does not affect overall system times. Namely, moving the high resource requirement spells that describe Cluster 0 and Cluster 3 to any other cluster. These clusters make up only 10% of all arrivals, and this figure shows that in terms of system times, the model can handle them without concern under normal conditions. The concern comes when either of the other clusters moves to Cluster 0 or Cluster 3. Even as few as one in five of the low complexity, low resource needs arrivals in Cluster 2 moving to either cluster results in large jumps in the median system time for all arrivals, and soon after, as, in the previous scenario, any variation in the system times disappears indicating an overborne system.
With relative server utilisation, the story is much the same. The ordinary levels of high complexity, high resource arrivals from Cluster 3 are absorbed by the system and moving these arrivals to another cluster bears no effect on resource consumption levels. Likewise, either of the low-resource needs clusters moving even slightly toward high resource requirements completely overruns the system’s resources. However, the relative utilisation levels of the system resources can be reduced by moving arrivals from Cluster 0 to either Cluster 1 or Cluster 2, i.e. by reducing the overall resource requirements of such spells.
In essence, this entire analysis offers two messages: that there are several ways in which the system can get worse and even overwhelmed but, more importantly, that any meaningful impact on the system must come from a stimulus outside of the system that results in more healthy patients arriving at the hospital. This conclusion is non-trivial; the first two scenarios in this analysis show that there are no quick solutions to reduce the effect of COPD patients on hospital capacity or length of stay. The only effective intervention is found through inter-cluster transfers.

4 Conclusion
This work presents a novel approach to investigating a healthcare population that encompasses the topics of segmentation analysis, queuing models, and the recovery of queuing parameters from incomplete data. This investigation is done despite characteristic limitations in operational research concerning the availability of fine-grained data, and this work only uses administrative hospital spell data from patients presenting COPD from the Cwm Taf Morgannwg UHB.
By considering a variety of attributes present in the data, and engineering some, a useful clustering of the spell population is identified that successfully feeds into a multi-class, queue to model a hypothetical COPD ward. With this model, several insights are gained by investigating purposeful changes in the parameters of the model that have the potential to inform actual public health policy.
In particular, since neither the resource capacity of the system nor the clinical processes of the spells are evident in the data, service times and resource levels are not available. However, the length of stay is. Using what is available, this work assumes that mean service times can be parameterised using mean lengths of stay. By using the Wasserstein distance to compare the distribution of the simulated lengths of stay data with the observed data, a best performing parameter set is found via a parameter sweep.
This parameterisation ultimately recovers a surrogate for service times for each cluster, and a universal number of servers to emulate resource availability. The parameterisation itself offers its strengths by being simple and effective. Despite its simplicity, a good fit to the observed data is found, and — as is evident from the closing section of this work — substantial and useful insights can be gained into the needs of the population under study.
This mode of analysis, in effect, considers all types of patient arrivals and how they each impact the system in terms of resource capacity and length of stay. By investigating scenarios into changes in both overall patient arrivals and resource capacity, it is clear that there is no quick solution to be employed from within the hospital to improve COPD patient spells. The only effective, non-trivial intervention is to improve the overall health of the patients arriving at the hospital, as is shown by moving patient arrivals between clusters. In reality, this would correspond to an external, preventative policy that improves the overall health of COPD patients.
Acknowledgements
The authors wish to thank the Cwm Taf Morgannwg University Health Board for their funding and support of the PhD of which this work has formed a part.
References
- [1] I. V. Arnolds and D. Gartner. Improving hospital layout planning through clinical pathway mining. Annals of Operations Research, 263:453–477, 2018. doi:10.1007/s10479-017-2485-4.
- [2] A. Asanjarani, Y. Nazarathy, and P. Pollett. Parameter and state estimation in queues and related stochastic models: A bibliography, 2017 (accessed ). URL: https://people.smp.uq.edu.au/PhilipPollett/papers/Qest/QEstAnnBib.pdf.
- [3] P. Bhattacharjee and P. K. Ray. Patient flow modelling and performance analysis of healthcare delivery processes in hospitals: A review and reflections. Computers & Industrial Engineering, 78:299–312, 2014. doi:10.1016/j.cie.2014.04.016.
- [4] S. C. Brailsford, T. B. Bolt, G. Bucci, T. M. Chaussalet, N. A. Connell, P. R. Harper, J. H. Klein, M. Pitt, and M. Taylor. Overcoming the barriers: A qualitative study of simulation adoption in the NHS. Journal of the Operational Research Society, 64(2):157–168, 2013.
- [5] P. F. Collins, R. J. Stratton, R. J. Kurukulaaratchy, and M. Elia. Influence of deprivation on health care use, health care costs, and mortality in COPD. International Journal of Chronic Obstructive Pulmonary Disease, 13:1289–1296, 2018. doi:10.2147/COPD.S157594.
- [6] P. Delias, M. Doumpos, E. Grigoroudis, P. Manolitzas, and N. Matsatsinis. Supporting healthcare management decisions via robust clustering of event logs. Knowledge-Based Systems, 84:203–213, 2015. doi:10.1016/j.knosys.2015.04.012.
- [7] Y. Djabali, B. Rabta, and D. Aissani. Approximating service-time distributions by phase-type distributions in single-server queues: A strong stability approach. International Journal of Mathematics in Operational Research, 12:507–531, 2018. doi:10.1504/IJMOR.2018.10005095.
- [8] A. K. Erlang. Solution of some problems in the theory of probabilities of significance in automatic telephone exchanges. Post Office Electrical Engineer’s Journal, 10:189–197, 1917.
- [9] A. K. Erlang. Telephone waiting times. Matematisk Tidsskrift, B, 31:25, 1920.
- [10] B. S. Everitt, S. Landau, M. Leese, and D. Stahl. Cluster analysis. John Wiley & Sons, 2011.
- [11] B. G. Fitzpatrick. Issues in reproducible simulation research. Bulletin of Mathematical Biology, 81:1–6, 2019. doi:10.1007/s11538-018-0496-1.
- [12] A. Goldenshluger. Nonparametric estimation of the service time distribution in the M/G/ queue. Advances in Applied Probability, 48(4):1117–1138, 2016. doi:10.1017/apr.2016.67.
- [13] J. A. Hagenaars. Applied Latent Class Analysis. Cambridge University Press, 2002. doi:10.1017/CBO9780511499531.
- [14] P. R. Harper and D. Winslett. Classification trees: A possible method for maternity risk grouping. European Journal of Operational Research, 169:146–156, 2006. doi:10.1016/j.ejor.2004.05.014.
- [15] S. Houben-Wilke, F. J. J. Triest, F. M. Franssen, D. J. Janssen, E. F. Wouters, and L. E. Vanfleteren. Revealing methodological challenges in chronic obstructive pulmonary disease studies assessing comorbidities: A narrative review. Chronic Obstructive Pulmonary Diseases: Journal of the COPD Foundation, 6(2):166–177, 2019. doi:10.15326/jcopdf.6.2.2018.0145.
- [16] Z. Huang. Extensions to the -means algorithm for clustering large data sets with categorical values. Data Mining and Knowledge Discovery, 2(3):283–304, 1998. doi:10.1023/A:1009769707641.
- [17] P. Ivie and D. Thain. Reproducibility in scientific computing. ACM Computing Surveys, 51(3), 2018. doi:10.1145/3186266.
- [18] A. Komashie, A. Mousavi, P. J. Clarkson, and T. Young. An integrated model of patient and staff satisfaction using queuing theory. IEEE Journal of Translational Engineering in Health and Medicine, 3:1–10, 2015. doi:10.1109/JTEHM.2015.2400436.
- [19] S. Kullback and R. A. Leibler. On information and sufficiency. Annals of Mathematical Statistics, 22(1):79–86, 1951. doi:10.1214/aoms/1177729694.
- [20] J. P. Kuwornu, L. M. Lix, and S. Shooshtari. Multimorbidity disease clusters in Aboriginal and non-Aboriginal Caucasian populations in Canada. Chronic Diseases and Injuries in Canada, 34(4):218–225, 2014.
- [21] F. B. Larsen, M. H. Pedersen, K. Friis, C. Glümer, and M. Lasgaard. A latent class analysis of multimorbidity and the relationship to socio-demographic factors and health-related quality of life. a national population-based study of 162,283 Danish adults. PLoS One, 12(1), 2017. doi:10.1371/journal.pone.0169426.
- [22] P. F. Lazarsfeld and N. W. Henry. Latent structure analysis. Houghton Mifflin Co., 1968.
- [23] J. O. McClain. Bed planning using queuing theory models of hospital occupancy: A sensitivity analysis. Inquiry, 13(2):167–176, 1976.
- [24] A. Mohammadi and M. R. Salehi-Rad. Bayesian inference and prediction in an with optional second service. Communications in Statistics - Simulation and Computation, 41(3):419–435, 2012. doi:10.1080/03610918.2011.588358.
- [25] NHS Data Model and Dictionary. NHS Business Definitions: Hospital Provider Spell, 2020 (accessed ). URL: https://www.datadictionary.nhs.uk/data_dictionary/nhs_business_definitions/h/hospital_provider_spell_de.asp.
- [26] S. Olafsson, X. Li, and S. Wu. Operations research and data mining. European Journal of Operational Research, 87(3):1429–1448, 2008. doi:https://doi.org/10.1016/j.ejor.2006.09.023.
- [27] G. I. Palmer, V. A. Knight, P. R. Harper, and A. L. Hawa. Ciw: An open-source discrete event simulation library. Journal of Simulation, 13(1):68–82, 2019. doi:10.1080/17477778.2018.1473909.
- [28] R. K. Palvannan and K. L. Teow. Queueing for healthcare. Journal of Medical Systems, 36:541–547, 2012. doi:10.1007/s10916-010-9499-7.
- [29] L. R. Pinto, F. C. C. de Campos, I. H. O. Perpétuo, and Y. C. N. M. B. Ribeiro. Analysis of hospital bed capacity via queuing theory and simulation. In Proceedings of the Winter Simulation Conference 2014, pages 1281–1292, 2014.
- [30] A. Ramdas, N. G. Trillos, and M. Cuturi. On Wasserstein two-sample testing and related families of nonparametric tests. Entropy, 19(2):47, 2017. doi:10.3390/e19020047.
- [31] Á. Rebuge and D. R. Ferreira. Business process analysis in healthcare environments: A methodology based on process mining. Information Systems, 37(2):99–116, 2012. doi:10.1016/j.is.2011.01.003.
- [32] V. Satopaa, J. Albrecht, D. Irwin, and B. Raghavan. Finding a ‘kneedle’ in a haystack: Detecting knee points in system behavior. In Proceedings of the 2011 31st International Conference on Distributed Computing Systems Workshops, pages 166–171, 2011. doi:10.1109/ICDCSW.2011.20.
- [33] E. Sexton and D. Bedford. GP supply, deprivation and emergency admission to hospital for COPD and diabetes complications in counties across Ireland: An exploratory analysis. Irish Journal of Medical Science, 185(2):453–461, 2016. doi:10.1007/s11845-015-1359-5.
- [34] T. Simon-Tuval, S. M. Scharf, N. Maimon, B. J. Bernhard-Scharf, H. Reuveni, and A. Tarasiuk. Determinants of elevated healthcare utilization in patients with COPD. Respiratory Research, 12(7), 2011. doi:10.1186/1465-9921-12-7.
- [35] M. C. Steiner, D. Lowe, K. Beckford, J. Blakey, C. E. Bolton, S. Elkin, W. D. C. Man, C. M. Roberts, L. Sewell, P. Walker, and S. J. Singh. Socioeconomic deprivation and the outcome of pulmonary rehabilitation in England and Wales. Thorax, 72(6):530–537, 2017. doi:10.1136/thoraxjnl-2016-209376.
- [36] K. Steins and S. Walther. A generic simulation model for planning critical care resource requirements. Anaesthesia, 68(11):1148–1155, 2013.
- [37] L. N. Vaserstein. Markov processes over denumerable products of spaces describing large systems of automata. Problemy Peredačhi Informatsii, 5(3):64–72, 1969.
- [38] S. I. Vuik, E. K. Mayer, and A. Darzi. Patient segmentation analysis offers significant benefits for integrated care and support. Health Affairs, 35(5):769–775, 2016. doi:10.1377/hlthaff.2015.1311.
- [39] S. I. Vuik, E. K. Mayer, and A. Darzi. A quantitative evidence base for population health: Applying utilization-based cluster analysis to segment a patient population. Population Health Metrics, 14, 2016. doi:10.1186/s12963-016-0115-z.
- [40] H. Wilde. GitHub repository: daffidwilde/copd-paper, 2020. doi:10.5281/zenodo.3937548.
- [41] H. Wilde, V. Knight, and J. Gillard. Experiment data in support of ‘Recovering hospital service times via the Wasserstein distance for segmentation analysis: a study in COPD patients in the Cwm Taf region’, 2020. doi:10.5281/zenodo.3924716.
- [42] H. Wilde, V. Knight, and J. Gillard. A novel initialisation based on hospital-resident assignment for the k-modes algorithm, 2020. arXiv:2002.02701.
- [43] H. Wilde, V. Knight, and J. Gillard. Synthetic LOS and interarrival time data for COPD patients in the Cwm Taf region, 2020. doi:10.5281/zenodo.3908167.
- [44] J. Williams, S. Dumont, J. Parry-Jones, I. Komenda, J. Griffiths, and V. Knight. Mathematical modelling of patient flows to predict critical care capacity required following the merger of two district general hospitals into one. Anaesthesia, 70(1):32–40, 2015. doi:10.1111/anae.12839.
- [45] X. Wu and V. Kumar. The top ten algorithms in data mining. CRC press, 2009.
- [46] S. Yan, Y. H. Kwan, C. S. Tan, J. Thumboo, and L. L. Low. A systematic review of the clinical application of data-driven population segmentation analysis. BMC Medical Research Methodology, 18(121), 2018. doi:10.1186/s12874-018-0584-9.
- [47] S. Yan, B. J. J. Seng, Y. H. Kwan, C. S. Tan, J. H. M. Quah, J. Thumboo, and L. L. Low. Identifying heterogeneous health profiles of primary care utilizers and their differential healthcare utilization and mortality – a retrospective cohort study. BMC Family Practice, 20(54), 2019. doi:10.1186/s12875-019-0939-2.
- [48] G. B. Yom-Tov and A. Mandelbaum. Erlang-R: A time-varying queue with reentrant customers, in support of healthcare staffing. Manufacturing & Service Operations Management, 16(2):283–299, 2014. doi:10.1287/msom.2013.0474.
- [49] S. Yoon, H. Goh, Y. H. Kwan, J. Thumboo, and L. L. Low. Identifying optimal indicators and purposes of population segmentation through engagement of key stakeholders: A qualitative study. Health Res Policy Syst., 18(1):26, 2020. doi:10.1186/s12961-019-0519-x.