An early warning system for electromagnetic follow-up of gravitational-wave events
Abstract
Binary neutron stars (BNSs) will spend – 15 minutes in the band of Advanced LIGO and Virgo detectors at design sensitivity. Matched-filtering of gravitational-wave (GW) data could in principle accumulate enough signal-to-noise ratio (SNR) to identify a forthcoming event tens of seconds before the companions collide and merge. Here we report on the design and testing of an early warning gravitational-wave detection pipeline. Early warning alerts can be produced for sources that are at low enough redshift so that a large enough SNR accumulates before merger. We find that about 7% (respectively, 49%) of the total detectable BNS mergers will be detected () before the merger. About 2% of the total detectable BNS mergers will be detected before merger and localized to within (90% credible interval). Coordinated observing by several wide-field telescopes could capture the event seconds before or after the merger. LIGO-Virgo detectors at design sensitivity could facilitate observing at least one event at the onset of merger.
1 Introduction
August 17, 2017 saw the beginning of a new era in multi-messenger astronomy with the joint detection of GWs by the LIGO and Virgo interferometers and the gamma-ray burst by the Fermi-GBM and INTEGRAL satellite from the BNS coalescence, GW170817 (Abbott et al., 2017a). The detection was followed by observations of the electromagnetic (EM) counterpart and afterglow by gamma-ray, UV, optical, infra-red, and radio telescopes. These observations triggered several important science results: (a) they settled a long-standing question about the origin of short gamma-ray bursts (Abbott et al., 2017b), (b) provided a new tool for measuring cosmological parameters (with the first measurement of the Hubble constant using standard sirens (Abbott et al., 2017c)), (c) confirmed the production of heavy elements in the aftermath of the merger (Abbott et al., 2017d), (d) triggered many questions about the central engine producing gamma-ray burst (GRB) and afterglows (Abbott et al., 2017e), and (e) set limits on the difference in the speed of GWs and light helping rule out certain alternative theories of gravity (Abbott et al., 2017e, 2019).
Apart from the gamma-ray burst, which was observed s after the merger event, the first manual follow-up observations took place hours after the epoch of merger (Abbott et al., 2017b). The GW alert was sent out minutes (LIGO Scientific Collaboration, 2017a) and the sky localization hours (LIGO Scientific Collaboration, 2017b) after the signal arrived on earth. Among the factors that contributed to the delay were a non-stationary glitch in the Livingston interferometer and issues with the transfer of data from the Virgo detector to analysis sites delaying the sky localization of the event. By the time EM telescopes participating in the follow-up program received the alerts the source was below the horizon for them.
For a fraction of BNS events it will be possible to issue alerts up to before the epoch of merger. Pre-merger or early warning detections will facilitate electromagnetic observations of the prompt emission, which encodes the initial conditions of the outflow and the state of the merger remnant. Indeed, early optical and ultraviolet observations are necessary to further inform our understanding of r-process nucleosynthesis (Nicholl et al., 2017) and shock-heated ejecta (Metzger, 2017), while prompt X-ray emission would reveal the final state of the remnant (Metzger & Piro, 2014; Ciolfi & Siegel, 2015; Siegel & Ciolfi, 2016). Early observations made in the radio band could indicate pre-merger magnetosphere interactions (Most & Philippov, 2020), and would test models that propose BNS as a possible precursor of fast radio bursts (Totani, 2013; Wang et al., 2016; Dokuchaev & Eroshenko, 2017).
The GstLAL-based inspiral pipeline (Sachdev et al., 2019; Hanna et al., 2020; Messick et al., 2017) (hereafter shortened to GstLAL) is a low-latency matched-filtering pipeline used to detect gravitational waves from compact binary coalescences in LIGO-Virgo data. Other low-latency detection pipelines running on LIGO-Virgo data include PyCBCLive (Nitz et al., 2018), MBTAOnline (Adams et al., 2016), SPIIR (Chu, 2017), and the unmodeled search – CWB (Klimenko et al., 2016). In a seminal paper, Cannon et al. (2012) described a computationally practical filtering strategy for near real time matched-filtering of GW data that could produce early-warning triggers. This work describes the foundations of GstLAL, which has been detecting GWs in low-latency since the first observing run (O1) of the Advanced LIGO and Virgo detectors. Cannon et al. (2012) also discussed the expected rates of BNS events that could be detectable before merger and prospects for their localizations based on theoretical SNR and Fisher estimates. There have been other studies examining theoretical potentials of pre-merger BNS detections, such as Chu et al. (2016). In this Letter, for the first time, we show the implementation of a search which can detect BNSs pre-merger and provide early warnings to other observatories in practice; we examine the performance of GstLAL in recovering BNS systems before merger by running it over a month of simulated data with added signals. Based on the median rate of BNS mergers deduced from GW170817 and GW190425 (Abbott et al., 2020), our studies suggest alerts could be issued 10 s (60 s) before merger for 24 (3) BNS systems over the course of one year of observations of a three-detector Advanced network operating at design sensitivity. Our results broadly agree with the estimates of Cannon et al. (2012). In addition, we provide the distribution of realistic sky localizations (all sky localizations quoted are 90% credible intervals unless stated otherwise) for various times before merger, using a rapid Bayesian localization tool, BAYESTAR (Singer & Price, 2016). We find that based on current BNS merger rate estimates, event will be both detected before merger and localized to .
These results assume zero latency from data transfer, calibration, filtering, and follow-up processes. In real application, these latencies will need to be subtracted from the pre-merger times at which we can provide alerts. In the latest observing run of the Advanced LIGO-Virgo detectors (O3), these latencies accounted for of delay in alerts, but eventutally we hope to be able to reduce it to for the early warning alerts. The remainder of the paper is structured as follows: we discuss the pipeline and simulations used in Section 2, the prospects of rapid sky localization of pre-merger candidates in Section 3, and broader implications of coincident GW and EM observation in Section 4.
2 Simulation
We assess the prospects of pre-merger alerts with an Advanced LIGO-Virgo network at design sensitivity. For this study, we generate one month of stationary Gaussian data recolored to Advanced LIGO and Advanced Virgo design sensitivities111We use the power spectral densities provided in https://dcc.ligo.org/LIGO-T0900288/public and https://dcc.ligo.org/LIGO-P1200087/public for the Advanced LIGO and Advanced Virgo interferometers, respectively. We assume that LIGO-Hanford and LIGO-Livingston will reach the same design sensitivities..
We generate a population of simulated BNS signals, henceforth referred to as injections, using the SpinTaylorT4 waveform model (Buonanno et al., 2004). Both source-frame component masses are drawn from a Gaussian distribution between with mean mass of and standard deviation of , modeled after observations of galactic BNSs (Özel & Freire, 2016). The neutron stars in the population are non-spinning, motivated by the low spins of BNSs expected to merge within a Hubble time (Burgay et al., 2003; Zhu et al., 2018). The signals are distributed uniformly in comoving volume up to a redshift of . We reject injections with LIGO-Hanford or LIGO-Livingston SNRs below 3 to reduce the computational load and inject the remaining signals in the Gaussian data. We don’t expect the search to recover signals with such small SNRs so no bias is introduced in rejecting these.
We use the offline configuration of the GstLAL pipeline (Sachdev et al., 2019; Hanna et al., 2020; Messick et al., 2017) to recover the remaining injected into the Gaussian data described above. GstLAL has been successfully detecting compact binary coalescences in low-latency since O1 (Abbott et al., 2016) and is so far the only pipeline to detect a BNS in low-latency (Abbott et al., 2017a, 2020).
2.1 GstLAL methods
Matched-filtering GW searches use a template bank (Owen & Sathyaprakash, 1999) containing a set of GW waveforms covering the desired parameter space. GstLAL divides the template bank into several sub-banks by grouping templates that respond to noise in a similar fashion based on their intrinsic parameters (Messick et al., 2017; Sachdev et al., 2019). It then uses the LLOID method (Cannon et al., 2012) to construct orthogonal basis filters from the sub banks by performing in order multi-banding and singular value decomposition (SVD) (Cannon et al., 2010) of each time slice. The data is cross-correlated with the basis filters to produce GW candidates. Candidates with SNRs below 4.0 are discarded to reduce the volume of triggers. Candidates that survive this step are assigned a log likelihood-ratio, . The log likelihood-ratio ranks candidate events by their SNR, the sensitivity of each detector at the time of the trigger, an autocorrelation-based signal consistency test (), and (for coincident triggers) the time and phase delays between participating interferometers (Cannon et al., 2015; Messick et al., 2017; Hanna et al., 2020; Sachdev et al., 2019). A template-dependent factor, where denotes the template, is included in the log likelihood-ratio to account for the population mass-model (Fong, 2018) of signals. The distribution of log-likelihood ratio for noise triggers is created by sampling the noise distributions of the parameters it depends on, and all candidates are subsequently assigned a false-alarm-rate to describe how often a candidate with a at least as high as its own is expected to be produced from noise fluctuations.
2.2 Early-warning methods
In this search, we used a stochastically generated template bank (Privitera et al., 2014; Harry et al., 2009) with non-spinning components between masses ; bounds chosen to account for edge effects and redshift, and chirp mass (, ); bounds chosen based on the Gaussian population described above. We model the GW emission from 10 Hz to merger using the TaylorF2 (Sathyaprakash & Dhurandhar, 1991; Blanchet et al., 1995, 2005; Buonanno et al., 2009) waveform. The resulting template bank has a minimum match of 98% (Owen & Sathyaprakash, 1999) and consists of waveforms. The template-dependent factor to account for the population mass-model used in the log-likelihood ratio is modeled as a Gaussian in chirp mass with a mean of and a standard deviation of . The mean chirp mass is derived from the Gaussian component mass distribution described in Section 2 at a redshift of .
We repeat the search six times, using the same template bank and the same dataset inluding injections, to determine the pipeline’s performance at various times before merger. The searches begin filtering at 10 Hz, but complete filtering at different frequencies. In particular, we choose , , , , , and to analyze signal recovery at (approximately) , , , , , and before merger. We will refer to each ending frequency configurations as a different “run” in the discussion that follows. In practice, these ending frequencies are only approximate, since we chose to align the waveforms that are grouped together before performing the SVD (see Section. 2.1) such that the waveforms in each sub bank provide the same pre-merger time. The times before merger quoted here are the median times for each run. In our simulation, this time ranged from between the 6 runs. While performing multi-banding, the waveforms belonging to a sub-bank are time-sliced and each slice is sampled according to the highest Nyquist frequency in that sub-bank and time slice. However, for these runs we fixed the sample rate of the final time-slice at so that the is calculated at the full frequency resolution. As the bandwidth of the search is decreased, the variance associated with the recovered end time, phase, and SNR grow. We account for increased uncertainty in the signal end time by extending the time window in which we search for coincident signals to 10 milliseconds plus light travel time. We repeat the procedure described in Hanna et al. (2020) for each analysis to account for bandwidth related changes to the covariance matrix and construct signal distributions for time and phase delays for each of the run. In addition, we tuned the binning and sampling of the SNR and histograms which are used to calculate the distribution of log-likelihood ratio of noise triggers which defines the background model of the search. In absence of any simulated signals in the Gaussian data, we expect the foreground of our runs to agree with the background model computed by the search. We confirmed that for each of the 6 runs, on excluding the simulated signals, the distribution of log-likelihood ratio of the candidates agreed with the background model computed by the search.
2.3 Results
We consider any injection that is recovered with a FAR to be found by our pipeline in each of the 6 different runs. We can compute the expected number of signals for each run based on the sensitive spacetime volume of each run at our chosen FAR threshold and on the local BNS merger rate, (90% credible interval) (Abbott et al., 2020). The sensitive spacetime volume of the search at a given FAR threshold is then estimated as
| (1) |
where is the number of recovered injections at the given FAR. This assumes that the injections have not been restricted to space or time that the pipeline could gave been sensitive to. For this signal distribution, the simulated signals probed a spacetime volume of . The results are shown in Table 1. We expect 12–132 BNSs per year for a three-detector Advanced network at design sensitivity, about half of which will be detected before merger and 1–9 events will be detected a minute before merger.
At a FAR of 1/30 days, based on the current median BNS merger rate (, average of the two median rates from Abbott et al. (2020)), the contamination fraction from noise for the run () before merger is 79%, going down to 20% for the full bandwidth run. The contamination fraction is higher for runs that provide the earliest triggers. This suggests a natural method to vet early warning triggers; triggers that are identified in an ‘early’ band but not later bands are likely to be noise.
| (Hz) | |||
|---|---|---|---|
| 29 | 3.21 | 0.775 – 8.71 | |
| 32 | 4.84 | 1.17 – 13.2 | |
| 38 | 9.12 | 2.20 – 24.8 | |
| 49 | 18.2 | 4.41 – 49.5 | |
| 56 | 23.6 | 5.71 – 64.2 | |
| 1024 | 48.7 | 11.8 – 132 |
3 Sky Localization of Early Warning Alerts
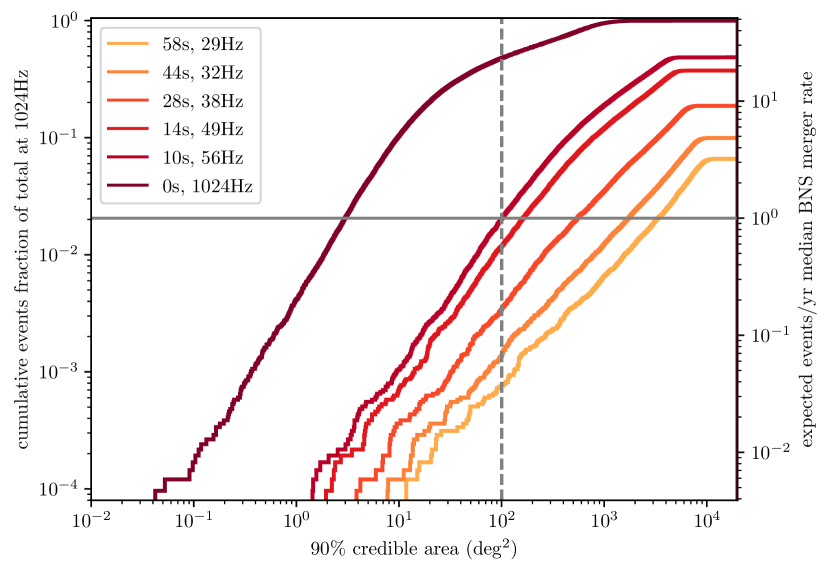
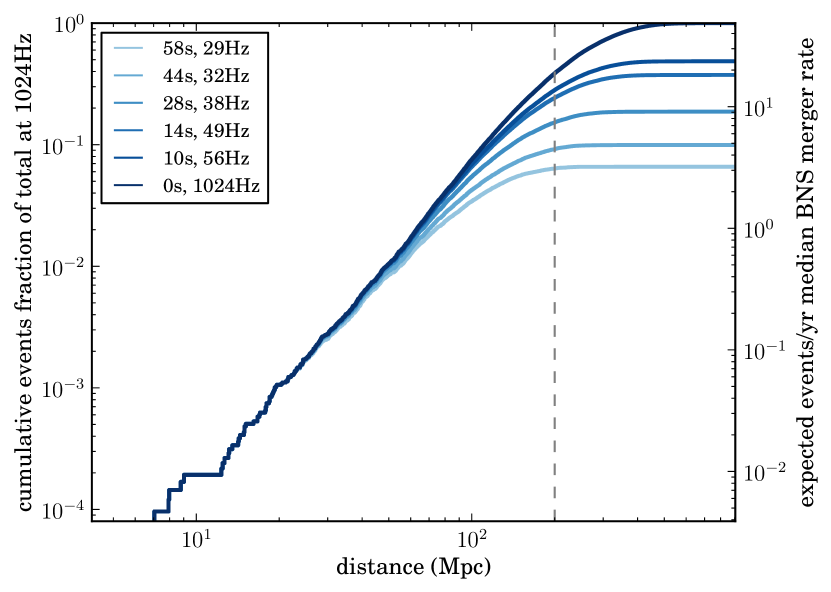
The primary goal of providing pre-merger alerts for BNSs is to facilitate electromagnetic observations before and/ or at merger. The earliest alerts we could provide will be before merger, therefore to achieve this goal it is crucial that we provide rapid and accurate sky localizations. LIGO-Virgo use BAYESTAR (Singer & Price, 2016) to generate rapid localizations, which is a fast Bayesian algorithm that can reconstruct positions of GW transients using the output provided by the matched-filtering searches. We generate the SNR time series of all injections that pass the FAR threshold for each run and provide these to BAYESTAR in order to localize the signals. The results are shown in Fig. 1. We show the cumulative histograms of the 90% credible interval of sky localizations of the injections that pass the FAR threshold in each run. The right vertical axis shows the expected number of events per year as a function of the largest localization area based on the median merger rate, the left vertical axis shows this number as a fraction of the total injections recovered at the full bandwidth. In addition we show cumulative histograms of luminosity distances of events that pass the FAR threshold in Fig. 2. These results can be easily reinterprated with any update in the BNS merger rate.
4 Discussion
Ideally we want the signals to be well localized in sky given the small fields of view (FOVs) of optical telescopes. Fig. 1 shows that at least one event per year will be both detected before merger and localized to within . Furthermore, if we consider the “searched area”, defined as the area searched in the sky according to the localization PDF before finding the true location of the event, about 9 events per year ( of total detectable BNSs) will be both detected before merger and found before searching over . Additionally, the searched area can be reduced by using galaxy catalogs to inform imaging strategies (Hanna et al., 2014). Events we are able to provide early warnings for, especially the well localized ones, will be the ones that are the closest to us further enabling better follow-up. At least 1 event per year (3.4% of the total) detected before merger will be within and about 13 events per year ( of the total) will both be detected before merger and lie within (Fig. 2).
Wide-field optical transient facilities such as the BlackGEM array ( per telescope) with 3 telescopes planned in the first phase of operation eventually exapnding to 15 telescopes (BlackGEM, 2020), the Zwicky Transient Facility () (ZTF, 2020), the Dark Energy Camera () (Flaugher et al., 2015), the Rubin Observatory () (LSST, 2020), the Swope Telescope () (SWOPE, 2020), the Subaru Telescope () Subaru (2020), etc., operated in “target of opportunity” mode will be most fitting for the optical follow-up of well localized events. Events with larger localization areas will be useful to alert space telescopes, such as the Fermi Gamma-ray Burst Monitor (all-sky) and the Swift Observatory (hosting the Burst Alert Telescope with a FOV of and can localize events with an accuracy of 1 to 4 arc-minutes within , X-Ray Telescope, and Ultra Violet Optical Telescope). Pre-merger GW detection will be especially helpful to identify subthreshold GRBs for off-axis BNS mergers (Tohuvavohu et al., 2020). Radio telescopes with large FOVs of hundreds of square degrees such as the Murchison Widefield Array (MWA, 2020), the National Radio Astronomy Observatory (NRAO, 2020) consisting of several telescope arrays, the Giant Metre-Wave Radio Telescope (GMRT, 2020), the Owens Valley Long Wavelength Array (OVRO-LWA, 2020), and (under construction) the Square Kilometre Array (SKA, 2020), etc. can use even the poorly localized early warning alerts. Callister et al. (2019) have demonstrated a search which looks for radio signals coincident with GW alerts by buffering the data of OVRO-LWA, to look for signals coincident with the GW170104 (Abbott et al., 2017f). Early warning alerts will enable buffering of the radio data at significantly higher time resolution. James et al. (2019) also describe using negative-latency BNS merger alerts to detect prompt radio bursts with MWA. Early warning alerts will also be useful for ground-based gamma-ray detector facilities such as the Cherenkov Telescope Array, which consists of several fast slewing telescopes (CTA, 2020). They can slew within tens of seconds but must be pointing at the source at the time of merger, since there is no hypothesized after glow at the high energies these telescopes can detect.
The pre-merger latencies described in the paper are the median latencies from each run. The exact pre-merger latencies depend on the template masses, and range from –. The pre-merger times quoted in this paper also assume zero latency from data transfer, calibration, and the matched-filtering processes. In O3, this latency was about ; our goal is to bring this latency down to for the smaller bandwidth (early warning) configurations.
The low-latency GstLAL pipeline recently participated in a test of the LIGO-Virgo early warning infrastructure and issued the first test alerts and retractions for pre-merger candidates (LIGO Scientific Collaboration, 2020; Guide, 2020). This test will be described in more detail in a future publication.
5 Acknowledgements
This work was supported by the NSF grant OAC-1841480. S.S. is supported by the Eberly Research Funds of Penn State, The Pennsylvania State University, University Park, Pennsylvania. D.M. acknowledges the support of NSF PHY-1454389, ACI-1642391, and OAC-1841480. S.R.M thanks the LSSTC Data Science Fellowship Program, which is funded by LSSTC, NSF Cybertraining Grant #1829740, the Brinson Foundation, and the Moore Foundation; his participation in the program has benefited this work. B.S.S. is supported in part by NSF Grant No. PHY-1836779 and AST-1708146. Computations for this research were performed on the Pennsylvania State University’s Institute for Computational and Data Sciences Advanced CyberInfrastructure (ICDS-ACI). We also thank the LIGO Laboratory for use of its computing facility to make this work possible.
References
- Abbott et al. (2016) Abbott, B. P., et al. 2016, Phys. Rev. Lett., 116, 241103, doi: 10.1103/PhysRevLett.116.241103
- Abbott et al. (2017a) —. 2017a, Phys. Rev. Lett., 119, 161101, doi: 10.1103/PhysRevLett.119.161101
- Abbott et al. (2017b) —. 2017b, Astrophys. J., 848, L12, doi: 10.3847/2041-8213/aa91c9
- Abbott et al. (2017c) —. 2017c, Nature, 551, 85, doi: 10.1038/nature24471
- Abbott et al. (2017d) —. 2017d, Astrophys. J., 850, L39, doi: 10.3847/2041-8213/aa9478
- Abbott et al. (2017e) —. 2017e, Astrophys. J., 848, L13, doi: 10.3847/2041-8213/aa920c
- Abbott et al. (2017f) —. 2017f, Phys. Rev. Lett., 118, 221101, doi: 10.1103/PhysRevLett.118.221101, 10.1103/PhysRevLett.121.129901
- Abbott et al. (2019) —. 2019, Phys. Rev. D, 100, 104036, doi: 10.1103/PhysRevD.100.104036
- Abbott et al. (2020) —. 2020. https://arxiv.org/abs/2001.01761
- Adams et al. (2016) Adams, T., Buskulic, D., Germain, V., et al. 2016, Class. Quant. Grav., 33, 175012, doi: 10.1088/0264-9381/33/17/175012
- Astropy Collaboration et al. (2013) Astropy Collaboration, Robitaille, T. P., Tollerud, E. J., et al. 2013, A&A, 558, A33, doi: 10.1051/0004-6361/201322068
- BlackGEM (2020) BlackGEM. 2020, The BlackGEM Telescope Array, "https://astro.ru.nl/blackgem/"
- Blanchet et al. (2005) Blanchet, L., Damour, T., Esposito-Farese, G., & Iyer, B. R. 2005, Phys. Rev., D71, 124004, doi: 10.1103/PhysRevD.71.124004
- Blanchet et al. (1995) Blanchet, L., Damour, T., Iyer, B. R., Will, C. M., & Wiseman, A. 1995, Phys. Rev. Lett., 74, 3515, doi: 10.1103/PhysRevLett.74.3515
- Buonanno et al. (2004) Buonanno, A., Chen, Y.-b., Pan, Y., & Vallisneri, M. 2004, Phys. Rev. D, 70, 104003, doi: 10.1103/PhysRevD.74.029902
- Buonanno et al. (2009) Buonanno, A., Iyer, B., Ochsner, E., Pan, Y., & Sathyaprakash, B. S. 2009, Phys. Rev., D80, 084043, doi: 10.1103/PhysRevD.80.084043
- Burgay et al. (2003) Burgay, M., et al. 2003, Nature, 426, 531, doi: 10.1038/nature02124
- Callister et al. (2019) Callister, T. A., Anderson, M. M., Hallinan, G., et al. 2019, The Astrophysical Journal, 877, L39, doi: 10.3847/2041-8213/ab2248
- Cannon et al. (2010) Cannon, K., Chapman, A., Hanna, C., et al. 2010, Physical Review D, 82, doi: 10.1103/physrevd.82.044025
- Cannon et al. (2015) Cannon, K., Hanna, C., & Peoples, J. 2015. https://arxiv.org/abs/1504.04632
- Cannon et al. (2012) Cannon, K., et al. 2012, Astrophys. J., 748, 136, doi: 10.1088/0004-637X/748/2/136
- Chu (2017) Chu, Q. 2017, PhD thesis, The University of Western Australia
- Chu et al. (2016) Chu, Q., Howell, E. J., Rowlinson, A., et al. 2016, Monthly Notices of the Royal Astronomical Society, 459, 121, doi: 10.1093/mnras/stw576
- Ciolfi & Siegel (2015) Ciolfi, R., & Siegel, D. M. 2015, Astrophys. J., 798, L36, doi: 10.1088/2041-8205/798/2/L36
- CTA (2020) CTA. 2020, The Cherenkov Telescope Array, "https://www.cta-observatory.org/science/cta-performance/"
- Dokuchaev & Eroshenko (2017) Dokuchaev, V. I., & Eroshenko, Yu. N. 2017. https://arxiv.org/abs/1701.02492
- Flaugher et al. (2015) Flaugher, B., Diehl, H. T., Honscheid, K., et al. 2015, The Astronomical Journal, 150, 150, doi: 10.1088/0004-6256/150/5/150
- Fong (2018) Fong, H. K. Y. 2018, PhD thesis, Toronto U.
- GMRT (2020) GMRT. 2020, The Giant MetreWave Radio Telescope, "http://www.gmrt.ncra.tifr.res.in/"
- Guide (2020) Guide, U. 2020, LIGO-Virgo Public Alerts User Guide, "https://emfollow.docs.ligo.org/userguide/early_warning.html"
- Hanna et al. (2014) Hanna, C., Mandel, I., & Vousden, W. 2014, The Astrophysical Journal, 784, 8, doi: 10.1088/0004-637x/784/1/8
- Hanna et al. (2020) Hanna, C., et al. 2020, Phys. Rev., D101, 022003, doi: 10.1103/PhysRevD.101.022003
- Harry et al. (2009) Harry, I. W., Allen, B., & Sathyaprakash, B. S. 2009, Phys. Rev., D80, 104014, doi: 10.1103/PhysRevD.80.104014
- Hunter (2007) Hunter, J. D. 2007, CSE, 9, 90, doi: 10.1109/MCSE.2007.55
- James et al. (2019) James, C. W., Anderson, G. E., Wen, L., et al. 2019, Monthly Notices of the Royal Astronomical Society: Letters, 489, L75, doi: 10.1093/mnrasl/slz129
- Klimenko et al. (2016) Klimenko, S., et al. 2016, Phys. Rev., D93, 042004, doi: 10.1103/PhysRevD.93.042004
- LIGO Scientific Collaboration (2018) LIGO Scientific Collaboration. 2018, LIGO Algorithm Library, doi: 10.7935/GT1W-FZ16
- LIGO Scientific Collaboration (2017a) LIGO Scientific Collaboration, V. C. 2017a, GCN, 21505. https://gcn.gsfc.nasa.gov/gcn3/21505.gcn3
- LIGO Scientific Collaboration (2017b) —. 2017b, GCN, 21513. https://gcn.gsfc.nasa.gov/gcn3/21513.gcn3
- LIGO Scientific Collaboration (2020) —. 2020, GCN, 27951. https://gcn.gsfc.nasa.gov/gcn3/27951.gcn3
- LSST (2020) LSST. 2020, The Large Synoptic Survey Telescope, "https://www.lsst.org/lsst/"
- Messick et al. (2017) Messick, C., et al. 2017, Phys. Rev., D95, 042001, doi: 10.1103/PhysRevD.95.042001
- Metzger (2017) Metzger, B. D. 2017, Preprint: arXiv 1710.05931. https://arxiv.org/abs/1710.05931
- Metzger & Piro (2014) Metzger, B. D., & Piro, A. L. 2014, Mon. Not. Roy. Astron. Soc., 439, 3916, doi: 10.1093/mnras/stu247
- Most & Philippov (2020) Most, E. R., & Philippov, A. A. 2020. https://arxiv.org/abs/2001.06037
- MWA (2020) MWA. 2020, The Murchison Widefield Array, "http://www.mwatelescope.org/"
- Nicholl et al. (2017) Nicholl, M., et al. 2017, Astrophys. J., 848, L18, doi: 10.3847/2041-8213/aa9029
- Nitz et al. (2018) Nitz, A. H., Dal Canton, T., Davis, D., & Reyes, S. 2018, Phys. Rev., D98, 024050, doi: 10.1103/PhysRevD.98.024050
- NRAO (2020) NRAO. 2020, The National Radio Astronomy Observatory, "https://public.nrao.edu/"
- OVRO-LWA (2020) OVRO-LWA. 2020, The Owens Valley Long Wavelength Array, "http://www.tauceti.caltech.edu/LWA/"
- Owen & Sathyaprakash (1999) Owen, B. J., & Sathyaprakash, B. S. 1999, Phys. Rev., D60, 022002, doi: 10.1103/PhysRevD.60.022002
- Price-Whelan et al. (2018) Price-Whelan, A. M., Sipőcz, B. M., Günther, H. M., et al. 2018, AJ, 156, 123, doi: 10.3847/1538-3881/aabc4f
- Privitera et al. (2014) Privitera, S., Mohapatra, S. R. P., Ajith, P., et al. 2014, Phys. Rev., D89, 024003, doi: 10.1103/PhysRevD.89.024003
- Sachdev et al. (2019) Sachdev, S., et al. 2019. https://arxiv.org/abs/1901.08580
- Sathyaprakash & Dhurandhar (1991) Sathyaprakash, B. S., & Dhurandhar, S. V. 1991, Phys. Rev., D44, 3819, doi: 10.1103/PhysRevD.44.3819
- Siegel & Ciolfi (2016) Siegel, D. M., & Ciolfi, R. 2016, Astrophys. J., 819, 15, doi: 10.3847/0004-637X/819/1/15
- Singer & Price (2016) Singer, L. P., & Price, L. R. 2016, Phys. Rev. D, 93, 024013, doi: 10.1103/PhysRevD.93.024013
- SKA (2020) SKA. 2020, The Square Kilometre Array, "https://www.skatelescope.org/"
- Subaru (2020) Subaru. 2020, The Subaru Telescope, "https://subarutelescope.org/en/"
- SWOPE (2020) SWOPE. 2020, The Swope Telescope, "https://obs.carnegiescience.edu/swope"
- Tohuvavohu et al. (2020) Tohuvavohu, A., Kennea, J. A., DeLaunay, J., et al. 2020, The Astrophysical Journal, 900, 35, doi: 10.3847/1538-4357/aba94f
- Totani (2013) Totani, T. 2013, Pub. Astron. Soc. Jpn., 65, L12, doi: 10.1093/pasj/65.5.L12
- Wang et al. (2016) Wang, J.-S., Yang, Y.-P., Wu, X.-F., Dai, Z.-G., & Wang, F.-Y. 2016, Astrophys. J., 822, L7, doi: 10.3847/2041-8205/822/1/L7
- Zhu et al. (2018) Zhu, X., Thrane, E., Oslowski, S., Levin, Y., & Lasky, P. D. 2018, Phys. Rev., D98, 043002, doi: 10.1103/PhysRevD.98.043002
- ZTF (2020) ZTF. 2020, The Zwicky Transient Facility, "https://www.ztf.caltech.edu/"
- Özel & Freire (2016) Özel, F., & Freire, P. 2016, Ann. Rev. Astron. Astrophys., 54, 401, doi: 10.1146/annurev-astro-081915-023322