First Discovery of a Fast Radio Burst at 350 MHz by the GBNCC Survey
Abstract
We report the first discovery of a fast radio burst (FRB), FRB 20200125A, by the Green Bank Northern Celestial Cap (GBNCC) Pulsar Survey conducted with the Green Bank Telescope at 350 MHz. FRB 20200125A was detected at a Galactic latitude of 58.43∘ with a dispersion measure of 179 pc cm−3, while electron density models predict a maximum Galactic contribution of 25 pc cm−3 along this line of sight. Moreover, no apparent Galactic foreground sources of ionized gas that could account for the excess DM are visible in multi-wavelength surveys of this region. This argues that the source is extragalactic. The maximum redshift for the host galaxy is , corresponding to a maximum comoving distance of approximately 750 Mpc. The measured peak flux density for FRB 20200125A is 0.37 Jy, and we measure a pulse width of 3.7 ms, consistent with the distribution of FRB widths observed at higher frequencies. Based on this detection and assuming an Euclidean flux density distribution of FRBs, we calculate an all-sky rate at 350 MHz of FRBs sky-1 day-1 above a peak flux density of 0.42 Jy for an unscattered pulse having an intrinsic width of 5 ms, consistent with rates reported at higher frequencies. Given the recent improvements in our single-pulse search pipeline, we also revisit the GBNCC survey sensitivity to various burst properties. Finally, we find no evidence of interstellar scattering in FRB 20200125A, adding to the growing evidence that some FRBs have circumburst environments where free-free absorption and scattering are not significant.
1 Introduction
Fast radio bursts (FRBs) are energetic, millisecond-duration radio transients of extragalactic origin (see, e.g., Petroff et al. 2019 for a review). More than one hundred FRB sources have been published to date, including 20 repeating sources (Spitler et al., 2016; CHIME/FRB Collaboration et al., 2019a; Kumar et al., 2019; Fonseca et al., 2020), yet their origin remains an open question. Numerous models involving a diversity of progenitors and emission processes have been postulated to explain the FRB phenomenology (for a summary of proposed theories111https://frbtheorycat.org, see Platts et al. 2019). Some of the leading models invoke magnetars as the source of FRBs. Recently, two radio bursts having luminosities comparable to FRBs were detected at a dispersion measure (DM) and position consistent with the Galactic magnetar SGR 1935+2154 (Scholz & CHIME/FRB Collaboration, 2020; Bochenek et al., 2020; Zhang et al., 2020; Kirsten et al., 2020) during a known active phase of X-ray emission (Barthelmy et al., 2020; Palmer, 2020; Fletcher & Fermi GBM Team, 2020; Younes et al., 2020). These findings support the notion that extragalactic magnetars are a source of at least some FRBs.
Observations of FRBs at multiple radio frequencies can help constrain proposed emission mechanisms as well as their local environments based on measurements of properties arising from propagation effects. Initially, most FRBs were detected at a frequency of 1.4 GHz. Follow-up observations of the original repeating FRB 121102 (Spitler et al., 2016) in the 48 GHz range by Michilli et al. (2018) and Gajjar et al. (2018) showed that FRBs can emit at higher frequencies. Over the past two years, many FRBs have been detected by the Canadian Hydrogen Intensity Mapping Experiment Fast Radio Burst Project (CHIME/FRB; CHIME/FRB Collaboration et al. 2018) down to frequencies of 400 MHz (CHIME/FRB Collaboration et al., 2019b; Josephy et al., 2019). Thus, one must conclude that the environment of some FRBs is optically thin to these frequencies, and any frequency cutoff or turnover invoked in proposed mechanisms must occur below these frequencies (e.g., Ravi & Loeb 2019).
A particularly interesting discovery reported by the CHIME/FRB Collaboration is the repeating source FRB 180916.J0158+65 which shows a 16.35-day modulation in its burst activity (CHIME/FRB Collaboration et al., 2020). In Spring 2020, follow-up observations of FRB 180916.J0158+65 in the 300400 MHz frequency range (Chawla et al., 2020; Pilia et al., 2020) provided the lowest-frequency detections of FRBs to date. These targeted observations provide the only detections of FRBs below 400 MHz in spite of previous efforts to survey the radio sky for FRBs in the low-frequency regime (e.g., Coenen et al. 2014; Karastergiou et al. 2015; Tingay et al. 2015; Rowlinson et al. 2016; Deneva et al. 2016; Chawla et al. 2017; ter Veen et al. 2019; Rajwade et al. 2020). These new results, in addition to the numerous unscattered events reported by the CHIME/FRB Collaboration where the emission is detectable throughout their observing band, suggest that new FRBs will be detected by such large-scale programs.
Chawla et al. (2017) reported on a search for FRBs with the ongoing Green Bank Northern Celestial Cap (GBNCC) Pulsar Survey (Stovall et al., 2014), conducted with the 100-m Robert C. Byrd Telescope at the Green Bank Observatory (GBT) at 350 MHz. They searched 65,000 GBNCC sky pointings collected between 2009 and 2016 for FRBs, totalling 84 days of on-sky time, and found no FRB signals with S/N values greater than 10. From their non-detection, Chawla et al. (2017) calculated a 95% confidence upper limit on the FRB rate222For an unscattered pulse width of 5 ms of 3.6 FRBs sky-1 day -1 above a peak flux density of 0.63 Jy at 350 MHz. Since the time of this study, 33,000 additional GBNCC pointings have been searched for fast transients.
Here, we report the first FRB discovered by GBNCC, FRB 20200125A, which is also the first FRB discovery to emerge from a large-scale, non-targeted survey below 400 MHz. In Section 2, we describe the survey and data processing, and discuss the discovery of FRB 20200125A and compare the significance of the signal to other GBNCC confirmed discoveries of Rotating Radio Transients (RRATs). Burst properties are provided in Section 3. In Section 4, we discuss the evidence for the source being extragalactic. An all-sky FRB rate calculation is presented in Section 5. In the latter, we additionally revisit the sensitivity of the survey to single-pulse events. Our results are summarized in Section 6.
2 Observations & Discovery
2.1 Survey Description and Data Processing
An all-sky GBNCC survey for pulsars and dispersed radio pulses began in 2009 with the GBT at a central observing frequency of 350 MHz. Data are sampled every 81.92 s and recorded in 4096 frequency channels spanning 100 MHz with the Green Bank Ultimate Pulsar Processing Instrument333https://safe.nrao.edu/wiki/bin/view/CICADA/GUPPiUsersGuide (GUPPI). All survey pointings consist of 120-s integrations on a particular sky location with a full width at half-maximum (FWHM) beam size of 36′. A total of 125,000 sky pointings are necessary to cover the entire sky visible by GBT (), 90% of which have been observed as of 2020 July.
Data are processed with a PRESTO-based444https://www.cv.nrao.edu/~sransom/presto/ (Ransom, 2001) pipeline that is run on the Béluga cluster555https://docs.computecanada.ca/wiki/Beluga operated by Calcul Québec and Compute Canada in Montréal, Canada. Following of the excision of radio frequency interference (RFI), pointings are dedispersed at various DM trials up to 3000 pc cm-3. We note however that prior to 2013, data were only searched up to a maximum DM of 500 pc cm-3. In total, about 21% of the 112,000 pointings collected and processed as of 2020 May have only been searched up to 500 pc cm-3, and will be reprocessed in the future.
Time series are searched for periodic signals with both an FFT-based search and a Fast-Folding Algorithm (Parent et al., 2018), and single pulses are searched with PRESTO’s single_pulse_search.py. The latter is based on a matched-filtering algorithm that convolves the time series with boxcars having different widths. Single-pulse events having widths 100 ms detected above a signal-to-noise ratio (S/N) of 5 are saved for further analysis. Once all time series have been searched, events are sifted, grouped and ranked with the RRATtrap grouping algorithm (Karako-Argaman et al., 2015). Chawla et al. (2017) describe in detail the grouping component of the GBNCC pipeline, and a more general description of the survey and data processing is provided by Stovall et al. (2014).
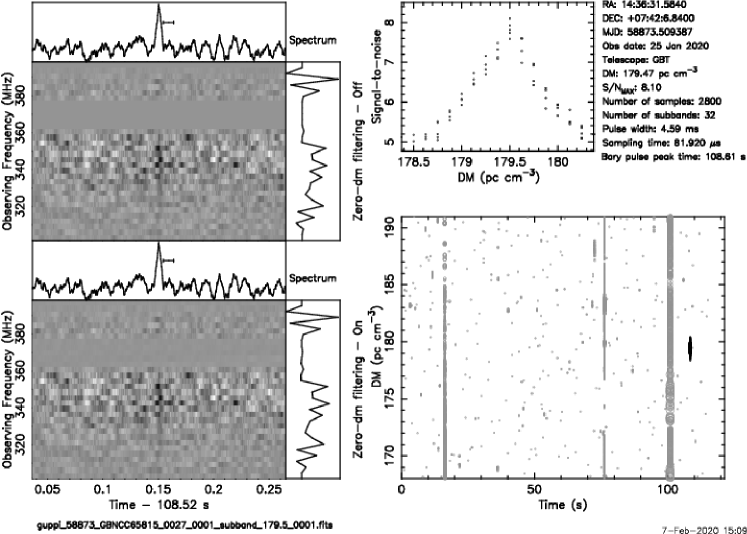
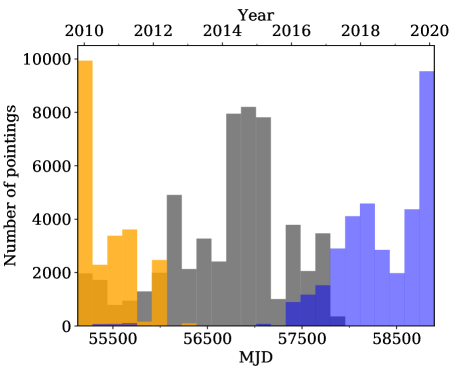
In spring of 2017, upgrades to the single-pulse searching component of the pipeline were implemented. Single-pulse diagnostic plots (“SPD” plot, see e.g. Figure 1) are now automatically generated for all single-pulse candidates, which are groups that are ranked as being potentially astrophysical by RRATtrap (i.e., not ranked as noise and/or RFI). SPD plots are then uploaded to the CyberSKA online portal (Kiddle et al., 2011) for visual inspection and classification. On average, between 25 and 30 candidates per pointing are produced. Approximately 33,000 pointings have been processed with this upgraded pipeline, representing 29% of all observed pointings. In Figure 2 we show the temporal distribution of GBNCC pointings processed through the different versions of the search pipeline.
Nearly one million single-pulse candidates have been generated by this new pipeline, 6% of which have been visually inspected on CyberSKA. The remaining 94% either have S/N8 and/or pulse widths 50 ms, and are therefore likely to be RFI or noise. We have developed various diagnostic ratings that are computed based on the candidates attributes, and those are used by CyberSKA users to filter out obvious false positives caused by RFI, which makes up the large majority of candidates. Among classified candidates are eight new RRATs666Basic properties can be found on GBNCC’s discovery page, http://astro.phys.wvu.edu/GBNCC/. Timing properties will be reported in a future publication. as well as the event we present in this work, FRB 20200125A.
2.2 Discovery of FRB 20200125A
FRB 20200125A was identified while inspecting candidates produced by the processing pipeline on the CyberSKA portal. The burst, shown in Figure 1, was detected on 2020 January 25 12:15:19.61 UTC (at 350 MHz) in a GBNCC beam pointed at the sky position and . Our pipeline identified the burst at a DM of 179 2 pc cm-3 with a S/N = 8.1 and best-matched boxcar width of 4.59 ms. Optimized parameters are presented in Section 3.
Along this line of sight, the maximum Galactic DM predicted by the NE2001 (Cordes & Lazio, 2003) and YMW16 (Yao et al., 2017) electron density models are 25 pc cm-3 and 24 pc cm-3, respectively, far less than the DM of this candidate FRB even when considering a reasonable model uncertainty (typically ). We note, however, that these models only account for the interstellar medium and do not include the Milky Way halo, which could contribute another 50–80,pc cm-3 to the FRB DM Prochaska & Zheng (2019). Even in the most conservative scenario, the combined contribution of the Galactic halo and interstellar medium do not explain the anomalous amount of DM observed in FRB 20200125A. We therefore classify this event as extragalactic, and further discuss arguments disfavoring a Galactic origin in Section 4. Considering the marginal S/N detection of the candidate, we first evaluate its significance and likelihood of being astrophysical.
2.3 Candidate significance
If the noise were normally distributed, it would be highly improbable for a false-positive detection to occur with S/N = 8.1. The RFI that is present, however, exhibits a variety of temporal and spectral features causing the reliability of statistical probabilities determined assuming Gaussian statistics to be compromised. Assessing the significance of an event based on its S/N is therefore not trivial.
As shown the bottom right panel in Figure 1, significant RFI remained present in the beam despite having applied standard RFI-mitigation routines. Such persistent interference increases the time series root mean square (rms) and introduces variation in the baseline level, which reduces the S/N calculated by single_pulse_search.py.
Using the same S/N metric, we calculate a corrected S/N that is more representative of the statistical noise around the time of the burst (i.e., excluding samples corrupted by the sporadic RFI visible in Figure 1). We produced a shortened time series at the best-DM of the burst but only processed data within 3 s of the time of the burst, where we expect a negligible amount of persistent RFI. Running the single_pulse_search.py code on this time series increased the S/N of the burst to 8.4 for the same boxcar width.
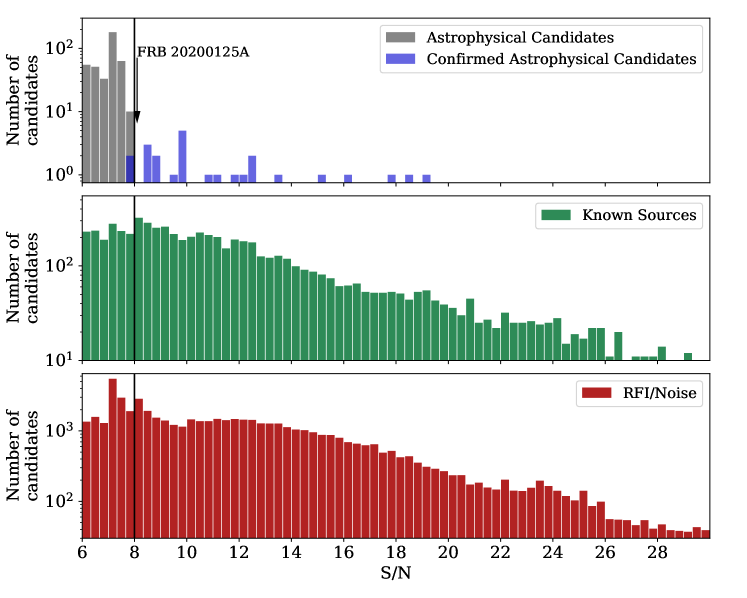
To assess the probability that our candidate FRB 20200125A is real, we examine the S/N distribution of all candidates uploaded to the CyberSKA platform that were manually classified upon inspection as being either 1) potentially astrophysical, 2) detection of a known source, or 3) RFI/noise. This approach was used by Patel et al. (2018) for assessing the significance of their FRB 141113 candidate, discovered by the PALFA survey (Cordes et al., 2006) at a similarly marginal S/N value. For completeness, we visually inspected and classified all GBNCC candidates having S/Ns 8 and pulse widths ms.
In Figure 3, we show the S/N distribution of the 60,000 classified candidates based on their qualitative attributes. We see that candidates classified as re-detections of known sources (middle panel) and RFI (bottom panel) have relatively flat S/N distributions and their S/Ns extend to large values, while there is a clear shortage of candidates classified as likely astrophysical sources (top panel) for S/Ns 8. Promising astrophysical candidates with S/N values as low as 7.7 have been confirmed as astrophysical through follow-up observations. Most importantly, all astrophysical candidates with S/N 8 have been confirmed to be real pulsars or RRATs. Consequently, we henceforth argue that FRB 20200125A is a genuine cosmic event.
3 Burst properties
In order to characterize the burst and confidently distinguish real emission from noise, we downsampled the data to a resolution of 655.36 s. Reducing the temporal resolution is further justified by the minimum broadening resulting from intra-channel dispersive smearing at the burst’s DM, which is estimated as 841 s at 350 MHz.
A variety of techniques have been used to perform DM-optimizations in recent FRB studies. For high-S/N, broadband-emitting bursts that do not exhibit a complex pulse morphology, times of arrival (TOAs) can be extracted from multiple frequency sub-bands and a DM-fit of the TOAs can be done following standard pulsar timing techniques (e.g., Spitler et al., 2014; Scholz et al., 2016). Metrics that optimize the pulse structure have been developed for determining the DM of bursts having complex time-frequency structures, such as the sub-burst downward frequency drifts observed in repeating FRBs (e.g., Hessels et al., 2019; Josephy et al., 2019; CHIME/FRB Collaboration et al., 2019b). Given the faintness of FRB 20200125A, we determine a best-fit DM using only a standard S/N-optimization approach. We obtain a DM value of 179.47 0.05 pc cm-3, in agreement with the initial pipeline detection. We then corrected for the receiver bandpass by calculating the system time-averaged rms noise in each frequency channel, which were converted into flux density units using the radiometer equation:
| (1) |
where is a scaling factor that corrects for the system equivalent flux density of channel in Jy, is the digitization factor, is the receiver temperature, is the sky temperature, is the telescope gain, is the rms fluctuation in channel , is the number of polarizations summed, is the temporal resolution and is the width of channel . Our data 8-bit data have a digitization factor , and for the GBT 350-MHz receiver, K, K Jy-1 and . Assuming a spectral index777The spectral index is defined as , where is the flux density and is the observing frequency. of 2.55 (Haslam et al., 1982), we calculated the sky temperature at the frequency of each channel ( = 40.7 K at the central frequency 350 MHz) using the 408-MHz all-sky map from Remazeilles et al. (2015).
For each frequency channel, we subtracted the off-pulse mean and normalized the data with the off-pulse values. Resulting receiver gain fluctuations, notably in response to strong RFI, are not taken into account in the above estimation. Therefore, we performed the calibration considering only a 100-ms window around the burst time, and produced a band-averaged time series by summing all calibrated frequency channels.
To ensure that the peak flux density and fluence are measured as robustly as possible, we randomly selected five 100-ms segments from the same pointing that do not contain the FRB signal. Realizations of calibrated data were then generated from these segments following the procedure described above. We then inserted the on-pulse data into the calibrated segments to produce different noise realizations and better evaluate the uncertainties on the burst peak flux density and fluence. The peak flux density of the FRB was estimated as the highest value in the band-averaged time series. Fluence estimates were obtained by integrating the time series segments. We adopt the mean and standard deviation of these realizations as our final measurements. The measured peak flux density and fluence are 0.3680.012 Jy and 1.260.08 Jy ms, respectively. We fit a Gaussian model to the burst to determine the pulse FWHM and used the best-fit mean as the burst peak time (see Table LABEL:tab:burst).
Multipath scattering of signals propagating in an inhomogeneous ionized medium leads to frequency-dependent time delays. Such scattering-induced broadening is observable as a one-sided exponential tail in a pulse profile characterized by a scattering timescale . Using the convolution of a Gaussian profile and a one-sided exponential decay to describe the pulse broadening (McKinnon, 2014), we attempt to measure a scattering timescale for FRB 20200125A and fit the above model to the band-averaged time series. Our best-fit model is consistent with a negligible exponential tail having a characteristic of s, shorter than the data resolution. Additionally, we measure the width of pulse profiles produced by separating the total bandwidth into three 33-MHz subbands, each dedispersed at the best-fit DM we obtained for the entire band, and summing them individually into band-averaged time series. We fit both the above pulse-broadening function and a single Gaussian to the pulse profiles. Profiles at different frequencies have best-fit pulse widths consistent with the measurement reported in Table LABEL:tab:burst. Results from both approaches suggest that the presence of scattering, if any, is temporally unresolved. We also note that NE2001 predicts a scatter-broadening smaller than s along the line of sight to FRB 20200125A, while YMW16 predicts an even smaller timescale s. We therefore adopt the temporal resolution of the calibrated data as an upper limit on the pulse broadening caused by scattering, i.e. s. We recognize however that the low S/N of FRB 20200125A limits our ability to accurately measure a scattering timescale.
Because GBNCC survey pointings are recorded in incoherent filterbank mode, only total intensity data are available. Polarization properties cannot be determined from this detection.
Parameter Measured value
R.A.a (J2000) 14:36:31.58
Dec.a (J2000) +07:42:06.84
(deg) 359.83
(deg) 58.43
Event timeb (MJD) 58873.510643634
DM (pc cm-3) 179.47(5)
Widthc (ms) 3.7(4)
Peak Flux density (Jy) 0.368(12)
Fluence (Jy ms) 1.26(8)
Scattering timescale (s) 655.36
Parameter Derived value
DM (pc cm-3) 25
DM (pc cm-3) 24
Maximum redshift, 0.17
Maximum comoving distance, (Mpc) 750
\insertTableNotes{ThreePartTable}
{TableNotes}[flushleft]
Position of the beam center, which has a FWHM of 36′.
Barycentric time measured at 350 MHz.
Full width at half maximum of a single-Gaussian fit to the profile.
Model-dependent maximum Galactic DM contribution predicted along the line of sight.
4 Galactic or Extragalactic?
We now consider whether FRB 20200125A could be Galactic. The NE2001 and YMW16 models predict a maximum Galactic DM along the line of sight of 25 and 24 pc cm-3, respectively. Considering the uncertainty generally assumed for these predictions, these values are in agreement with each other. However, DM-predicted distances can be incorrect by factors of a few (e.g., Deller et al. 2019). This is particularly true for high-latitude pulsars where distance predictions are sensitive to small DM variations.
We can still evaluate how likely it is that both models are underpredicting the maximum Galactic DM in the direction of FRB 20200125A by examining their performance for pulsars in that region of the sky.
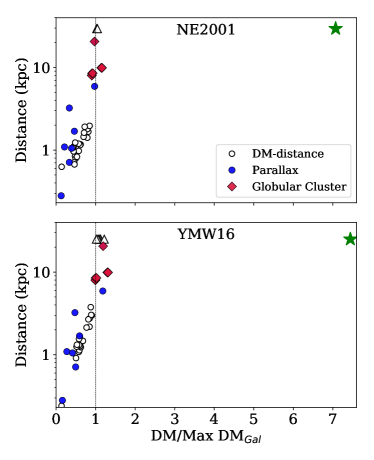
We selected the 44 pulsars from the ATNF catalog888ATNF Pulsar Catalogue version 1.63, https://www.atnf.csiro.au/research/pulsar/psrcat/ (Manchester et al., 2005) located within 25∘ of the beam center position, and looked at their distances and DMs distribution. These sources have Galactic latitude, , in the range , while their DMs vary from 3.3 pc cm-3 to a maximum of 37.4 pc cm-3, 5 times smaller than that of FRB 20200125A. Ten of these 44 pulsars are in globular clusters having known distances (five in M5, four in M3 and one in M53) and seven have parallax distance measurements.
In Figure 4, we show the pulsar distances against the ratio of their measured DM values to the maximum Galactic DM () predicted by NE2001 (top panel) and YMW16 (bottom panel) along their respective lines of sight. Ratios exceeding unity imply that the electron density model places these sources beyond the Galaxy.
Only 6/44 pulsars have DMs exceeding the maximum Galactic DM predicted by NE2001, four of which are located within the globular cluster M3 (Hessels et al., 2007). On the other hand, 13/44 pulsars have DMs exceeding the maximum Galactic DM predicted by YMW16, seven of which have independent distance measurements (all but one being in globular clusters). Taking into account model uncertainties, these predictions are still consistent with a Galactic origin. Pulsars located in M3 yield the largest ratios (1.15 and 1.31 for NE2001 and YMW16, respectively), and their corresponding DM excesses are only 5 pc cm-3). We therefore conclude that there is no evidence that the models severely underpredict the maximum Galactic DM in that region of the sky.
With a DM of 179.47 pc cm-3 ( of 7.1 and 7.4 for NE2001 and YMW16, respectively), it is clear that FRB 20200125A is an outlier, regardless of the accuracy of the models. Including a contribution from the Galactic halo, which could be as high as 80 pc cm-3 (Prochaska & Zheng, 2019), would still leave an anomalous DM 75 pc cm-3. An extragalactic origin is thus most plausible.
4.1 Galactic DM contribution
We now investigate whether an intervening ionized region along the line of sight that is unaccounted for in electron density models could explain the observed DM excess, DME. This ionized nebula could either be coincidentally aligned with the FRB, or one in which the burst progenitor is embedded. Taking the average between DMNE2001 and DMYMW16 as the maximum Galactic DM contribution along the line of sight, the unexplained amount of DM is DME = 155 pc cm-3.
Thermal free-free emission from such a nebula could potentially be detected by surveys of the radio continuum. The primary parameter that determines the brightness of the radio emission from a homogeneous, isothermal H II region is the emission measure, EM, which can be calculated from the DM,
| (2) |
where is the nebula diameter in units of pc. Following the rationale of Kulkarni et al. (2014) and Scholz et al. (2016), we can estimate the free-free optical depth, , from the EM,
| (3) |
where is the electron temperature and is the frequency (Oster, 1961). We require for the nebula to be optically thin (i.e., ) to the lowest-frequency photons detected from FRB 20200125A ( 300 MHz). Assigning the entire excess DM to the nebula, we can set a lower limit on the optically thin nebula size. For DME = 155 pc cm-3, we obtain 0.13 pc. Thus, the corresponding upper limit on EM is 1.81pc cm-6.
Assuming a typical electron temperature of K, it is clear that radio photon energies are much smaller than the average kinetic energy of electrons in the medium. Therefore, the flux density of the radio emission can be estimated from the Rayleigh-Jeans approximation of the Planck function at a brightness temperature and frequency ,
| (4) |
where depends on the opacity at frequency ,
| (5) |
(Rybicki & Lightman, 1979).
To identify the putative nebula in archival data, we must estimate the flux density by assuming a fiducial distance to the source. Along this line of sight, both NE2001 and YMW16 predict that the Milky Way electron density column starts plateauing at distances as small as 2.5 kpc, and reaches 95% of the Galactic maximum at 4 kpc. It is therefore reasonable to assume that at 5 kpc, the Milky Way contribution to the observed DM is maximal. We note that placing the source closer to the Solar System would increase the nebula’s EM and the observed flux density, and consequently weaken the constraints. For a fiducial distance of 5 kpc, the smallest angular extent on the sky is .
Based on the above relations, we evaluate whether the putative nebula would be detectable in the FIRST (Becker et al., 1995) and NVSS (Condon et al., 1998) surveys conducted with the VLA telescope at 1.4 GHz, which have angular resolutions of and , respectively. After calculating the brightness temperature at 1.4 GHz using equation (5) and multiplying equation (4) by the sky area of the emitting region, we apply a correction factor to account for the reduction in flux density resulting from a source being either resolved or unresolved in the images. We find that an ionized region would be detectable above a 5- level in FIRST data999Becker et al. (1995) report a rms flux density for FIRST data of 0.15 mJy. if pc. Without increasing the amount of ionized plasma, the flux density of a nebulae larger than 1.8 pc at a distance of 5 kpc would have a flux density below the detection threshold of the high-resolution FIRST data. Our calculations predict that the maximum flux density in the FIRST images is 10 mJy, when the putative nebula is smallest in size (i.e., the case where the nebula angular size matches the resolution of the FIRST data). As for the lower-resolution NVSS data, we find that any source with pc would be detectable above a 5- threshold101010Condon et al. (1998) estimate the rms flux density in NVSS data at 0.45 mJy.. The flux density detected in the NVSS data would reach maximum value of 84 mJy when the nebula has a size of 1.1 pc.
To identify viable candidates and eliminate contaminating sources such as radio stars, AGNs and other extragalactic sources, we adopt an approach similar than that presented by Condon et al. (1999), who compared the radio and mid-infrared flux densities to select ionized H II regions such as planetary nebulae. Our first step consists of selecting all catalogued objects from the ALLWISE catalog111111Catalog built upon the Wide-field Infrared Survey Explorer (WISE) project (Wright et al., 2010) offering an enhanced sensitivity and improved astrometric precision. Data released in 2013 November available here: http://wise2.ipac.caltech.edu/docs/release/allwise/. that have positions within our GBT beam. We eliminate objects having a 25 m-flux density measured below a 5- level and those having a 12-m flux density stronger than their 25-m flux density121212We adopt a more flexible color-based criteria than Condon et al. (1999), where they required that the 12 to 25-m flux density ratio be less than 0.35 (Preite-Martinez, 1988).. Most objects that were rejected were stars. Then, after visually examining the FIRST and NVSS images at the position of the remaining sources, we reject those for which radio emission is not detected in either images. This produced only one candidate that satisfied all criteria which is spatially coincident with 2MASX J14371326+0738174 (Toba et al., 2014), the brightest galaxy in a cluster located at a redshift of 0.182. Thus, our analysis produces no potential Galactic ionized region.
In addition to radio emission, recombination radiation in the form of H emission would be emitted from the putative nebula. To confirm the above conclusion independently, we calculate the expected H flux from the EM associated with different nebular sizes in the Southern H Sky Survey (SHASSA; Gaustad et al., 2001) following the methodology presented by Kulkarni et al. (2014), for both a resolved and unresolved source. The scenario that predicts that lowest H flux is one where the nebular size is minimized ( 0.13 pc) and its distance maximized. Placing the nebula at a distance of 10 kpc, the predicted H flux is erg s-1 cm-2, above SHASSA’s 5- flux limit of erg s-1 cm-2. The SHASSA data show no evidence of such emission region in our field, hence excluding the possibility of there being a small nebula below the CHIPASS detection limit. Additionally, we note that our beam is at a higher Galactic latitude than any large-scale Galactic structures visible in data from either SHASSA or the Wisconsin H Mapper (WHAM; Reynolds et al., 1998).
We note the rarity of Galactic ionized nebulae at such high latitudes ( = 58.43∘). The HASH catalog of planetary nebulae (Parker et al., 2016) shows that there is only one confirmed source, planetary nebula G003.3+66.1 (Frew et al., 2013), and two candidate nebulae located within 10∘ of the GBT beam center. These objects are located north of our beam, inconsistent with being associated with FRB 20200125A.
Considering the above discussion and the fact that FRB 20200125A is clearly an outlier in terms of the DM distribution of the known pulsar population in this sky direction, we conclude that it is unlikely that the Milky Way is the contributing source of the anomalous amount of excess DM for FRB 20200125A.
4.2 Extragalactic association
Electronic matter in the host galaxy of FRB 20200125A and the Milky Way halo would both contribute to the observed DME. We can however calculate the maximum redshift allowed for the source assuming that the plasma excess is entirely provided by the intergalactic medium (IGM). Using the scaling between redshift and the IGM contribution to the DM (the Macquart relation; Macquart et al. 2020), we obtain an upper limit on the redshift = 0.17, corresponding to a maximum comoving distance131313Assuming the standard model of cosmology for an Euclidean Universe (). of 750 Mpc. If we assume that the Galactic halo is contributing 50 pc cm-3 to the excess DM, the estimated redshift reduces to 0.12.
Identifying a single galaxy as the host of FRB 20200125A is difficult due to 1) the large FWHM of the GBT beam (36′) and 2) the large range of redshifts allowed for the host galaxy. Based on the GLADE combined catalogue (Dálya et al., 2018), there are more than three dozen catalogued galaxies located within the beam that have redshifts in the allowed range. Moreover, GLADE has a completeness within 200 Mpc (Dálya et al., 2018), leaving a substantial fraction of galaxies within 750 Mpc uncatalogued. Given the diversity in host properties of localized FRBs (Chatterjee et al. 2017; Ravi et al. 2019; Bannister et al. 2019; Prochaska et al. 2019; Marcote et al. 2020), the absence of repeat bursts and the lack of polarization information, isolating a single galaxy as the host of FRB 20200125A from our GBT detection alone is impossible.
5 All-Sky FRB Rate
The FRB rate at 350 MHz can be estimated based on the detection of one event in 33,000 survey pointings amounting to a total on-sky time, = 45.5 days. The average RFI masking fraction for these pointings is 20.7%, 0.7% of which is estimated to be in the time domain and has been subtracted from the aforementioned on-sky time. The remaining masking can be attributed to persistent RFI in the 360–380 MHz frequency range at the telescope site resulting in a usable bandwidth, MHz, after accounting for roll-off at the bandpass edges.
We determine the effective solid angle of the beam, , using the approach proposed by James et al. (2019) which accounts for variation in the FRB rate across the beam FWHM due to the position-dependent beam response, . The magnitude of this variation depends on the FRB source counts distribution, which is modelled as a power law with the number of FRBs having a flux density greater than scaling as . The effective field of view is then defined as,
| (6) |
with the rate at boresight given by,
| (7) |
Here is the number of FRBs detected by the survey and = 0.27 sq. deg. for the GBT beam assuming an Euclidean flux density distribution of FRBs (). We find the on-axis rate to be FRBs sky-1 day-1 with the uncertainties representing the 95% confidence interval for Poisson statistics.
The threshold flux density, , for detecting an FRB on-axis with our search pipeline can be determined using the radiometer equation,
| (8) |
where = 39 K (median for all pointings included in the total on-sky time) and the observed pulse width, , is the quadrature sum of the intrinsic pulse width (), scattering timescale (), intrachannel dispersive smearing and sampling time (Cordes & McLaughlin, 2003). Values of other parameters are provided in Section 3. Although the S/N threshold for visual inspection of a candidate is 8 (see Section 2.3), the minimum detectable S/N could be higher as it depends on the intrinsic pulse width, burst DM and scattering timescale. This dependence arises due to the grouping and ranking code, RRATtrap, requiring detection at 20 DM trials for a pulse to be classified as a candidate (Chawla et al., 2017). We obtain the minimum detectable S/N using the approach described in Chawla et al. (2017) and find the threshold flux density to be 0.42 Jy for ms, ms and a DM of 640 pc cm-3 (mean DM of known FRBs; Petroff et al. 2016). However, the threshold flux density varies from 0.25 Jy for a 10-ms duration burst to 2.0 Jy for a burst of 1-ms duration (see Figure 5). Additionally, the threshold is valid for FRBs with broadband emission. The sensitivity to narrow-band bursts, such as those emitted by repeating FRB sources (Hessels et al., 2019; CHIME/FRB Collaboration et al., 2019a; Fonseca et al., 2020), is lower as our detection pipeline searches band-averaged time series for single pulses. In the absence of knowledge about the underlying distribution of FRB emission bandwidths, we do not modify our sensitivity threshold to account for narrow-band bursts, but note the quoted rate may be underestimated.
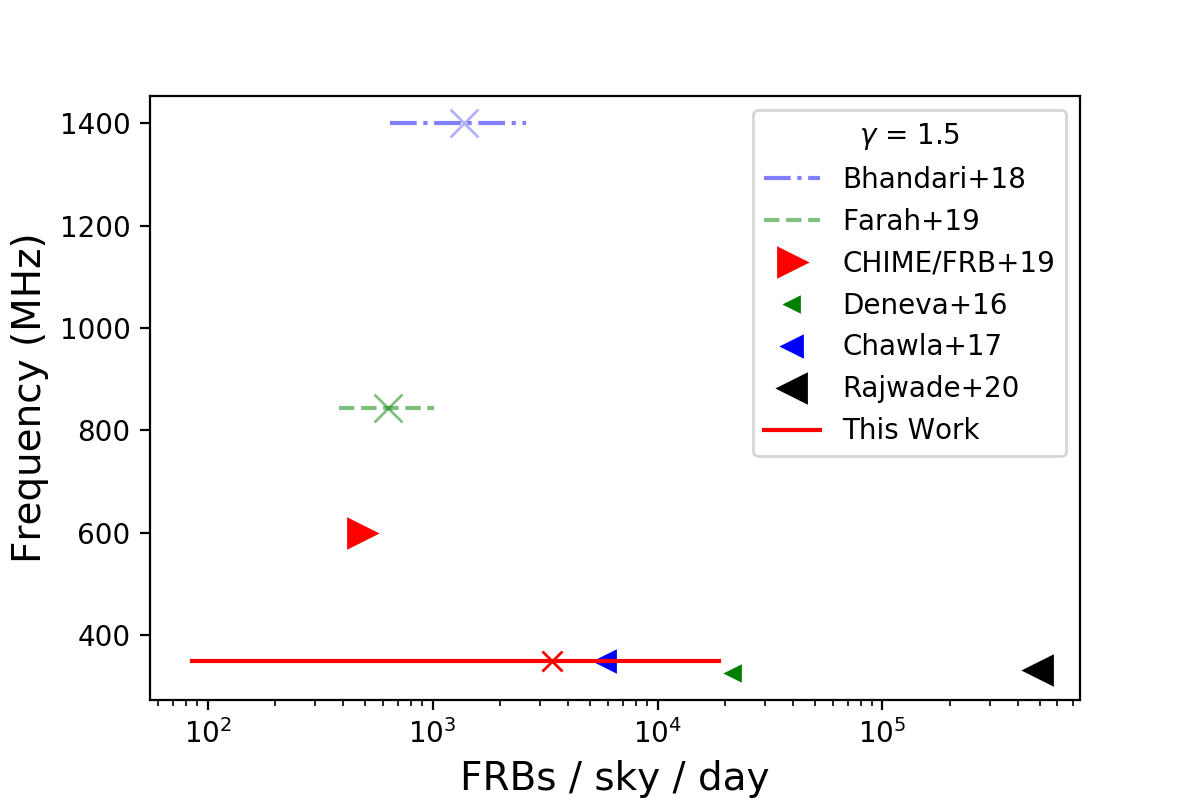
Assuming an Euclidean flux density distribution of FRBs, we scale the upper limits previously reported by Deneva et al. (2016) and Rajwade et al. (2020) in the 300–400 MHz frequency range to our search sensitivity, and we find that our measured rate is fully consistent with the scaled limits (see Figure 6).
To allow for a meaningful comparison with the constraints on the FRB rate estimated by Chawla et al. (2017), we recompute their upper limit with the approach used in this work. We estimate it to be FRBs sky-1 day-1 above a flux density of 0.39 Jy for an unscattered pulse with ms. Although our S/N threshold for visual inspection was lower than that for the search conducted by Chawla et al. (2017), the lower median sky temperature ( = 34 K) and higher usable bandwidth ( MHz) for their pointings resulted in the two searches having comparable sensitivities.
We find that the mean rate derived from the detection of FRB 20200125A is consistent with the 95% confidence upper limit reported by Chawla et al. (2017). We note, however, our upper bound on the confidence interval allows for rates larger than their upper limit. This tension in the maximum FRB-rate predictions for the GBNCC survey could be explained by the enhancement of our search sensitivity following a modification made to RRATtrap: we now allow the algorithm to search for associated detections in five neighbouring DM trials before classifying a single pulse event as noise. Chawla et al. (2017) grouped detections only in the adjacent DM trials thus making their search more susceptible to RFI which can prevent detection of a pulse at certain DMs. Additionally, the use of the CyberSKA online portal for visual inspection in this work could potentially have resulted in a more rigorous search than the one conducted by Chawla et al. (2017). Nevertheless, our measured mean rate is consistent with Chawla et al. (2017), and we note that the errors on our measurement are large. Continued processing of GBNCC data with the enhanced search sensitivity will help increase the precision on our measurement.
We do not repeat the analysis performed by Chawla et al. (2017) which constrained the mean spectral index of the FRB population by comparing the 1.4-GHz FRB rate with the rate at 350 MHz. Their analysis relied on the assumption that the rate at 350 MHz is equal to the 95% confidence GBNCC upper limit implying that their spectral index constraints are still valid. Detection of more FRBs at these frequencies could reduce the Poissonian uncertainties associated with the rate measurement and allow for stricter constraints on the ensemble spectrum of FRBs.
6 Conclusion
In this work, we have presented FRB 20200125A, the first FRB discovered by the GBNCC survey and also the first source to be discovered by a large-scale survey for radio pulsars and fast transients operating at observing frequencies below 400 MHz. The burst was detected in a high-latitude () pointing, and shows no evidence of interstellar scattering. While FRB 20200125A was detected at a marginal S/N of 8.1, all single-pulse candidates generated by our processing pipeline having a S/N8 were subsequently confirmed as RRATs. Consequently, we consider FRB 20200125A highly likely to be astrophysical.
Along this line of sight, electron density models NE2001 and YMW16 predict nearly identical maximum Galactic DMs that are more than seven times smaller than the source DM. Moreover, known field and globular-cluster pulsars located within 25∘ of the pointing position all have DM values consistent with a Galactic origin. We examined multi-wavelength archival data to identify a potential ionized region that could explain the anomalous amount of DM. Our analysis rules out the existence of such nebulae in the vicinity of FRB 20200125A. Based on these findings, we conclude that the source is extragalactic.
We computed the all-sky FRB rate at 350 MHz based on the detection of FRB 20200125A, the only FRB candidate in all 33,000 GBNCC survey pointing searched with the upgraded pipeline. We calculated a rate of FRBs sky-1 day-1 above a peak flux density of 0.42 Jy for a unscattered pulse having an intrinsic pulse width of 5 ms, assuming an Euclidean flux density distribution of FRBs. Chawla et al. (2017) reported an upper limit of FRBs sky-1 day-1 for a similar pulse above a peak flux density of 0.63 Jy. We recompute their rate with the approach presented in this work, and obtain an upper limit of FRBs sky-1 day-1 above a flux density of 0.39 Jy. The upper bound of rate confidence interval we presented in this work is inconsistent with these upper limits. We suspect that this tension arises from the enhancement in search sensitivity resulting from our pipeline upgrades, notably the modifications made to the grouping algorithm and the more rigorous candidate visual inspection.
Our detection of FRB 20200125A, as well as previous observations of repeat bursts from FRB 180916.J0158+65 by Chawla et al. (2020) and Pilia et al. (2020), demonstrate that any frequency cutoffs invoked in bursting mechanisms for FRBs must be occur below 300 MHz. Moreover, the local environment of at least some FRBs must be optically thin to free-free absorption. Similarly to the observations reported by Chawla et al. (2020) and Pilia et al. (2020), our strict constraint on the observable scattering for the source, ms, at 350 MHz also suggests that the circumburst environment of FRB 200125A does not have strong scattering properties.
We plan follow-up observations of FRB 20200125A to search for repeat bursts which would remove any ambiguity regarding its cosmic nature, and potentially enable an interferometric localization. We also continue our search for FRBs in new GBNCC pointings, and plan on reprocessing pointings that were searched with earlier versions of the pipeline.
Acknowledgements
The Green Bank Observatory is a facility of the National Science Foundation (NSF) operated under cooperative agreement by Associated Universities, Inc. The CyberSKA project was funded by a CANARIE NEP-2 grant. Computations were made on the supercomputers Guillimin and Béluga in Montréal, managed by Calcul Québec and Compute Canada. The operation of this supercomputer is funded by the Canada Foundation for Innovation (CFI), NanoQuébec, RMGA and the Fonds de recherche du QuébecNature et technologies (FRQ-NT).
EP is a Vanier Canada Graduate Scholar. PC is a recipient of the FRQ-NT Doctoral Research Award. VMK acknowledges the NSERC Discovery Grant, the Herzberg Award, FRQ-NT and the Centre de recherches en astrophysique du Québec (CRAQ), the Canadian Institute For Advanced Research (CIFAR) and the Webster Foundation Fellowship, a Distinguished James McGill Chair and the Trottier Chair in Astrophysics and Cosmology. JvL acknowledges funding from the European Research Council under the European Union’s Seventh Framework Programme (FP/2007-2013) / ERC Grant Agreement n. 617199 (‘ALERT’), and from Vici research programme ‘ARGO’ with project number 639.043.815, financed by the Dutch Research Council (NWO). Pulsar research at UBC is supported by an NSERC Discovery Grant and by CIFAR. DLK, JKS, MD, MM, SMR and XS acknowledge the NANOGrav Physics Frontiers Center, which is supported by the NSF award 1430284. EFL, MM and MS acknowledge the NSF OIA award number 1458952. IHS and SMR are CIFAR Senior Fellows.
References
- Bannister et al. (2019) Bannister, K. W., Deller, A. T., Phillips, C., et al. 2019, Science, 365, 565
- Barthelmy et al. (2020) Barthelmy, S. D., Bernardini, M. G., D’Avanzo, P., et al. 2020, GRB Coordinates Network, 27657, 1
- Becker et al. (1995) Becker, R. H., White, R. L., & Helfand, D. J. 1995, ApJ, 450, 559
- Bhandari et al. (2018) Bhandari, S., Keane, E. F., Barr, E. D., et al. 2018, MNRAS, 475, 1427
- Bochenek et al. (2020) Bochenek, C., Kulkarni, S., Ravi, V., et al. 2020, The Astronomer’s Telegram, 13684, 1
- Chatterjee et al. (2017) Chatterjee, S., Law, C. J., Wharton, R. S., et al. 2017, Nature, 541, 58
- Chawla et al. (2017) Chawla, P., Kaspi, V. M., Josephy, A., et al. 2017, ApJ, 844, 140
- Chawla et al. (2020) Chawla, P., Andersen, B. C., Bhardwaj, M., et al. 2020, arXiv e-prints, arXiv:2004.02862
- CHIME/FRB Collaboration et al. (2018) CHIME/FRB Collaboration, Amiri, M., Bandura, K., et al. 2018, ApJ, 863, 48
- CHIME/FRB Collaboration et al. (2019a) CHIME/FRB Collaboration, Andersen, B. C., Bandura, K., et al. 2019a, ApJ, 885, L24
- CHIME/FRB Collaboration et al. (2019b) CHIME/FRB Collaboration, Amiri, M., Bandura, K., et al. 2019b, Nature, 566, 230
- CHIME/FRB Collaboration et al. (2020) CHIME/FRB Collaboration, Amiri, M., Andersen, B. C., et al. 2020, arXiv e-prints, arXiv:2001.10275
- Coenen et al. (2014) Coenen, T., van Leeuwen, J., Hessels, J. W. T., et al. 2014, A&A, 570, A60
- Condon et al. (1998) Condon, J. J., Cotton, W. D., Greisen, E. W., et al. 1998, AJ, 115, 1693
- Condon et al. (1999) Condon, J. J., Kaplan, D. L., & Terzian, Y. 1999, ApJS, 123, 219
- Cordes & Lazio (2003) Cordes, J. M., & Lazio, T. J. W. 2003, arXiv e-prints, astro
- Cordes & McLaughlin (2003) Cordes, J. M., & McLaughlin, M. A. 2003, ApJ, 596, 1142
- Cordes et al. (2006) Cordes, J. M., Freire, P. C. C., Lorimer, D. R., et al. 2006, ApJ, 637, 446
- Dálya et al. (2018) Dálya, G., Galgóczi, G., Dobos, L., et al. 2018, MNRAS, 479, 2374
- Deller et al. (2019) Deller, A. T., Goss, W. M., Brisken, W. F., et al. 2019, ApJ, 875, 100
- Deneva et al. (2016) Deneva, J. S., Stovall, K., McLaughlin, M. A., et al. 2016, ApJ, 821, 10
- Eatough et al. (2009) Eatough, R. P., Keane, E. F., & Lyne, A. G. 2009, MNRAS, 395, 410
- Farah et al. (2019) Farah, W., Flynn, C., Bailes, M., et al. 2019, MNRAS, 488, 2989
- Fletcher & Fermi GBM Team (2020) Fletcher, C., & Fermi GBM Team. 2020, GRB Coordinates Network, 27659, 1
- Fonseca et al. (2020) Fonseca, E., Andersen, B. C., Bhardwaj, M., et al. 2020, ApJ, 891, L6
- Frew et al. (2013) Frew, D. J., Bojičić, I. S., & Parker, Q. A. 2013, MNRAS, 431, 2
- Gajjar et al. (2018) Gajjar, V., Siemion, A. P. V., Price, D. C., et al. 2018, ApJ, 863, 2
- Gaustad et al. (2001) Gaustad, J. E., McCullough, P. R., Rosing, W., & Van Buren, D. 2001, PASP, 113, 1326
- Haslam et al. (1982) Haslam, C. G. T., Salter, C. J., Stoffel, H., & Wilson, W. E. 1982, A&AS, 47, 1
- Hessels et al. (2007) Hessels, J. W. T., Ransom, S. M., Stairs, I. H., Kaspi, V. M., & Freire, P. C. C. 2007, ApJ, 670, 363
- Hessels et al. (2019) Hessels, J. W. T., Spitler, L. G., Seymour, A. D., et al. 2019, ApJ, 876, L23
- James et al. (2019) James, C. W., Bannister, K. W., Macquart, J. P., et al. 2019, PASA, 36, e009
- Josephy et al. (2019) Josephy, A., Chawla, P., Fonseca, E., et al. 2019, ApJ, 882, L18
- Karako-Argaman et al. (2015) Karako-Argaman, C., Kaspi, V. M., Lynch, R. S., et al. 2015, ApJ, 809, 67
- Karastergiou et al. (2015) Karastergiou, A., Chennamangalam, J., Armour, W., et al. 2015, MNRAS, 452, 1254
- Kiddle et al. (2011) Kiddle, C., Andrecut, M., Brazier, A., et al. 2011, in Astronomical Society of the Pacific Conference Series, Vol. 442, Astronomical Data Analysis Software and Systems XX, ed. I. N. Evans, A. Accomazzi, D. J. Mink, & A. H. Rots, 669
- Kirsten et al. (2020) Kirsten, F., Snelders, M., Jenkins, M., et al. 2020, arXiv e-prints, arXiv:2007.05101
- Kulkarni et al. (2014) Kulkarni, S. R., Ofek, E. O., Neill, J. D., Zheng, Z., & Juric, M. 2014, ApJ, 797, 70
- Kumar et al. (2019) Kumar, P., Shannon, R. M., Osłowski, S., et al. 2019, ApJ, 887, L30
- Macquart et al. (2020) Macquart, J. P., Prochaska, J. X., McQuinn, M., et al. 2020, Nature, 581, 391
- Manchester et al. (2005) Manchester, R. N., Hobbs, G. B., Teoh, A., & Hobbs, M. 2005, AJ, 129, 1993
- Marcote et al. (2020) Marcote, B., Nimmo, K., Hessels, J. W. T., et al. 2020, Nature, 577, 190
- McKinnon (2014) McKinnon, M. M. 2014, PASP, 126, 476
- Michilli et al. (2018) Michilli, D., Seymour, A., Hessels, J. W. T., et al. 2018, in American Astronomical Society Meeting Abstracts, Vol. 231, American Astronomical Society Meeting Abstracts #231, 243.18
- Oster (1961) Oster, L. 1961, Rev. Mod. Phys., 33, 525
- Palmer (2020) Palmer, D. M. 2020, The Astronomer’s Telegram, 13675, 1
- Parent et al. (2018) Parent, E., Kaspi, V. M., Ransom, S. M., et al. 2018, ApJ, 861, 44
- Parker et al. (2016) Parker, Q. A., Bojičić, I. S., & Frew, D. J. 2016, in Journal of Physics Conference Series, Vol. 728, Journal of Physics Conference Series, 032008
- Patel et al. (2018) Patel, C., Agarwal, D., Bhardwaj, M., et al. 2018, ApJ, 869, 181
- Petroff et al. (2019) Petroff, E., Hessels, J. W. T., & Lorimer, D. R. 2019, A&A Rev., 27, 4
- Petroff et al. (2016) Petroff, E., Barr, E. D., Jameson, A., et al. 2016, PASA, 33, e045
- Pilia et al. (2020) Pilia, M., Burgay, M., Possenti, A., et al. 2020, arXiv e-prints, arXiv:2003.12748
- Platts et al. (2019) Platts, E., Weltman, A., Walters, A., et al. 2019, Phys. Rep., 821, 1
- Preite-Martinez (1988) Preite-Martinez, A. 1988, A&AS, 76, 317
- Prochaska & Zheng (2019) Prochaska, J. X., & Zheng, Y. 2019, MNRAS, 485, 648
- Prochaska et al. (2019) Prochaska, J. X., Macquart, J.-P., McQuinn, M., et al. 2019, Science, 366, 231
- Rajwade et al. (2020) Rajwade, K. M., Mickaliger, M. B., Stappers, B. W., et al. 2020, MNRAS, 493, 4418
- Ransom (2001) Ransom, S. M. 2001, PhD thesis, Harvard University
- Ravi & Loeb (2019) Ravi, V., & Loeb, A. 2019, ApJ, 874, 72
- Ravi et al. (2019) Ravi, V., Catha, M., D’Addario, L., et al. 2019, arXiv e-prints, arXiv:1907.01542
- Remazeilles et al. (2015) Remazeilles, M., Dickinson, C., Banday, A. J., Bigot-Sazy, M. A., & Ghosh, T. 2015, MNRAS, 451, 4311
- Reynolds et al. (1998) Reynolds, R. J., Tufte, S. L., Haffner, L. M., Jaehnig, K., & Percival, J. W. 1998, PASA, 15, 14
- Rowlinson et al. (2016) Rowlinson, A., Bell, M. E., Murphy, T., et al. 2016, MNRAS, 458, 3506
- Rybicki & Lightman (1979) Rybicki, G. B., & Lightman, A. P. 1979, Radiative processes in astrophysics (A Wiley-Interscience Publication)
- Scholz & CHIME/FRB Collaboration (2020) Scholz, P., & CHIME/FRB Collaboration. 2020, The Astronomer’s Telegram, 13681, 1
- Scholz et al. (2016) Scholz, P., Spitler, L. G., Hessels, J. W. T., et al. 2016, ApJ, 833, 177
- Spitler et al. (2014) Spitler, L. G., Cordes, J. M., Hessels, J. W. T., et al. 2014, ApJ, 790, 101
- Spitler et al. (2016) Spitler, L. G., Scholz, P., Hessels, J. W. T., et al. 2016, Nature, 531, 202
- Stovall et al. (2014) Stovall, K., Lynch, R. S., Ransom, S. M., et al. 2014, ApJ, 791, 67
- ter Veen et al. (2019) ter Veen, S., Enriquez, J. E., Falcke, H., et al. 2019, A&A, 621, A57
- Tingay et al. (2015) Tingay, S. J., Trott, C. M., Wayth, R. B., et al. 2015, AJ, 150, 199
- Toba et al. (2014) Toba, Y., Oyabu, S., Matsuhara, H., et al. 2014, ApJ, 788, 45
- Wright et al. (2010) Wright, E. L., Eisenhardt, P. R. M., Mainzer, A. K., et al. 2010, AJ, 140, 1868
- Yao et al. (2017) Yao, J. M., Manchester, R. N., & Wang, N. 2017, The Astrophysical Journal, 835, 29
- Younes et al. (2020) Younes, G., Guver, T., Enoto, T., et al. 2020, The Astronomer’s Telegram, 13678, 1
- Zhang et al. (2020) Zhang, C. F., Jiang, J. C., Men, Y. P., et al. 2020, The Astronomer’s Telegram, 13699, 1