Non-radially pulsating stars as microlensing sources
Abstract
We study the microlensing of Non-Radially Pulsating (NRP) stars. Pulsations are formulated for stellar radius and temperature using spherical harmonic functions with different values of . The characteristics of the microlensing light curves from NRP stars are investigated in relation to different pulsation modes. For the microlensing of NRP stars, the light curve is not a simple multiplication of the magnification curve and the intrinsic luminosity curve of the source star, unless the effect of finite source size can be ignored. Three main conclusions can be drawn from the simulated light curves. First, for modes with and when the viewing inclination is more nearly pole-on, the stellar luminosity towards the observer changes little with pulsation phase. In this case, high-magnification microlensing events are chromatic and can reveal the variability of these source stars. Second, some combinations of pulsation modes produce nearly degenerate luminosity curves (e.g., ). The resulting microlensing light curves are also degenerate, unless the lens crosses the projected source. Finally, for modes involving , the stellar brightness centre does not coincide with the coordinate centre, and the projected source brightness centre moves in the sky with pulsation phase. As a result of this time-dependent displacement in the brightness centroid, the time of the magnification peak coincides with the closest approach of the lens to the brightness centre as opposed to the source coordinate centre. Binary microlensing of NRP stars and in caustic-crossing features are chromatic.
keywords:
gravitational lensing: micro, Variable stars: non-radial pulsating stars1 Introduction
Gravitational microlensing refers to the bending of the light beam of a background source star due its nearby passage through the gravitational potential of a foreground body of mass. In this phenomenon, owing to making two distorted images from the source star, the source brightness is temporarily magnified (Einstein, 1936; Paczynski, 1986). Gravitational microlensing is not only an astrophysical event, but also a diagnostic method with many applications, such as detecting extrasolar planets (Mao & Paczynski, 1991; Gaudi, 2012), measuring the mass distributions in our Galaxy and examining Galactic structures (Moniez et al., 2017; Dominik, 2006), and testing candidates for dark matter such as searching for Massive Compact Halo Objects (MACHOs) (Alcock et al., 2000; Tisserand et al., 2007).
In addition, microlensing acts as a magnifier that can serve to enlarge small perturbations in the atmospheres of distant stars, such as the magnified source stars located in the Galactic bulge (Sackett, 2001; Heyrovský et al., 2000; Sajadian, 2016). A few examples of such perturbations over a stellar surface include star spots, stellar oblateness, or circumstellar disks (Heyrovský & Loeb, 1997; Han et al., 2000; Gaudi & Haiman, 2004; Rattenbury et al., 2005; Zheng & Ménard, 2005; Rattenbury, 2009; Sajadian, 2015; Hendry et al., 2002). This paper seeks to explore such effects in terms of the intrinsic pulsational variability that many stars experience.
Variable stars are divided into several categories, such as extrinsic or intrinsic, regular or irregular. These classifications are based on the variability criteria, periods, the amplitude of variations, spectral type, and/or luminosity class. Properties of known variable stars are gathered in the General Catalogue of Variable stars (GCVS) (Samus et al., 1997; Samus et al., 2017) 111http://www.sai.msu.su/gcvs/gcvs/. The Optical Gravitational Lensing Experiment (OGLE) team has identified large ensembles of different kinds of variable stars both in and out of our Galaxy (Soszyński et al., 2010; Soszyński et al., 2013; Pietrukowicz et al., 2013; Soszyński et al., 2014). Extrinsic variables are mostly eclipsing binary or planetary systems (Derekas et al., 2007; Graczyk et al., 2011).
Among intrinsic variable stars, variation of stellar brightness is driven by physical phenomena taking place within the star itself, such as strong magnetism, stellar activity, precession of the rotational axis in ellipsoidal stars, eruption, etc. (see, e.g., Kahn, 1969; Cox, 1974; Percy, 2007; Catelan & Smith, 2015). Generally, intrinsic variable stars are divided into four subclasses: rotational variables, eruptive variables, explosive variables and finally pulsating variables. The latter is further divided into radial and non-radial pulsating stars. However, pulsating stars can be further subclassified according to their mass, evolutionary state, etc. The driver for stellar pulsation is the expansion of the stellar surface owing to blocking of internal energy flow and then restoring to its initial form owing to pressure (mode) or gravity (mode), with the cycle repeating in a periodic fashion. Oscillation in pulsating stars can happen with one fundamental frequency or with overtones involving several frequencies. For these stars, there is a relation between their period and mean mass density, so that the denser stars have shorter pulsational periods (Ritter, 1881).
Typically, surveys that monitor a star field for microlensing events will remove the variable stars to avoid confusing their variations with the effects of gravitational lensing (Assef et al., 2006). However, microlensing can magnify small perturbations in stellar atmospheres. Consequently, measurement of the light curves from pulsating variable stars that are undergoing microlensing can help discern the variability parameters (e.g., its period, amplitude, etc). When combined with asteroseismology, information can be obtained about the stellar interiors (one example is Li et al., 2019). In Sajadian & Ignace (2020, hereafter Paper I), we developed a formalism for microlensing of radially pulsating stars. We classified possible perturbations due to stellar pulsation in single and binary microlensing light curves and discussed the plausibility of determining the variability parameters in microlensing observations. Here, we expand that initial work to include non-radial pulsating stars as microlensing source stars.
The outline of the paper is as follows. In section 2, we introduce the formalism for describing NRP stars used in this paper. Also we discuss the pulsation of the stellar luminosity and its shape in different modes. In section 3, we revise the properties of microlensing light curves from NRPs in different pulsation modes. In section 4 we consider the binary lensing of NRP stars and investigate the characteristics of caustic-crossing binary light curves from these stars. In the last section we summarize the conclusions.
2 Modeling non-radial pulsations
The theory of non-radially pulsating stars was first studied by Thomson (1862). The theory continued to advance with a focus on modeling the radial variations from the stellar centre using spherical harmonic functions (see, e.g., Cowling, 1941; Dziembowski, 1977). We adopt these oscillatory functions for modeling the temperature and radial variations arising from NRPs with latitude and longitude about the star. Modification to the stellar radius, , in a given direction of co-latitude ( and azimuth ) over the stellar surface, with time , is represented as (Bonanno & Sereno, 2004):
| (1) |
where is the associated Legendre polynomial,
| (2) |
is the normalization factor of the spherical harmonics, is the amplitude of pulsation over the source surface which is normalized to , the mean value of the stellar radius over one pulsational cycle. Note that is the angular velocity associated with the pulsation period , and is an arbitrary time. We note that any local change in the stellar radius causes a corresponding variation in the stellar temperature, , which we formulate as follows:
| (3) |
where, is the amplitude of variation in the surface temperature due to the stellar pulsation, and is the phase difference between the variation in the stellar radius and its surface temperature. We fix (Carroll & Ostlie, 1996).
For the observer, the variation in brightness will depend on viewing inclination in relation to the projected pattern of NRPs. We introduce two coordinate systems. The first one is a source system for the star, with cartesian coordinates (), whose centre is the source centre. Each point over the source surface in this coordinate is specified as:
| (4) |
where . The second system is that of the observer, with cartesian coordinates (). In this system, the -axis is towards the observer and normal to the sky plane. the plane indicates the sky plane, and its centre coincides with the centre of the source coordinate system. One can convert the first system to the second by a rotation around with inclination angle , as follows:
| (5) |
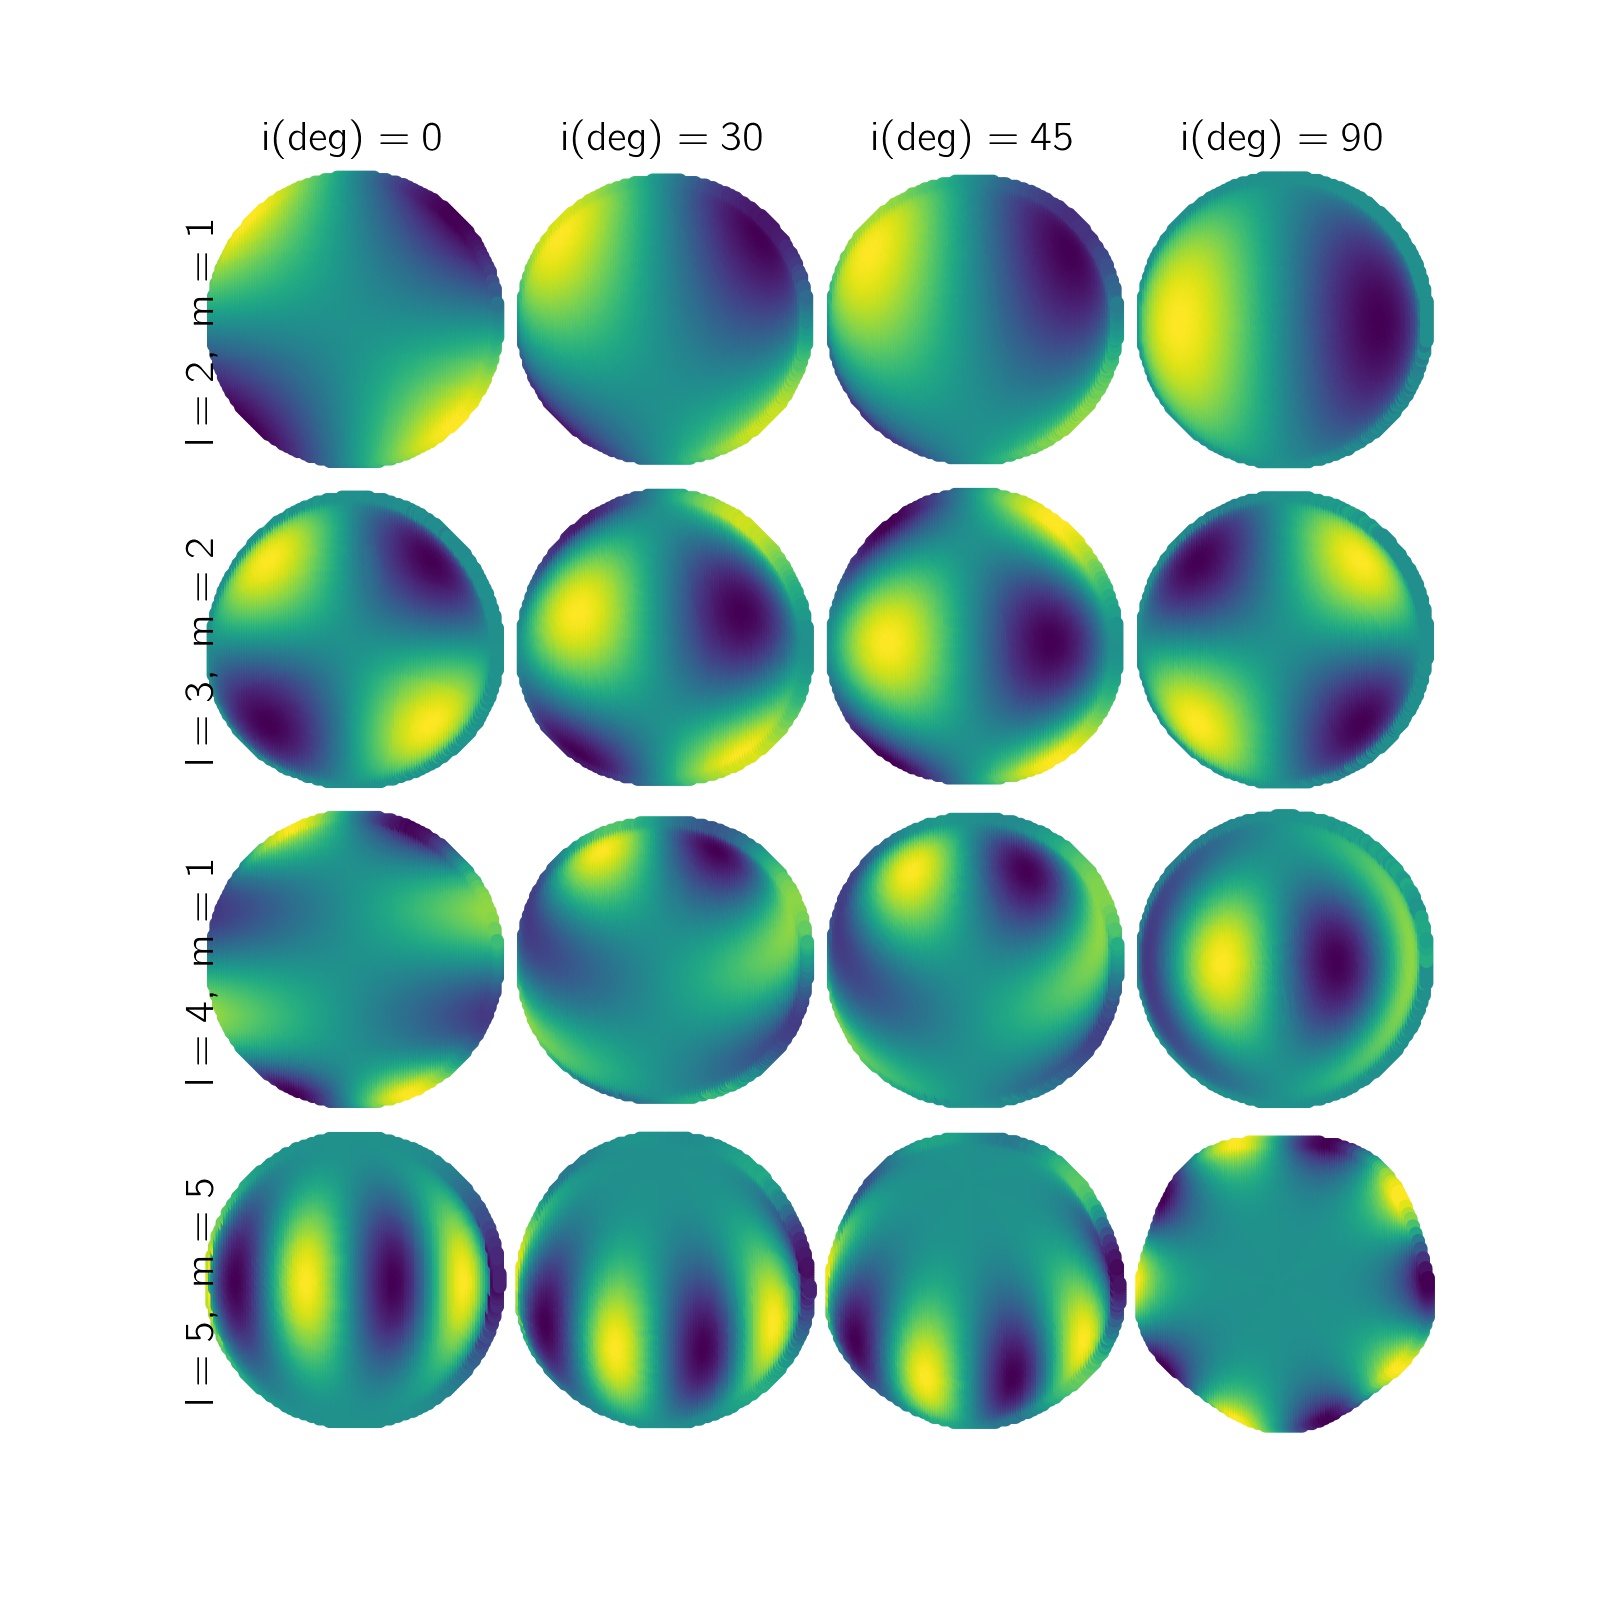
At any moment only those points can be seen by the observer and constitute the projected stellar surface on the sky plane. In Figure (1), we show several examples of non-radially pulsating stars as projected onto the sky as would be seen by a distant observer. From top to bottom, four different harmonic modes are displayed: . The columns moving from left to right are four different inclination angles: deg. The coloured features show the variation of the surface temperature. For these stellar pulsational modes, we chose , K, , and . In these plots the -axis is towards the right and is up. Rotation by the inclination angle is done around the -axis.
NRPs lead to 3 variations as perceived by an observer. The first is the emergent stellar luminosity in any given direction. Second is the projected area of the source star owing to the complex variations of radius with latitude and longitude. And third is the shape of the star. This is different from the projected area, as the shape represents alterations to the boundary of the star in the plane (e.g., the shape could change even if the area were constant; for NRPs, both are changing, whereas for radially pulsating stars only area changes with time). These three variations are studied in the following subsections.
2.1 Luminosity variations from NRPs
The luminosity of a star undergoing NRPs as a function of time is found from integrating the stellar intensity over the projected stellar surface visible to the observer. Similar to the formalism which was introduced in Paper I, we assume that each element of the stellar surface radiates as a blackbody with the intrinsic surface intensity, . The integration becomes:
| (6) | |||||
where the index signifies that no lensing effect is involved yet, consequently is the area of each element on the stellar surface projected onto the sky plane; is the throughput function for the passband filter under consideration; and is the average value of the stellar surface temperature. The integration is complicated by the fact that the star is misshapen and not circular in projection. For this task, we apply the method of ’inverse ray shooting’ (Schneider et al., 1992; Schechter & Wambsganss, 2002).
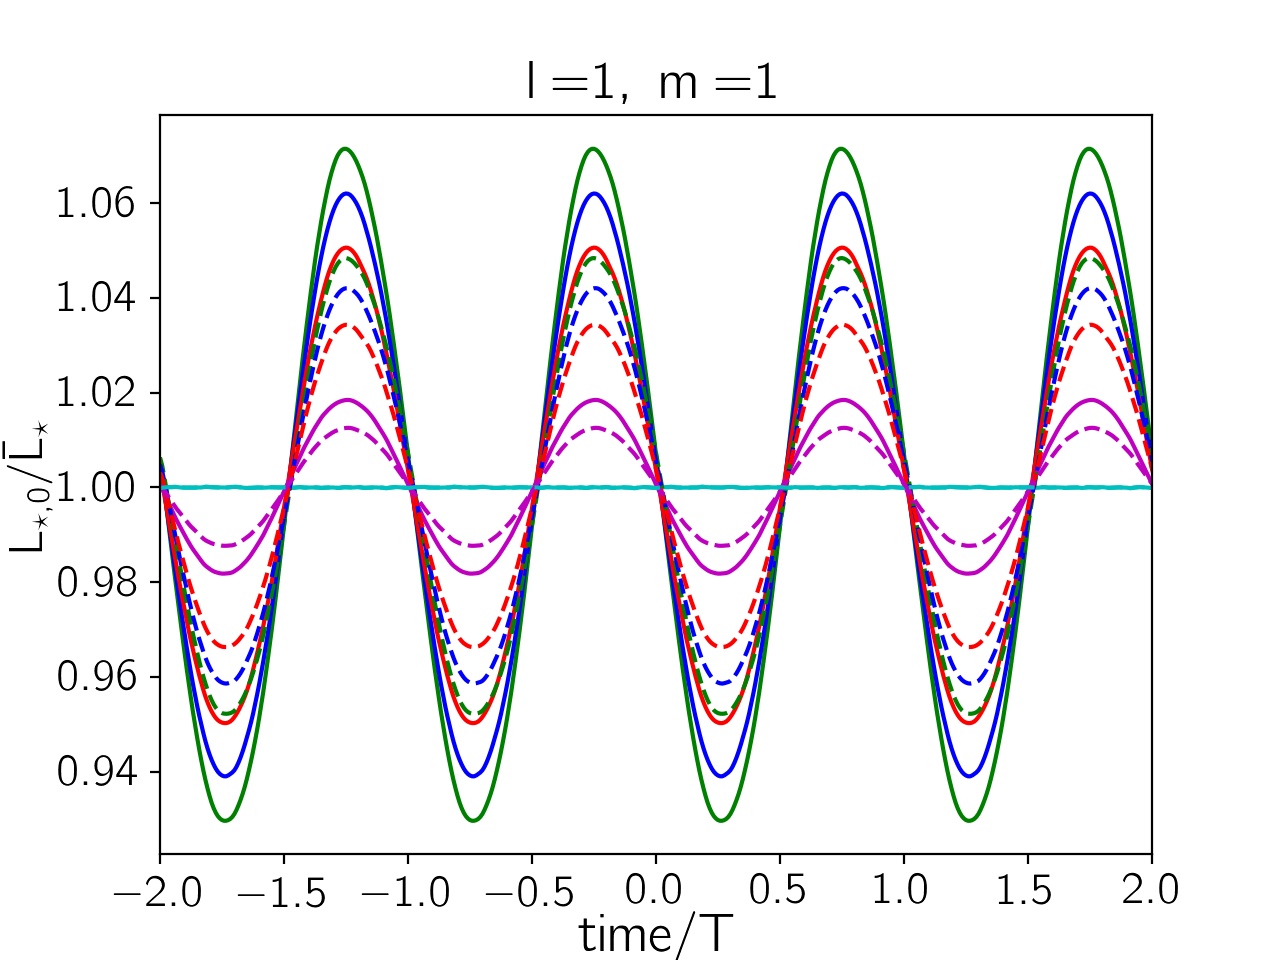
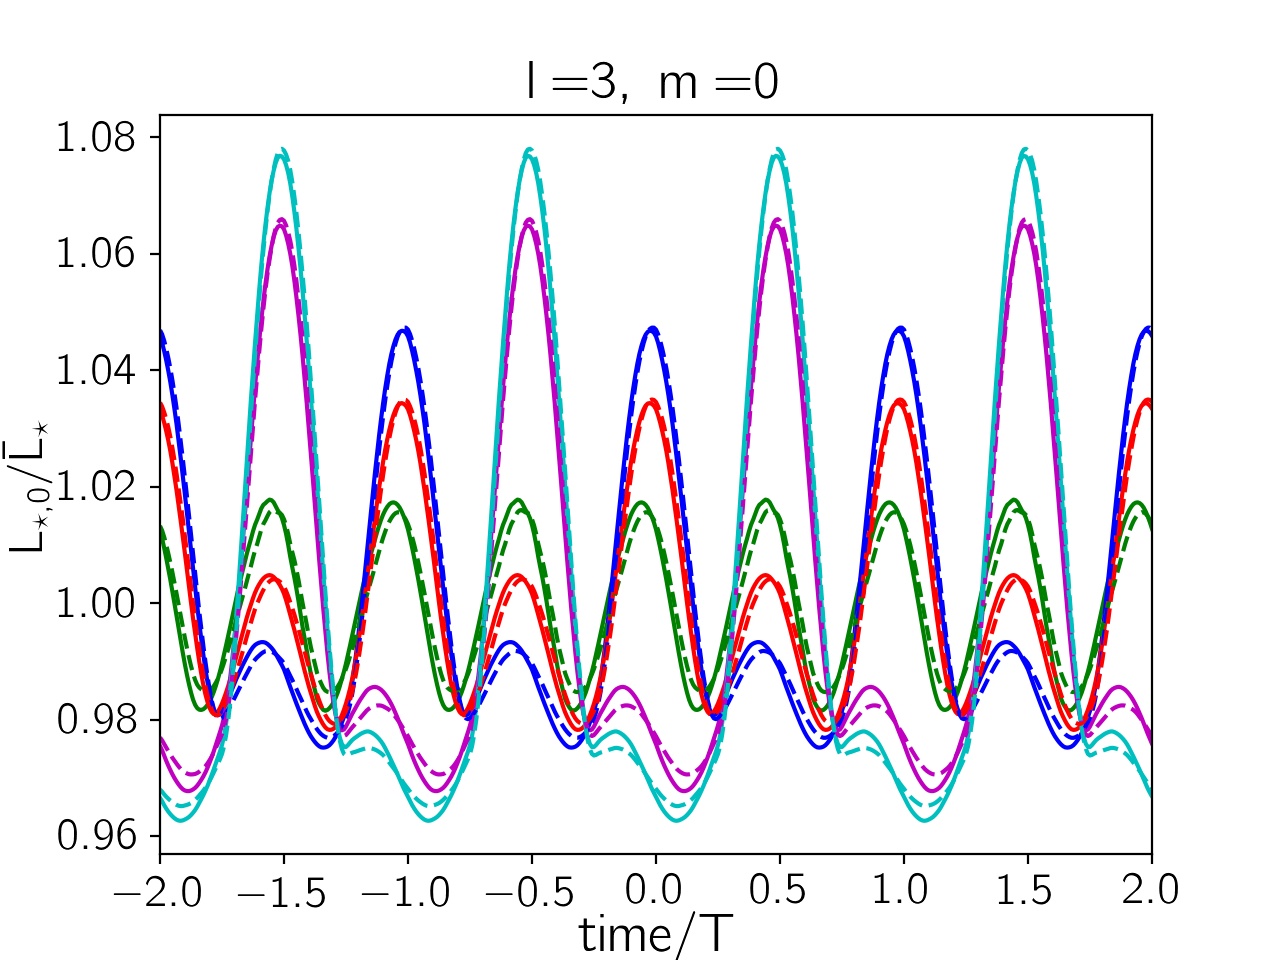
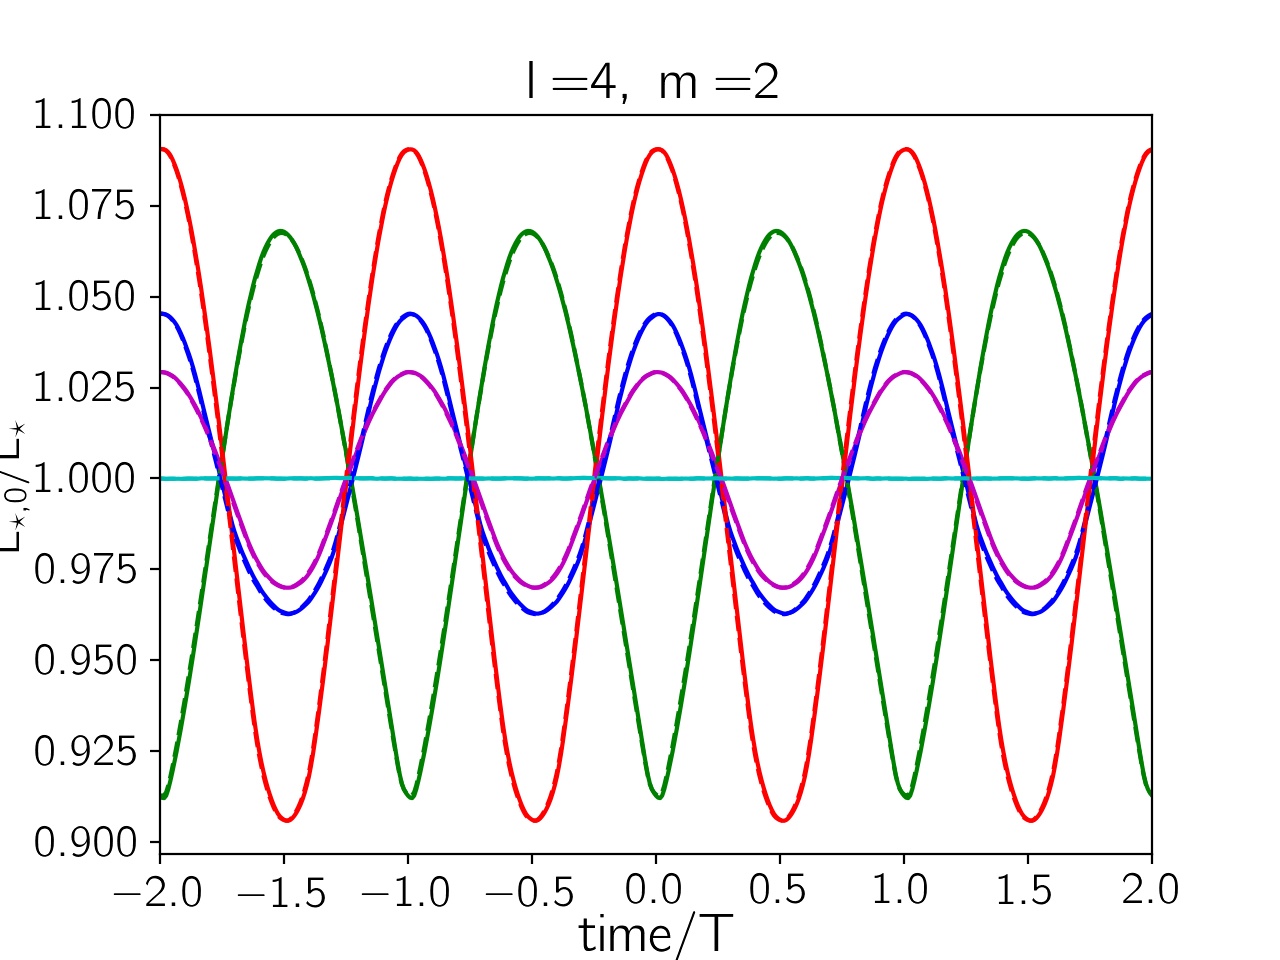
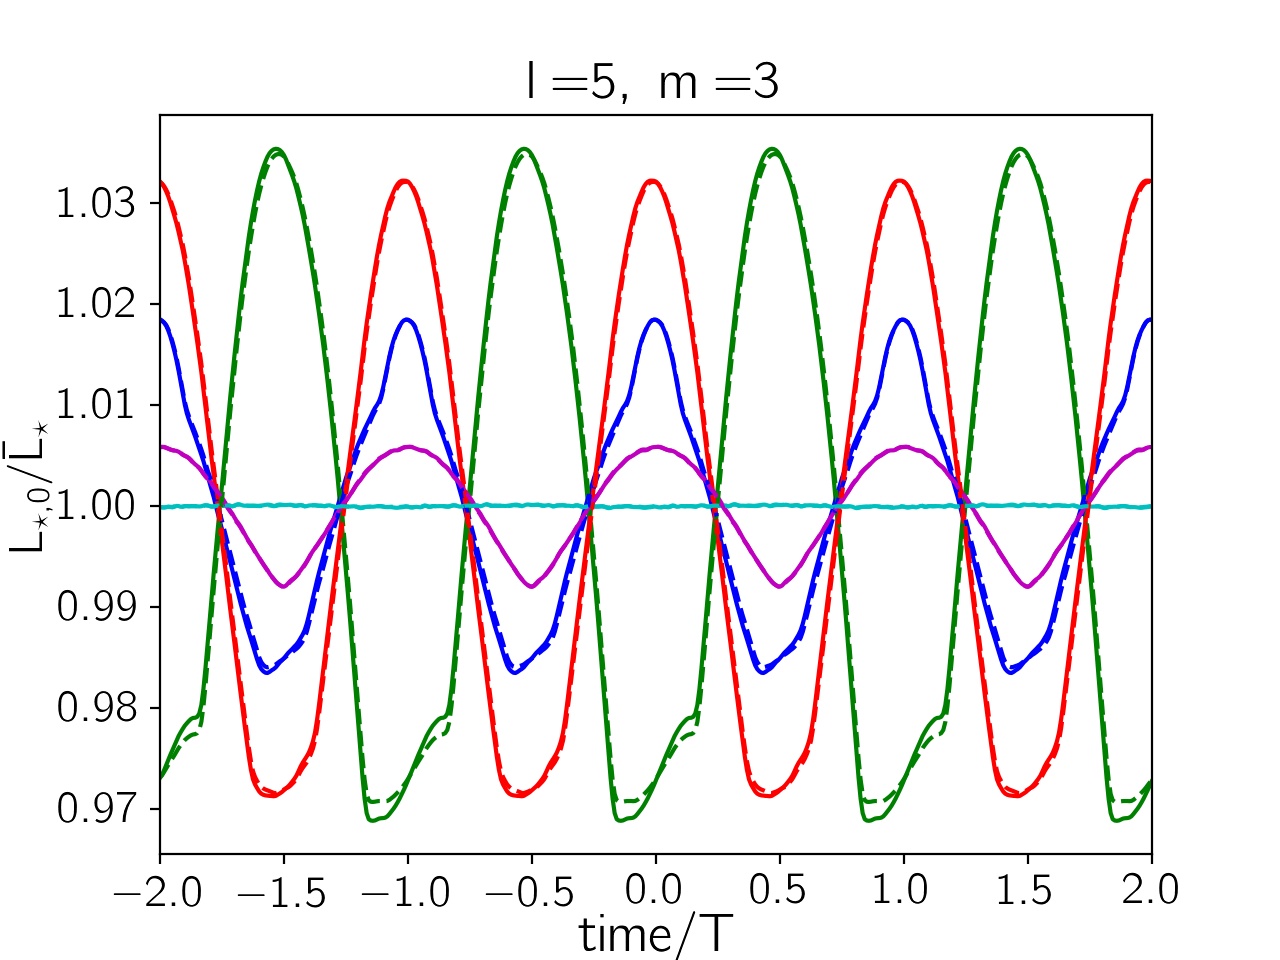
For four non-radially pulsating stars with different inclination angles, , their normalized luminosity curves, , are plotted in Figure (2) in standard filters (solid curves) and (dashed curves). Here, is the average value of the stellar luminosity over one pulsational period, :
| (7) |
Lightcurves for inclination angles deg are displayed with green, blue, red, magenta and cyan colours, respectively. The variations of the stellar radius and its surface temperature drives changes in the stellar luminosity with time.
Key points regarding these curves are listed as follows:
-
1.
All curves have periodic behavior, but the variations are not simple sinusoidal forms, except for modes . Hence, these modes are degenerate and discerning their pulsation modes, when the stars are distant, essentially point-like, is impossible. Figure 2 presents the lightcurves for a NRP star with that shows the lightcurve to have a simple sinusoidal function.
-
2.
For deg, the observer sees the plane of the star. In this case the projected surface of the source star as seen by the observer will appear to rotate around (for ), with rotations per pulsational period. The rotation of the source surface does not alter the luminosity as seen by the observer; as for example in Figures 2, 2, 2.
-
3.
When and the stellar pole is towards the observer, the net stellar surface brightness decreases by the factor and causes a periodic pulsation with the largest amplitude (with respect to other value of the inclination angle). An example for the mode is shown in Figure 2. We note that generally in modes with , the luminosity curves for any values of the inclination angle vary in a periodic manner with nonzero amplitude.
-
4.
The variations of the stellar luminosity in different filters for NRP stars are not as high as for stars that are radial pulsators. For NRPs, sectors with increased and decreased temperatures lead to a surface-averaged value that has less variation in comparison to a star undergoing radial pulsations. However, for the modes , the stellar luminosity in different filters can have considerable differences, as in the example of Figure 2.
-
5.
The amplitude of the lightcurves in different pulsation modes generally depends on the inclination angle. The maximum amplitude of variation is achieved at viewing inclinations associated with the stellar latitude at which the Legendre polynomial displays a maximum. If that latitude is , then the variation is maximized for inclination . Because when the stellar surface is projected on the sky plane, the points over the equator have . These points have the largest impact on the stellar luminosity. As an example, the Legandre function for the mode is proportional to which is maximized for deg. Hence, the maximum amplitude of the luminosity happens for deg.
-
6.
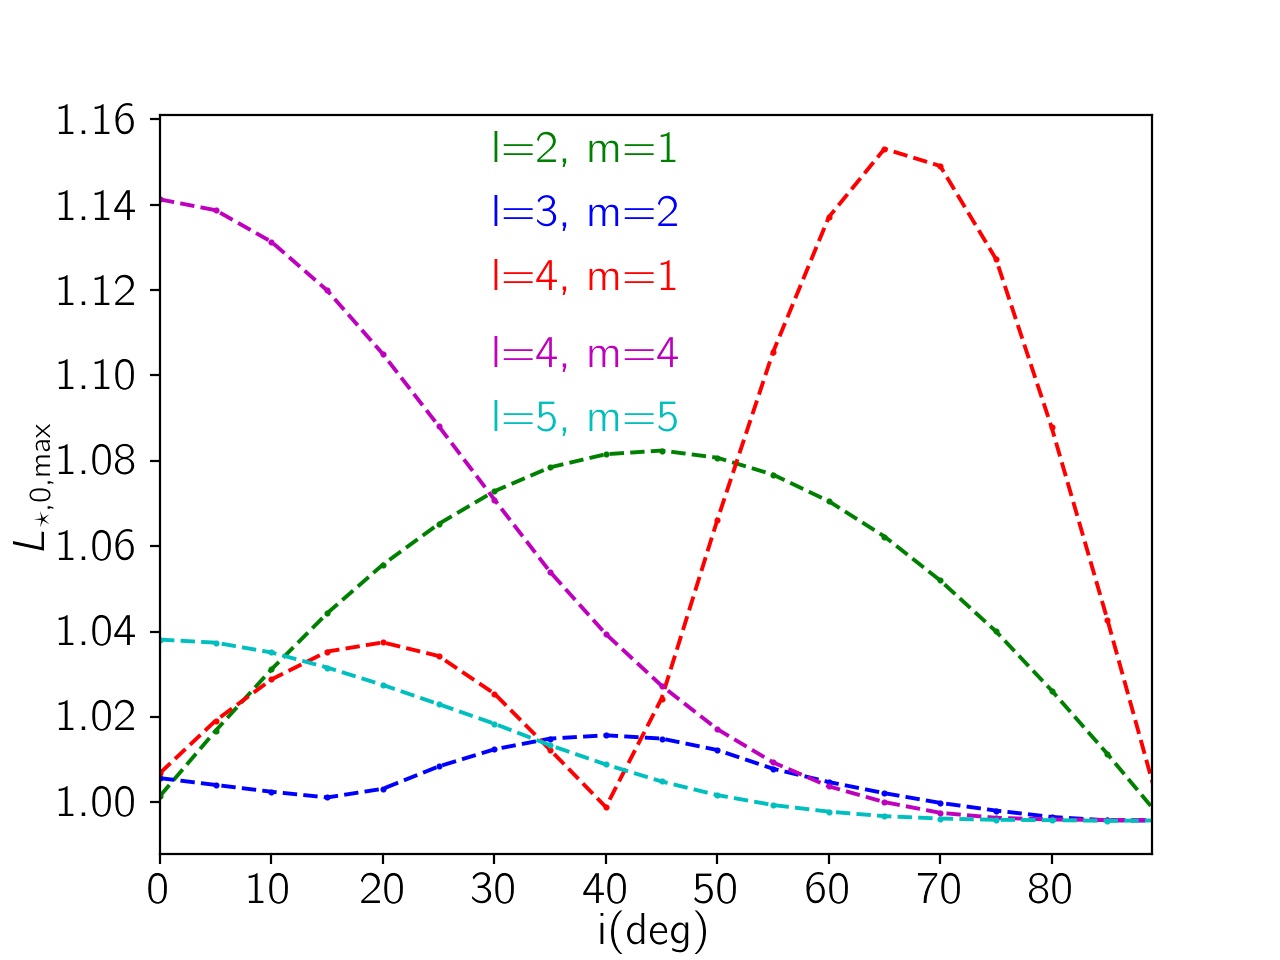
We study the luminosity curves for all pulsation modes with . In order to compare the amplitudes of the luminosity curves, we fix the pulsation parameters at K and when . In the top panel of Figure 3, we show the amplitude of the luminosity curve of NRPs versus the inclination angle for the following pulsation modes, , , , , with green, blue, red, magenta and cyan colours, respectively. Accordingly, the maximum amplitude for the luminosity curve was for the mode for all inclination angles which is exactly a radial pulsating star. The second and third maximum amplitude of the luminosity curves is for the mode at the inclination angle deg, (pole-on view).
-
7.
For a fixed value of , the amplitude of the luminosity curves decreases by increasing the value from zero to . This means that for all modes with fixed , the mode with produces the largest amplitude for the intrinsic luminosity curve.
2.2 Shape variations from NRPs
For a star undergoing NRPs, the shape of the star as seen by the observer is not always circular. The degree of asymmetry in its shape depends on both the inclination angle and the pulsation mode (), and the amount of distortion scales with the factor . In order to study the amount of asymmetry in the shape of stars undergoing NRPs, we define a reshape factor as:
| (9) |
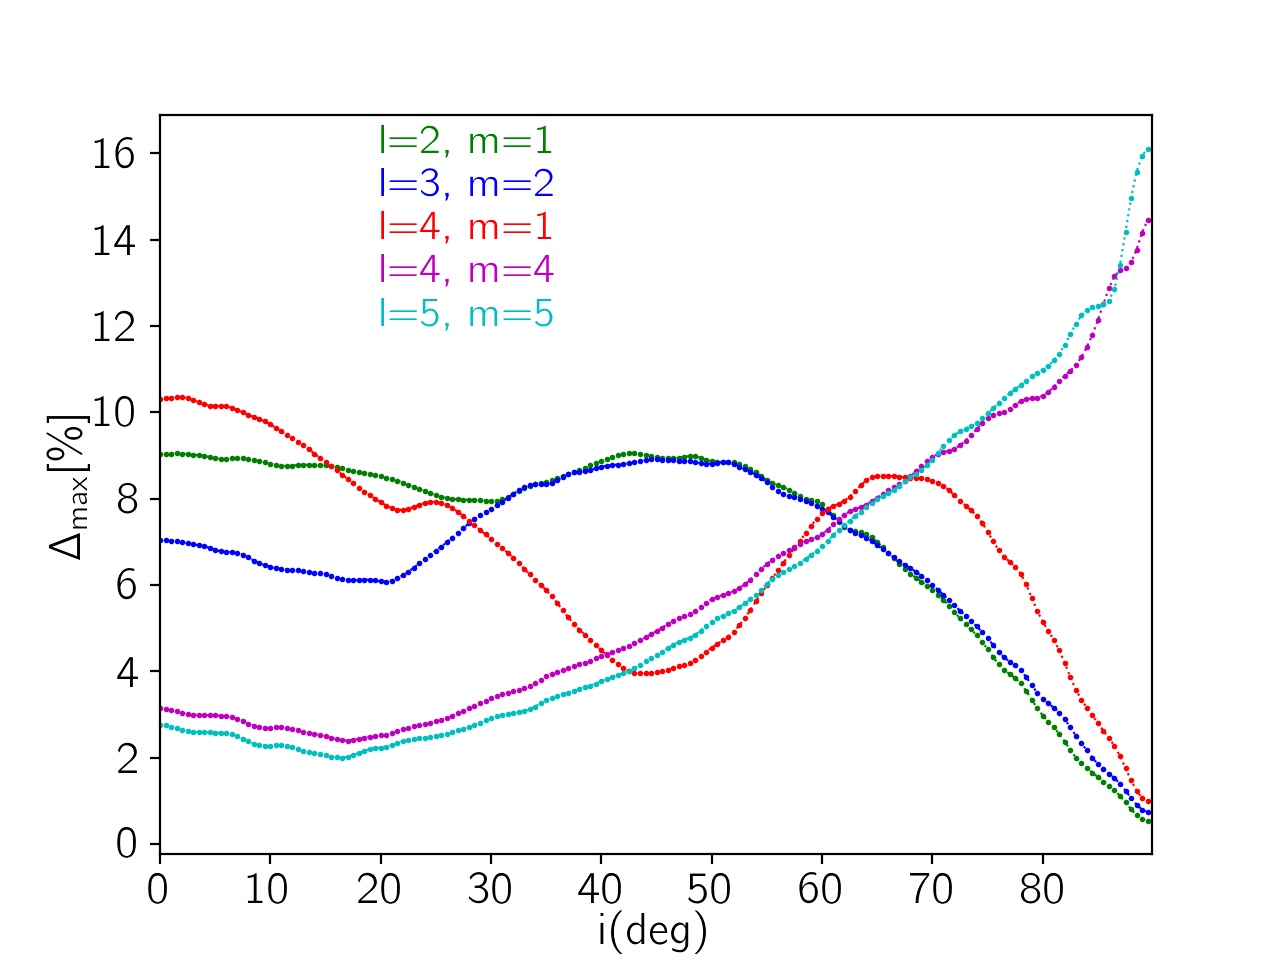
which is the average of the positive-definite relative difference of the stellar radius of each point at the stellar edge (for which is zero) from the average source radius. For these points we have . This parameter is a measure for how much the stellar shape differs from a circle of average radius . For harmonic functions with , , , and , we evaluate numerically as a percent with results shown in the bottom panel of Figure (3), using . Comparing the magnitudes of the reshape factor for different modes is meaningful here, because is fixed for all the modes. We note that the reshape factor is generally time-dependent and varies periodically. The following are several key points based on Figure (3).
-
1.
Generally, when the polar axis of the source star is directed towards the observer (), for pulsating modes involving Legendre polynomials that are proportional to (for any value of ), there is no variation in the projected area of the source star. This arises because the observer views the plane, and the edge points have deg. The relevant modes are , , , , , , , and .
-
2.
When the inclination angle is deg, the modes with produce the largest reshape factors. For , the reshape for these modes is . For these modes , giving an amplitude of variation in the stellar radius that is maximum (see the last row of Fig. 1). By contrast, observing at deg yields reshape factors with very small values for these same modes.
-
3.
The local maxima of the amplitudes of the reshape function for each mode correspond to where the points over the stellar pole as seen by the observer (i.e., ) have the maximum domain of the variation. This condition corresponds to the Legendre function having a maximum. For instance, is maximized at deg. Hence its reshape factor is likewise greatest at deg (green curve in the bottom panel of Fig. 3).
-
4.
The local minima of the amplitudes of the reshape function occur when the stellar points over the stellar equator as seen by the observer (i.e., ) have the maximum domain of the variation. This condition corresponds to the maximum value for the Legendre function. For instance, is maximized when deg. Hence its reshape factor is likewise greatest at deg. Correspondingly, its minimum value will be achieved for deg.
2.3 Areal variations from NRPs
NRPs also cause the source area to evolve over time. The enhancement in the projected stellar area is maximum for modes with even, , and pole-on views (). Then the source star has circular symmetry, with a radius given by ). For these modes and for the pole-on view, the amplitude of the stellar luminosity maximize as well. The largest expansion happens for the mode with which is just a radially pulsating star. Generally, when the source area is enhanced, its luminosity increases as well.
In order to investigate the effects of microlensing of stars with NRPs, we now include the magnification factor for each element of source surface while evaluating the stellar luminosity in equation (6). The magnified luminosity for a star undergoing NRPs is given by:
| (10) | |||||
Here, is the magnification factor of each element of the source surface. The coordinates specify the normalized position of each areal element on the source surface with respect to the lens location, as given by:
| (11) |
where is the Einstein radius as projected onto the source plane. Consequently, specify the projected position of the lens with respect to the projected source centre and are normalized to the Einstein radius. We define the observed magnification factor as the magnified stellar luminosity normalized to the stellar average obtained over a full pulsation cycle:
| (12) |
In this paper, our goal is to study the behavior of the
time-dependent total magnification for different NRP modes
and classify the perturbations induced by stellar pulsation in the
microlensing light curves.
3 Single microlensing of non-radially pulsating stars
The first microlensing event of a variable source star was discovered in 1997 towards the Small Magellanic Clouds (SMC), namely --- (Alcock et al., 1997). In this event the variability was used to break the blending-parallax degeneracy (Assef et al., 2006). In their microlensing survey, the OGLE collaboration probed the microlensing candidates of variable source stars and discovered 137 candidates (Wyrzykowski et al., 2006). Recently, another microlensing candidate from a variable and bright source star was reported. For this event, the asteroseismic analysis was done to find the intrinsic variability curve of the source star from the baseline data (Li et al., 2019). These candidates reveal the importance of investigating the characteristics of microlensing light curves of variable starts.
For this study we consider the influence of microlensing for stars undergoing NRPs. A large ensemble of simulated events have been explored. Parameters for the lens and source stars are chosen using distribution functions described in previous papers (c.f., Sajadian & Poleski, 2019). The pulsation parameters are chosen uniformly in these ranges: the pulsation period days, , K, . The simulation of the microlensing light curves are done in the time interval , where is the crossing time of the source radius by the lens.
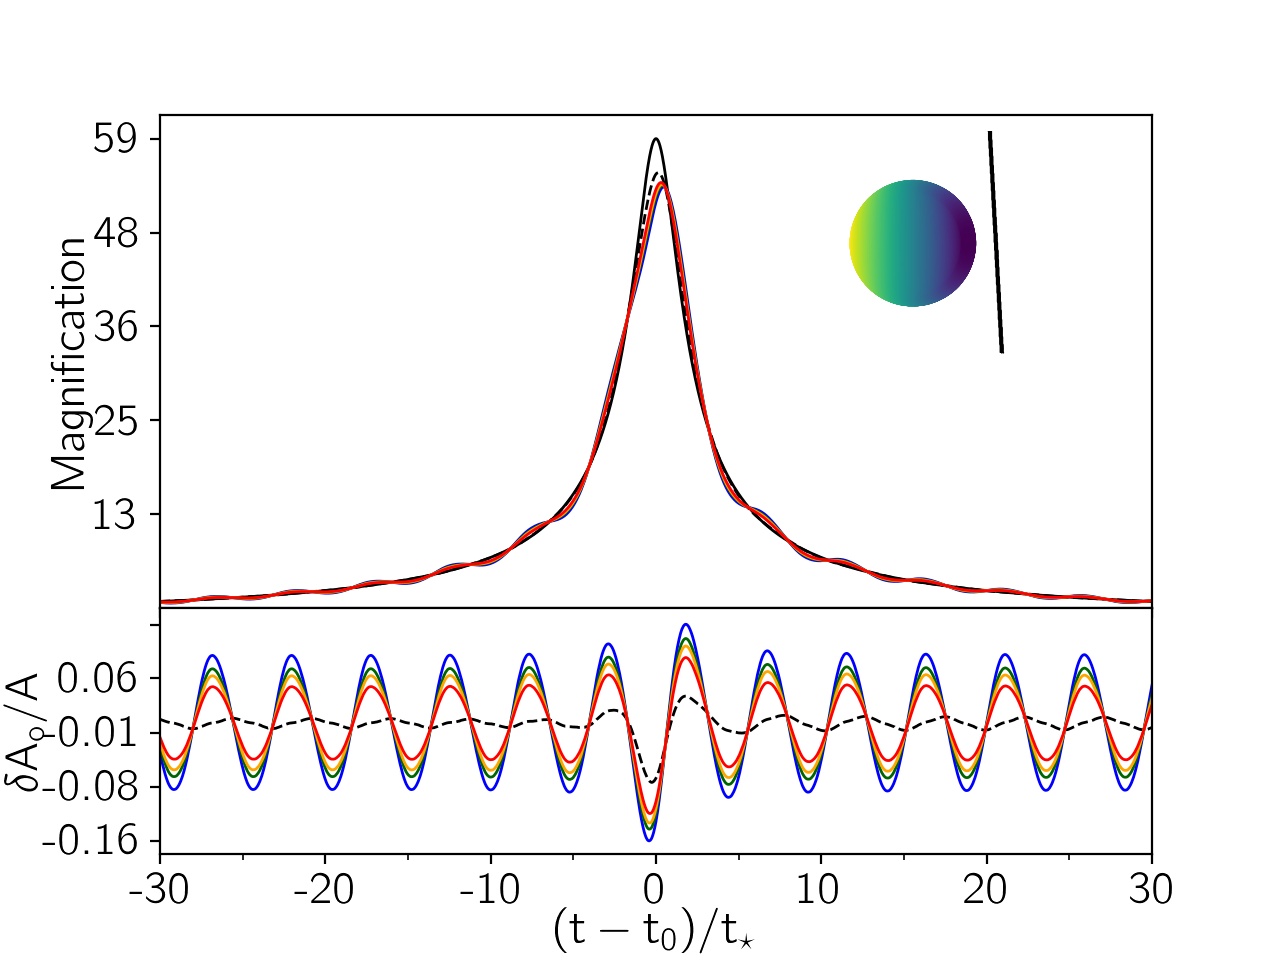
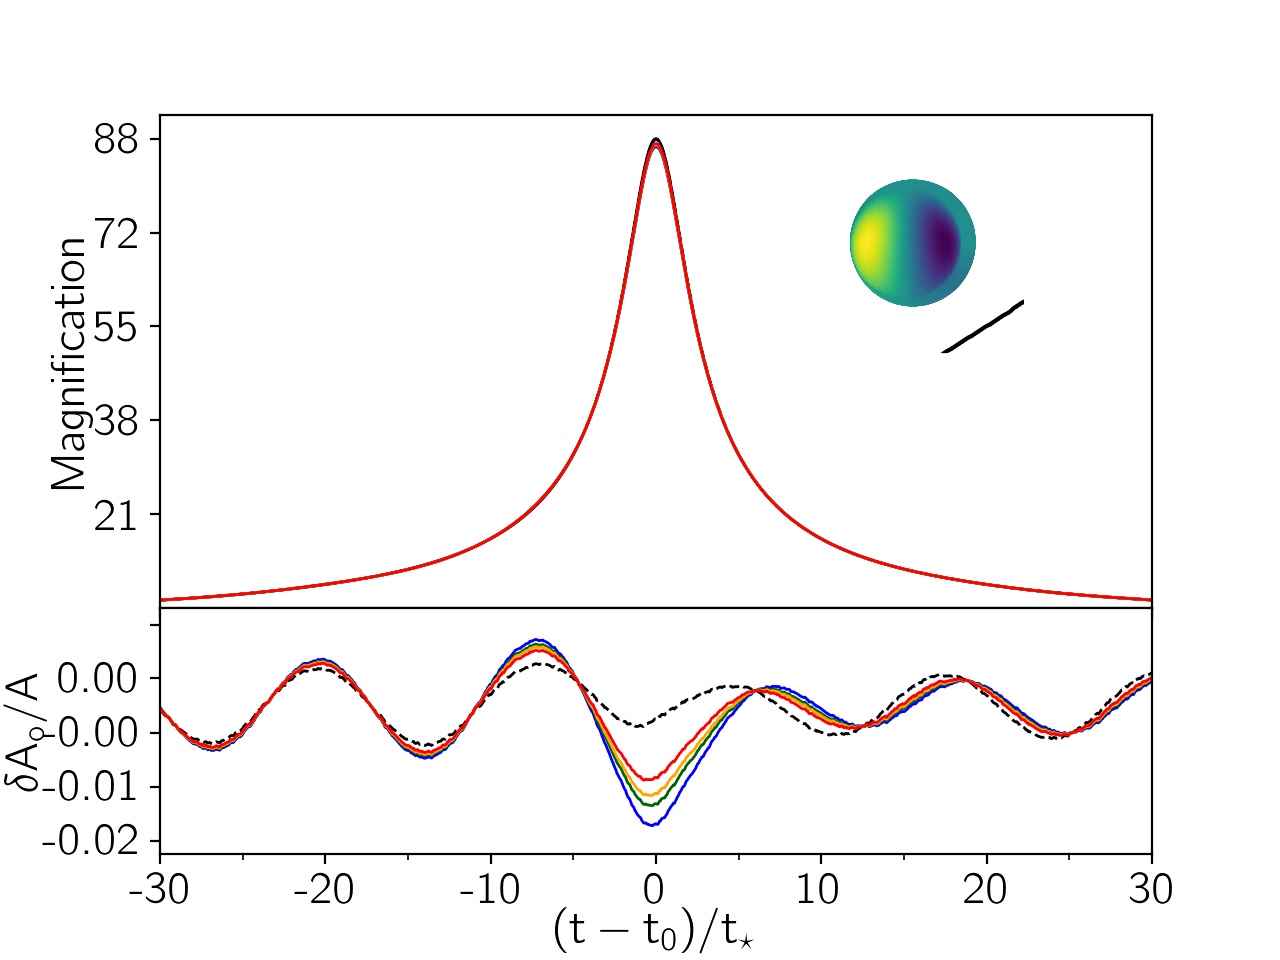
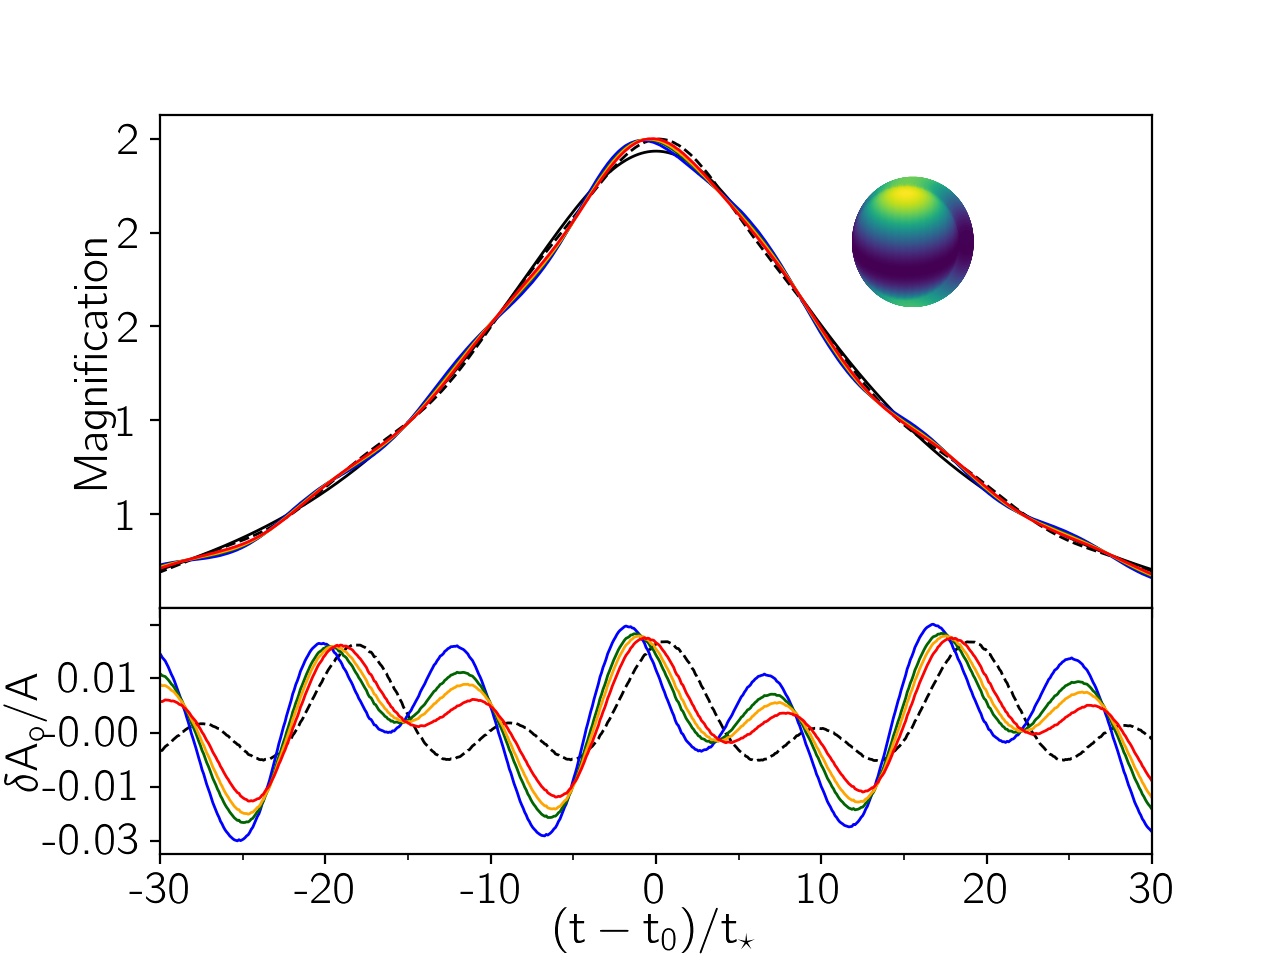
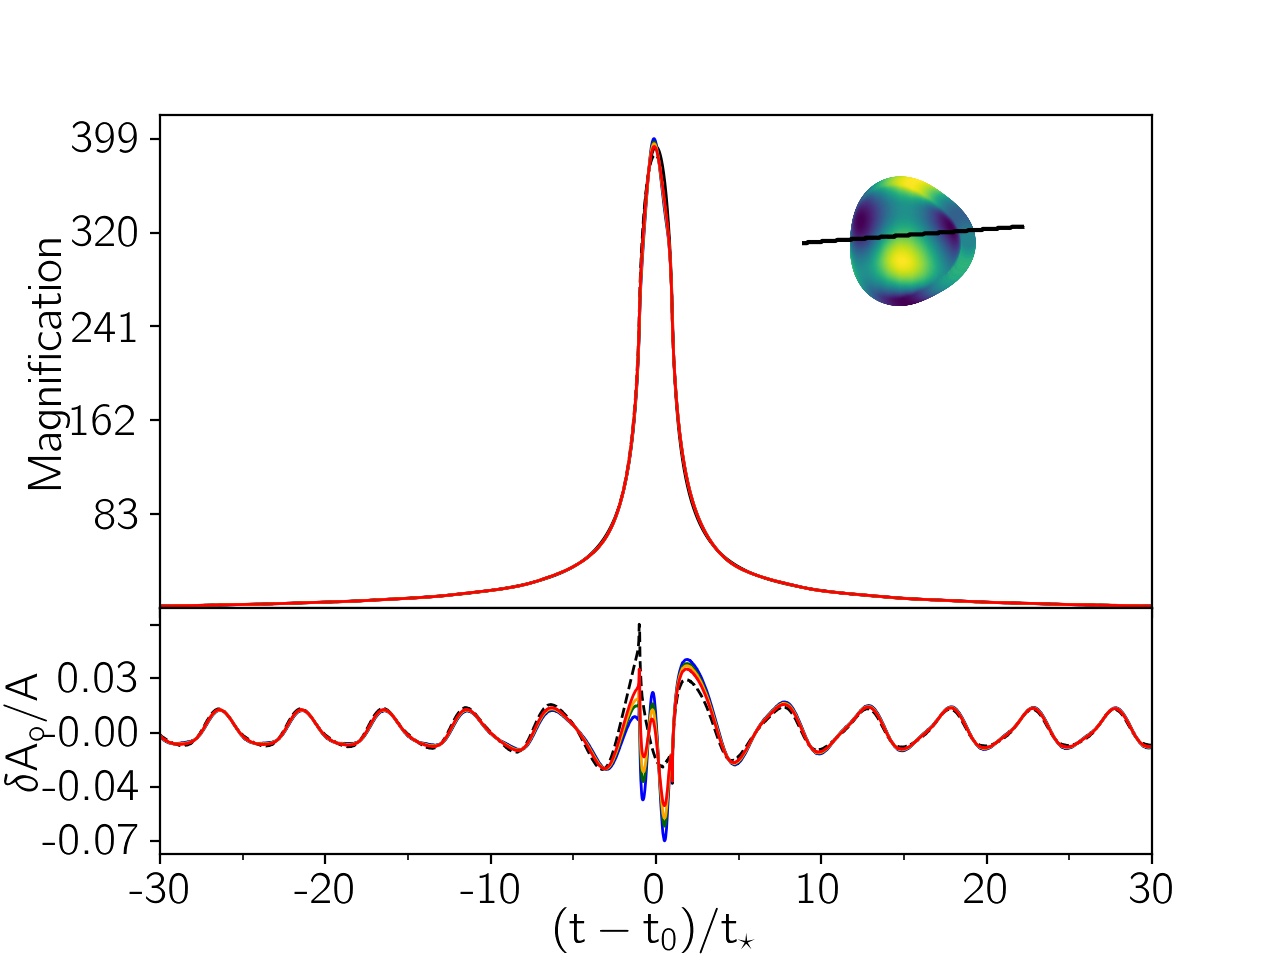
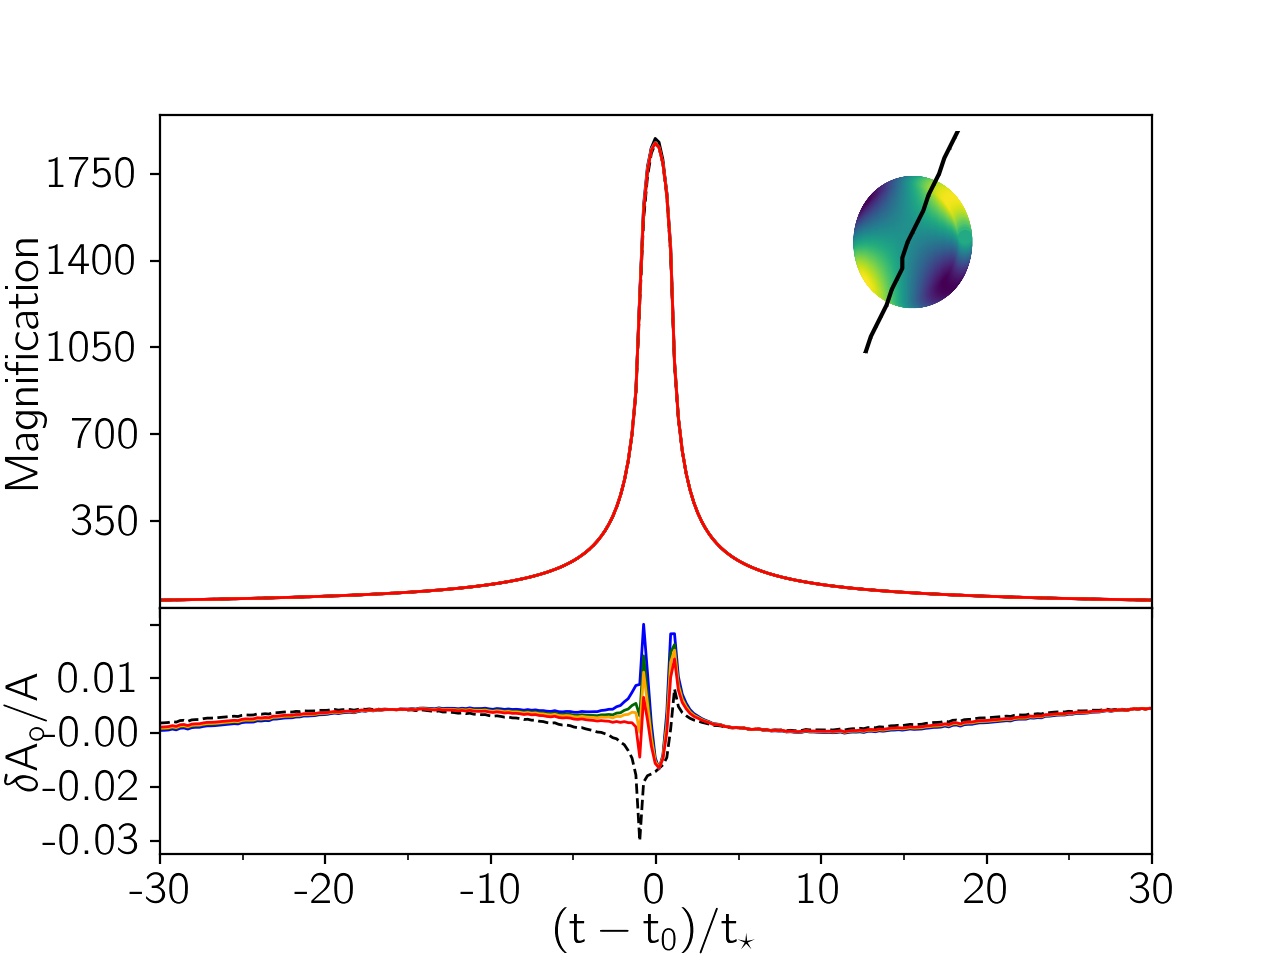
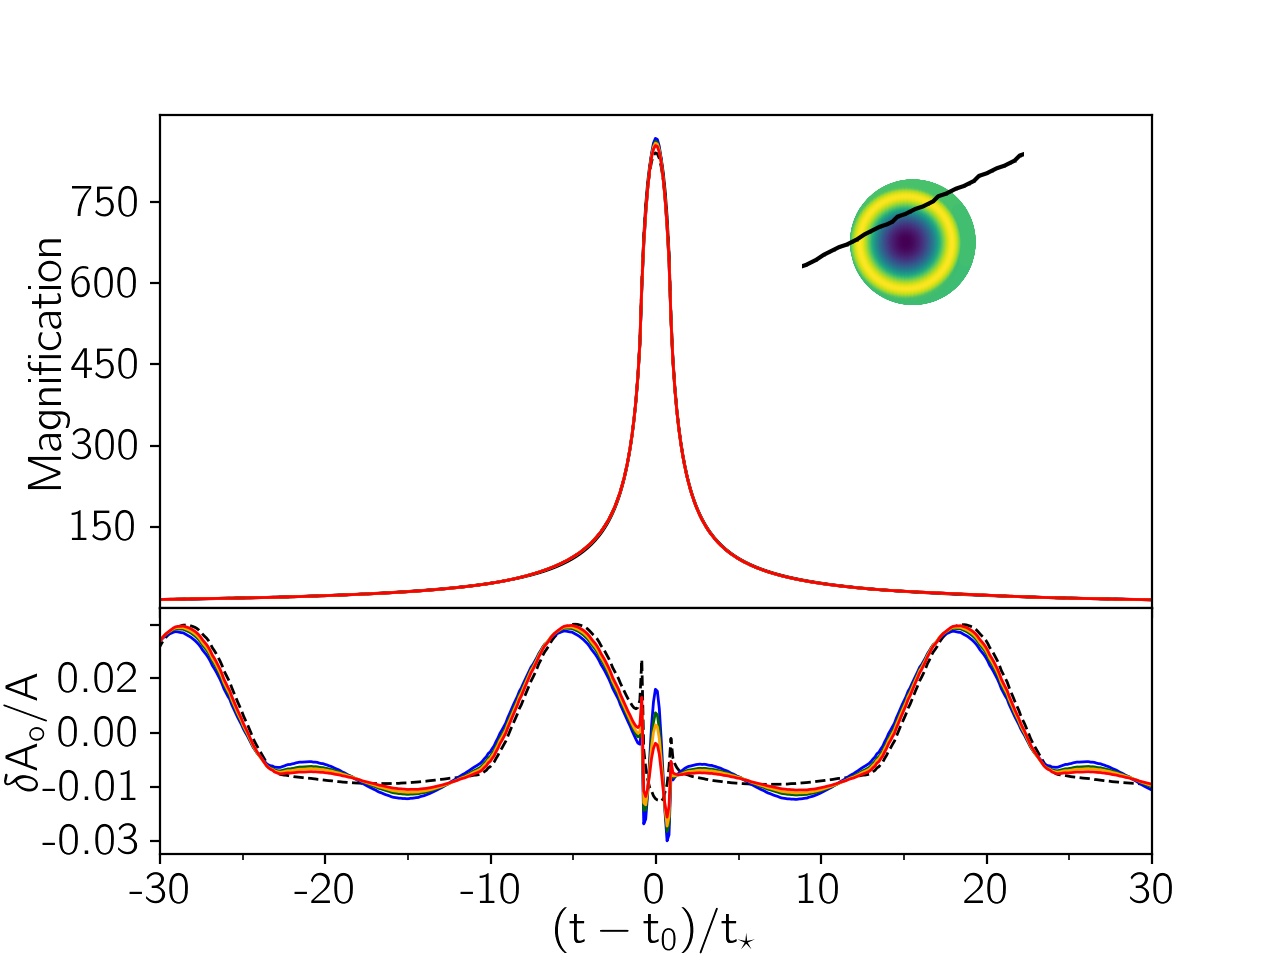
In Figures (4) and (5), several examples of microlensing light curves from NRPs with different modes are shown. In these plots, the microlensing light curves without pulsational effect from a source star with the radius are represented as solid black curves. The light curves of stars with NRPs but without considering the temperature variation over their surface are shown with dashed black curves. The light curves from NRPs with both variable radius and variable temperature over their surface in standard filters BVRI are plotted using blue, dark-green, orange, and red solid curves. Their residuals are shown in the bottom panels. These residuals are the relative difference with respect to the solid black curves, defined as , where is the magnification factor of the corresponding source star with no pulsational effect. For each panel the inset displays the projected appearance of the source star at the start time of the light curve, along with the lens trajectory projected into the source plane. The dimensions of the inset are by . Hence, the lens trajectory sometimes falls outside of the inset and so may not be displayed. The relevant parameters used to make these microlensing light curves are reported in Table 1. In this table is the angle between the lens trajectory and the -axis (horizontal axis on the source surface). Regarding these light curves, some general points are listed below.
-
1.
When the lens is far from the source star so that the finite source effect is negligible, the microlensing light curves with pulsation arise simply from multiplication of the point lens magnification function with the intrinsic luminosity curve of the star undergoing NRPs as if it were a point source. This is the expected limiting case, and for illustration, two example light curves are given in Figures 4 and 5.
-
2.
When the lens impact parameter is small and the finite source size affects the net magnification factor for the star (i.e., ), the difference between the simulated light curve and the simple microlensing light curve due to a non-pulsating source star is not simply the intrinsic NRP light curve. Examples are given in Figures 4 and 4. Under these conditions, the parameters , will be misinterpreted if finite source effects are not considered. Imagine that if the lens at the time of closest approach were to pass across a patch of the source that happens to have a low effective temperature. The peak of the light curve may actually decrease despite being at minimum impact parameter (see 5).
-
3.
For high-magnification microlensing events of NRP stars with modes , the light curves in the different filters show distinctions from one another during the transit of the source star by the lens (see Figs. 4 and 4). Differences between the filter bands are especially pronounced when the lens moves over a zone with a higher temperature difference with respect to . For modes with , the magnification factor depends is always filter-dependent, not just while the lens transits the source surface (see Fig. 4), because for these modes the intrinsic luminosity curves of the source star vary in different filters (e.g., Fig. 2).
-
4.
According to point (1) from subsection 2.2, for the modes with Legendre functions proportional to , and for a pole-on view, the star is always circular in projection with radius versus time. For these modes, the dashed black residuals are zero versus time (see Fig.4; since the inclination angle for this plot is not exactly deg, a pulsation with small amplitude in the dashed black residual is generated). It means that any deviation in their light curves are due to changes in the stellar temperature which will be highlighted when the lens is passing over or close to the stellar surface, i.e, . Hence, the amplitude of the variation in the source radius, , is not measurable even if the lens is crossing the source surface in these modes.
-
5.
For the modes with , and when the star’s polar axis is towards the observer (deg), isothermal zones on the source star are rings concentric to the polar axis. For these modes the circular symmetry of the source surface is preserved. Noting that the phase of the stellar pulsation is , any asymmetry in the light curve with time of the closest approach, at the time , indicates that the pulsation phase is not at a multiple of . For the modes with and a pole-on view, the effect of source star pulsation for the microlensing light curve is similar to the effect of limb-darkening.
-
6.
For modes with , and when the star’s polar axis is towards the observer, the time evolution of the NRPs does not change the temperature profile, but it does rotates the source surface around the axis (pole axis). These stars as seen by the observer have luminosity profiles that are constant with time and could errantly be assumed to be non-pulsating stars. However, when subject to microlensing, the light curves (especially for a transit event) display interesting deviations when the lens passes over the projected stellar limb. Although the resulting light curve may be similar to a simple light curve from a non-pulsating source star, the peak magnification is filter-dependent and chromatic features appear (see, e.g., 4, 5). The colour dependence of the magnification factor during transit and for high magnification microlensing events reveals the variable nature of the source star. Hence, some stars thought to be constant sources may in reality be variable, even though their flux is constant for certain viewing perspectives. The lensing effect can reveal their variable nature.
-
7.
From point (5) of subsection (2.1), the region over the stellar equator has the largest impact on the intrinsic luminosity of the source star. Therefore, if the related Legendre polynomial maximizes for these points, the observer received the stellar luminosity with the highest amplitude. Accordingly, when the lens is passing close and parallel with the stellar equator projected on the sky plane, the deviation in the light curve varies in different filters. Because the pulsation in the stellar temperature for these points have the largest amplitude (see Figure 5).
-
8.
In subsection 2.2, and with point (3) above, we notice that the largest amplitude of the reshape factor for the projected source star happens when the maximum of the related Legendre polynomial occurs at the stellar poles. Accordingly, when the lens trajectory comes near the stellar poles projected onto the sky plane, the deviation in the light curve is due to pulsation of the stellar radius rather than the varying stellar temperature.
-
9.
For some NRPs, the brightness centre does not correspond to the coordinate centre. As an example, consider the mode . When the polar axis is in the plane of the sky, the brightness centre is actually displaced in the vertical direction by
(13) where subscript “c” refers to centre. This brightness centre rotates about the sky plane during the stellar pulsation. For if deg, the brightness centre moves around a circle, whereas for deg, the centre will oscillate along a horizontal line passing through the coordinate centre. This effect maps into the light curve as a peak magnification that is temporally offset with respect to the time of closest approach between the lens and the geometric centre of the source star.
In the following, we explore obervational predictions for several different pulsation modes with and . For each mode, we mention the points regarding the source star shape, its area and the luminosity in different inclination angles. These points somewhat help when we aim to discern the pulsation mode of the source star from the resulted microlensing light curves.
-
: In this mode the star is actually radially pulsating for which the luminosity of the source stars is filter-dependent (see Paper I for more details). Microlensing light curves show chromatic effects. The range of variations is larger in filters at shorter wavelengths.
-
: In this mode, the source radii in the direction of the -axis are and in the direction of the -axis, source radii are . The source surface has no symmetry with respect to the horizontal axis, so the brightness centre does not coincide with the coordinate centre (unless deg).
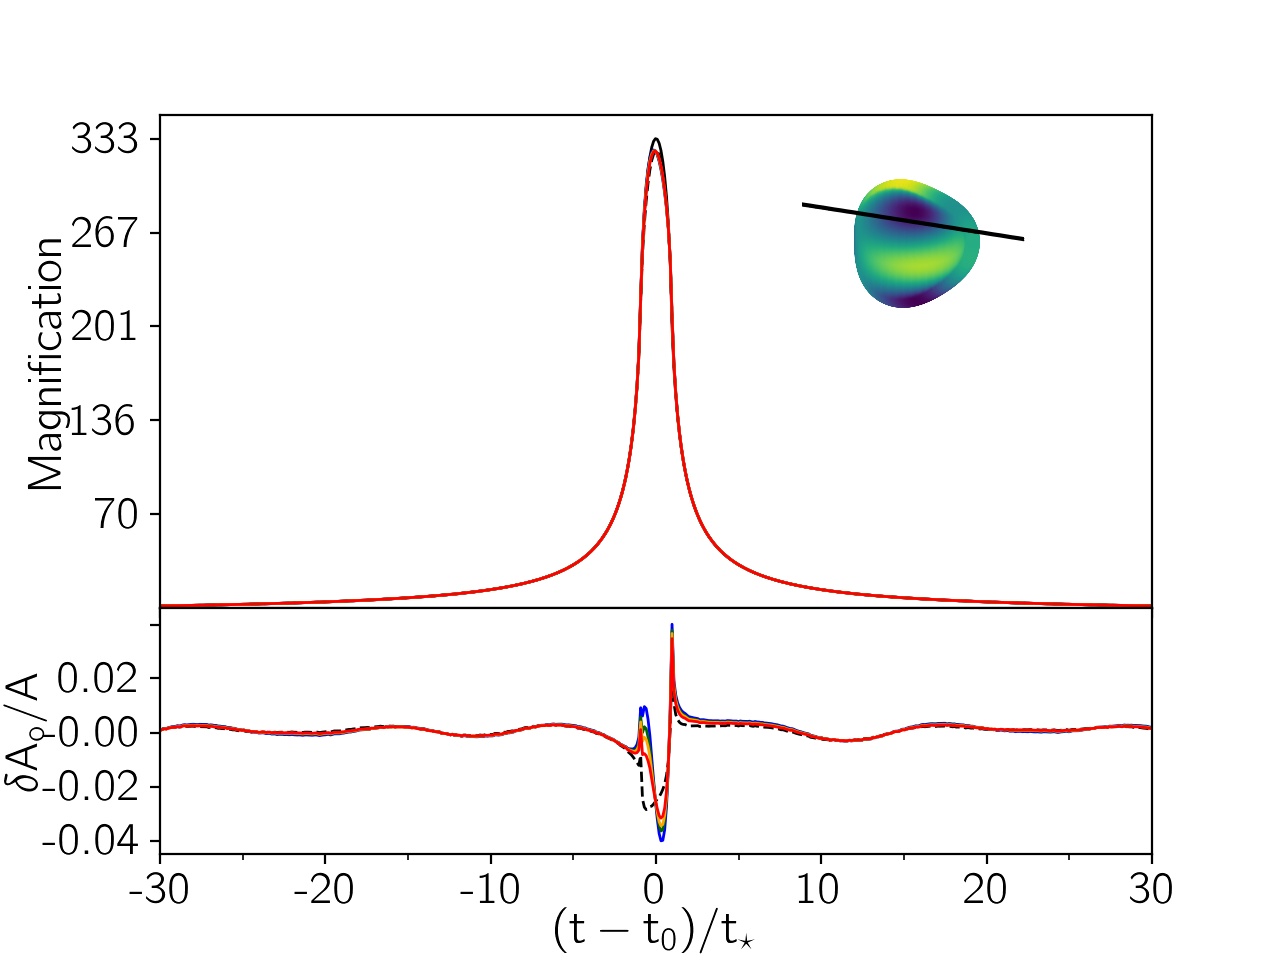
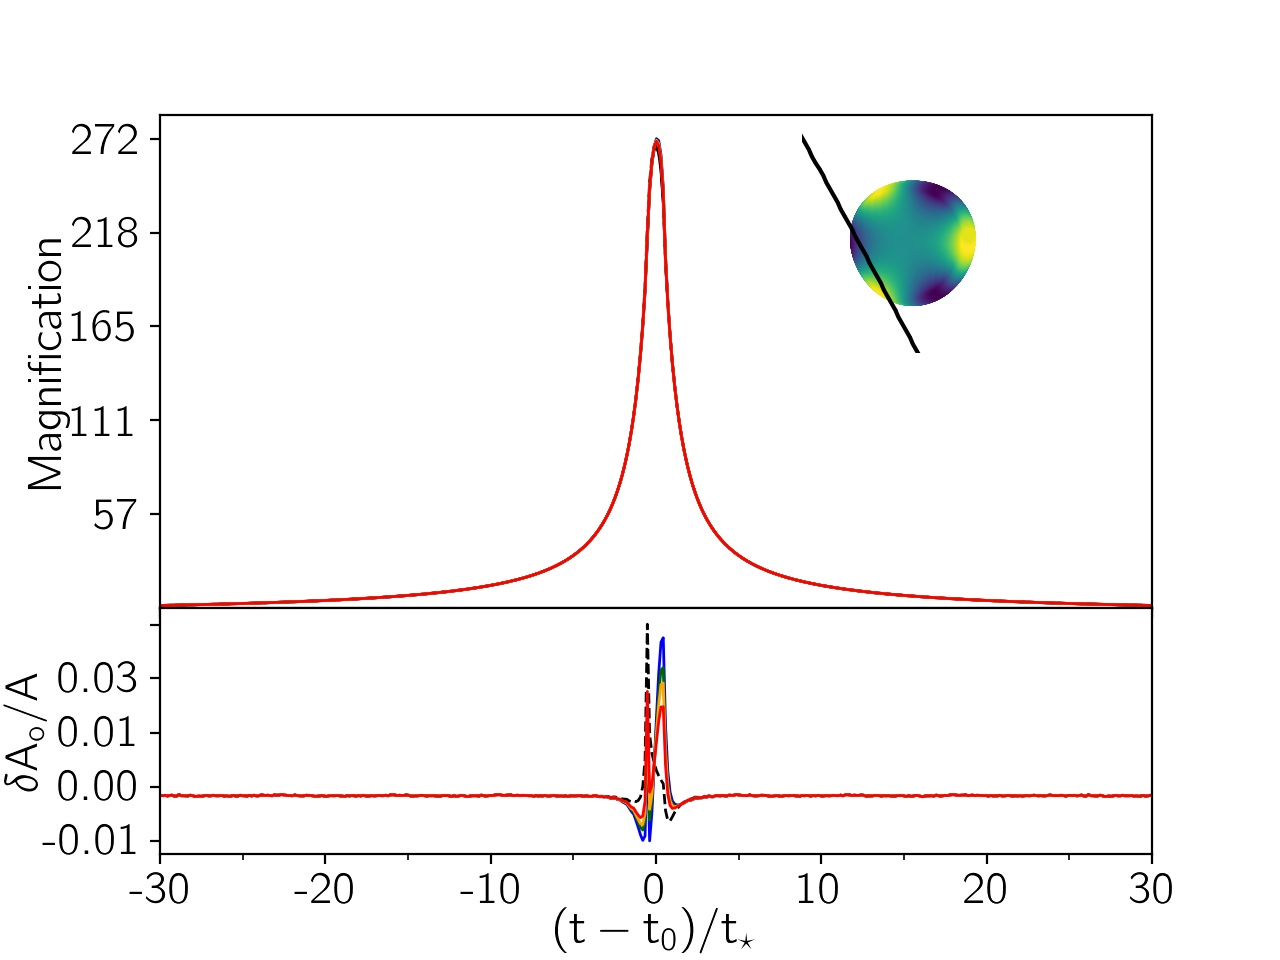
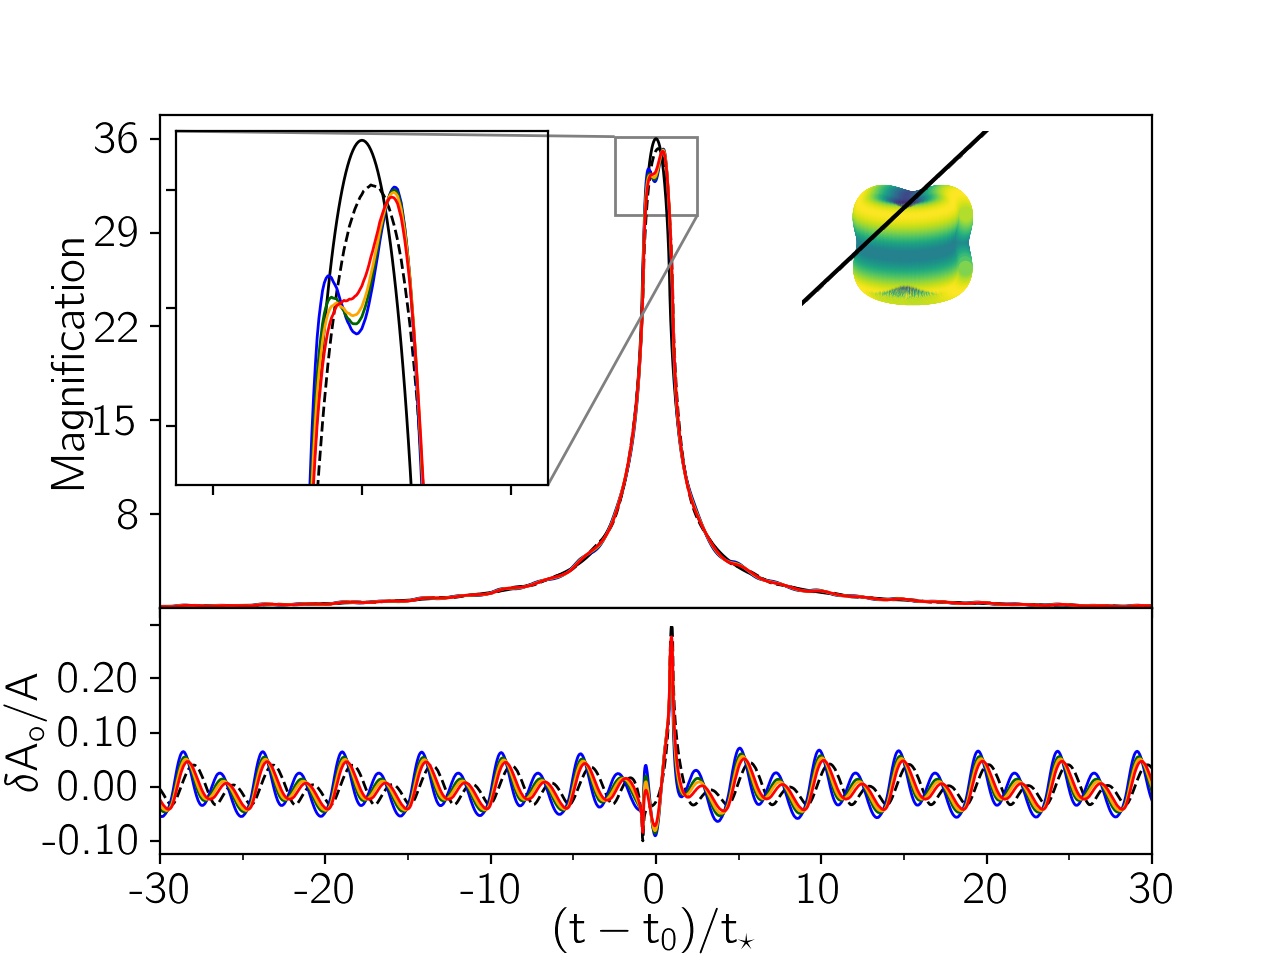
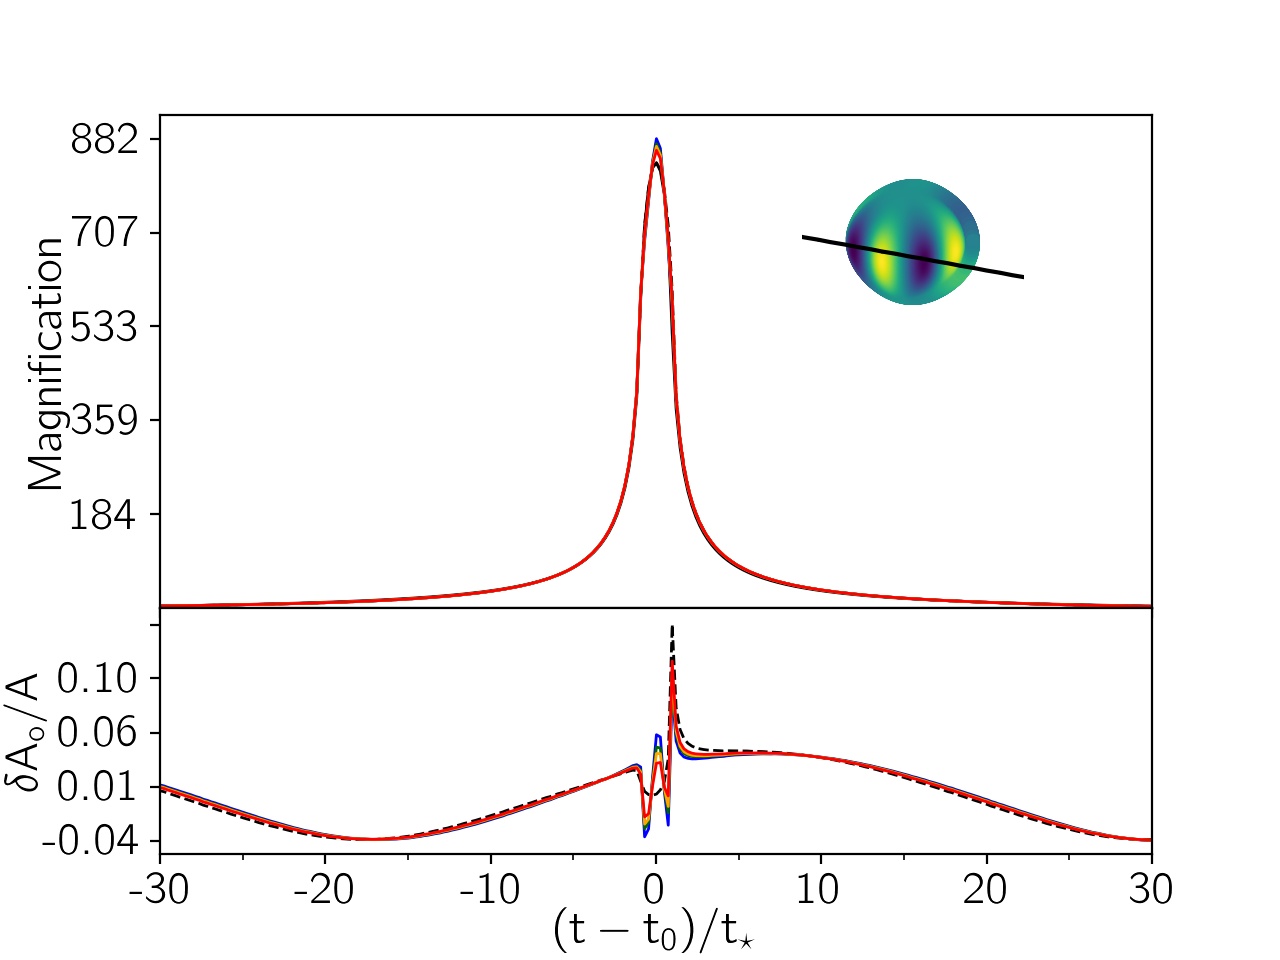
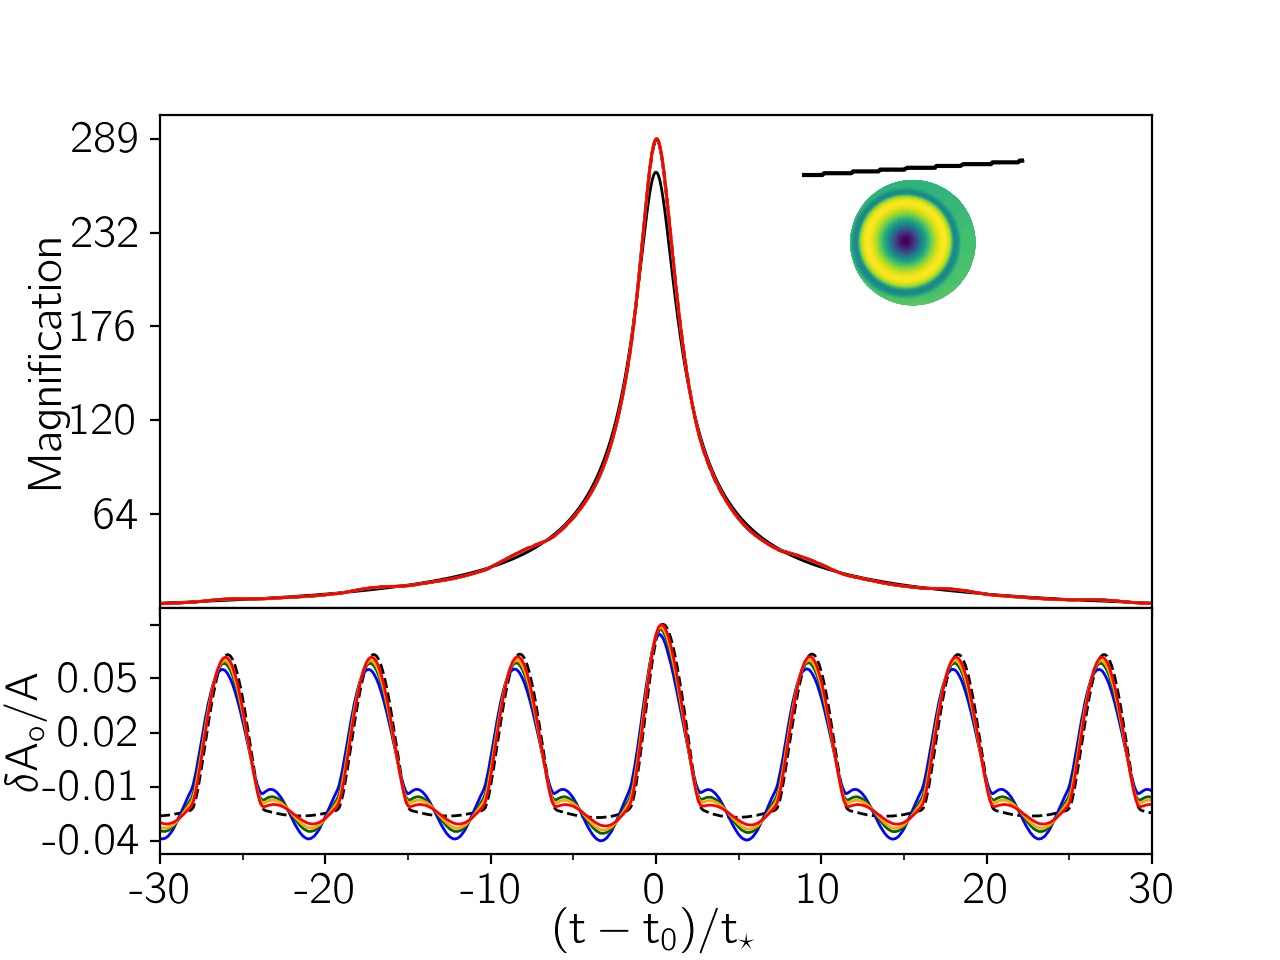
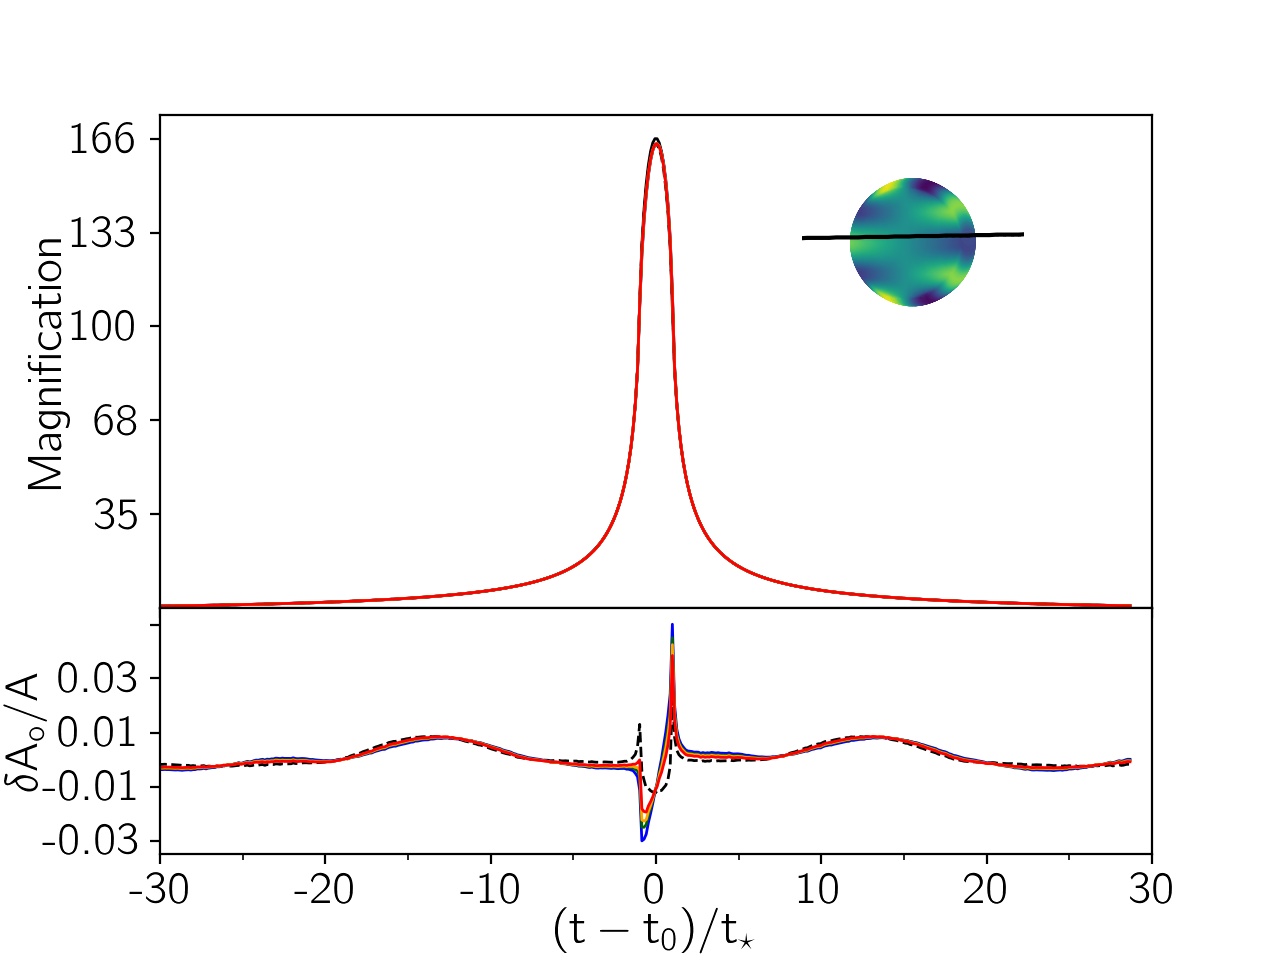
Figure 5: Several examples of single microlensing light curves from NRPs with different modes, using the same style as in Fig. 4. -
: In this mode the source star takes on the general appearance of an ellipsoid (dipole), with the ratio of its axes given by
By increasing the inclination angle, the source shape tends to a circle, so that when the stellar pole is towards the observer (), the source is completely circular but with variable radius (similar to a radially pulsating star). When deg (for which ), the projected source star is also a circle at fixed radius . Finally, the reshape factor is maximum for the inclination angle deg. Hence, the deviation in the light curve due to pulsation in the source radius is different from deviation due to the stellar temperature (see Figure 4).
Table 1: Table contains the parameters used to make microlensing light curves shown in Figures (4), (5) and (6). 4 4 4 4 4 4 5 5 5 5 5 5 6 6 6 6 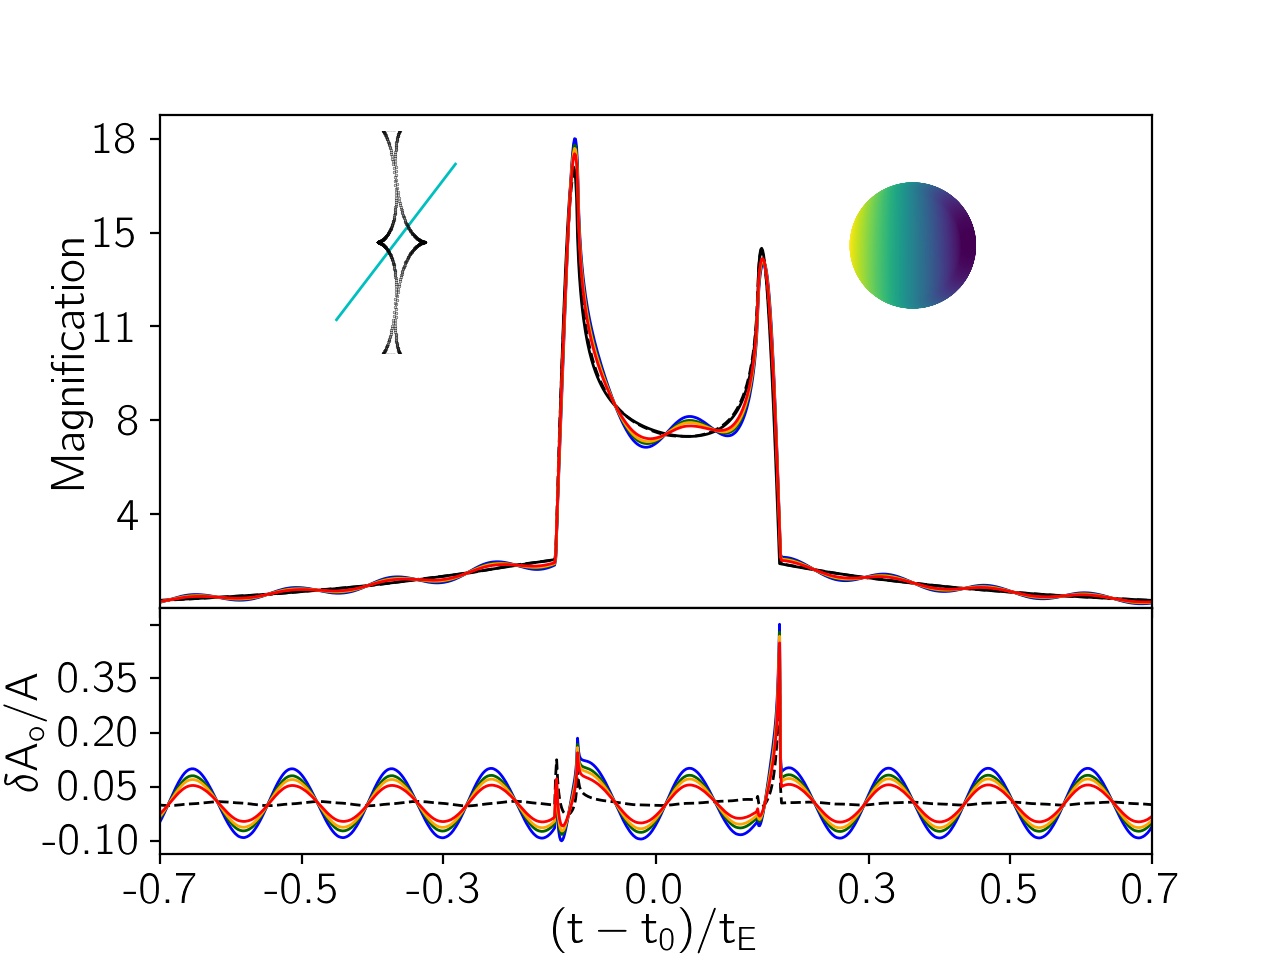
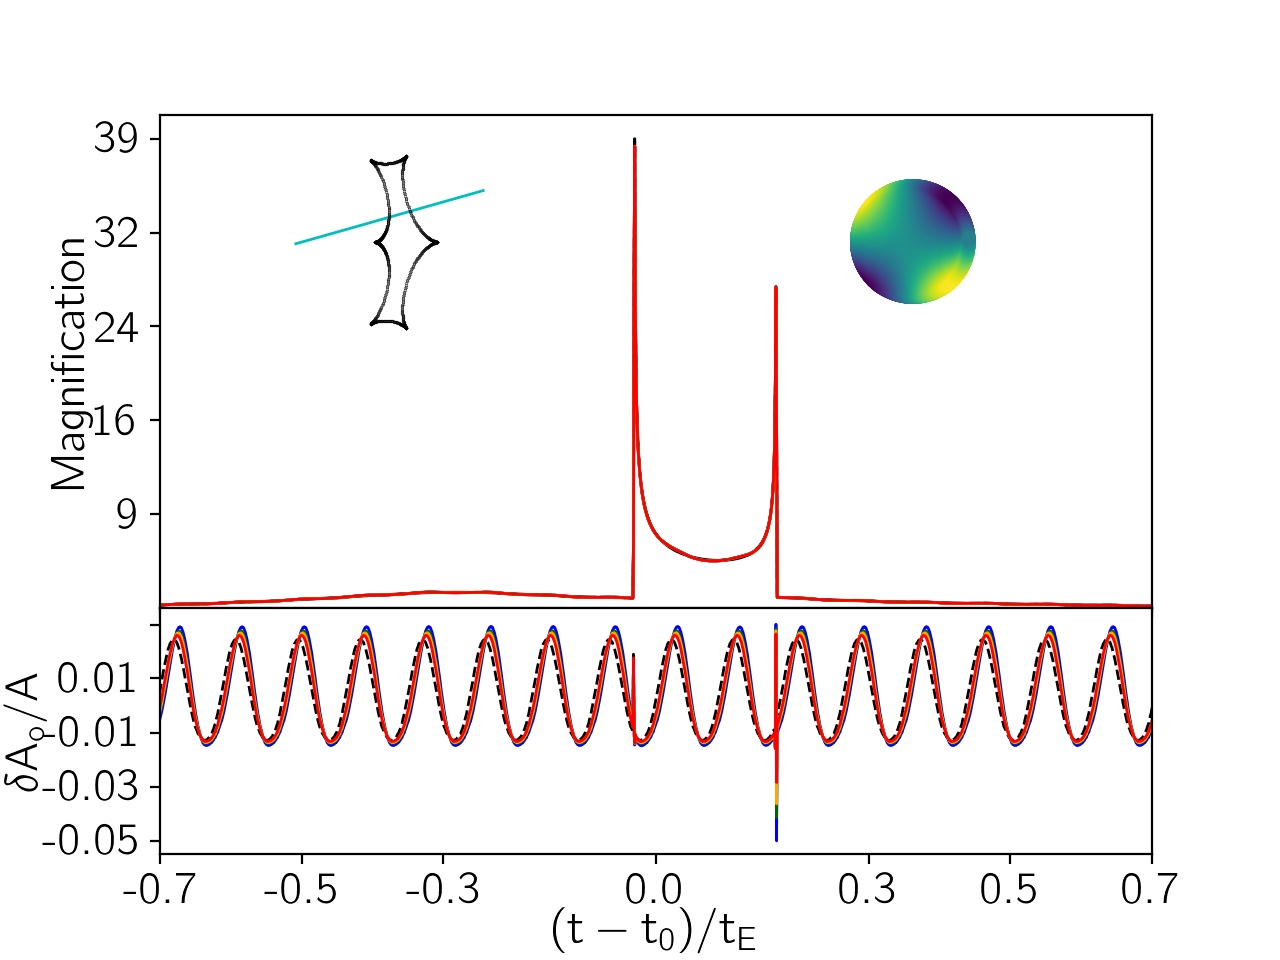
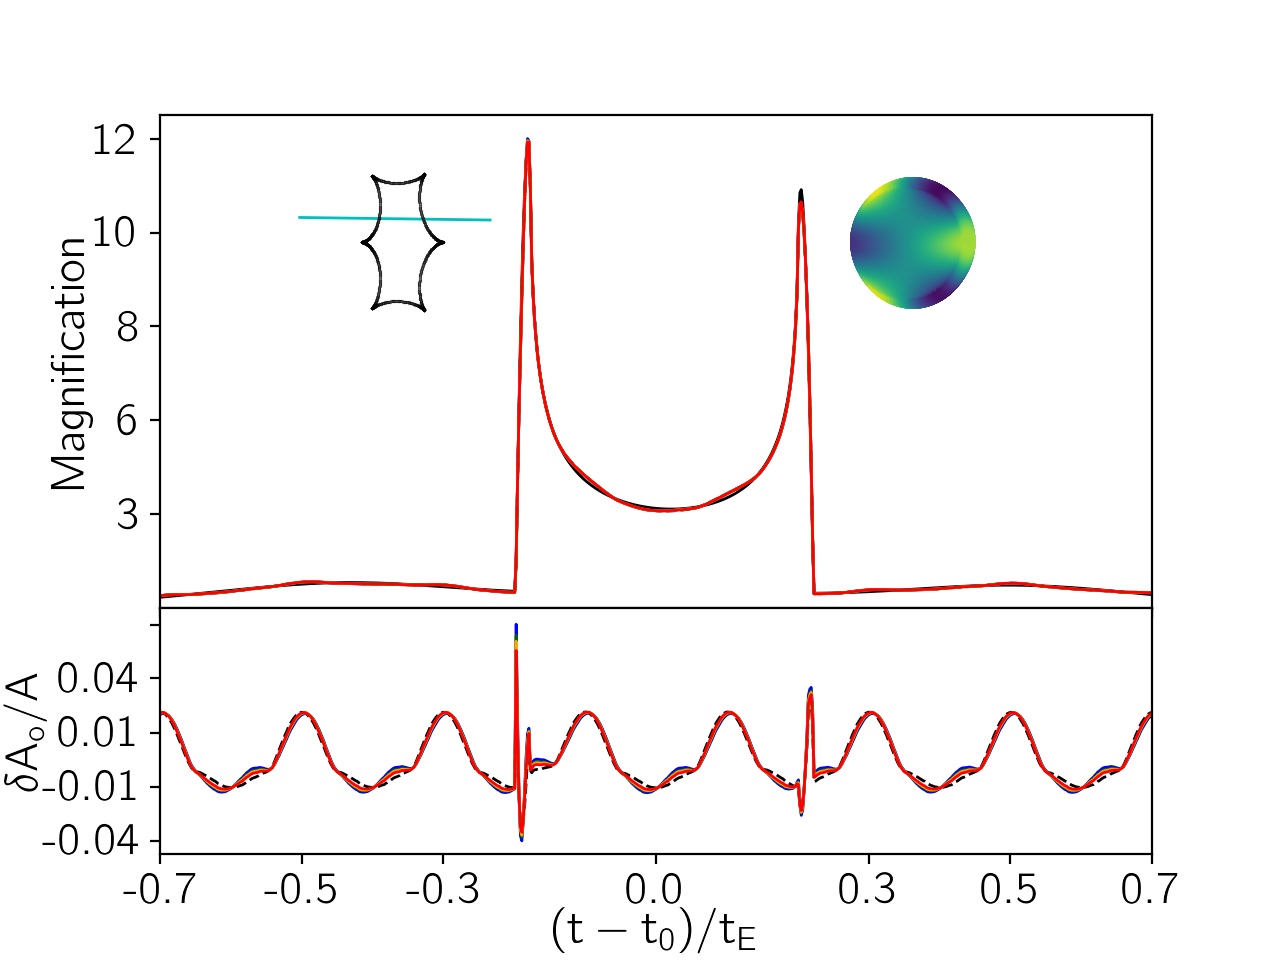
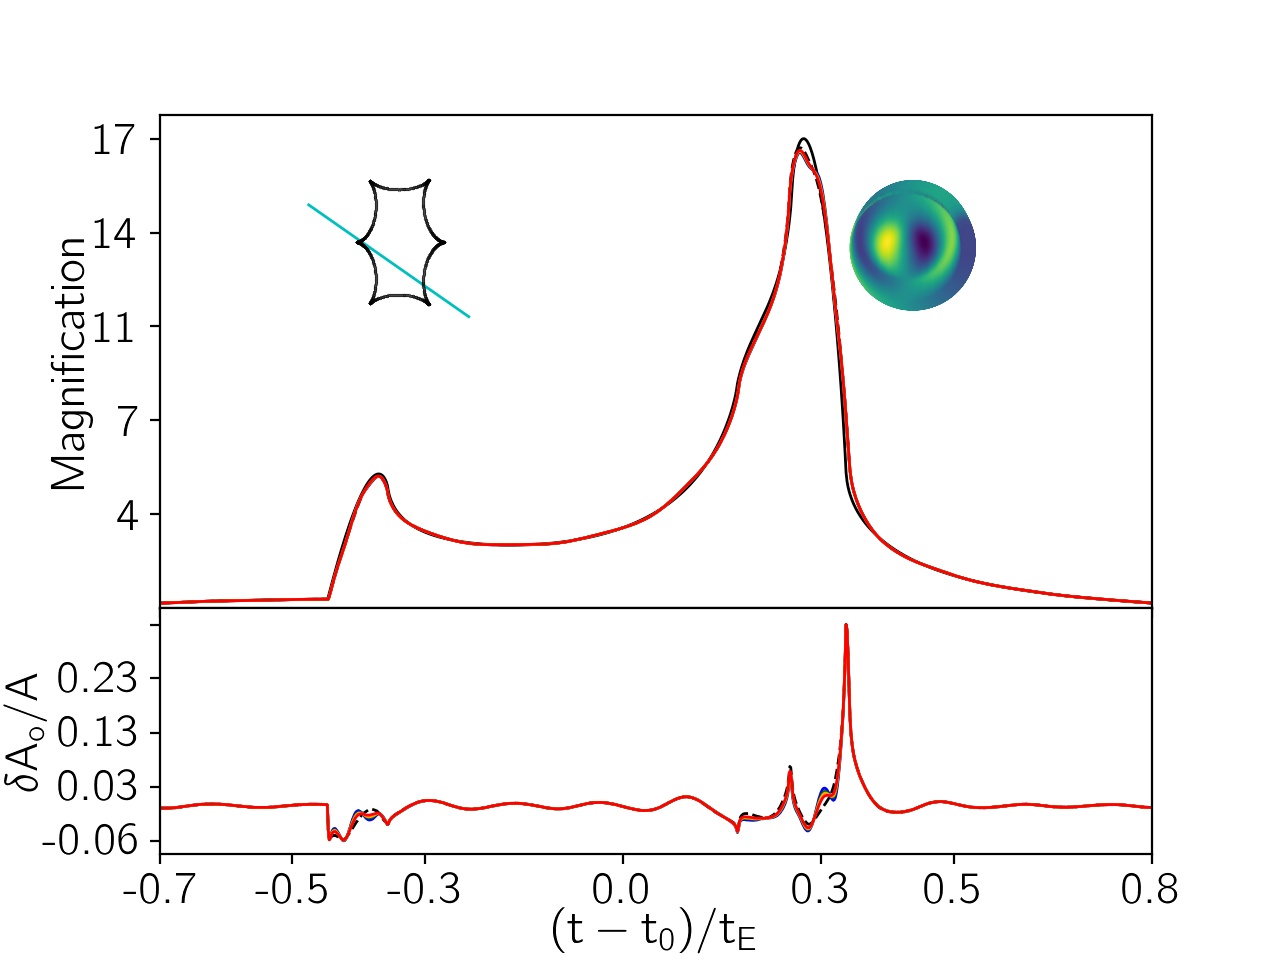
Figure 6: Four examples of binary microlensing light curves from NRPs with different modes. In these plots and in their left-hand insets, the caustic curves (black) and the source trajectories (cyan) are shown. The figure otherwise adopts the same style as Fig. 4. -
: For this mode, at deg, the amplitudes of the reshape factor and the stellar luminosity both maximize. When deg, the source star is a circle with constant radius . In this case the pulsation effect on the microlensing light curve is very small, unless the lens is passing close to the source surface. For this mode the deviation due to transiting over the source surface is chromatic.
-
: The Legendre polynomial for this mode is . The maximum amplitudes of the stellar luminosity occurs at deg and the maximum amplitude of the reshape factor occurs at deg. Hence, the pulsation effect on the microlensing light curve when the source pole is towards the observer is very small, unless the lens is crossing the source surface (c.f., Fig. 4).
-
: Here . In this mode the source star around the polar axis has a conical shape. The maximum reshape factor occurs when deg when the polar axis is in the plane of the sky (in our formalism the vertical axis). When deg, although the reshape factor is zero for all times, the domain of the stellar luminosity maximizes. The luminosity curves of this mode can be found in 2. During some part of the pulsational phase, differences between the filter passbands are greatest. Lensing will increase this difference further, and one can discern the pulsation mode according to these coloured features. An example light curve is shown in Figure 4.
-
: The Legendre function is . The maximum reshape factor happens when deg for which is maximized. We note that for deg, the stellar shape is conical around the axis. The maximum range in the luminosity occurs when deg. The important points regarding this mode is that the pulsation in the stellar luminosity is small (the amplitude of the luminosity is for K and ). For instance, in Figure 5 significant deviation in the light curve occurs only while transiting the source surface which is , although K.
-
: For this mode . Its maximum is achieved for deg. Hence, the maximum range in luminosity occurs when deg. When the pole of the source star is towards the observer, the star is circular with radius . Similar to the two previous modes, the source has a conical shape except when deg.
-
: Here . When deg, the domain of the pulsation in the stellar luminosity maximizes. The maximum reshape factor occurs when the stellar pole is towards the observer and the stellar shape for this inclination angle is similar to a triangle (because of the factor ). When the lens is crossing the source surface, a substantial asymmetric deviation in the light curve appears because of the pulsation in the stellar radius, see, e.g., Figure 5.
-
: Here . The source surface when its pole is on the sky plane appears as a diamond (or square), whereas for deg, the source star is circular whose radius pulsates over time while the temperature pattern over the source surface is organized in rings. The amplitude of the stellar luminosity is large and maximizes when the stellar pole is towards the observer. When the lens is goes across the pole a demagnification happens in the light curve and makes the light curve differ from the simple Pczyński light curve (similar to binary or planetary microlensing ones); see Figure 5. We note that time variable colour during the transit of the star by the lens can produce chromatic perturbations to reveal stellar brightness anomalies. Binary or planetary microlensing may have similar deviations in their light curves, but they do not make chromatic effects.
-
: The Legandre function is . When deg, the source star is circular with radius . The highest reshape factor happens when deg, and the source star as seen by the observer appears as a diamond. When the largest amplitude for the stellar luminosity is achieved.
-
: In this mode the maximum amplitude for the stellar luminosity is achieved at deg. The largest reshape factor occurs when deg and the source star shape is dipolar, but for other values of the inclination angle, the source shape is like a diamond.
-
: The maximum of the Legandre polynomial occurs at deg. Hence, for deg, the source projected on the sky plane looks like a diamond with a high reshape factor. For and K, the maximum luminosity amplitude is 1.1, which is smaller than the amplitude of the luminosity for the other modes with which have .
-
: At deg, the source surface is not symmetric with respect to the vertical axis (), and for this inclination angle, the amplitude of the luminosity curve maximizes. While the lens is crossing the source surface, and specially when it passes horizontal, the light curve will be chromatic even though the intrinsic luminosity curve is not filter-dependent. One example light curve is shown in Figure 5. When the stellar pole is towards the observer, its intrinsic luminosity does not change with time (although its reshape factor maximizes and the source surface looks diamond). Without the effect of lensing, this star could not be discerned as a variable.
-
: For this mode, when the inclination angle is small, the projected surface of the source star on the sky is similar to a pentagon, and by increasing the inclination angle, the source surface becomes more symmetric so that when deg, the source star is a circle with radius . However, the stellar pole is towards the observer, the highest amplitude of its intrinsic luminosity curve occurs. The source star in this mode and with is similar to the source star with the mode and deg. For both modes, the coloured features appear at the downstream of the luminosity curve. In Figure 5, one example microlensing light curve from an NRP in this mode is shown. The residual light curve is similar to the cyan curve in Figure 2.
-
: Here, the source star (similar to the previous mode) looks like a pentagon when the stellar pole is in the sky plane. However for this mode the stellar pole is horizontal axis. The Legendre polynomial in this mode will be zero at deg which results a very small reshape factor when deg. The maximum of the Legendre polynomial happens when deg, such that the amplitude of the luminosity curve maximizes when deg. Generally, for the modes with and when , the integrated luminosity of the source star pulsates with small amplitude . Hence, just when the lens is crossing the source surface, the light curve will deviate from a simple Paszyński light curve; see, e.g., Figure 5.
-
: Similar to the two previous modes, the source star appears as a pentagon when the stellar pole is in the sky plane, and appears as a circle of radius when its pole is towards the observer. The maximum of the Legendre function for this mode occurs at deg, hence the maximum amplitude of the luminosity function happens at deg.
-
: Since the maximum of the Legendre polynomial in this mode corresponds to deg, the maximum amplitude of the stellar luminosity curve is achieved at deg. The smallest amplitude of the reshape factor for this mode happens at deg, where the Legendre function vanishes.
-
: The largest amplitude of the luminosity and the reshape factor happen at deg, respectively.
-
: The maximum luminosity happens when the stellar pole is on the sky plane, although in this position the reshape factor is very small. Also when the stellar pole is towards the observer, the source star is like as pentagon (because of the factor ) but its luminosity does not change. We note that the amplitude of the luminosity in this mode is the smallest of the modes with .
4 Binary Microlensing of Non-radially pulsating stars
Around of microlensing light curves have caustic-crossing features and so-called binary microlensing events (Sumi et al., 2013; Mróz et al., 2019). These events are more sensitive to exoplanets than for a single lens, so that most of these events (especially ones with caustic-crossing features) are fully covered with observational data taken by survey and follow-up telescopes. In this section, we simulate the caustic-crossing microlensing events of NRP stars to examine the properties of the light curves. We aim to investigate where and how the intrinsic pulsation of the source stars modifies the microlensing light curves.
In order to calculate the magnified stellar luminosity of NRP stars lensed by binary microlenses, given by Equation 10, we evaluate the magnification factor for each element over the source surface using the well-developed -model of V. Bozza (Bozza et al., 2018; Bozza, 2010; Skowron & Gould, 2012). We produce a large ensemble of caustic-crossing binary microlensing events in the following way. We randomly sample the mass ratio of microlenses in the range , as well as their projected distances on the sky plane normalized to the Einstein radius from the range . In Figure 6, four examples of binary light curves from NRP stars are presented. Their parameters can be found in Table 1. The characterizations of these light curves are similar to the ones plotted in Figures 4 and 5. Upper left-hand insets display the caustic curves (black curves) and the source trajectories (cyan straight lines). Using the examples of the figure, we offer these summary points.
-
*
The pulsation amplitudes are more increased while the source star is inside the caustic curve than when it is outside (see Fig. 6). However, the detectability of the magnified pulsational variability depends on the number of pulsations occurring when the source is inside the caustic curves.
-
*
Generally, the pulsation of the source star will have three effects on the magnification peak while transiting the caustic which are: (i) variation of the stellar colour (Fig. 6); (ii) displacement in the peak position; and (iii) variation in the value of the magnification factor. The variation in the stellar colour while transiting the caustic line decreases with increasing pulsation mode, because the temperature contrast over the source surface decreases with larger values. Deviations in the form of increase-zero-decrease (or decrease-zero-increase) made while transiting the caustic curve reveals the displacement at the time when the source brightness centre is on the caustic curve, as seen for example in the residual curves of Figure 6. The amount of the magnification factor at the peak depends on the source radius according to its value at the time of caustic crossing.
-
*
In the case that the intrinsic pulsation of the source star is ignored, the two latter effects of NRP stars on the magnification peak during caustic crossing can lead to an errant measure of the Einstein crossing time and the parameters of lens trajectories (the lens impact parameter and the angle of the lens trajectory with respect to the binary axis). We note that the first effect (chromatic deviations) is helpful for discerning the intrinsic pulsation of the source star.
-
*
When the source is relatively large, the peak of the magnification factor becomes flattened, and pulsation of the stellar radius changes the detailed shape of the flattened peak (see Fig. 6).
Unlike single lens, caustic crossing means makes two high magnification events of the NRP star. Hence, the ability of inferring the modes of the pulsations is higher in binary lensing, because the star is scanned twice (essentially resolved) but at different phases in the pulsation. However, the parameters of binary lensing events are more than single ones. So, these events offer a wide diversity of possibilities and capabilities for inferring the stellar properties and the lensing configurations.
5 Summarize and conclusions
Our focus for this paper has been a parameter study for microlensing of stars undergoing NRPs. The luminosity variations are characterized in terms of the stellar radius and surface effective temperature using harmonic oscillating functions with different values. We consider a projection angle between the source pole and the sky plane to project the source surface onto the sky plane. Using this formalism, we simulated microlensing light curves from NRP stars with different modes and projection angles both for single lenses and for binary lenses.
We summary main points first for the single lens case. When the lens has a relatively large impact parameter from the NRP star, the light curve with microlensing is a simple multiplication of the magnification factor and the stellar luminosity curve. When the lens is close to the stellar surface or actually has a transit, the magnification factor completely differs from the simple light curve of a non-pulsating source star.
When and the star is viewed pole-on, the luminosity from integration over the source surface is constant with time, so that although the star displays variability patterns across its surface, the unresolved star can mimic a constant source. Lensing effects, especially when the lens impact parameter is small with , breaks this degeneracy to reveal the intrinsic surface variability of the source star. During a transit event of a NRP star, the magnification factor is found to be chromatic. For non-pulsing stars and in high magnification microlensing events, the chromatic effects can be created when the source star is a red giant with the considerable limb-darkening effect (Valls-Gabaud, 1998).
For some pulsation modes (e.g., ), the temperature pattern on the source surface makes the brightness centre shift from the coordinate centre of the star. Plus the displacement between brightness centre and the geometric centre moves with time. This affects the location of the peak magnification in the light curve.
Some pulsation modes lead to quite similar luminosity curves, e.g.,
and .
The distinctions in the modes are not recognizable from the normal light
curve. But during high magnification and transiting microlensing
events, the lensed light curve can distinguish between the modes,
because the different models produce different temperature patterns.
In binary microlensing events of NRP source stars, the variation in the stellar colour while the source surface transits a caustic curve hints at the stellar pulsation even if its amplitude is too small to produce clear periodic fluctuations. In the case that the stellar variations are not discerned, their effects on the magnification peak and its location can lead to errors of the lensing parameters.
Around of the Galactic Bulge stars are variable. By considering that annually around microlensing events are identified by survey microlensing groups (Wyrzykowski et al., 2015; Sako et al., 2008; Kim et al., 2018), the number of microlensing events due to variable stars should be per year. Actually, this value may be considered a lower limit, since around of detected microlensing events are due to giant stars, and the likelihood of variability among the giants is higher than dwarf stars. Using microlensing candidates with stellar variability signatures as a baseline from OGLE-III observations during 2001-2004 (Wyrzykowski et al., 2006), it appears that many of these variable stars are faint. It is possible that significant deviations only occur when the magnification factor is high, and their perturbations are likely mis-interpreted. Statistical and detailed observational issues involving microlensing events of variable stars will be quantitatively studied in a subsequent paper.
Data availability
Data available on request.
References
- Alcock et al. (1997) Alcock C., et al., 1997, ApJ, 491, L11
- Alcock et al. (2000) Alcock C., et al., 2000, ApJ, 542, 281
- Assef et al. (2006) Assef R. J., et al., 2006, ApJ, 649, 954
- Bonanno & Sereno (2004) Bonanno A., Sereno M., 2004, in Favata F., Aigrain S., Wilson A., eds, ESA Special Publication Vol. 538, Stellar Structure and Habitable Planet Finding. pp 281–283
- Bozza (2010) Bozza V., 2010, MNRAS, 408, 2188
- Bozza et al. (2018) Bozza V., Bachelet E., Bartolić F., Heintz T. M., Hoag A. R., Hundertmark M., 2018, MNRAS, 479, 5157
- Carroll & Ostlie (1996) Carroll B. W., Ostlie D. A., 1996, An introduction to modern astrophysics; 1st ed.. Addison-Wesley, Reading, MA, https://cds.cern.ch/record/642519
- Catelan & Smith (2015) Catelan M., Smith H. A., 2015, Pulsating Stars
- Cowling (1941) Cowling T. G., 1941, MNRAS, 101, 367
- Cox (1974) Cox J. P., 1974, Reports on Progress in Physics, 37, 563
- Derekas et al. (2007) Derekas A., Kiss L. L., Bedding T. R., 2007, ApJ, 663, 249
- Dominik (2006) Dominik M., 2006, MNRAS, 367, 669
- Dziembowski (1977) Dziembowski W., 1977, Acta Astron., 27, 203
- Einstein (1936) Einstein A., 1936, Science, 84, 506
- Gaudi (2012) Gaudi B. S., 2012, ARA&A, 50, 411
- Gaudi & Haiman (2004) Gaudi B. S., Haiman Z., 2004, arXiv e-prints, pp astro–ph/0401035
- Graczyk et al. (2011) Graczyk D., et al., 2011, Acta Astron., 61, 103
- Han et al. (2000) Han C., Park S.-H., Kim H.-I., Chang K., 2000, MNRAS, 316, 665
- Hendry et al. (2002) Hendry M. A., Bryce H. M., Valls-Gabaud D., 2002, MNRAS, 335, 539
- Heyrovský & Loeb (1997) Heyrovský D., Loeb A., 1997, ApJ, 490, 38
- Heyrovský et al. (2000) Heyrovský D., Sasselov D., Loeb A., 2000, ApJ, 543, 406
- Kahn (1969) Kahn F. D., 1969, Planet. Space Sci., 17, 1563
- Kim et al. (2018) Kim D. J., et al., 2018, AJ, 155, 76
- Li et al. (2019) Li S. S., et al., 2019, MNRAS, 488, 3308
- Mao & Paczynski (1991) Mao S., Paczynski B., 1991, ApJ, 374, L37
- Moniez et al. (2017) Moniez M., Sajadian S., Karami M., Rahvar S., Ansari R., 2017, A&A, 604, A124
- Mróz et al. (2019) Mróz P., et al., 2019, ApJS, 244, 29
- Paczynski (1986) Paczynski B., 1986, ApJ, 301, 503
- Percy (2007) Percy J. R., 2007, Understanding Variable Stars
- Pietrukowicz et al. (2013) Pietrukowicz P., et al., 2013, Acta Astron., 63, 379
- Rattenbury (2009) Rattenbury N. J., 2009, MNRAS, 392, 439
- Rattenbury et al. (2005) Rattenbury N. J., et al., 2005, A&A, 439, 645
- Ritter (1881) Ritter A., 1881, Annalen der Physik, 250, 610
- Sackett (2001) Sackett P. D., 2001, Microlensing and the Physics of Stellar Atmospheres. p. 213
- Sajadian (2015) Sajadian S., 2015, MNRAS, 452, 2587
- Sajadian (2016) Sajadian S., 2016, ApJ, 825, 152
- Sajadian & Ignace (2020) Sajadian S., Ignace R., 2020, MNRAS, 494, 1735
- Sajadian & Poleski (2019) Sajadian S., Poleski R., 2019, ApJ, 871, 205
- Sako et al. (2008) Sako T., et al., 2008, Experimental Astronomy, 22, 51
- Samus et al. (1997) Samus N. N., Durlevich O. V., Kazarovets R. V., 1997, Baltic Astronomy, 6, 296
- Samus et al. (2017) Samus N. N., Kazarovets E. V., Durlevich O. V., Kireeva N. N., Pastukhova E. N., 2017, Astronomy Reports, 61, 80
- Schechter & Wambsganss (2002) Schechter P. L., Wambsganss J., 2002, ApJ, 580, 685
- Schneider et al. (1992) Schneider P., Ehlers J., Falco E. E., 1992, Gravitational Lenses, doi:10.1007/978-3-662-03758-4.
- Skowron & Gould (2012) Skowron J., Gould A., 2012, arXiv[astro-ph.EP]: 1203.1034,
- Soszyński et al. (2010) Soszyński I., Udalski A., Szymański M. K., Kubiak J., Pietrzyński G., Wyrzykowski Ł., Ulaczyk K., Poleski R., 2010, Acta Astron., 60, 165
- Soszyński et al. (2013) Soszyński I., et al., 2013, Acta Astron., 63, 21
- Soszyński et al. (2014) Soszyński I., et al., 2014, Acta Astron., 64, 177
- Sumi et al. (2013) Sumi T., et al., 2013, ApJ, 778, 150
- Thomson (1862) Thomson W., 1862, Proceedings of the Royal Society of London Series I, 12, 274
- Tisserand et al. (2007) Tisserand P., et al., 2007, A&A, 469, 387
- Valls-Gabaud (1998) Valls-Gabaud D., 1998, MNRAS, 294, 747
- Wyrzykowski et al. (2006) Wyrzykowski L., Udalski A., Mao S., Kubiak M., Szymanski M. K., Pietrzynski G., Soszynski I., Szewczyk O., 2006, Acta Astron., 56, 145
- Wyrzykowski et al. (2015) Wyrzykowski Ł., et al., 2015, ApJS, 216, 12
- Zheng & Ménard (2005) Zheng Z., Ménard B., 2005, ApJ, 635, 599