Quartic cumulant of baryon number in the presence of QCD critical point
Abstract
In the context of the ongoing search for the QCD critical point at the Relativistic Heavy-Ion Collider, we study the equation of state near the critical point in the temperature and baryon chemical potential plane. We use the parametric representation introduced in earlier literature, which maps the universal 3D Ising equation of state onto the QCD phase diagram using several non-universal parameters. We focus on the quartic cumulant of the baryon number, or baryon number susceptibility , which can be accessed experimentally via net-proton fluctuation kurtosis measurements. It was originally predicted, through universality arguments based on the leading singular contribution, that and net-proton kurtosis should show a specific non-monotonic behavior due to the critical point. In particular, when following the freeze-out curve on the phase diagram by decreasing beam energy, the kurtosis is expected to dip, and then peak, when the beam energy scan passes close to the critical point. We study the effects of the non-universal and thus far unknown parameters of the Ising-to-QCD mapping on the behavior of . We find that, while the peak remains a solid feature, the presence of the critical point does not necessarily cause a dip in on the freezeout line below the transition temperature. The critical point contribution to the dip appears only for a narrow set of mapping parameters, when subleading singular terms are sufficiently suppressed.
pacs:
I Introduction
One of the current major thrusts of the nuclear physics program is to map out the phase diagram of Quantum Chromodynamics (QCD) and specifically look for a critical point in the transition from a hadron resonance gas into deconfined plasma of quarks and gluons. Because the location of the QCD critical point is yet unknown, searches are currently ongoing across the relevant region of the QCD phase diagram. At high temperatures and intermediate baryon chemical potentials, relativistic heavy-ion collisions are able to scan the phase diagram by systematically decreasing the collision energy. This is the motivation behind the second phase of the Beam Energy Scan (BES-II) at Relativistic Heavy-Ion Collider (RHIC) (see, e.g., Ref. Bzdak et al. (2020) for a recent review). At lower temperatures and higher baryon chemical potentials, useful information can be extracted from the study of neutron stars and neutron star mergers. In fact, it appears that there may even be significant overlap in the phase diagram pertaining to the lowest beam energies in heavy-ion collisions and neutron star mergers Most et al. (2019); Adamczewski-Musch et al. (2020).
Lattice QCD calculations cannot be performed at finite Troyer and Wiese (2005); therefore, it is currently not possible to determine the location of the critical point from first principles. Thus, experimental searches for the critical point are central to determining its location Adam et al. (2020); Adamczewski-Musch et al. (2020). The main strategy is based on the search for certain non-monotonic dependence of fluctuations on an experimental variable, such as the collision energy , as the critical region is traversed during the scan of the QCD phase diagram Stephanov et al. (1998, 1999); Stephanov (2009, 2011). The nonmonotonic behavior of fluctuation measures is directly related to the divergence of susceptibilities at the critical point. Therefore, susceptibilities of conserved charges are of major interest for first principle lattice calculations (see, e.g., Ref. Ratti (2018) for a review). In the case of heavy-ion collisions, there are three conserved charges: baryon number (), strangeness (), and electric charge (), whereas in neutron star (mergers) only and are conserved, because the typical time scales are sufficiently large for weak processes to become relevant.
Baryon number susceptibilities diverge at the critical point Hatta and Ikeda (2003), and are, therefore, the most promising observables in its search. Since experiments measure multiplicities of charged particles, the closest quantities to baryon number susceptibilities, or cumulants, are the net-proton number cumulants, which show similar critical behavior Hatta and Stephanov (2003); Stephanov (2009); Athanasiou et al. (2010). Electric charge fluctuations contain a singular contribution from net-proton fluctuations, but this effect is diluted by pions and therefore it is expected to be milder Hatta and Stephanov (2003). Additionally, higher order cumulants are the most sensitive to critical behavior because they scale with higher powers of the correlation length Stephanov (2009, 2011) in the vicinity of the critical point. However, experimental measurements currently are only available up to the fourth cumulant Aggarwal et al. (2010); Adam et al. (2020) at large baryon densities with reasonable error bars.111The data for the sixth cumulant Nonaka (2020) are also available but with large statistical error bars and only at vanishing baryon densities.
At , it is possible to calculate the higher order susceptibilities on the lattice and then use them to reconstruct the lower order ones at small finite baryon densities, although with large numerical uncertainties Borsanyi et al. (2018); Bazavov et al. (2017); Ratti (2018). Alternatively, effective models exist that can reproduce lattice QCD results and do include a critical point at finite baryon density Critelli et al. (2017).
Another approach is to make use of the fact that the QCD critical point is expected to be in the same universality class as the 3D-Ising model Rajagopal and Wilczek (1993); Berges and Rajagopal (1999); Halasz et al. (1998); Karsch et al. (2001); de Forcrand and Philipsen (2003). Using this approach, a specific non-monotonic behavior of the fourth cumulant of net-proton number as a function of was proposed as a potential critical point signature in Ref. Stephanov (2011). This prediction has sparked interest in the community, especially in light of the BES-II and its Fixed Target Program collaboration (2014); Cebra et al. (2014), which is intended to provide larger statistics and reach lower collision energies.
The baryon number susceptibility, which has a similar behavior, can be obtained from the equation of state by differentiating the pressure at fixed temperature:
| (1) |
Due to the mapping between the QCD and the 3D Ising model critical equations of state, the leading divergence at the critical point comes from the fourth derivative of the Gibbs free energy , i.e., the third derivative of the critical order parameter (the magnetization ) with respect to the ordering (magnetic) field at constant reduced temperature :
| (2) |
Taking only the leading singular contribution, the predicted behavior for along a freeze-out curve (location of freezeout point as a function of ) starting at and passing close to the critical point is as follows. From its value at , is expected to decrease at increasing , then move upwards and reach a peak in the vicinity of the critical point. This peculiar, doubly non-monotonic behavior has motivated the experimental search for the critical point in the past years, also due to a quite similar behavior observed in the measured quantity
| (3) |
where , and are the kurtosis, variance and quartic cumulant of the net-proton number distribution. Indeed, the data from the STAR experiment Aggarwal et al. (2010) show decreasing and then swinging upwards as the collision energy decreases, which resembles the behavior predicted in Ref. Stephanov (2011). Although this similarity is indeed quite promising, other explanations have been proposed for the dip, such as global conservation of baryon number – which is expected to play a bigger role at low collision energies where the system is smaller Braun-Munzinger et al. (2017, 2020). Transport models that do not include any criticality, but do account for charge conservation, are able to reproduce the decrease at finite Sahoo et al. (2013). On the other hand, the dip also arises when extrapolating to finite in lattice QCD through a Taylor series Bazavov et al. (2017); Borsanyi et al. (2018). This suggests that at least some contribution to the experimentally observed dip comes from the equilibrium equation of state, which may, in principle, be due to the approach to the critical point.
The specific non-monotonic behavior predicted in Ref. Stephanov (2011) and described above focuses on the leading contribution to , given by . In the parametric equation of state we use in this paper, due to the mixing of and variables in the mapping of 3D Ising to QCD equation of state, there are also subleading critical contributions. The peculiarity of the QCD equation of state, as we see below in more detail, is that the leading contribution is suppressed by the smallness of the slope of the phase-separating line in the plane at the critical point. Therefore, unless the mixing is also suppressed, the subleading critical contribution could dominate in a significant part of the critical region, thus qualitatively changing the prediction.
In this work we investigate this effect by comparing two choices of the mixing parameters, which show qualitatively different behavior of near the critical point. One choice is a common “default” choice in the literature, where the mixing is not suppressed. Another choice is motivated by the recent work in Ref.Pradeep and Stephanov (2019), which argues that close to the chiral (small quark mass) limit, the mixing is suppressed. While in the latter choice we recover the pattern of behavior similar to Ref. Stephanov (2011), in the former, the subleading terms significantly changes that pattern. While the peak of is a robust feature independent of the parameter choice, the dip at is sensitive to the choice. It is worth pointing out that we explored several other parameter choices, not shown here, and that the dip disappears in almost all of them. The second parameter choice shown here is one of the few in which the dip is still visible. The reason for this will become clear below.
This paper is organized as follows. In Section II we quickly summarize the procedure developed in Ref. Parotto et al. (2018) to construct equations of state for QCD with a built-in criticality in the correct universality class. In Section III we present a discussion of the dependence of the critical region size and shape on the different parameters, focusing on the contribution from the leading divergence. In Section IV we present our results for several different choices of the parameters in the Ising-to-QCD map, which lead to our conclusions, summarized in Section VI.
II Parametric equation of state
In this work, we utilize the procedure for constructing a family of equations of states with a critical point developed in Ref. Parotto et al. (2018). This parametric family is constructed in such a way that all its members match lattice QCD results at (up to order ) and contain a critical point in the 3D Ising model universality class. We note that the implementation of the critical behavior is essentially the same as in Ref. Stephanov (2011).
The procedure can be summarized as follows:
-
i.
Define a parametrization of the 3D Ising model EoS in the vicinity of the critical point, imposing the correct critical behavior. Express the magnetization , the magnetic field and the reduced temperature in terms of the new parameters with Nonaka and Asakawa (2005); Guida and Zinn-Justin (1997); Schofield et al. (1969); Bluhm and Kampfer (2006):
(4) where and are normalization constants, , with and , and , are 3D Ising model critical exponents Guida and Zinn-Justin (1997). The parameters are within the range and , where is the first nontrivial zero of .
-
ii.
Map the phase diagram of the 3D-Ising model onto the plane of QCD, choosing the location of the critical point. A simple linear map Rehr and Mermin (1973) requires six parameters, and can be written as:
(5) (6) where are the coordinates of the critical point, and are the angles between the horizontal (fixed ) lines on the QCD phase diagram and the and Ising model axes, respectively. Finally, and are scaling parameters for the Ising-to-QCD map: determines the overall scale of both and , while determines the relative scale between the two.
As in Ref. Parotto et al. (2018), we reduce the number of parameters to four by imposing that the critical point is located on the chiral transition line given by lattice QCD calculations Bellwied et al. (2015):
(7) which allows us to fix the values of and by choosing only.
In order to be consistent with previous work, we use the same input from lattice QCD as in Ref. Parotto et al. (2018). Although recently new results on the QCD transition line have become available222Both in this work and in Ref Parotto et al. (2018), we assume that the QCD transition line is a parabola, with curvature determined in Ref. Bellwied et al. (2015). Recent results from lattice QCD Bazavov et al. (2019); Borsanyi et al. (2020) are consistent with this value of the curvature, and predict the next to leading order parameter which is consistent with 0 within error-bars. Bazavov et al. (2019); Borsanyi et al. (2020), we note that utilizing these new results would not have any effect on the conclusions presented here.
-
iii.
Impose exact matching to lattice QCD at at the level of the coefficients of Taylor expansion of the pressure through:
(8) where are the coefficients calculated from the lattice, and determine the contribution to the former due to the presence of the critical point. Eq. (8) is thus the definition for the coefficients required to match the given critical equation of state to lattice data without changing the singular behavior at the critical point. The procedure is carried out up to order .
-
iv.
Reconstruct the full QCD pressure as:
(9) where is the critical pressure from the 3D-Ising model mapped onto QCD. For additional details, we again refer the reader to Ref. Parotto et al. (2018).
With the procedure summarized here, the constructed EoS (i.e. the pressure, from which all needed derivatives can be calculated) by construction meets the initial requirements, and depends on the non-universal mapping between 3D-Ising model and QCD through the specific choice of parameters.
In the following we will consider only the critical point contribution to the 4-th order susceptibility of the baryon number in Eq. (1).
Since the procedure we just summarized stops at order , the total contribution obtained in our approach differs from the critical one by a constant in , i.e. a function depending on the temperature only. Thus, a similar plot for the total contribution would show the same features.
III The size and shape of the critical region
While the divergence of at the critical point is present for any choice of parameters due to the parametrization in Eq. (i), the extent of the region in the phase diagram where its magnitude is large (either positive or negative) is a nonuniversal property of the theory – the “size of the critical region” – which cannot be inferred from universality arguments. It is nonetheless of crucial importance, as it can ultimately determine whether the critical behavior can be observed in experiments.
Here we describe how the parameters of the mapping control the size of the critical region. We define the critical region as the region where the leading singular part of the equation of state dominates over the regular part. This comparison cannot be done on the pressure itself, since the critical contribution to the pressure vanishes at the critical point (as ). A reasonable measure of the critical region should be based on a quantity which diverges at the critical point, such as the baryon susceptibility, or, in our case, (where at fixed ). We shall estimate the size of the critical region along the crossover, , line. The singular part of at is given by
| (10) | |||||
where , , and , is an overall constant and at fixed . Comparing this to the regular contribution of order , we find for the extent of the critical region in the direction:
| (12) |
Therefore, while increasing increases the size of the critical region, the effect of increasing the parameter is very weak. For the mean-field value of and , the dependence is completely absent, while for the values , approximating the exact values of 3D Ising model exponents one finds a very weak dependence .
To determine the extent in the vertical, i.e. direction, we note that this corresponds to a finite ratio . Thus, the scaling variable as we approach the critical point, and we can set when determining the magnitude of :
| (13) | |||||
The condition then gives
| (15) |
The dependence on is given by . For the mean-field value of this corresponds to and for to .
IV Results and discussion
We now employ the procedure described in Section II to calculate the susceptibilities of the baryon number. We summarize our parameter choices in Table 1. We fix the location of the critical point sufficiently far from the axis to allow for maximum freedom in our parameter choice but still within the range of the Taylor expansion of . To satisfy those criteria we use , which results in and , and study several values of the parameters . In addition, we consider two different choices for the relative angle between the axes. First, we keep the two axes orthogonal (), as this has been a common “default” choice in the literature. Then we examine the case with the angle between the two axes . This second choice is motivated by the fact that, in the chiral limit, the angle difference vanishes (as quark mass to power ) and for sufficiently small quark mass 333This can be seen explicitly in the Random Matrix Model of the QCD phase diagram Halasz et al. (1998); Pradeep and Stephanov (2019)., according to Ref. Pradeep and Stephanov (2019). Note that, according to Eqs. (12) and (15), a small value for yields a larger critical region size for the same and : and .
| I. | ||||||
|---|---|---|---|---|---|---|
| II. |
We now investigate the behavior of the critical contribution to over the QCD phase diagram, with focus on the region close to the critical point and .
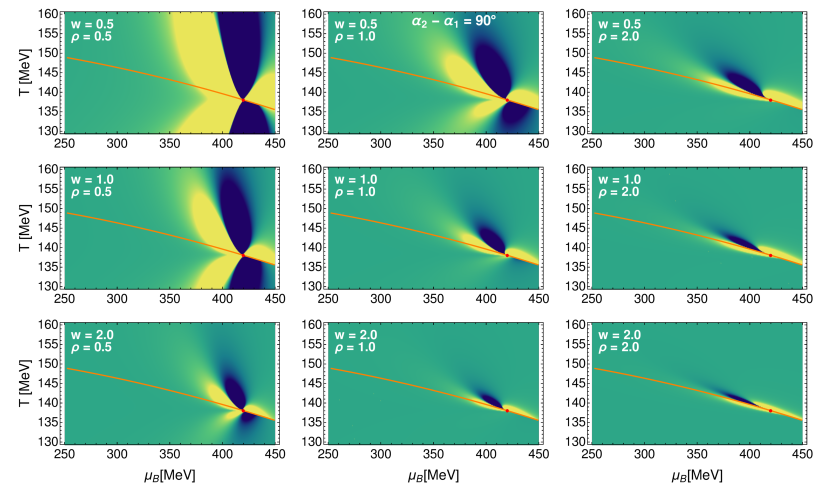
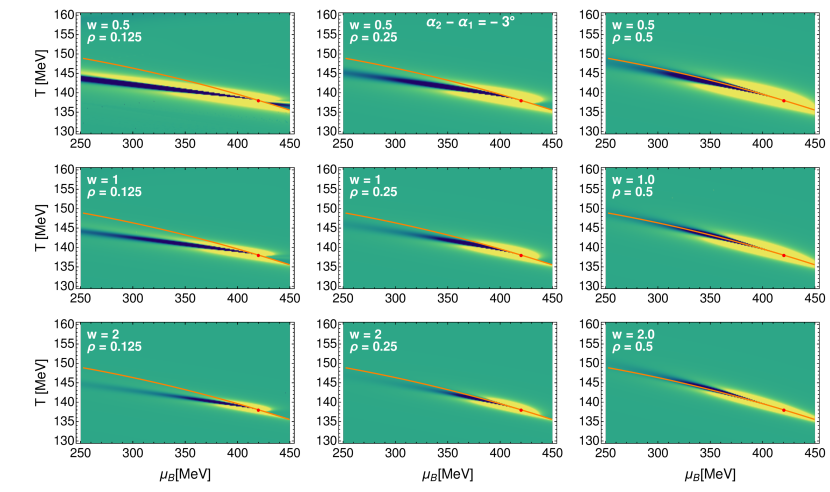
In Figs. 1 and 2, density plots of the critical contribution to in the plane are shown for and in the case of and and in the case of , respectively. The yellow and green areas correspond to positive values (the regions where it is the largest are indicated in yellow) of , while the blue ones correspond to negative values (darker blue in the regions where it is largest in magnitude). The orange curve shows the QCD transition line from Eq. (7). The red dot marks the critical point.
We note that the color function is not the same for Figs. 1 and 2. The color schemes are such that a factor 10 in the value of separates the two figures, for the same color. This is because, due to the dependence of on , this quantity is overall significantly larger in all the plots of Fig. 2 than in those of Fig. 1.
We would like to point out the following relevant features in Figs. 1 and 2:
-
i.
A smaller value of leads to a larger critical region in the direction, for both values of the relative angle . This follows from Eq.(15);
- ii.
-
iii.
It is most interesting to compare our findings to what was originally anticipated in Ref. Stephanov (2011) based on the leading singular contribution. While the pattern in Fig. 2 is in agreement with the leading singularity prediction, in Fig. 1 that prediction only holds extremely close to the critical point.
Away from the critical point the subleading singular terms modify the pattern. In Fig. 1 for and in Fig. 2 the main effect is the bending of the negative lobe away from the crossover line. The downward bending in Fig. 2 is a consequence of , while the upward bending in Fig. 1 is a consequence of , as explained in Ref.Pradeep and Stephanov (2019).
As a result, in Fig. 1, the critical contribution to the dip to the left of the critical point is absent, except in the extremely close vicinity of the critical point. Instead, the approach to the critical point from the left is characterized by a peak instead of a dip. Furthermore, for smaller values, an additional negative lobe appears below the critical point for larger .
To understand the effect of the choice of on the significance of the subleading singular contributions to we observe, let us examine the Ising-to-QCD mapping more closely. Eqs. (5), (6), allow us to convert the derivatives with respect to in the definition of in Eq. (1) into derivatives with respect to Ising variables and :
| (16) |
Since corresponds to the most relevant perturbation at the critical point ( has the largest scaling dimension), the dominant contribution to the derivative sufficiently close to the critical point comes from . Since is small, when is not small, the contribution of is suppressed by compared to . This is precisely the case in Fig. 1. While taking only the most divergent terms corresponds to setting , and hence from Eq. (2), the full expression for contains many additional subleading, less singular terms which involve . The subleading terms will become negligible sufficiently close to the critical point, but if the leading contribution is strongly suppressed this may not happen until we are extremely close to the critical point, as seen in Fig. 1. Thus, the pattern of the dependence of around the critical point is significantly affected by the subleading terms in this scenario.
On the other hand, when is small, as for our choice , the pattern is indeed more similar to the one described in Ref. Stephanov (2011). This can be seen in Fig. 2, especially when .
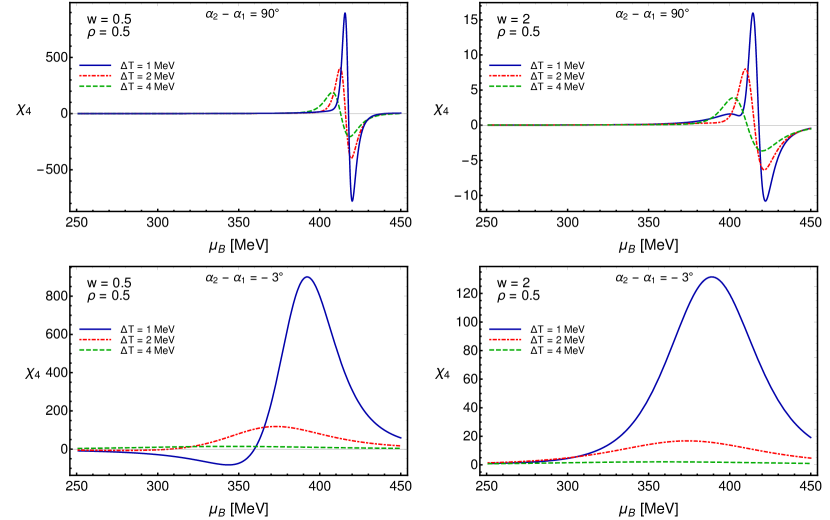
After analyzing the general behavior of over the QCD phase diagram, we now wish to determine the impact that its features can have on experimental measurements. We shall make a simplifying assumption that net-proton kurtosis has a similar critical behavior to , following the argument of Ref. Hatta and Stephanov (2003). In the following we study the behavior of along exemplary freeze-out trajectories, which are roughly parallel to the chiral/deconfinement transition line from Eq. (7):
| (17) |
where indicates the shift in temperature downward from the transition line. In Fig. 3 we show the behavior of the critical contribution to along such lines, with shifts . In the different panels, we consider the cases with (top row) and (bottom row), and with the parameter choices (left column) and (right column).
The choice that displays a dip for is the one with , and only in the close vicinity of the transition line, i.e., for . Fig. 2 suggests that this would be the case also for smaller values of , as we note that the lower the value of , the more apparent the downward bending is of the negative (blue) lobe. Since this behavior follows from our choice for the angle , we consider in the top panel of Fig. 4 different choices for the angle . We focus on lines parallel to the transition line, with , and keep in all cases.
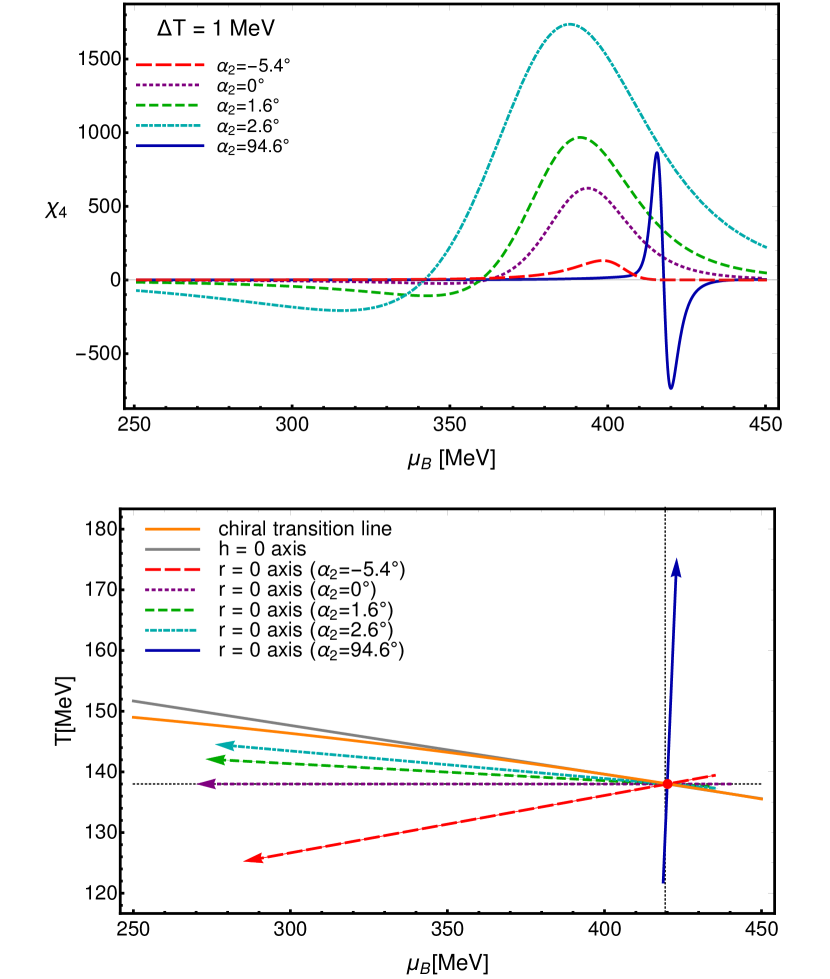
We consider a handful of choices for the angle . We include the ones corresponding to Fig. 1 () and Fig. 2 (), as well as . In the bottom panel of Fig. 4 we show the orientations of the axis corresponding to the different values of we used. As anticipated, only in the cases satisfying a dip for is seen. Moreover, we consider in this plot a shift between the chemical freeze-out line and the chiral transition line. With larger separation, a dip would be harder to observe, as shown in Fig. 3.
V Experimental considerations
In our current study we focused on the equilibrium properties of the QCD equation of state that can lead to the potential discovery of the QCD critical point. However, because heavy-ion collisions are inherently dynamical systems, direct comparison with experimental data would require an event-by-event relativistic viscous hydrodynamics model with BSQ conserved charges Noronha-Hostler et al. (2019); Monnai et al. (2019) and critical fluctuations coupled to a hadronic transport code.
While important efforts are being made along these lines in terms of new hydrodynamical models Karpenko et al. (2014a, b); Du and Heinz (2020); Denicol et al. (2018); Batyuk et al. (2018); Fotakis et al. (2020); Dore et al. (2020a), transport coefficients Demir and Bass (2009); Denicol et al. (2013); Kadam and Mishra (2014); Monnai et al. (2017); Rougemont et al. (2017, 2017); Auvinen et al. (2018); Martinez et al. (2019), critical fluctuations Stephanov et al. (1999); Jiang et al. (2016); Stephanov and Yin (2018); Nahrgang et al. (2018); An et al. (2019), and freeze-out Stephanov (2010); Feng et al. (2017); Li et al. (2018); Steinheimer et al. (2019); Oliinychenko and Koch (2019); Oliinychenko et al. (2020), the full dynamical description does not yet exist at this time. In the meantime, a number of attempts have been made to quantify effects such as critical slowing down and memory, finite volume/lifetime, number of particles, decays, charge conservation, kinematic cuts, low statistics etc Berdnikov and Rajagopal (2000); Mukherjee et al. (2015, 2016); Akamatsu et al. (2019); Westfall (2015); Noronha-Hostler et al. (2016); Bzdak and Koch (2017); Steinheimer and Koch (2017); Bzdak et al. (2017); Bzdak and Koch (2019); Braun-Munzinger et al. (2019); Poberezhnyuk et al. (2020); Braun-Munzinger et al. (2020). Yet further studies have looked into the influence of far-from-equilibrium initial conditions and potential attractors at the critical point Dore et al. (2020b) and the influence of viscous effects across a first order phase transition line Feng et al. (2018).
Another remaining question that is very relevant to this study is the temperature difference between hadronization and freeze-out. Earlier attempts were made in dynamic models to quantify either the time scale or temperature range in the difference between hadronization and freeze-out Wong (1996); Rapp and Shuryak (2001); Greiner and Leupold (2001); Greiner et al. (2005); Noronha-Hostler et al. (2008, 2010); Noronha-Hostler and Greiner (2014); Almási and Wolf (2015); Beitel et al. (2016); Gallmeister et al. (2018). Generally, this depends on the number of hadrons in the system Alba et al. (2020) and their corresponding interactions Becattini et al. (2013); Alba et al. (2018); Vovchenko et al. (2017); Lo et al. (2018). However, given enough particles that appear near the phase transition that are strongly interacting, it is possible to reach chemical equilibrium on very short time scales Borsanyi et al. (2013); Bellwied et al. (2013); Borsanyi et al. (2014); Alba et al. (2014); Bellwied et al. (2019).
VI Conclusions
In this work we have studied the fourth order susceptibility, , of the baryon number in QCD in the presence of a critical point in the 3D Ising model universality class. We found that some features of the and dependence of could be significantly affected by sub-leading, less singular terms in the critical behavior. In all cases that we studied, we found a diverging peak at the critical point. However, only in the special case of (which also implies a wide critical region that is extended along the chiral phase transition) do we obtain a dip as one approaches the critical point along an exemplary freezeout curve below the transition temperature. In this case, at temperatures significantly lower than the transition the dip moves to smaller and fades away.
One of the conclusions which can be drawn from this study is that the peak in net-proton kurtosis is a more robust signature of the critical point than the dip. However, it is also important to keep in mind that the observation of the dip may help determine or constrain the value of the parameter , provided other potential experimental contributions to the dip (the baseline) are under control.
It is important to emphasize that this study only considers the equilibrium equation of state and it would be interesting and important to explore these issues further in dynamical models. For example, as has been observed in Refs.Berdnikov and Rajagopal (2000); Stephanov (2010); Mukherjee et al. (2016), critical slowing down, charge conservation and memory effects may help to preserve the signatures of critical fluctuations down to lower temperatures below the critical region.
Acknowledgments
This material is based upon work supported by the National Science Foundation under grant no. PHY-1654219 and by the U.S. Department of Energy, Office of Science, Office of Nuclear Physics, within the framework of the Beam Energy Scan Topical (BEST) Collaboration and grants Nos. DE-SC0019175 and DE-FG02-01ER41195. We also acknowledge the support from the Center of Advanced Computing and Data Systems at the University of Houston. J.N.H. acknowledges support from the Alfred P Sloan Foundation. P.P. also acknowledges support by the DFG grant SFB/TR55. D.M. was supported by the National Science Foundation Graduate Research Fellowship Program under Grant No. DGE – 1746047
References
- Bzdak et al. (2020) A. Bzdak, S. Esumi, V. Koch, J. Liao, M. Stephanov, and N. Xu, Phys. Rept. 853, 1 (2020), arXiv:1906.00936 [nucl-th] .
- Most et al. (2019) E. R. Most, L. J. Papenfort, V. Dexheimer, M. Hanauske, S. Schramm, H. Stöcker, and L. Rezzolla, Phys. Rev. Lett. 122, 061101 (2019), arXiv:1807.03684 [astro-ph.HE] .
- Adamczewski-Musch et al. (2020) J. Adamczewski-Musch et al. (HADES), (2020), arXiv:2002.08701 [nucl-ex] .
- Troyer and Wiese (2005) M. Troyer and U.-J. Wiese, Phys. Rev. Lett. 94, 170201 (2005), arXiv:cond-mat/0408370 .
- Adam et al. (2020) J. Adam et al. (STAR), (2020), arXiv:2001.02852 [nucl-ex] .
- Stephanov et al. (1998) M. A. Stephanov, K. Rajagopal, and E. V. Shuryak, Phys. Rev. Lett. 81, 4816 (1998), arXiv:hep-ph/9806219 [hep-ph] .
- Stephanov et al. (1999) M. A. Stephanov, K. Rajagopal, and E. V. Shuryak, Phys. Rev. D60, 114028 (1999), arXiv:hep-ph/9903292 [hep-ph] .
- Stephanov (2009) M. A. Stephanov, Phys. Rev. Lett. 102, 032301 (2009), arXiv:0809.3450 [hep-ph] .
- Stephanov (2011) M. A. Stephanov, Phys. Rev. Lett. 107, 052301 (2011), arXiv:1104.1627 [hep-ph] .
- Ratti (2018) C. Ratti, Rept. Prog. Phys. 81, 084301 (2018), arXiv:1804.07810 [hep-lat] .
- Hatta and Ikeda (2003) Y. Hatta and T. Ikeda, Phys. Rev. D 67, 014028 (2003), arXiv:hep-ph/0210284 .
- Hatta and Stephanov (2003) Y. Hatta and M. A. Stephanov, Phys. Rev. Lett. 91, 102003 (2003), [Erratum: Phys. Rev. Lett.91,129901(2003)], arXiv:hep-ph/0302002 [hep-ph] .
- Athanasiou et al. (2010) C. Athanasiou, K. Rajagopal, and M. Stephanov, Phys. Rev. D82, 074008 (2010), arXiv:1006.4636 [hep-ph] .
- Aggarwal et al. (2010) M. M. Aggarwal et al. (STAR), Phys. Rev. Lett. 105, 022302 (2010), arXiv:1004.4959 [nucl-ex] .
- Nonaka (2020) T. Nonaka (STAR), in 28th International Conference on Ultrarelativistic Nucleus-Nucleus Collisions (2020) arXiv:2002.12505 [nucl-ex] .
- Borsanyi et al. (2018) S. Borsanyi, Z. Fodor, J. N. Guenther, S. K. Katz, K. K. Szabo, A. Pasztor, I. Portillo, and C. Ratti, JHEP 10, 205 (2018), arXiv:1805.04445 [hep-lat] .
- Bazavov et al. (2017) A. Bazavov et al. (HotQCD), Phys. Rev. D 96, 074510 (2017), arXiv:1708.04897 [hep-lat] .
- Critelli et al. (2017) R. Critelli, J. Noronha, J. Noronha-Hostler, I. Portillo, C. Ratti, and R. Rougemont, Phys. Rev. D96, 096026 (2017), arXiv:1706.00455 [nucl-th] .
- Rajagopal and Wilczek (1993) K. Rajagopal and F. Wilczek, Nucl. Phys. B399, 395 (1993), arXiv:hep-ph/9210253 [hep-ph] .
- Berges and Rajagopal (1999) J. Berges and K. Rajagopal, Nucl. Phys. B538, 215 (1999), arXiv:hep-ph/9804233 [hep-ph] .
- Halasz et al. (1998) A. M. Halasz, A. D. Jackson, R. E. Shrock, M. A. Stephanov, and J. J. M. Verbaarschot, Phys. Rev. D58, 096007 (1998), arXiv:hep-ph/9804290 [hep-ph] .
- Karsch et al. (2001) F. Karsch, E. Laermann, and C. Schmidt, Phys. Lett. B520, 41 (2001), arXiv:hep-lat/0107020 [hep-lat] .
- de Forcrand and Philipsen (2003) P. de Forcrand and O. Philipsen, Nucl. Phys. B673, 170 (2003), arXiv:hep-lat/0307020 [hep-lat] .
- collaboration (2014) S. collaboration, “Studying the Phase Diagram of QCD Matter at RHIC,” (2014).
- Cebra et al. (2014) D. Cebra, S. Brovko, C. Flores, B. Haag, and J. Klay, “Coulomb effect in Au+Au and Pb+Pb collisions as a function of collision energy,” (2014), arXiv:1408.1369 [nucl-ex] .
- Braun-Munzinger et al. (2017) P. Braun-Munzinger, A. Rustamov, and J. Stachel, Nucl. Phys. A960, 114 (2017), arXiv:1612.00702 [nucl-th] .
- Braun-Munzinger et al. (2020) P. Braun-Munzinger, B. Friman, K. Redlich, A. Rustamov, and J. Stachel, (2020), arXiv:2007.02463 [nucl-th] .
- Sahoo et al. (2013) N. R. Sahoo, S. De, and T. K. Nayak, Phys. Rev. C87, 044906 (2013), arXiv:1210.7206 [nucl-ex] .
- Pradeep and Stephanov (2019) M. S. Pradeep and M. Stephanov, Phys. Rev. D100, 056003 (2019), arXiv:1905.13247 [hep-ph] .
- Parotto et al. (2018) P. Parotto, M. Bluhm, D. Mroczek, M. Nahrgang, J. Noronha-Hostler, K. Rajagopal, C. Ratti, T. Schäfer, and M. Stephanov, (2018), arXiv:1805.05249 [hep-ph] .
- Nonaka and Asakawa (2005) C. Nonaka and M. Asakawa, Phys. Rev. C71, 044904 (2005), arXiv:nucl-th/0410078 [nucl-th] .
- Guida and Zinn-Justin (1997) R. Guida and J. Zinn-Justin, Nucl. Phys. B489, 626 (1997), arXiv:hep-th/9610223 [hep-th] .
- Schofield et al. (1969) P. Schofield, J. D. Litster, and J. T. Ho, Phys. Rev. Lett. 23, 1098 (1969).
- Bluhm and Kampfer (2006) M. Bluhm and B. Kampfer, Critical point and onset of deconfinement. Proceedings, 3rd Conference, CPOD2006, Florence, Itlay, July 3-6, 2006, PoS CPOD2006, 004 (2006), arXiv:hep-ph/0611083 [hep-ph] .
- Rehr and Mermin (1973) J. J. Rehr and N. D. Mermin, Phys. Rev. A8, 472 (1973).
- Bellwied et al. (2015) R. Bellwied, S. Borsanyi, Z. Fodor, J. Guenther, S. D. Katz, C. Ratti, and K. K. Szabo, Phys. Lett. B751, 559 (2015), arXiv:1507.07510 [hep-lat] .
- Bazavov et al. (2019) A. Bazavov et al. (HotQCD), Phys. Lett. B795, 15 (2019), arXiv:1812.08235 [hep-lat] .
- Borsanyi et al. (2020) S. Borsanyi, Z. Fodor, J. N. Guenther, R. Kara, S. D. Katz, P. Parotto, A. Pasztor, C. Ratti, and K. K. Szabo, (2020), arXiv:2002.02821 [hep-lat] .
- Noronha-Hostler et al. (2019) J. Noronha-Hostler, P. Parotto, C. Ratti, and J. Stafford, Phys. Rev. C 100, 064910 (2019), arXiv:1902.06723 [hep-ph] .
- Monnai et al. (2019) A. Monnai, B. Schenke, and C. Shen, Phys. Rev. C 100, 024907 (2019), arXiv:1902.05095 [nucl-th] .
- Karpenko et al. (2014a) I. Karpenko, P. Huovinen, and M. Bleicher, Comput. Phys. Commun. 185, 3016 (2014a), arXiv:1312.4160 [nucl-th] .
- Karpenko et al. (2014b) I. Karpenko, M. Bleicher, P. Huovinen, and H. Petersen, J. Phys. Conf. Ser. 503, 012040 (2014b), arXiv:1311.0133 [nucl-th] .
- Du and Heinz (2020) L. Du and U. Heinz, Comput. Phys. Commun. 251, 107090 (2020), arXiv:1906.11181 [nucl-th] .
- Denicol et al. (2018) G. S. Denicol, C. Gale, S. Jeon, A. Monnai, B. Schenke, and C. Shen, Phys. Rev. C98, 034916 (2018), arXiv:1804.10557 [nucl-th] .
- Batyuk et al. (2018) P. Batyuk, D. Blaschke, M. Bleicher, Y. B. Ivanov, I. Karpenko, L. Malinina, S. Merts, M. Nahrgang, H. Petersen, and O. Rogachevsky, EPJ Web Conf. 182, 02056 (2018), arXiv:1711.07959 [nucl-th] .
- Fotakis et al. (2020) J. A. Fotakis, M. Greif, C. Greiner, G. S. Denicol, and H. Niemi, Phys. Rev. D 101, 076007 (2020), arXiv:1912.09103 [hep-ph] .
- Dore et al. (2020a) T. Dore, E. McLaughlin, and J. Noronha-Hostler, in 36th Winter Workshop on Nuclear Dynamics (2020) arXiv:2006.04206 [nucl-th] .
- Demir and Bass (2009) N. Demir and S. A. Bass, Phys. Rev. Lett. 102, 172302 (2009), arXiv:0812.2422 [nucl-th] .
- Denicol et al. (2013) G. S. Denicol, C. Gale, S. Jeon, and J. Noronha, Phys. Rev. C 88, 064901 (2013), arXiv:1308.1923 [nucl-th] .
- Kadam and Mishra (2014) G. P. Kadam and H. Mishra, Nucl. Phys. A 934, 133 (2014), arXiv:1408.6329 [hep-ph] .
- Monnai et al. (2017) A. Monnai, S. Mukherjee, and Y. Yin, Phys. Rev. C95, 034902 (2017), arXiv:1606.00771 [nucl-th] .
- Rougemont et al. (2017) R. Rougemont, R. Critelli, J. Noronha-Hostler, J. Noronha, and C. Ratti, Phys. Rev. D 96, 014032 (2017), arXiv:1704.05558 [hep-ph] .
- Auvinen et al. (2018) J. Auvinen, J. E. Bernhard, S. A. Bass, and I. Karpenko, Phys. Rev. C97, 044905 (2018), arXiv:1706.03666 [hep-ph] .
- Martinez et al. (2019) M. Martinez, T. Schäfer, and V. Skokov, Phys. Rev. D 100, 074017 (2019), arXiv:1906.11306 [hep-ph] .
- Jiang et al. (2016) L. Jiang, P. Li, and H. Song, Phys. Rev. C 94, 024918 (2016), arXiv:1512.06164 [nucl-th] .
- Stephanov and Yin (2018) M. Stephanov and Y. Yin, Phys. Rev. D98, 036006 (2018), arXiv:1712.10305 [nucl-th] .
- Nahrgang et al. (2018) M. Nahrgang, M. Bluhm, T. Schäfer, and S. A. Bass, (2018), arXiv:1804.05728 [nucl-th] .
- An et al. (2019) X. An, G. Basar, M. Stephanov, and H.-U. Yee, Phys. Rev. C 100, 024910 (2019), arXiv:1902.09517 [hep-th] .
- Stephanov (2010) M. A. Stephanov, Phys. Rev. D81, 054012 (2010), arXiv:0911.1772 [hep-ph] .
- Feng et al. (2017) B. Feng, Z. Xu, and C. Greiner, Phys. Rev. C 95, 024907 (2017), arXiv:1607.01644 [hep-ph] .
- Li et al. (2018) J. Li, H.-j. Xu, and H. Song, Phys. Rev. C 97, 014902 (2018), arXiv:1707.09742 [nucl-th] .
- Steinheimer et al. (2019) J. Steinheimer, L. Pang, K. Zhou, V. Koch, J. Randrup, and H. Stoecker, JHEP 12, 122 (2019), arXiv:1906.06562 [nucl-th] .
- Oliinychenko and Koch (2019) D. Oliinychenko and V. Koch, Phys. Rev. Lett. 123, 182302 (2019), arXiv:1902.09775 [hep-ph] .
- Oliinychenko et al. (2020) D. Oliinychenko, S. Shi, and V. Koch, (2020), arXiv:2001.08176 [hep-ph] .
- Berdnikov and Rajagopal (2000) B. Berdnikov and K. Rajagopal, Phys. Rev. D61, 105017 (2000), arXiv:hep-ph/9912274 [hep-ph] .
- Mukherjee et al. (2015) S. Mukherjee, R. Venugopalan, and Y. Yin, Phys. Rev. C92, 034912 (2015), arXiv:1506.00645 [hep-ph] .
- Mukherjee et al. (2016) S. Mukherjee, R. Venugopalan, and Y. Yin, Phys. Rev. Lett. 117, 222301 (2016), arXiv:1605.09341 [hep-ph] .
- Akamatsu et al. (2019) Y. Akamatsu, D. Teaney, F. Yan, and Y. Yin, Phys. Rev. C 100, 044901 (2019), arXiv:1811.05081 [nucl-th] .
- Westfall (2015) G. D. Westfall, Phys. Rev. C 92, 024902 (2015), arXiv:1412.5988 [nucl-th] .
- Noronha-Hostler et al. (2016) J. Noronha-Hostler, R. Bellwied, J. Gunther, P. Parotto, A. Pasztor, I. Portillo Vazquez, and C. Ratti, (2016), arXiv:1607.02527 [hep-ph] .
- Bzdak and Koch (2017) A. Bzdak and V. Koch, Phys. Rev. C 96, 054905 (2017), arXiv:1707.02640 [nucl-th] .
- Steinheimer and Koch (2017) J. Steinheimer and V. Koch, Phys. Rev. C 96, 034907 (2017), arXiv:1705.08538 [nucl-th] .
- Bzdak et al. (2017) A. Bzdak, V. Koch, and V. Skokov, Eur. Phys. J. C 77, 288 (2017), arXiv:1612.05128 [nucl-th] .
- Bzdak and Koch (2019) A. Bzdak and V. Koch, Phys. Rev. C 100, 051902 (2019), arXiv:1811.04456 [nucl-th] .
- Braun-Munzinger et al. (2019) P. Braun-Munzinger, A. Rustamov, and J. Stachel, (2019), arXiv:1907.03032 [nucl-th] .
- Poberezhnyuk et al. (2020) R. V. Poberezhnyuk, O. Savchuk, M. I. Gorenstein, V. Vovchenko, K. Taradiy, V. V. Begun, L. Satarov, J. Steinheimer, and H. Stoecker, (2020), arXiv:2004.14358 [hep-ph] .
- Dore et al. (2020b) T. Dore, E. McLaughlin, and J. Noronha-Hostler, (2020b), arXiv:2007.15083 [nucl-th] .
- Feng et al. (2018) B. Feng, C. Greiner, S. Shi, and Z. Xu, Phys. Lett. B 782, 262 (2018), arXiv:1802.02494 [hep-ph] .
- Wong (1996) S. Wong, Phys. Rev. C 54, 2588 (1996), arXiv:hep-ph/9609287 .
- Rapp and Shuryak (2001) R. Rapp and E. V. Shuryak, Phys. Rev. Lett. 86, 2980 (2001), arXiv:hep-ph/0008326 [hep-ph] .
- Greiner and Leupold (2001) C. Greiner and S. Leupold, J. Phys. G 27, L95 (2001), arXiv:nucl-th/0009036 .
- Greiner et al. (2005) C. Greiner, P. Koch-Steinheimer, F. Liu, I. Shovkovy, and H. Stoecker, J. Phys. G 31, S725 (2005), arXiv:hep-ph/0412095 .
- Noronha-Hostler et al. (2008) J. Noronha-Hostler, C. Greiner, and I. Shovkovy, Phys. Rev. Lett. 100, 252301 (2008), arXiv:0711.0930 [nucl-th] .
- Noronha-Hostler et al. (2010) J. Noronha-Hostler, M. Beitel, C. Greiner, and I. Shovkovy, Phys. Rev. C 81, 054909 (2010), arXiv:0909.2908 [nucl-th] .
- Noronha-Hostler and Greiner (2014) J. Noronha-Hostler and C. Greiner, Nucl. Phys. A 931, 1108 (2014), arXiv:1408.0761 [nucl-th] .
- Almási and Wolf (2015) G. A. Almási and G. Wolf, Nucl. Phys. A 943, 117 (2015), arXiv:1407.2047 [nucl-th] .
- Beitel et al. (2016) M. Beitel, C. Greiner, and H. Stoecker, Phys. Rev. C 94, 021902 (2016), arXiv:1601.02474 [hep-ph] .
- Gallmeister et al. (2018) K. Gallmeister, M. Beitel, and C. Greiner, Phys. Rev. C 98, 024915 (2018), arXiv:1712.04018 [hep-ph] .
- Alba et al. (2020) P. Alba, V. M. Sarti, J. Noronha-Hostler, P. Parotto, I. Portillo-Vazquez, C. Ratti, and J. Stafford, Phys. Rev. C 101, 054905 (2020), arXiv:2002.12395 [hep-ph] .
- Becattini et al. (2013) F. Becattini, M. Bleicher, T. Kollegger, T. Schuster, J. Steinheimer, and R. Stock, Phys. Rev. Lett. 111, 082302 (2013), arXiv:1212.2431 [nucl-th] .
- Alba et al. (2018) P. Alba, V. Vovchenko, M. Gorenstein, and H. Stoecker, Nucl. Phys. A 974, 22 (2018), arXiv:1606.06542 [hep-ph] .
- Vovchenko et al. (2017) V. Vovchenko, A. Motornenko, P. Alba, M. I. Gorenstein, L. M. Satarov, and H. Stoecker, Phys. Rev. C 96, 045202 (2017), arXiv:1707.09215 [nucl-th] .
- Lo et al. (2018) P. M. Lo, B. Friman, K. Redlich, and C. Sasaki, Phys. Lett. B 778, 454 (2018), arXiv:1710.02711 [hep-ph] .
- Borsanyi et al. (2013) S. Borsanyi, Z. Fodor, S. Katz, S. Krieg, C. Ratti, and K. Szabo, Phys. Rev. Lett. 111, 062005 (2013), arXiv:1305.5161 [hep-lat] .
- Bellwied et al. (2013) R. Bellwied, S. Borsanyi, Z. Fodor, S. D. Katz, and C. Ratti, Phys. Rev. Lett. 111, 202302 (2013), arXiv:1305.6297 [hep-lat] .
- Borsanyi et al. (2014) S. Borsanyi, Z. Fodor, S. Katz, S. Krieg, C. Ratti, and K. Szabo, Phys. Rev. Lett. 113, 052301 (2014), arXiv:1403.4576 [hep-lat] .
- Alba et al. (2014) P. Alba, W. Alberico, R. Bellwied, M. Bluhm, V. Mantovani Sarti, M. Nahrgang, and C. Ratti, Phys. Lett. B 738, 305 (2014), arXiv:1403.4903 [hep-ph] .
- Bellwied et al. (2019) R. Bellwied, J. Noronha-Hostler, P. Parotto, I. Portillo Vazquez, C. Ratti, and J. M. Stafford, Phys. Rev. C 99, 034912 (2019), arXiv:1805.00088 [hep-ph] .