A Mysterious Ring in Dark Space?
Abstract
We report the discovery of a low-surface-brightness (27.42 in g band) nebula, which has a ring-like shape in the Beijing-Arizona Sky Survey (BASS). Positive detections have been found in multiband data from far ultraviolet to far infrared, except the z band from BASS and W1, W2 from the Wide-field Infrared Survey Explorer. The reddening of the nebula 0.02 mag is estimated from Infrared Astronomical Satellite (IRAS) 100 m intensity and H i column density. With the help of the 3D reddening map from Pan-STARRS 1, the Two Micron All Sky Survey, and Gaia, the distance to the nebula of about 500 pc from Earth is derived. Such a low-surface-brightness nebula whose energy can be interpreted by the diffuse Galactic light could account for the optical counterpart of the infrared cirrus, which was detected by IRAS more than 30 yr ago. The ring-like structure might be the ultimate phase of an evolved planetary nebula, while the central white dwarf star has been ejected from the nebula for an unclear reason. On the other hand, the ring structure being a superposition of two close filaments might be another reasonable explanation. Considering the lack of spectroscopic data and uncertainty in the distance measurement, these interpretations need to be checked by future observations.
1 Introduction
The interstellar medium (ISM) is responsible for forming the stars, and is one of the most important components of galaxies. About 10% of the baryons in the Milky Way are found in the ISM. The ISM often appears in a variety of sizes and structures, which are shaped like of filaments, loops, arcs, sheets, rings, and expanding shells. The structures are usually related to the ongoing star formation in the H ii regions, supernova expansion, or planetary nebulae (PNs). Besides, they are also subject to Rayleigh-Taylor instability or even global reorganizations of large volumes in space.
The optical diffuse Galactic light (DGL), sometimes called as “optical cirrus”, was firstly found near the star-forming regions (Elvey & Roach, 1937), and then observed along the whole Galactic plane and even in some high Galactic latitude areas (Sandage, 1976), which was explained as the reflection and scattering of the starlight by the diffuse ISM. Diffuse emission from the so-called “infrared cirrus” at high and intermediate Galactic latitudes has also been detected in the Infrared Astronomical Satellite (IRAS) 60 and 100 m bands (Low et al., 1984), which have shown good spatial correlations with the DGL (de Vries & Le Poole, 1985; Laureijs et al., 1987; Ienaka et al., 2013). The spectra of the DGL is consistent with scattered starlight and the continuum can be reconstructed by a Galactic radiative transfer model with relatively few large grains (Brandt & Draine, 2012). The DGL is detected in the UV observations as well (Witt et al., 1997; Boissier et al., 2015). Complementing multiwavelength observations including UV, optical, and IR, the DGL could be a very helpful tracer to better understand the nature of the Galactic ISM and details of the star-forming process (Miville-Deschênes et al., 2016).
The current generation of deep optical surveys allow us to detect faint galaxy satellites (McConnachie, 2012) and explore galactic substructures as tidal features and stellar streams (Ibata et al., 2009; Tanaka et al., 2011; Ibata et al., 2014; Martin et al., 2014; McConnachie et al., 2018). The DGL can be a significant contaminant for extragalactic studies, even at high Galactic latitudes, particularly when the focus is low-surface-brightness galaxies (LSBGs), or diffuse stellar halos around massive galaxies. The contaminant becomes more prominent when the surface brightness is fainter than 26 (Duc et al., 2015; Greco et al., 2018). The presence of the diffuse light scattered by Galactic dust clouds could significantly bias our interpretation of low-surface-brightness features and diffuse light observed around galaxies and in the clusters of galaxies (Cortese et al., 2010). For example, Mihos et al. (2005) first find a low-surface-brightness plume near the interacting pair NGC 4435/4438 in the Virgo cluster. This feature has been interpreted as a tidal stream, until it was found more like Galactic cirrus by Cortese et al. (2010) using multiband data including far-UV (FUV), far-IR (FIR), H i and CO emissions. Studied in the 1960s, Arp’s loop has been thought to be a tidal tail, material pulled out of M81 by gravitational interaction with its large neighboring galaxy M82 (Arp, 1965). But a recent investigation demonstrates that much of Arp’s loop likely lies within our own Galaxy (Sollima et al., 2010). Román et al. (2019) systematically searched the Galactic cirrus based on deep optical photometry in the Sloan Digital Sky Survey (SDSS) Stripe82 region. The results showed that the higher 100 m emission, the redder color is for the Galactic cirrus. And in most cases, the optical colors of the Galactic cirrus differ significantly from those of extragalactic sources.
During the process of searching LSBGs in the Beijing-Arizona Sky Survey (BASS), we find a low-surface-brightness nebula with a ring-like shape whose g band surface brightness is down to 27.42 . Observation data suggest that as the wide-field photometric surveys go deeper, more nebulae at the faint end of the DGL similar to this one are likely to be found. The symmetrical shape can easily raise a question: could this low-surface-brightness nebula be a supernova remnant or a PN? Through detailed analysis of multiband data from FUV to 21 cm, the possibility that the circular shape of the nebula is the ultimate phase of a PN that exploded about 255,000 yr ago is discussed.
The paper is structured as follows. In §2 we introduce the multiband observations from UV to H i. We calculate the extinction and distance of the nebula in §3. We discuss several possible mechanisms of the formation of the ring-like nebula in §4. Finally we end the paper with the conclusion and discussion in §5.
2 Observations
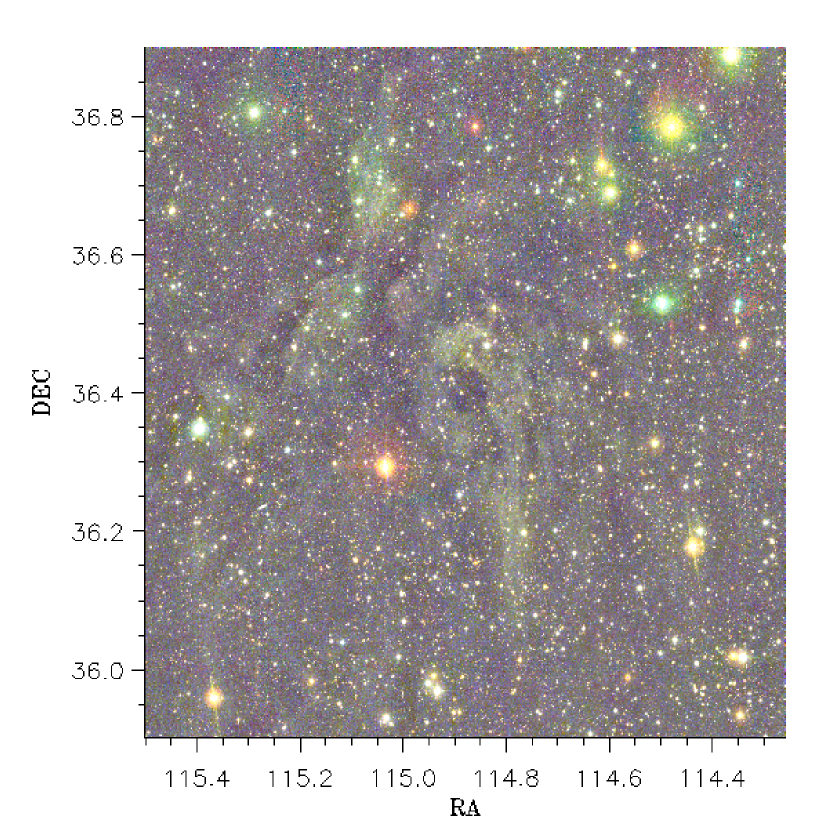
Our work uses photometric data of the BASS in the g and r bands with the prime focus of the Bok 2.3 m telescope. The Bok Telescope, owned and operated by the University of Arizona, is situated on Kitt Peak and is adjacent to the 4 m Mayall Telescope. The 90Prime instrument is a prime focus 8k 8k CCD imager, with four University of Arizona Imaging Technology Laboratory (ITL) 4k 4k CCDs that have been thinned and UV optimized with a peak quantum efficiency of 95% at 4000 Å. Since BASS only contains g and r filters, the u and z band images were taken specifically using the Bok Telescope and the Mayall Telescope, so as to cover the whole optical wavelength range. For the u, g, r, and z bands, the total integration times are about 3750, 750, 580, and 280 s; the image resolutions (FWHMs), are 13, 17, 13 and 13; and the magnitude limits at the 5 level for point sources can reach 24.5, 24.2, 23.6, and 23.0 mag in AB systems, respectively (Zou et al., 2019). The target field is centered at (RA., decl.)J2000 = (11488, 3640) and it is about 14 11 wide. Three optical images including u, g and r are smoothed and stacked to generate a color image with a field of view (FOV) of 1 1∘ as shown in Figure 1, in which a ring-like nebula is spotted. More interesting is that this ring and a spur extending to the south form a shape like the number 9.
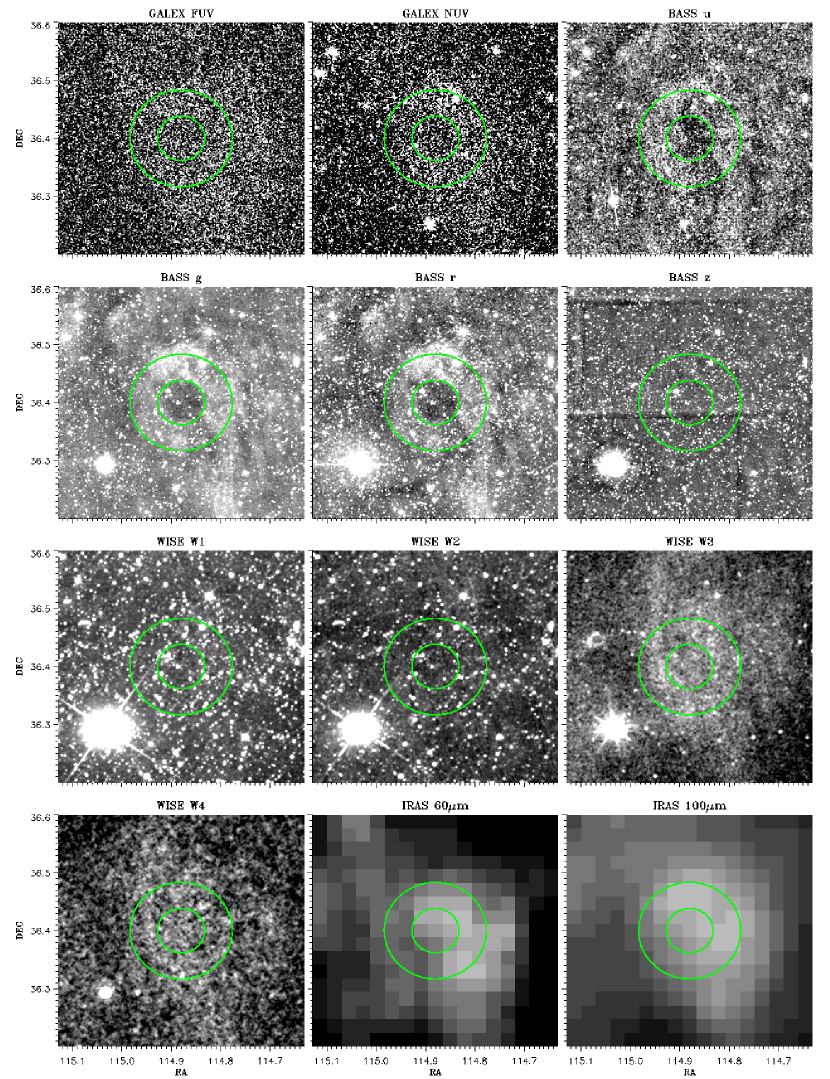
In order to eliminate the possibility of a ghost image or artifacts, we compare the images from the Galaxy Evolution Explorer (GALEX), Wide-field Infrared Survey Explorer (WISE) and IRAS. As shown in Figure 2, four optical bands from the BASS observations, near-UV (NUV) and far-UV (FUV) from GALEX, W1, W2, W3, and W4 from WISE, and 60 and 100 m from IRAS are centered at the same frame. All bands except z from BASS and W1 and W2 from WISE have shown positive detections. In all images, two green circles with 46 and in diameter are plotted over the nebula.
2.1 BASS Data
Normally, a nebula with a mean surface brightness as faint as 26 would be neglected and subtracted simply as a background when doing sky subtraction. As more deep optical surveys are to be carried out, the possibilities of finding these faint objects are increasing. Since the nebula itself is only several ADUs higher than the background, it is hard to pick out by the naked eye. To enhance the image of the nebula, a Gaussian smooth kernel with a radius of four pixels is applied. After being smoothed, the mysterious ring-like feature has gradually emerged in the u, g, r bands of the BASS survey. Note that the ring shape in the u band is less obvious than that in the g or r bands, which might be caused by the lower signal-to-noise ratio.
Since the central region of the nebula has a ring-like structure, with an inner radius of and an outer radius of 5′, we mainly focus on this part and try to reconstruct the spectral energy distribution of this region to better understand its property. To precisely measure the flux of the selected central region of the nebula in optical bands, we use SExtractor to detect and mask sources such as stars and galaxies. As the whole area is covered by the nebula, this brings difficulties in defining the true sky and having it subtracted. We choose a nearby area which has the central coordinate (RA., decl.)J2000=(1144, ), with a radius of 18, as the background. (Note that this region is also taken as the background for all the other bands). The median value of the flux in this area is employed as the sky value. The flux of the masked areas is also replaced by the mean flux of the cloud. The AB magnitude is , where is the corrected flux of the central region and , given by BASS. Finally we derive the apparent magnitudes u = 15.28, g = 13.55, r = 13.36 and surface brightnesses = 28.65, = 27.03, = 26.73 . Note that optical color of the nebula is = 0.31, corresponding to stars with an effective temperature of 6100 K (Ramírez & Meléndez, 2005).
2.2 CFHT Data
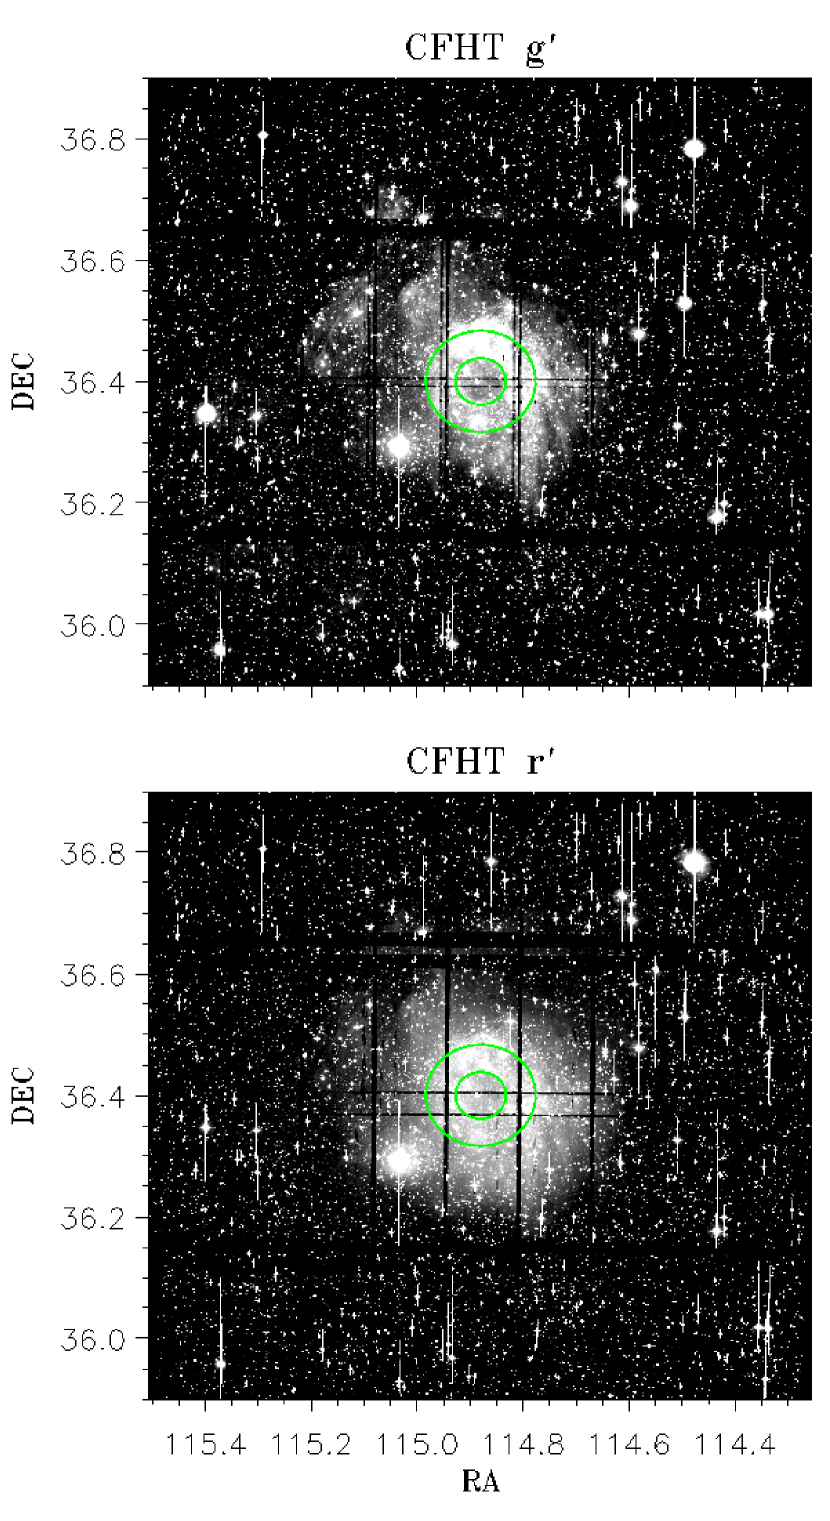
Observations have also been carried out at the 3.6 m Canada-France-Hawaii Telescope (CFHT), with the wide-field imaging MegaCam camera, covering a 1 deg2 area in the sky. MegaCam is made of 36 CCDs with gaps of between them. The images in the g’ and r’ bands were obtained on 2018 January 17, 18, and 20, with a total integration time of 1.5 hr for each band. CFHT images with a FOV of shown in Figure 3 have been used to check whether there are fainter substructures undetected by BASS. The ring-like structure is confirmed by the CFHT data. Besides, compared to BASS, CFHT detected even fainter optical emissions in the outer region and the central hole region, which makes the ring shape less obvious than that in the BASS g or r data. On the other hand, the fainter structure detected by CFHT indicates that CFHT has an even lower detection limit than BASS, because of a larger mirror and a longer exposure time.
2.3 UV Data
Images in the FUV and NUV bands observed by GALEX (Martin et al., 2005) were downloaded from the Mikulski Archive for Space Telescopes website111https://archive.stsci.edu/missions-and-data/galex-1/. The FUV and NUV image resolutions, FWHMs, are 45 and 60, respectively. The exposure time is 215 s for both FUV and NUV. The intensity in the central region is lower than that in the ring region, but no circular hole is found in these two bands, which might be caused by the lower signal-to-noise ratio. These images are used to derive the counts per second (CPS) of the chosen area. A Gaussian kernel with a radius of four pixels is applied to smooth the image before our using SExtractor to generate the mask of point sources. We then replace the CPS of the pixels in all masked areas with the median value of the chosen area. The background is subtracted using the same method as for the optical data. The AB magnitudes of FUV and NUV for the nebula in the ring region can be converted from the CPS (Morrissey et al., 2007):
| (1) | |||
| (2) |
The magnitudes of FUV and NUV are FUV=14.82 and NUV=14.57, respectively. The mean FUV flux intensity of the nebula is measured as .
2.4 IR Data
The WISE (Wright et al., 2010) W1, W2, W3, and W4 images (with FWHMs of 61, 64, 65, and 12, respectively), and the Infrared Astronomical Satellite (IRAS, Neugebauer et al., 1984) 60 m and 100 m images (with FWHMs of 40 and 43, respectively) were downloaded from the Infrared Science Archive website222https://irsa.ipac.caltech.edu/frontpage/. From Figure 2, we can see that there are positive detections in the W3 and W4 bands, while no emission is found in the W1 or W2 band. The visible emission at the W3 and W4 images indicates thermal fluctuations of very small grains and/or polycyclic aromatic hydrocarbons (PAHs) within this nebula (Szomoru & Guhathakurta, 1998). Similar to the CFHT, the structure in the W3 and W4 data is more extended than that in the BASS u, g, and r images. Besides, no circular hole is found in the center of the structure.
The signals are also significant in the IRAS 60 and 100 m images. At first glance, the structure has an offset in these two bands, compared to that in the BASS optical bands. In fact, this is because the intensity in the northwest part is obviously higher than that in the southeast part, which will be analyzed in §4.4. Besides, the spur to the south is clearly detected in these two bands. The mean brightness of 100 m, , in the ring region of the nebula is 5.10 . After removing the background using the same way as described in §2.1, the mean brightnesses of 60 and 100 m, and , in the ring region of the nebula are about 0.50 and 2.34 , respectively. Assuming the emissivity spectral index , the dust temperature () is estimated by the observational ratio of m: , resulting in K (Schnee et al., 2005).
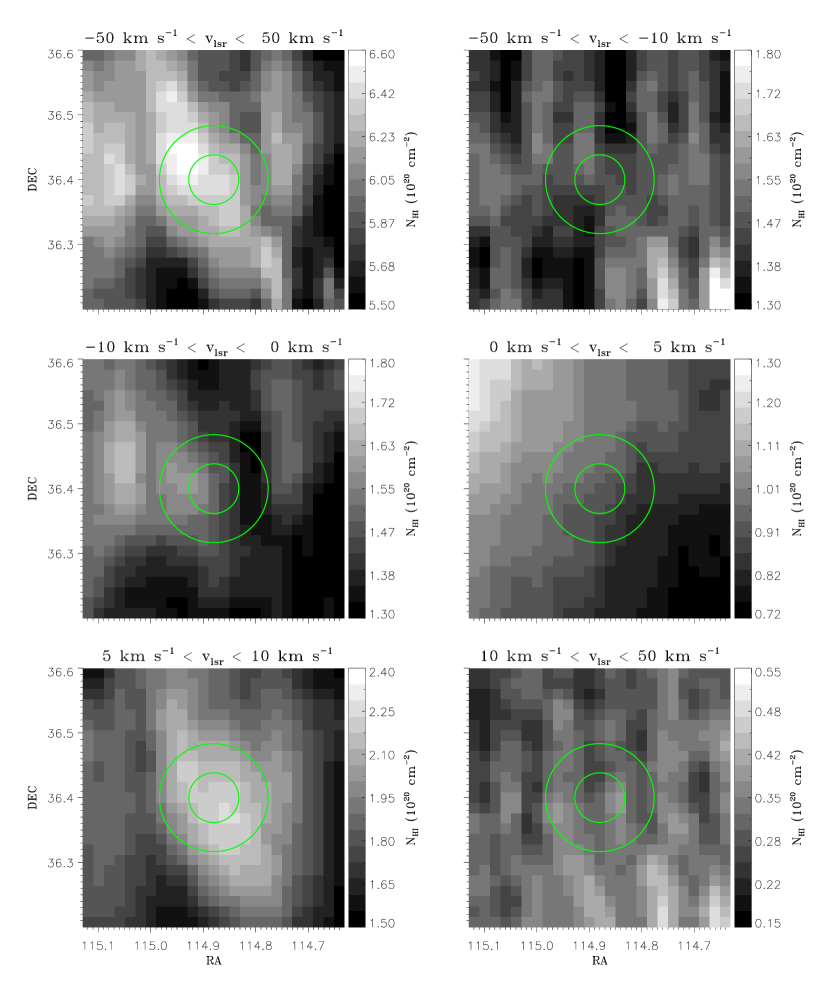
2.5 H i Data
The H i data is derived from the Galactic Arecibo -band Feed Array H i (GALFA-H i) Survey Data release 2333https://purcell.ssl.berkeley.edu. The data are served in two sets of data cubes with angular resolution. In this work, we use the “Narrow” set cubes with the full resolution of 0.184 over the velocity range . Applying the optically thin assumption, the H i column density can be obtained by integrating the H i spectra over a velocity interval (Peek et al., 2018):
| (3) |
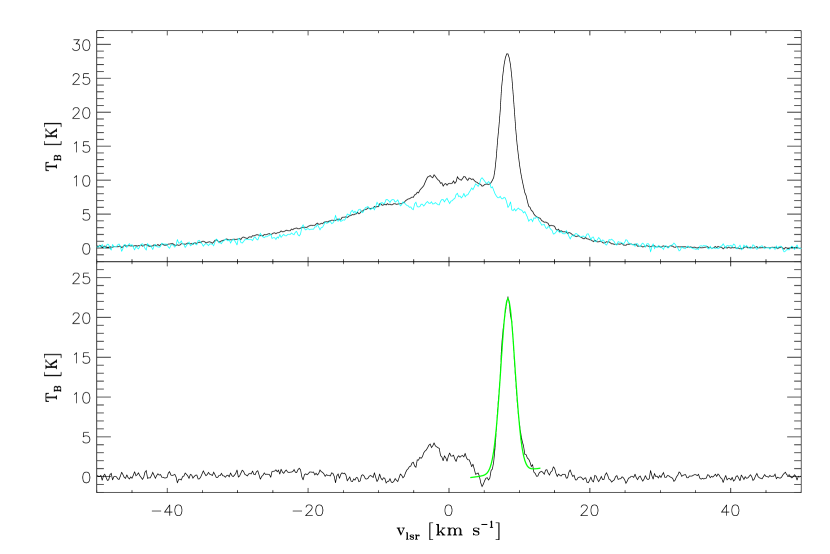
The mean H i spectrum in the direction of the ring region is shown by the black line in the top panel of Figure 4, and the mean H i spectrum in the direction of the background region is shown by the cyan line in the same panel. After subtracting the background spectrum, the residual spectrum is shown in the bottom panel. We can see there are still two components in the residual H i spectrum, the wider and weaker component with velocity 0 comes from the residual background (hereafter named as rb) H i emission, which is mainly contributed by the Galactic disk, while the narrower and stronger component comes from the nebula. The total H i column density HI(tot) along the line of sight in the direction of the nebula is 6.28 , by integrating the H i spectra over the velocity interval . The H i column density of the residual background (rb) is , by integrating the residual H i spectrum over the velocity interval . We also fit the narrower component using a simple Gaussian profile (shown by the green line in the bottom panel in Figure 4), the best-fitting result shows that the velocity of the nebula is 8.36 with a dispersion of 1.02 and the H i column density of the nebula (neb) is about .
| Survey | GALEX | BASS | WISE | IRAS | GALFA-HI | ||||||||
|---|---|---|---|---|---|---|---|---|---|---|---|---|---|
| Band | FUV | NUV | u | g | r | z | W1 | W2 | W3 | W4 | 60m | 100m | 21cm |
| FWHM | 12′′ | ||||||||||||
| mag (AB) | 14.82 | 14.57 | 15.28 | 13.66 | 13.36 | 14.82 | 11.12 | 11.73 | 9.40 | 9.29 | |||
| magc(AB) | 15.21 | 14.96 | 15.67 | 14.05 | 13.75 | 15.21 | 11.51 | 12.12 | 9.79 | 9.68 | |||
| SB (mag arcsec-2) | 28.19 | 27.94 | 28.65 | 27.03 | 26.73 | 28.19 | 24.49 | 25.10 | 22.77 | 22.67 | |||
| SBc (mag arcsec-2) | 28.58 | 28.33 | 29.04 | 27.42 | 27.12 | 28.58 | 24.88 | 25.49 | 23.16 | 23.05 | |||
| I | 2.59 | 12.27 | |||||||||||
| I | 1.82 | 8.59 | |||||||||||
| S) | 0.50 | 2.34 | |||||||||||
| S) | 0.35 | 1.64 | |||||||||||
| 9.97 | |||||||||||||
Note. — c This parameter denotes that the residual background correction has been considered.
The spatial distributions of the H i signals with a FOV of are shown in Figure 5. The velocity interval used to integrate the spectrum is shown on the top of each panel. The structure is clearly found when the velocity ranges from 5 to . Similar to the CFHT, W3, W4, and IRAS 60 and 100 m, the structure is more extended than that in the BASS g and r images, while no ring shape is found, which should be caused by the lower resolution (FWHM 4′).
2.6 Summary of the Multiband Observations
The ring structure is detected by BASS g and r, and is confirmed by CFHT g’ and r’. Because CFHT has a lower detection limit, the nebula and central depression are present, making the ring shape being less obvious. This nebula is also detected by BASS u, GALEX FUV, NUV, WISE W3, W4, IRAS 60, 100 m, and GALFA-H i data, while no circular hole is shown in the central region, which might be caused by the lower signal-to-noise ratio or the lower spatial resolution. We hence declare that the structure is described as a ring only in optical g and r data, and the ring might be found in other bands in future using higher-quality data. Besides, the intensity of the northwest part of the structure is obviously higher than the southeast part in IRAS 60 and 100 m images. The different spatial distribution between IRAS 60, 100m and H i indicates the dust to gas ratio might not be uniform in this region.
Most of the properties of the nebula are summarized in Table 1, including the image resolution FWHMs, visual magnitudes in AB systems, surface brightnesses, and intensities. The magnitudes of W3 and W4 were converted from the WISE Vega system to the AB system, by adding the offsets of 5.242 and 6.604 mag, respectively. As shown in §2.5, the components along the same line of sight can be easily resolved by the H i spectra. For other bands, most of the background can be subtracted by taking a nearby region as the background. But this background is not identical to that in the targeted region. For the nebula in this work, the fraction of the residual background can be estimated to be 30%. We then apply this correction to the other bands, and mark the parameters with (c) in Table 1. This correction makes the magnitude and surface brightness fainter by about 0.38 mag. In this result, the surface brightness in the BASS g band reaches to 27.42 mag, and the brightness turns into 1.64 . Besides, the magnitudes and surface brightnesses of BASS z, W1, and W2 are also given, although the signals in these bands cannot be recognized by the naked eye.
3 Reddening and Distance
3.1 Reddening
The column gas density has been found to be well correlated with the interstellar extinction, hence the band extinction can be measured by (Bohlin et al., 1978; Rachford et al., 2009), which yields values of (tot) = 0.33 mag and (neb) = 0.05 mag.
Following the work of Savage & Mathis (1979), the 100 m brightness can be converted into the band extinction by , resulting in the total extinction in the direction of the nebula (tot) = 0.27 mag and the extinction of the nebula alone (neb) = 0.09 mag.
Combining the results from above two methods, the total extinction along the line of sight is = 0.30 mag, and the extinction of the nebula alone is = 0.07 mag. By adopting , the total reddening value is about 0.097 mag, and the reddening of the nebula alone is about 0.02 mag.
3.2 Distance
Distance is a basic parameter to do further analyze for this nebula. At first glance, this ring-like nebula comprises material ejected from an evolved asymptotic giant branch (AGB) star. If this is true, there should be a white dwarf star located at the center of the ring. However, we have analyzed the stars around the center, and found that none of them is hot enough to be a white dwarf. So there are several possible explanations: (1) the nebula is not a relic of an evolved PN, (2) the white dwarf star becomes too faint to be detected by the BASS photometry, or (3) the white dwarf star has run away from the center. Whatever the truth is, it is impossible to derive the distance of the system from the parallax of the central star.
In principle, the kinematic distance can be obtained from the radial velocity of the gas by adopting a specific Galactic rotation curve and solar motion parameters. Besides the two traditional methods, Wenger et al. (2018) also developed a Monte Carlo method to derive the kinematic distances, in which the probability distribution functions of the kinematic distances are determined by resampling all measured and derived parameters within their uncertainties. Unfortunately, the kinematic distances are very inaccurate toward the Galactic Center and the Galactic Anticenter due to velocity crowding. So we did not try to derive the kinematic distance to the nebula centered at , because it is in the direction of the Galactic Anticenter.
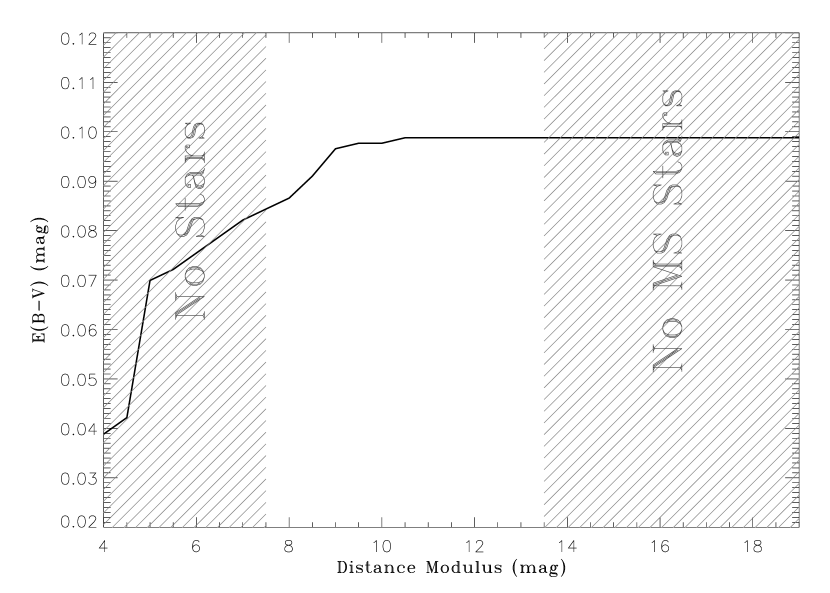
Green et al. (2015) derived a Galactic 3D reddening map using high-quality stellar photometry of stars from Pan-STARRS 1, the Two Micron All Sky Survey (2MASS), and Gaia, for the sky with decl. . The map has a hybrid angular resolution, ranging from to , with a typical value of , which is comparable to the size of the ring-like nebula (10′ in diameter). We downloaded the relation between and distance from the website444http://argonaut.skymaps.info in the direction of the nebula. According to the extinction factor listed in Table 1 in Green et al. (2018), we convert the to and show it in Figure 6. From this figure, we can see the maximum in this direction is 0.099 mag, which is consistent with the result derived from IRAS and H i data. For distance modulus (DM) less than 7.5 or greater than 13.5, shown by the line-filled region, there is no star or no main-sequence (MS) star being available to derive the cumulative reddening profile. Therefore, the steep rise of around the DM of 4.75 (90 pc) cannot be identified as the jump as the nebula. Around the DM of 8.5, there is a relatively rapid rise of ranging from 0.04 to 0.07 mag, with an aptitude of 0.03 mag, which might be from the nebula. In the following analyses, we then take the distance to the nebula as 500 pc. We should note that the distance derived by this method has large uncertainty, as the increase of the with the DM is not steep enough and the possibility of a smaller DM ( 7.5) still exists. Besides, if the distance to the nebula is 500 pc, it means most of the extinction along the line of sight is actually the foreground extinction.
4 Possible Formation Mechanism and Illumination Source
4.1 Star Forming Region
The strong UV photons emitted by OB stars in the star forming regions can ionize the surrounding ISM and the strong stellar wind can sweep away the surrounding gases to form Strömgren sphere structures. However, the formation of new stars requires the gas density to be high enough to collapse, hence the extinction in the star formation region is usually high. For the nebula in this work, the optical depth is quite low ( mag), and there is no OB star found in this region. So, this ring-shaped structure is not a Strömgren sphere structure formed by star formation activities and the illumination source is not OB stars.
4.2 Supernova Remnant
The morphologies of supernova remnants are complex and varied. In the new catalog of 294 Galactic supernova remnants, 80% of remnants show shell (or possible shell) structures (Green, 2019). A shell can be formed when the shock wave from the explosion sweeps the surrounding ISM, hence a ring-like structure can be seen because of limb brightening. The size of a supernova remnant is less than 1 pc in the phase of free expansion, and can reach to more than 30 pc in the final phase of fading and death. As the physical size of the nebula is only pc in diameter, and the velocity of the gas in the ring is very small (see §2.4), the possibility of the ring-shaped nebula being a supernova remnant is ruled out.
4.3 Planetary Nebula
As mentioned in §2.5, the velocity dispersion of H i gas of the nebula is 1.02 , which is significantly lower than the typical expanding velocity (25 ) of a PN (Kohoutek, 2001). Hence the nebula might be the relic of a PN. The inner and outer radii of the shell are and , respectively. Assuming the expansion velocity is 25 , the shell expanded to the median radius of the ring (, physical distance of 0.64 pc) from the center after 25,000 yr, then the shell became wider and wider (physical thickness of 0.47 pc) because of the random dissipation (1.02 ) over 230,000 yr, the current age of the nebula can be estimated as about 255,000 yr. We should note that the calculation is very rough, as (1) the expanding velocity of the shell depends on both the chemical of the ejected material and the stellar core-mass evolution (Buzzoni et al., 2006), and (2) the mean velocity dispersion of the shell should be higher than 1.02 .
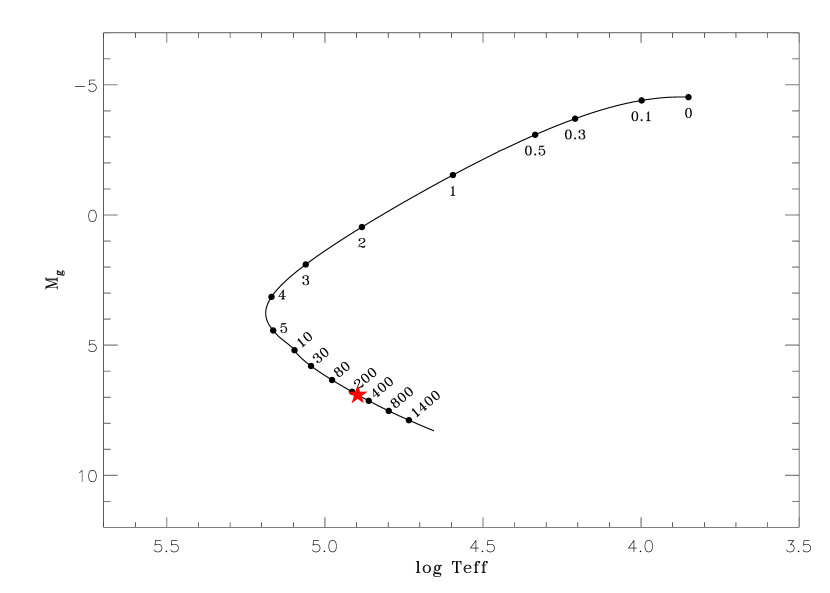
With the help of theoretical evolution models of the post-AGB stars, we can calculate the current absolute magnitude of the central star. From Figure 7, we show an evolutionary track of a post-AGB star with a final stellar mass of 0.576 , the dot marks are shown in units of yr. The original data come from Miller Bertolami (2016). We translate the luminosity into the absolute magnitude in the g band by assuming a blackbody radiation distribution for the central star. The current absolute magnitude and effective temperature of the central star are mag and log [K] = 4.90 respectively, about 255,000 yr after the star evolved into post-AGB stage. Hence, there should be a central white dwarf with a visual magnitude , which is much brighter than the detection limit of the BASS survey. So the central star would run away from this nebula if the system is the relic of a PN.
On the other hand, if the nebula is the relic of a PN, the gas in the ring can be considered as the material ejected from the AGB envelope, hence we calculate the mass of the ejected material by summing the H i density in the ring region. Given the distance of 500 pc, and the inner/outer radii of 0.40/0.87 pc, the H i mass in the shell is estimated as .
Following Hildebrand (1983) and Emsellem (1995), and assuming average grain size of 0.1 m, the mass of dust in the ring can be estimated from the IRAS flux:
| (4) |
where is the IRAS flux in mJy at wavelength , is the distance in Mpc, and is the temperature of the dust in K. The result gives an of about 0.01 . Hence the dust mass relative to the hydrogen mass is about 0.0095, which is consistent with the value of the Kramers-Kroing argument (0.0083, see Eq. 21.19 in Draine (2011)).
The ejected mass varies from 0.01 to 3 , from differentiated PNe from lower-mass nova shells to higher-mass ejecta shells from massive Population I stars (Frew, 2008). So the total mass (H i dust) of in the shell is consistent with the assumption that the ring is the material ejected from the envelope of the post-AGB stage. According to the analyses shown above, this nebula is probably the relic of an evolved PN.
4.4 Illumination Source
At high Galactic latitude, most of the neutral gases with low velocities are in a high degree of turbulence with gas temperatures of about a few thousand Kelvin, hence their H i 21 cm emission lines will show broad structures (Kalberla & Kerp, 2009). On the other hand, narrow structures are rarely observed at high latitudes and are associated with the infrared cirrus (Low et al., 1984). As the infrared cirrus was explained as the reflection and scattering of the DGL by the ISM, we then calculate the surface brightness of the nebula to check whether the illumination energy mainly comes from the flux of the total Galactic plane.
Following the work of Sandage (1976), the flux at any height above the Galactic plane is equivalent to visual magnitude, independent of . The surface brightness in the V band can be estimated by , where is the albedo and is the efficiency factor of the grains. Given , , and , the is 27.1 , indicating the DGL can provide sufficient energy to illuminate the ring-like nebula.
As the nebula is illuminated by FUV photons and re-emitted in the longer wavelength, the intensities of FUV, FIR, and H i column density are expected correlated with each other. The results of , (or ) and reasonably follow the linear relations shown in Figure 2 and Figure 3 in Jakobsen et al. (1987). Besides, the color g-r=0.3 and also follow the linear relation shown in Figure 10 in Román et al. (2019).

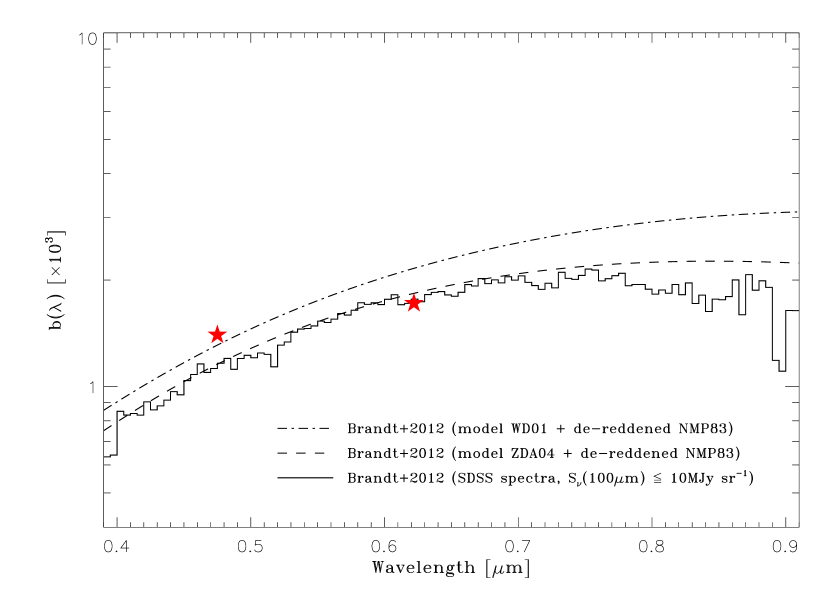
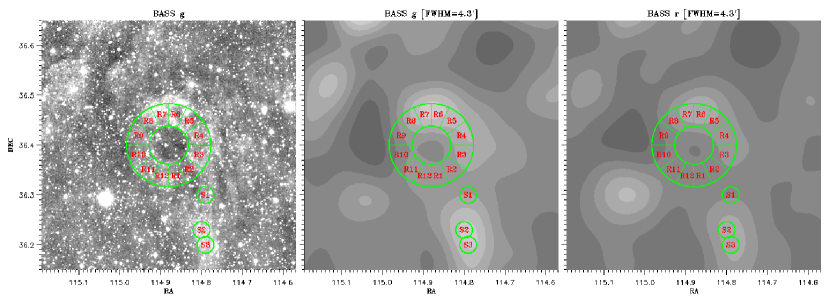
In Figure 8, we divide the ring into 12 regions according to the position angles to the center, and name them as R1-R12. Three regions in the spur, each with a radius of 1′ and named S1-S3, are also selected to make a comparison. Two different Gaussian smooth kernels are applied to BASS g and r images, ensuring the optical data match the resolution of the IRAS 100 m data. The optical brightness as a function of 100 m is shown in Figure 9. We fit the data of R1-R12 by , and get the correlation slopes and . We can see the region S1 follows the main trend of the regions R1-R12, while S2 and S3 are obviously apart from the trend, indicating S2 and S3 have different origins from S1 and the ring. In Figure 10, we compare this results with the spectra of the DGL, which were shown in Figure 6 in Ienaka et al. (2013). The solid line is obtained by analyzing the optical blank-sky spectrum from the SDSS by Brandt & Draine (2012), while the dashed line and dashed-dotted line are model spectra, based on the work of Zubko et al. (2004) and Weingartner & Draine (2001), respectively. It should be noted that (1) the spectra showed in Ienaka et al. (2013) have been scaled with a biased factor of 2.1, and we find a lower biased factor of 1.62 is better to match our results, and (2) the spectra shown here are weighted spectrum at intermediate Galactic latitudes = 30. But as shown in Figure 4 in Brandt & Draine (2012), the spectra change little with the selection of the coverage of , when is lower than . We can see our results are reasonably reproduced by the observational and model spectra of the DGL.
In summary, the analysis listed above supports the assumption that the illumination source is the DGL. The ring structure clearly seen in optical bands can be explained as the optical counterpart of the infrared cirrus.
5 Conclusion and Discussion
A ring-like nebula is found by BASS, with the g band surface magnitude down to 27.42 . Except for the z band from BASS and the W1 and W2 bands from WISE, positive detections have been shown in multiband images from FUV to FIR. The properties of the nebula and main conclusions can be summarized as follows.
-
•
The H i gas in the nebula has a very low velocity dispersion (), and the dust is cold with a temperature of K. The reddening of this nebula 0.02 mag is estimated from IRAS 100 m brightness and H i column density.
-
•
With the help of the 3D reddening map from Pan-STARRS 1, 2MASS, and Gaia, the distance to the nebula from Earth is derived as 500 pc. The inner and the outer regions are about 0.80 and 1.74 pc in diameter, respectively. The masses of H i and dust in the ring are measured as 1.05 and 0.01 , respectively.
-
•
Such a low-surface-brightness nebula whose energy can be interpreted by the DGL could account for the optical counterpart of the infrared cirrus which was detected by IRAS more than 30 yr ago.
-
•
The ring-like shape is not formed by recent star formation or supernova explosion. It might be the ultimate phase of a PN, while the central white dwarf star has been kicked off from the nebula for an unclear reason.
A spur is located to the south of the ring, which makes the overall structure look like the number 9. Is there a possible physical relation between the spur and the ring? If the central star runs away from the nebula, it might distort the ring shape (Wareing et al., 2007). From Figure 9 we can see S2 and S3 have quite different distributions in the optical brightness versus the 100 m brightness diagram with R1-R12, which indicates S2 and S3 have different origins from the ring. On the other hand, S2 follows the main trend in the diagram, and the R2 region has a relatively lower brightness and deviates from the trend. The nebula is too faint to be detected by normal spectroscopic telescopes, so it is hard to obtain the spectra to make an actual classification. A long duration exposure of narrowband imaging would be a better choice. So we are planning to observe this nebula using a H or [S ii] filter to check whether the nebula is ionized.
There is large uncertainty about the distance estimation. For this line of sight, the distance of 500 pc implies that the nebula is located at the edge of the dust disk of the Milky Way. So the possibility of the nebula being typical ISM cannot be ruled out. As the H i signal is centrally distributed around , and the residual background signal around is weaker, the possibility of them being chance configurations in the line of sight is small. However, the ring structure being a superposition of two close filaments might be another reasonable explanation. Besides, as the radial velocity of the nebula is small, and the multiband data can be interpreted by the DGL, the nebula should be a Galactic cirrus, rather than an extragalactic source.
Of the 210 PNe within 2.0 kpc, 90% of PNe have identified central stars. Most of the missing central stars are in more distant, reddened PNe, though high internal extinction can also hide the central star (Frew, 2008). Apparently, the nebula in this study does not belong to this case, because it is near to us and the extinction along the light is quite low.
There are some examples of other mechanisms to cause the loss of the central stars of PNe. SBW 2, in the direction of the boundaries of the star-forming Carina Nebula, has an ionized ring. However, no central star is found near its center. Assuming pure hydrogen gas and fully ionization, the ring’s mass is estimated as 0.1 . Smith et al. (2007) have suggested that the lack of any bright central star in SBW 2 may indicate that a binary system has been disrupted.
SuWt 2, in the direction of the constellation Centaurus, also has an ionized ring and has lost the central white dwarf star. Instead, there is a 4.9 day period binary consisting of two A-type MS stars, which are not hot enough to make the nebula glow (Bond et al., 2002). It has been suggested that the stars at the center of SuWt 2 were born as a family of three, with the A stars circling each other tightly and a third star whose initial mass was greater than 2.7 orbiting them around further out. The common envelope was ejected into the orbit plane, generating the ring-shaped nebula seen today. Eventually, the remnant of the third star cooled and faded rapidly below the detection limit of the International Ultraviolet Explorer (Exter et al., 2010). However, Jones & Boffin (2017) concluded that the A-type binary is merely a field star system, by chance lying in the same line of sight of the nebula, and that it bears no relation to SuWt 2 or its unidentified central star.
It is expected that more and more dark rings without central stars will be found in the deep imaging surveys. The statistical analyses of such dark rings will help us to understand the formation of the structure of the Galactic ISM and the formation and evolution of PNe.
References
- Arp (1965) Arp, H. 1965, Science, 148, 363, doi: 10.1126/science.148.3668.363
- Bohlin et al. (1978) Bohlin, R. C., Savage, B. D., & Drake, J. F. 1978, ApJ, 224, 132, doi: 10.1086/156357
- Boissier et al. (2015) Boissier, S., Boselli, A., Voyer, E., et al. 2015, A&A, 579, A29, doi: 10.1051/0004-6361/201526089
- Bond et al. (2002) Bond, H. E., O’Brien, M. S., Sion, E. M., et al. 2002, in ASP Conf. Proc., Exotic Stars as Challenges to Evolution, ed. C. A. Tout & W. van Hamme, Vol. 279, 239
- Brandt & Draine (2012) Brandt, T. D., & Draine, B. T. 2012, ApJ, 744, 129, doi: 10.1088/0004-637X/744/2/129
- Buzzoni et al. (2006) Buzzoni, A., Arnaboldi, M., & Corradi, R. L. M. 2006, MNRAS, 368, 877, doi: 10.1111/j.1365-2966.2006.10163.x
- Cortese et al. (2010) Cortese, L., Bendo, G. J., Isaak, K. G., Davies, J. I., & Kent, B. R. 2010, MNRAS, 403, L26, doi: 10.1111/j.1745-3933.2009.00808.x
- de Vries & Le Poole (1985) de Vries, C. P., & Le Poole, R. S. 1985, A&A, 145, L7
- Draine (2011) Draine, B. T. 2011, Physics of the Interstellar and Intergalactic Medium (Princeton, NJ: Princeton Univ. Press)
- Duc et al. (2015) Duc, P.-A., Cuillandre, J.-C., Karabal, E., et al. 2015, MNRAS, 446, 120, doi: 10.1093/mnras/stu2019
- Elvey & Roach (1937) Elvey, C. T., & Roach, F. E. 1937, ApJ, 85, 213, doi: 10.1086/143815
- Emsellem (1995) Emsellem, E. 1995, A&A, 303, 673
- Exter et al. (2010) Exter, K., Bond, H. E., Stassun, K. G., et al. 2010, AJ, 140, 1414, doi: 10.1088/0004-6256/140/5/1414
- Frew (2008) Frew, D. J. 2008, PhD thesis
- Greco et al. (2018) Greco, J. P., Greene, J. E., Strauss, M. A., et al. 2018, ApJ, 857, 104, doi: 10.3847/1538-4357/aab842
- Green (2019) Green, D. A. 2019, Journal of Astrophysics and Astronomy, 40, 36, doi: 10.1007/s12036-019-9601-6
- Green et al. (2015) Green, G. M., Schlafly, E. F., Finkbeiner, D. P., et al. 2015, ApJ, 810, 25, doi: 10.1088/0004-637X/810/1/25
- Green et al. (2018) Green, G. M., Schlafly, E. F., Finkbeiner, D., et al. 2018, MNRAS, 478, 651, doi: 10.1093/mnras/sty1008
- Hildebrand (1983) Hildebrand, R. H. 1983, QJRAS, 24, 267
- Ibata et al. (2009) Ibata, R., Mouhcine, M., & Rejkuba, M. 2009, MNRAS, 395, 126, doi: 10.1111/j.1365-2966.2009.14536.x
- Ibata et al. (2014) Ibata, R. A., Lewis, G. F., McConnachie, A. W., et al. 2014, ApJ, 780, 128, doi: 10.1088/0004-637X/780/2/128
- Ienaka et al. (2013) Ienaka, N., Kawara, K., Matsuoka, Y., et al. 2013, ApJ, 767, 80, doi: 10.1088/0004-637X/767/1/80
- Jakobsen et al. (1987) Jakobsen, P., de Vries, J. S., & Paresce, F. 1987, A&A, 183, 335
- Jones & Boffin (2017) Jones, D., & Boffin, H. M. J. 2017, MNRAS, 466, 2034, doi: 10.1093/mnras/stw3191
- Kalberla & Kerp (2009) Kalberla, P. M. W., & Kerp, J. 2009, ARA&A, 47, 27, doi: 10.1146/annurev-astro-082708-101823
- Kohoutek (2001) Kohoutek, L. 2001, A&A, 378, 843, doi: 10.1051/0004-6361:20011162
- Laureijs et al. (1987) Laureijs, R. J., Mattila, K., & Schnur, G. 1987, A&A, 184, 269
- Low et al. (1984) Low, F. J., Beintema, D. A., Gautier, T. N., et al. 1984, ApJ, 278, L19, doi: 10.1086/184213
- Martin et al. (2005) Martin, D. C., Fanson, J., Schiminovich, D., et al. 2005, ApJ, 619, L1, doi: 10.1086/426387
- Martin et al. (2014) Martin, N. F., Ibata, R. A., Rich, R. M., et al. 2014, ApJ, 787, 19, doi: 10.1088/0004-637X/787/1/19
- McConnachie (2012) McConnachie, A. W. 2012, AJ, 144, 4, doi: 10.1088/0004-6256/144/1/4
- McConnachie et al. (2018) McConnachie, A. W., Ibata, R., Martin, N., et al. 2018, ApJ, 868, 55, doi: 10.3847/1538-4357/aae8e7
- Mihos et al. (2005) Mihos, J. C., Harding, P., Feldmeier, J., & Morrison, H. 2005, ApJ, 631, L41, doi: 10.1086/497030
- Miller Bertolami (2016) Miller Bertolami, M. M. 2016, A&A, 588, A25, doi: 10.1051/0004-6361/201526577
- Miville-Deschênes et al. (2016) Miville-Deschênes, M. A., Duc, P. A., Marleau, F., et al. 2016, A&A, 593, A4, doi: 10.1051/0004-6361/201628503
- Morrissey et al. (2007) Morrissey, P., Conrow, T., Barlow, T. A., et al. 2007, ApJS, 173, 682, doi: 10.1086/520512
- Neugebauer et al. (1984) Neugebauer, G., Habing, H. J., van Duinen, R., et al. 1984, ApJ, 278, L1, doi: 10.1086/184209
- Peek et al. (2018) Peek, J. E. G., Babler, B. L., Zheng, Y., et al. 2018, ApJS, 234, 2, doi: 10.3847/1538-4365/aa91d3
- Rachford et al. (2009) Rachford, B. L., Snow, T. P., Destree, J. D., et al. 2009, ApJS, 180, 125, doi: 10.1088/0067-0049/180/1/125
- Ramírez & Meléndez (2005) Ramírez, I., & Meléndez, J. 2005, ApJ, 626, 465, doi: 10.1086/430102
- Román et al. (2019) Román, J., Trujillo, I., & Montes, M. 2019, arXiv e-prints, arXiv:1907.00978
- Sandage (1976) Sandage, A. 1976, AJ, 81, 954, doi: 10.1086/111975
- Savage & Mathis (1979) Savage, B. D., & Mathis, J. S. 1979, ARA&A, 17, 73, doi: 10.1146/annurev.aa.17.090179.000445
- Schnee et al. (2005) Schnee, S. L., Ridge, N. A., Goodman, A. A., & Li, J. G. 2005, ApJ, 634, 442, doi: 10.1086/491729
- Smith et al. (2007) Smith, N., Bally, J., & Walawender, J. 2007, AJ, 134, 846, doi: 10.1086/518563
- Sollima et al. (2010) Sollima, A., Gil de Paz, A., Martinez-Delgado, D., et al. 2010, A&A, 516, A83, doi: 10.1051/0004-6361/201014085
- Szomoru & Guhathakurta (1998) Szomoru, A., & Guhathakurta, P. 1998, ApJ, 494, L93, doi: 10.1086/311156
- Tanaka et al. (2011) Tanaka, M., Chiba, M., Komiyama, Y., Guhathakurta, P., & Kalirai, J. S. 2011, ApJ, 738, 150, doi: 10.1088/0004-637X/738/2/150
- Wareing et al. (2007) Wareing, C. J., Zijlstra, A. A., & O’Brien, T. J. 2007, MNRAS, 382, 1233, doi: 10.1111/j.1365-2966.2007.12459.x
- Weingartner & Draine (2001) Weingartner, J. C., & Draine, B. T. 2001, ApJ, 548, 296, doi: 10.1086/318651
- Wenger et al. (2018) Wenger, T. V., Balser, D. S., Anderson, L. D., & Bania, T. M. 2018, ApJ, 856, 52, doi: 10.3847/1538-4357/aaaec8
- Witt et al. (1997) Witt, A. N., Friedmann, B. C., & Sasseen, T. P. 1997, ApJ, 481, 809, doi: 10.1086/304093
- Wright et al. (2010) Wright, E. L., Eisenhardt, P. R. M., Mainzer, A. K., et al. 2010, AJ, 140, 1868, doi: 10.1088/0004-6256/140/6/1868
- Zou et al. (2019) Zou, H., Zhou, X., Fan, X., et al. 2019, ApJS, 245, 4, doi: 10.3847/1538-4365/ab48e8
- Zubko et al. (2004) Zubko, V., Dwek, E., & Arendt, R. G. 2004, ApJS, 152, 211, doi: 10.1086/382351