DQI: A Guide to Benchmark Evaluation
Abstract
A ‘state of the art’ model A surpasses humans in a benchmark B, but fails on similar benchmarks C, D, and E. What does B have that the other benchmarks do not? Recent research provides the answer: spurious bias. However, developing  to solve benchmarks B through E does not guarantee that it will solve future benchmarks. To progress towards a model that ‘truly learns’ an underlying task, we need to quantify the differences between successive benchmarks, as opposed to existing binary and black-box approaches. We propose a novel approach to solve this underexplored task of quantifying benchmark quality by debuting a data quality metric: DQI.
1 Introduction
We evaluate progress in various AI domains such as NLP and Vision by building and solving increasingly harder benchmarks (and hence developing new models and architectures). Since this involves heavy investment in resources (time, money, hardware, etc.), it is reasonable to ask: Can we rely on these benchmarks? A growing number of recent works (Gururangan et al., 2018; Schwartz et al., 2017; Poliak et al., 2018; Kaushik and Lipton, 2018; Le Bras et al., 2020) reveal that models exploit spurious biases (unintended correlations between input and output (Torralba and Efros, 2011)) instead of the actual underlying features to solve many popular benchmarks. This begs a new question: How do we mitigate spurious biases in benchmarks?
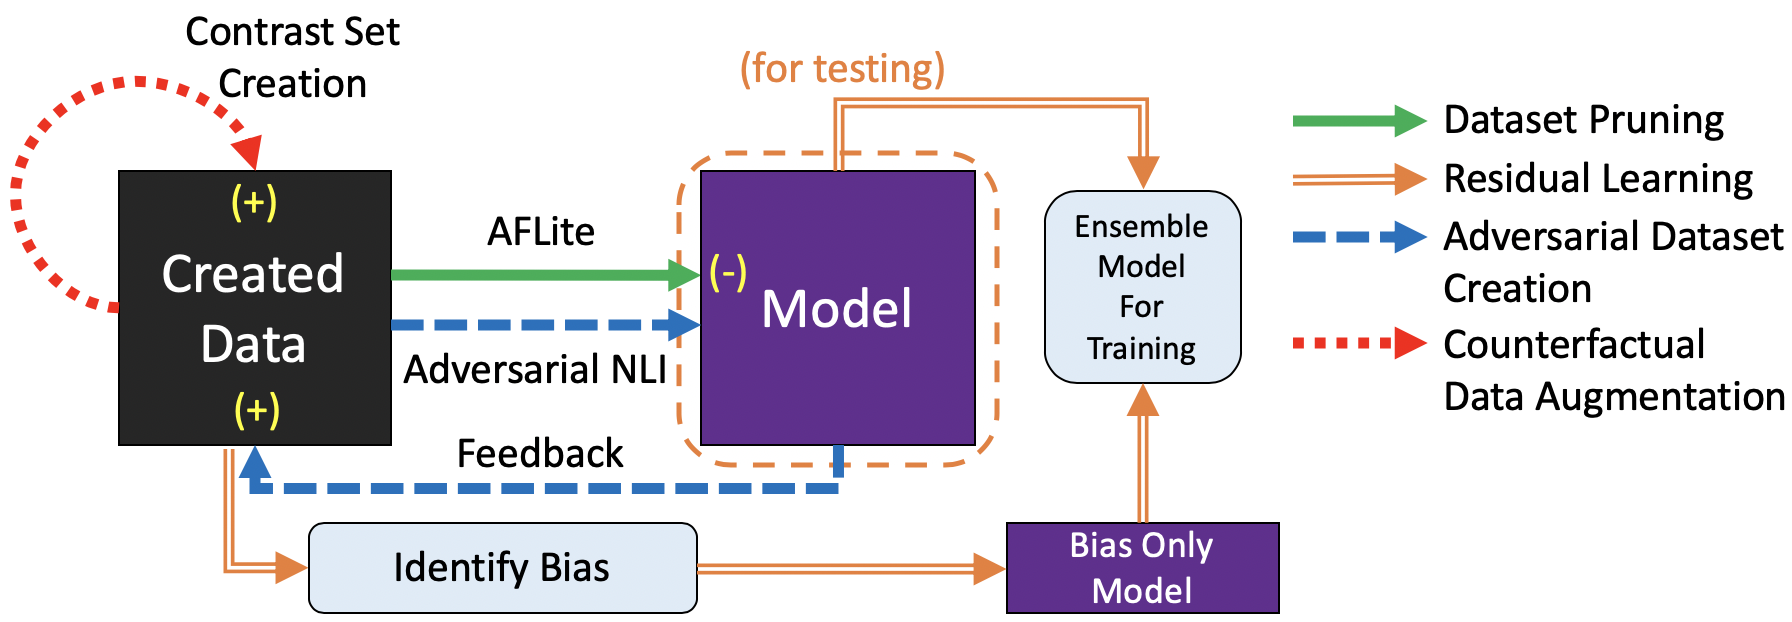
Recently proposed approaches that address this include dataset pruning (Sakaguchi et al., 2019; Li and Vasconcelos, 2019; Li et al., 2018; Wang et al., 2018), residual learning (Clark et al., 2019; He et al., 2019; Mahabadi and Henderson, 2019), adversarial dataset creation (Zellers et al., 2018; Nie et al., 2019), and counterfactual data augmentation (Kaushik et al., 2019; Gardner et al., 2020). Each focuses on a specific part of the data-model loop, as illustrated in Figure 1, but all are limited by binary evaluation: (i) accepting or rejecting a data sample created by a crowd-worker (Nie et al., 2019), (ii) retaining or removing data with adversarial filtering (Sakaguchi et al., 2019; Li and Vasconcelos, 2019; Li et al., 2018), (iii) augmenting only counter factual data (Kaushik et al., 2019; Gardner et al., 2020), and/or (iv) including data only if it can fool the model (Zellers et al., 2018; Nie et al., 2019).
Binary evaluation is restrictive as it only allows inclusion or deletion of data, and further appends an overhead on human evaluators as there is uncertainty in class distinction. These approaches can also introduce new kinds of bias, and overfit to a specific model or task (Liu et al., 2019). Other limitations include: (i) wastage of resources invested in creating initial ‘biased’ data, (ii) a dataset creator does not learn what constitutes biased data, and is likely to repeat mistakes, (iii) important aspects of bias, like its dependency on a train-test split, are ignored, (iv) model training on each iteration increases time complexity, and (v) the absence of a suitable and illustrative feedback channel. A metric quantifying benchmark quality could address these issues, but remains underexplored.
As a solution, we propose a novel metric: Data Quality Index (DQI), building on a recent work (Mishra et al., 2020b) which identifies potential bias parameters based on a broad survey of AI literature. We construct an empirical formula for DQI based on these parameters with seven components and a varying number of sub-components and terms (e.g., NLI has 20 sub-components and 133 terms). In our study, lower bias and higher generalizability imply higher DQI.
DQI also captures a broad range of biases, unlike existing binary and black-box approaches (which only consider a specific set of biases). Specifically, we evaluate DQI against AFLite, a recent successful adversarial filtering approach, over NLI, QA, and RC datasets. In this paper, we focus on DQI for NLP, though our approach can be extended to other domains such as vision and speech.
DQI is inspired by successful quality indices in domains such as power (Bollen, 2000), air (Jones, 1999), food (Grunert, 2005) and water (Organization, 1993). On a related note, Data Shapley (Ghorbani and Zou, 2019) has been proposed as a metric to quantify the value of each training datum to the predictor performance, but follows a model and task-dependent approach and might fail when biases favor the predictor. So, we focus on building a generic DQI with minimal dependency on models and tasks.
2 DQI
DQI utilizes a generic parameter set (Mishra et al., 2020b) that captures bias properties—including origins, types and impact on performance, generalization, and robustness— for a hierarchy of datasets ranging from NLI to Text Summarization. We abstract this set and use appropriate mathematical transformations to algorithmically compute DQI. Our intuition is simple: a data quality metric should discourage biased samples and encourage samples with higher generalization capability (Mishra et al., 2020a). DQI has seven components corresponding to seven properties that cover various possible inter/intra-sample interactions in an NLP dataset, isolating those which lead to bias 111More details about components and the intuition behind them are in supplemental materials.
Formalization:
Let represent a dataset with as its number of samples. has vocabulary , over a set of sentences , with denoting sentence lengths across . Let the set of granularities across be referenced as , with representing their respective frequencies, and and hyperparameters constraining . Let span , and represent sentence similarity between the sentence and sentence of , where spans . is a hyperparameter that is a lower bound for . is a hyperparameter that depends on , which is the minimum threshold for the number of sentences spanned by where , and represents the similarity values for the top sentences, for every . Let stands for word similarity between the word and the word where spans every word in a sentence , and spans , is a hyperparameter dependent on that represents the minimum threshold for . Let represent sentences from one side and represent sentences from the other side, such as premise and hypothesis respectively in NLI. is a hyperparameter that represents the lower bound for , which is the similarity between and , with and representing premise and hypothesis lengths respectively. represents unique words in and , spans the sample, and and span the premise and hypothesis respectively. Let be the upper limit for respective across any indivdual label. is a vector of size , where represents the number of labels, which represents how many times each element of each granularity has been assigned each of the labels, . Let and represent the train and test splits respectively of . stands for similarity between the train and test data and is a hyperparameter that represents the optimal value of . Let represent the signum function. represents DQI components as follows:
Vocabulary:
| (1) |
Inter-Sample N-gram Frequency and Relation:
| (2) |
Inter-Sample STS:
| (3) |
Intra-Sample Word Similarity:
| (4) |
Intra-Sample STS:
| (5) |
N-Gram Frequency per Label:
| (6) |
Inter-Split STS:
| (7) |
We propose the empirical formula of DQI as a function of all components.
| (8) |
Since depends on both task and dataset, it needs to be experimentally tuned.
3 Comparing Performance Against AFLite
We apply DQI to compare its performance to that of AFLite on four datasets: SNLI (Bowman et al., 2015), MNLI (Williams et al., 2017), SQUAD 2.0 (Rajpurkar et al., 2018), and Story CLOZE Task (Mostafazadeh et al., 2016). AFLite divides samples into good and bad splits, i.e. samples retained and removed on filtering. Mishra et. al. (Mishra et al., 2020b) show that SNLI contains a large number of artifacts, and that the Story CLOZE Task also has a significant number of artifacts. MNLI and SQUAD 2.0 are shown to have a relatively smaller number of artifacts, thus ensuring an adversarial evaluation of DQI. We tune hyperparameters on 0.01% of data manually in a supervised manner, mimicking how humans learn quickly from a few samples.222Detailed tuning results with various hyperparameters are in supplemental materials. We perform two types of evaluation: (i) overall analysis of 133 terms, and 7 components to ascertain AFLite intricacies, and (ii) individual sample analysis across the most sensitive sub-components.
3.1 Overall Analysis:
By applying DQI to AFLite333Detailed analysis of each DQI sub-component and experimental results for all datasets are in Supplemental Materials., we can analyze where AFLite fails and succeeds at sample splitting.
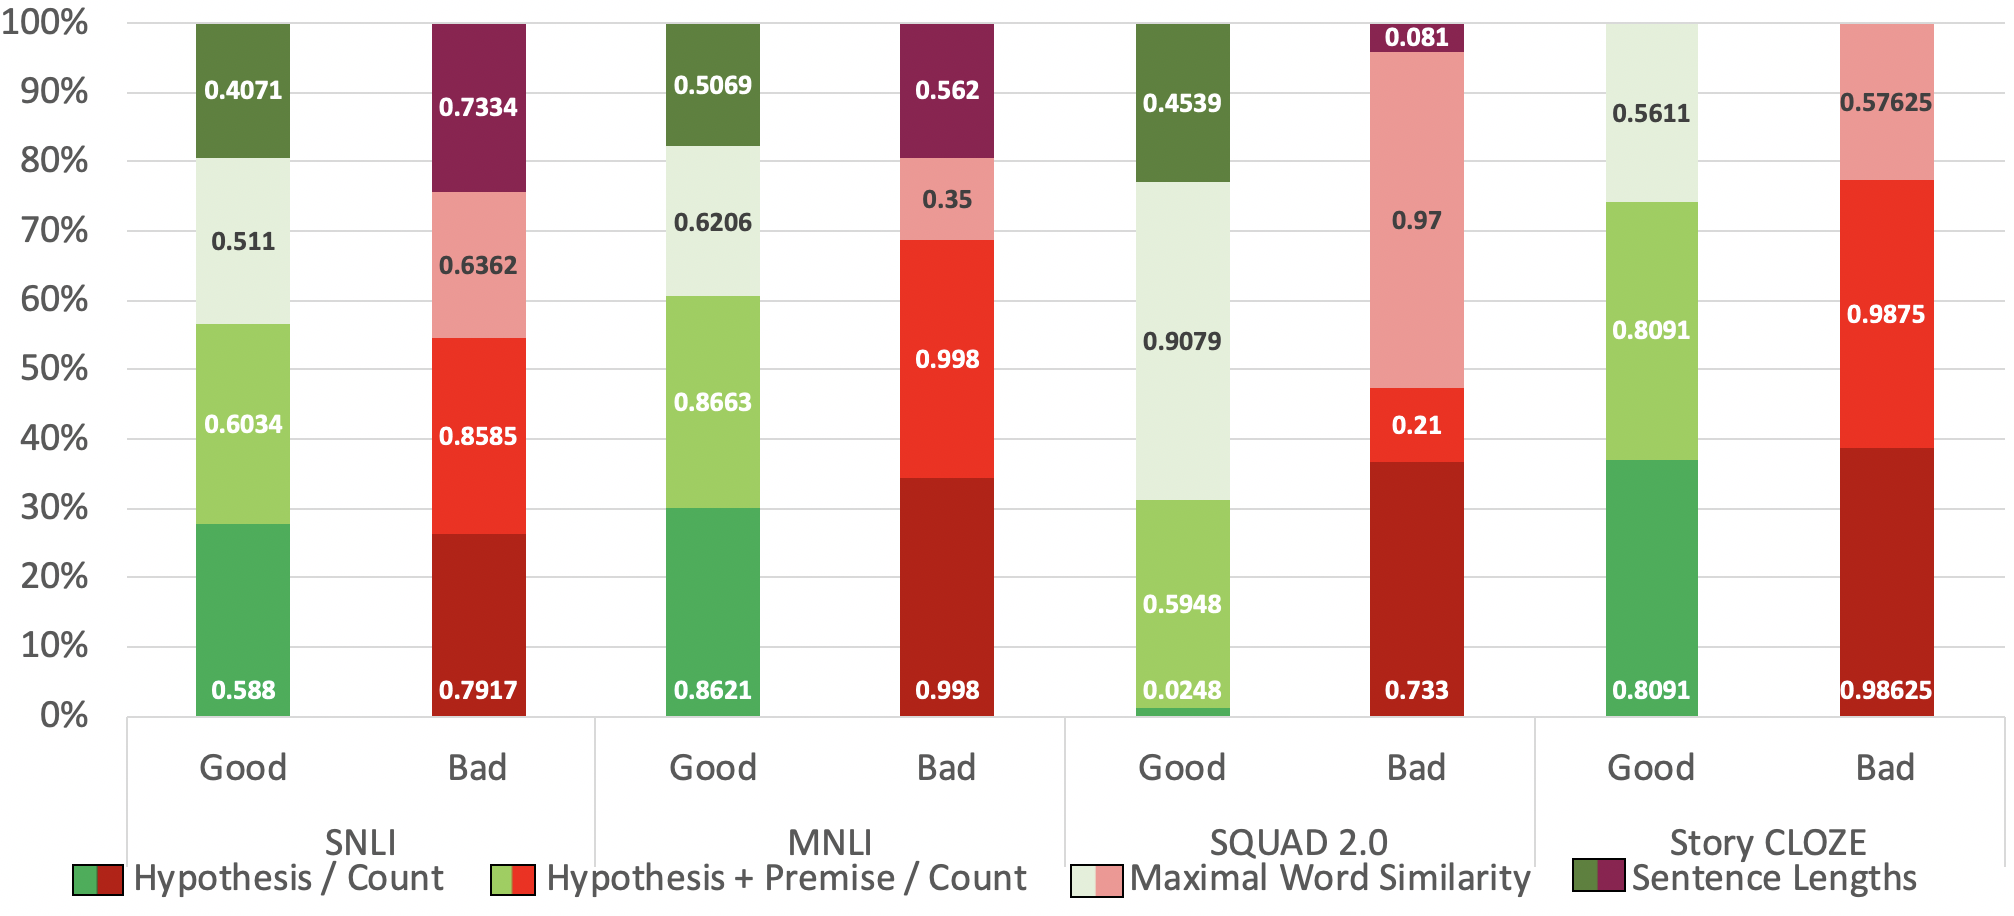
AFLite Failures: We specifically examine language features that AFLite fails to appropriately consider as artifacts. The DQI formulas are constructed such that the good split is expected to have higher sub-component values than the bad split.
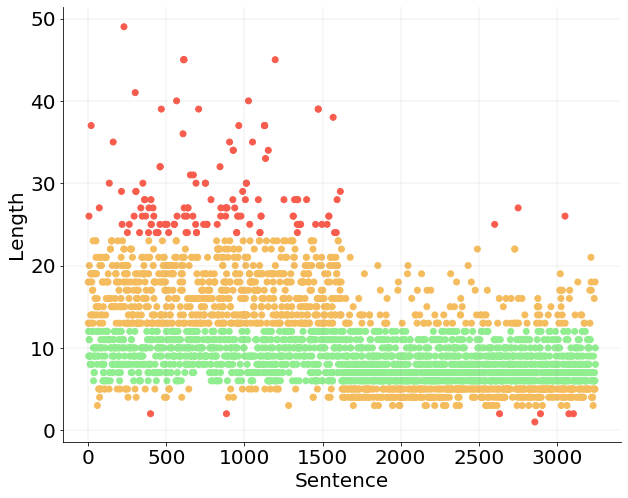
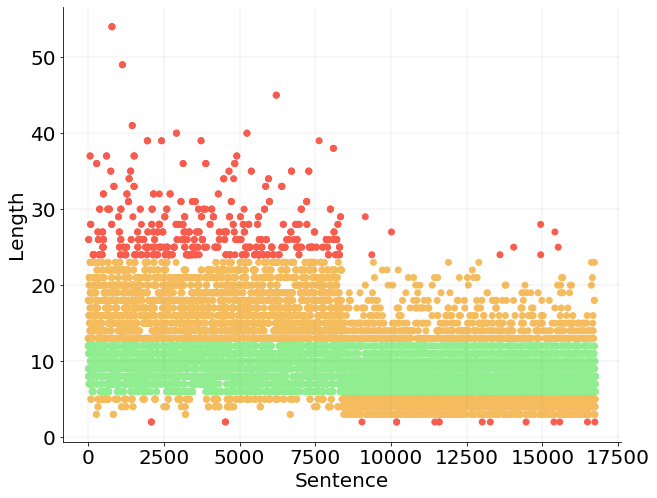
Sentence length: We expect variation of sentence lengths to be high, as length has been found to be an important parameter related to bias in SNLI (Mishra et al., 2020b). We find that even though the second and third sub-components of the Vocabulary component are higher for the good split, the difference is less than expected. Sentence length variation follows a similar pattern for each split. This is confirmed by calculating the percentage differences of sentence lengths between the splits. The takeaway is that AFLite likely does not appropriately consider data with sentence length associated bias, as we would otherwise expect to see sentences with outlier length values mainly placed in the bad split. This is further supported by sub-component three (fails for neutral and contradiction labels) and sub-component four (fails for contradiction label) of the N-gram Frequency per Label component—responsible for ensuring that models do not overfit towards a fixed-length difference.
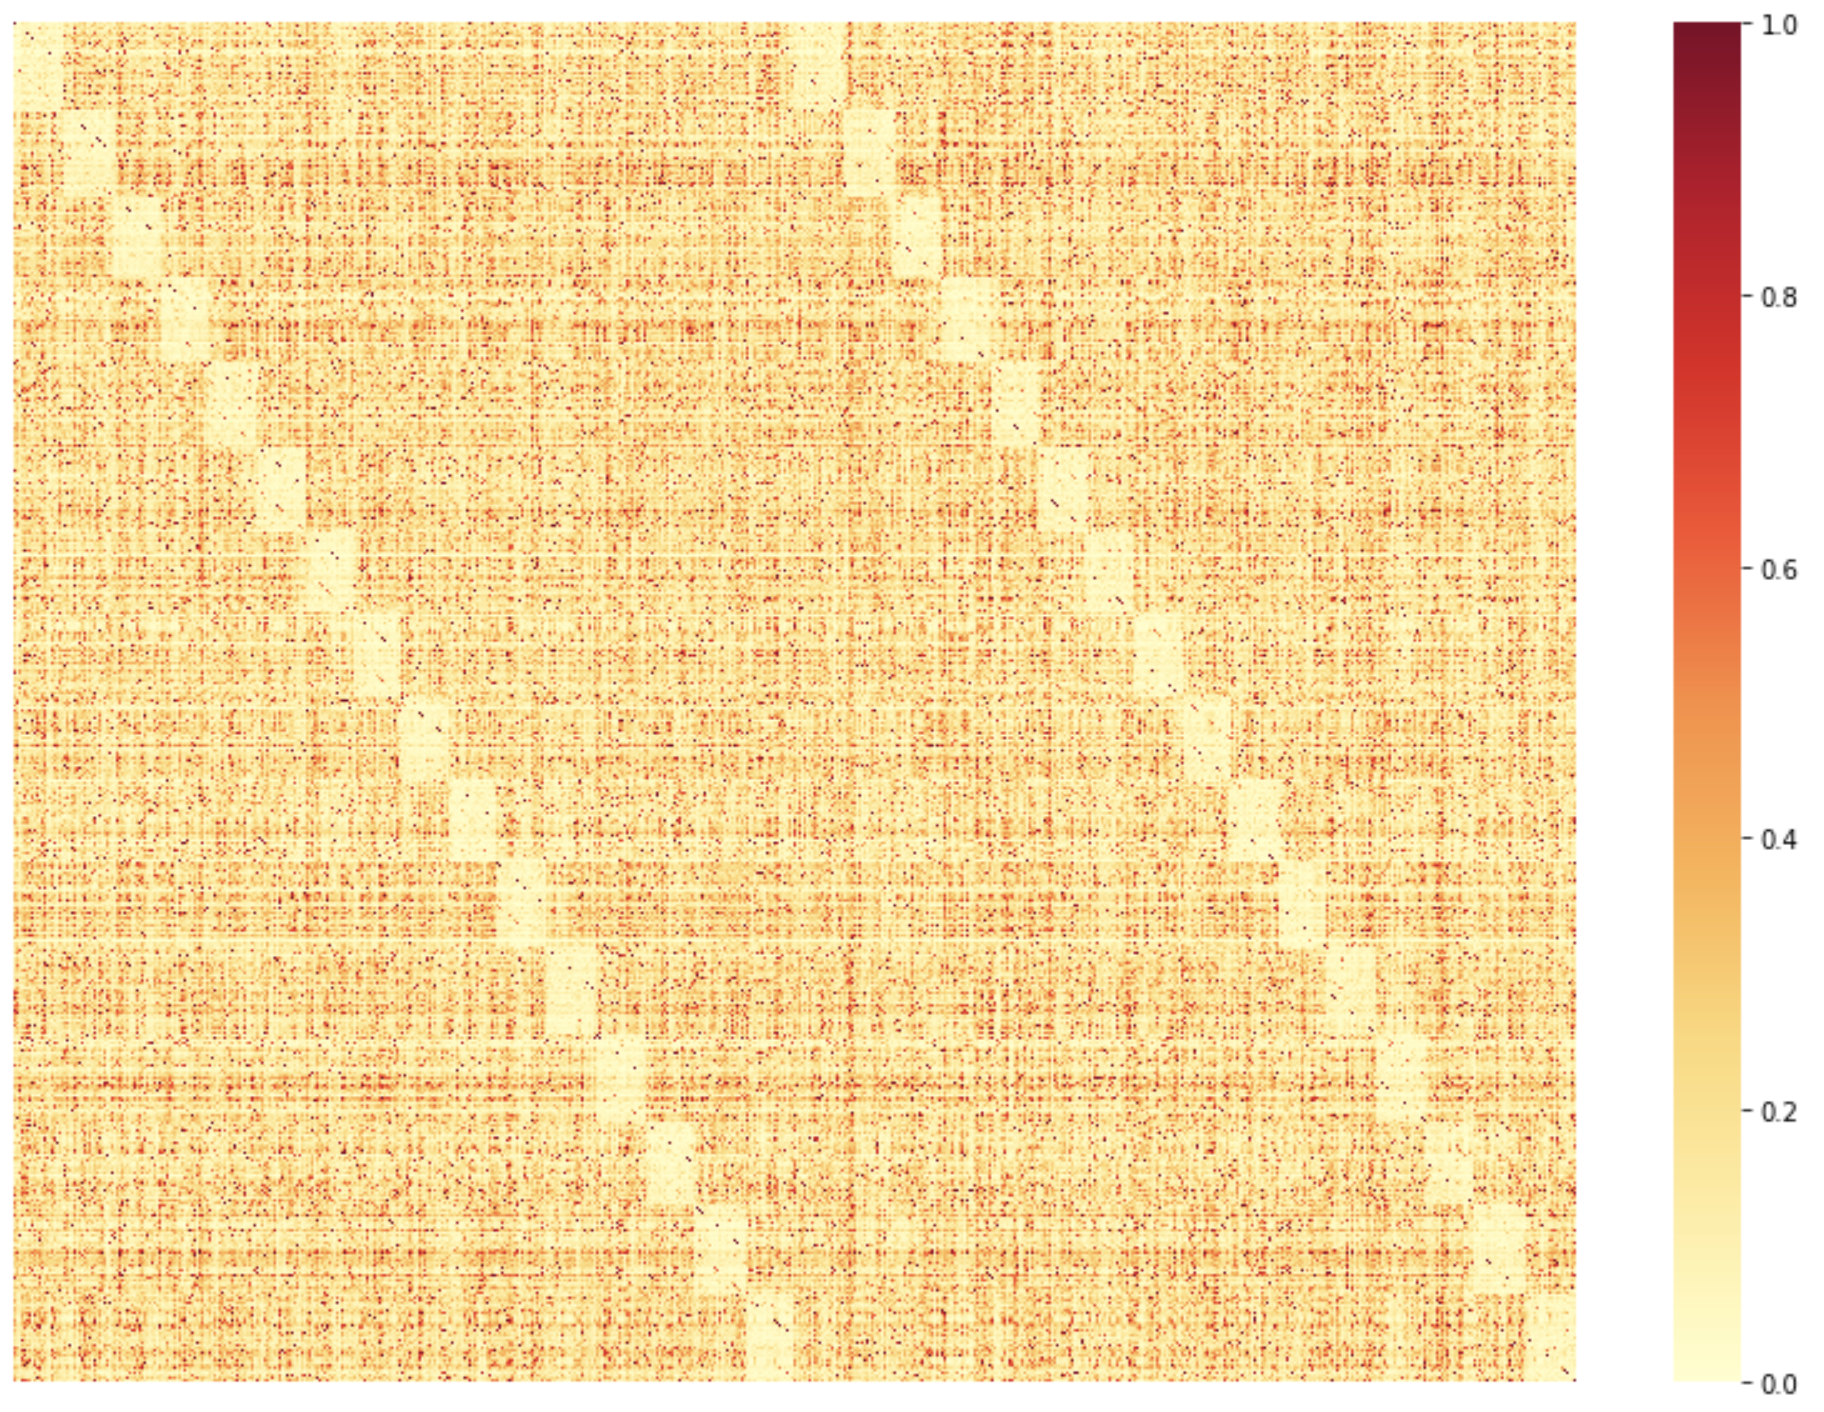
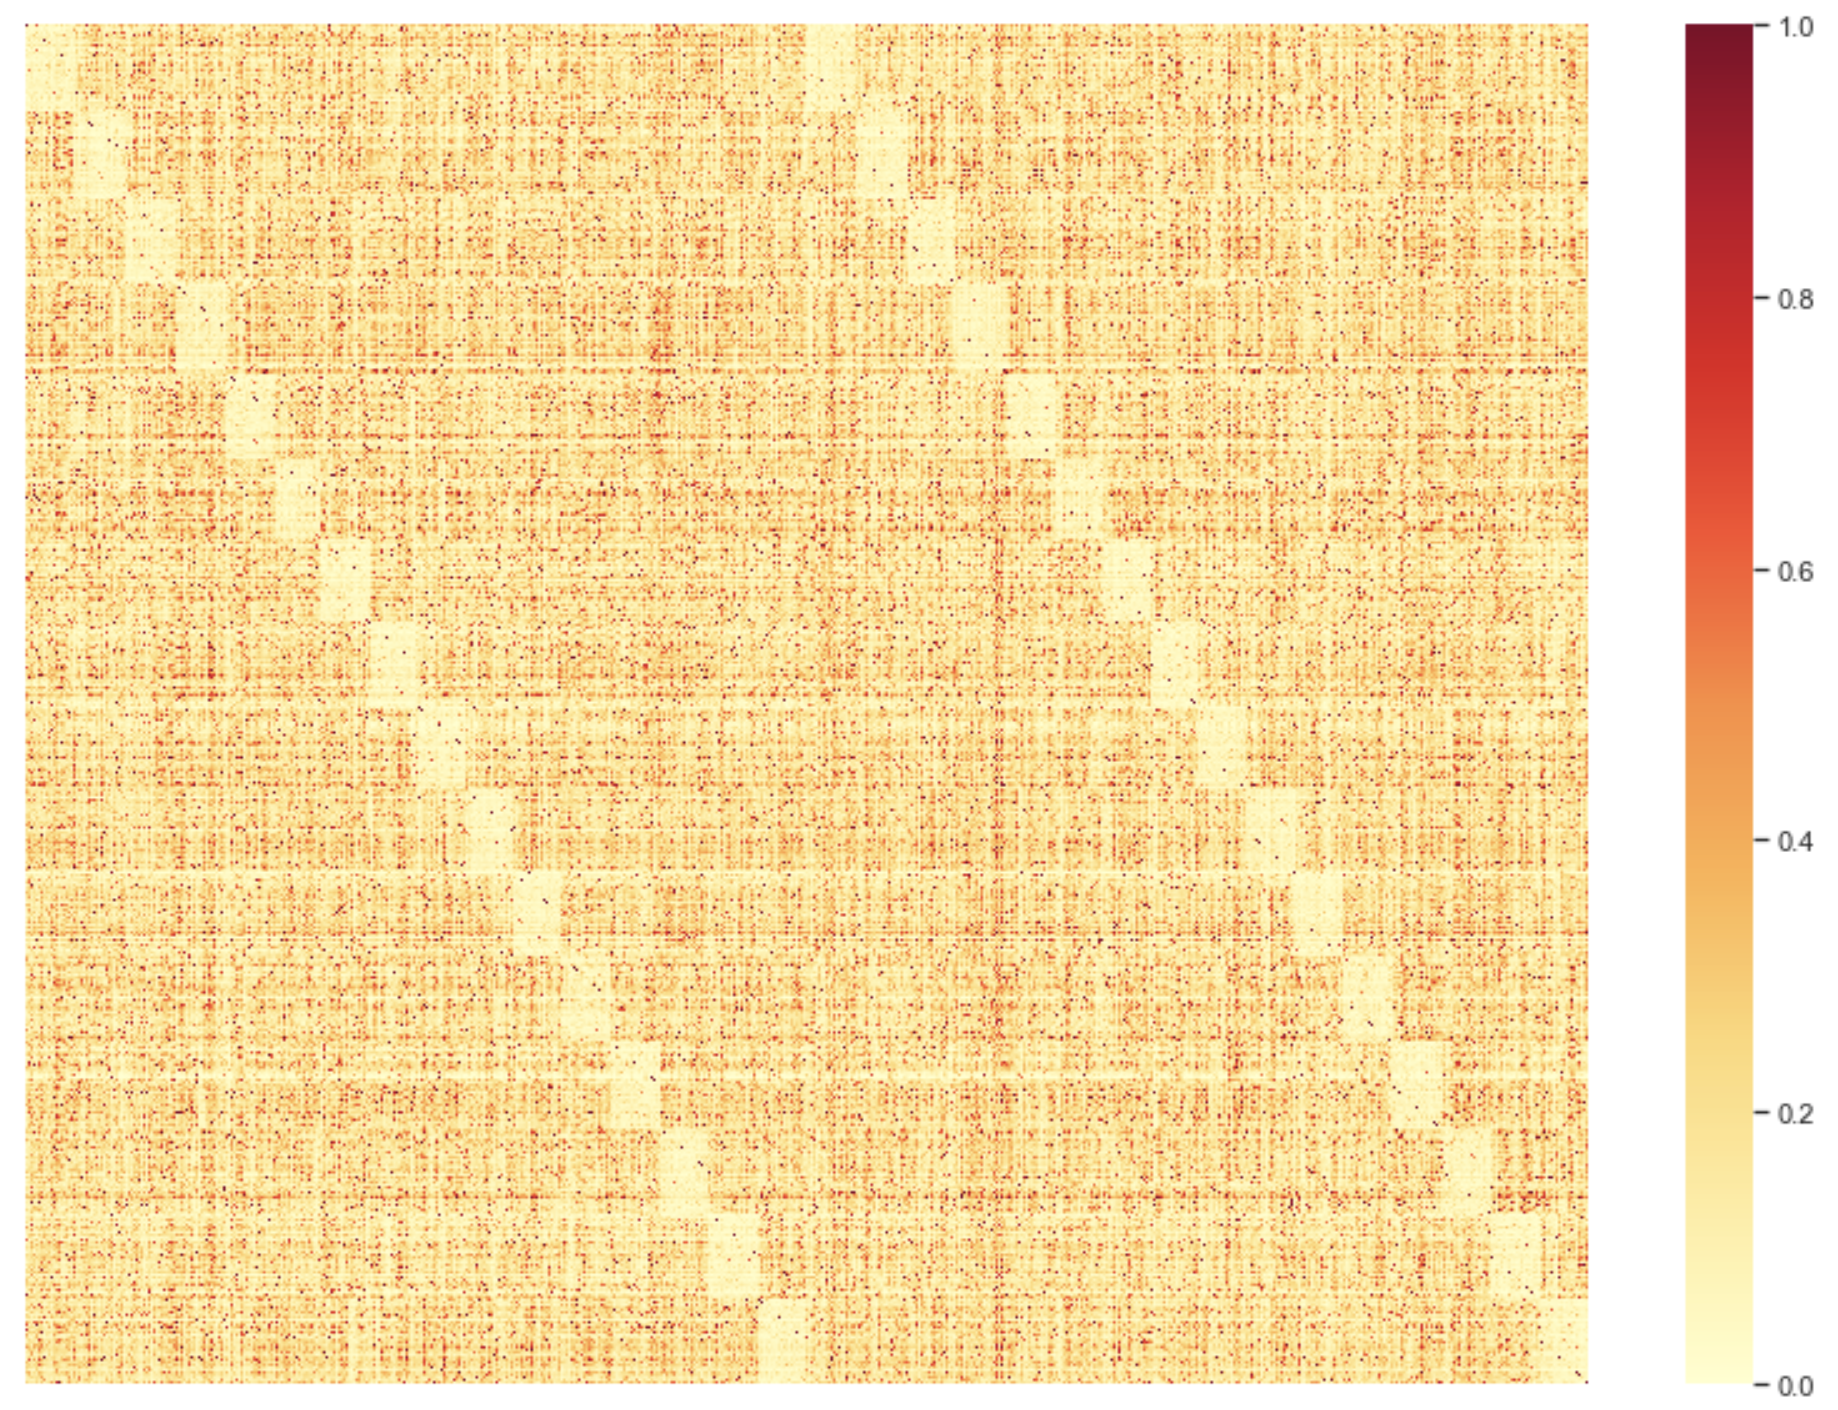
Sentence Similarity: For the Inter-sample STS component, sub-component one dictates that the number of sentences that cross the threshold set for spurious bias should have lower variance: if the distributions of similarity for all sentences are skewed, this leads to spurious bias. We find that the bad split outperforms the good split, which indicates that AFLite might not be not considering imbalance due to sentence similarity.
Premise-Hypothesis Similarity The Intra-sample STS component quantifies: (i) how far premise- hypothesis pairs are from a particular similarity threshold, (ii) how much the length variation, word overlap, and maximum word similarity between premise and hypothesis are, and (iii) how much is the variation in similarities across all pairs in the dataset. We expect significant444Significance is defined as values of order greater than e-03 for this component. differences for sub-components between the good and bad splits. However, both sub-component and overall component values do not show a significant difference across splits. This is surprising, as this component captures several major bias-related parameters (Mishra et al., 2020b). This indicates AFLite might not be accurately filtering data with high premise-hypothesis similarity and length difference.
Bigrams, Trigrams: We expect a non-skewed distribution of granularities both within and across labels. We find that the first sub-component for N-gram Frequency per Label fails for bigrams, and trigrams. AFLite is likely not handling these granularities appropriately. For bigrams and trigrams, the fifth sub-component again has a lower value for the good split, indicating AFLite is not effectively identifying artifacts for bigrams and trigrams.
Neutral Category: For the N-gram Frequency per Label component, the second sub-component fails in the neutral label for the sentence, adjective, adverb, verb, bigram, and trigram granularities. This indicates that AFLite is potentially not filtering appropriately for neutral category samples.
Train-Test Split: For the Inter-Split STS component,we find no significant difference in train-test similarity between the good and bad splits, though it is expected that the bad split will show much higher similarity, as inter-split similarity has been identified as an important source of bias in SNLI (Mishra et al., 2020b). This indicates AFLite is poten-
tially not properly incorporating artifacts related to the train-test split, such as data leakage.
AFLite Pass Cases: For the Vocabulary component, the good split has a higher overall value than the bad split. Of the three sub-components in this component, the first shows the most significant difference. The granularity variation in the Inter-Sample N-Gram Frequency and Relation component passes for all granularities except sentences, which we attribute to lower repetition of sentences compared to the other granularities. We also calculate this sub-component without normalization and find that it holds for sentences without normalization; the second sub-component passes in all cases. The second sub-component for Inter-Sample STS also passes. We also observe that the Intra-Sample Word Similarity component passes, indicating that AFLite captures Word Noise in SNLI. We note that contradiction samples seem more prone to spurious bias, due to a high ratio between the bad and good split sample counts in comparison to the entailment and neutral labels.
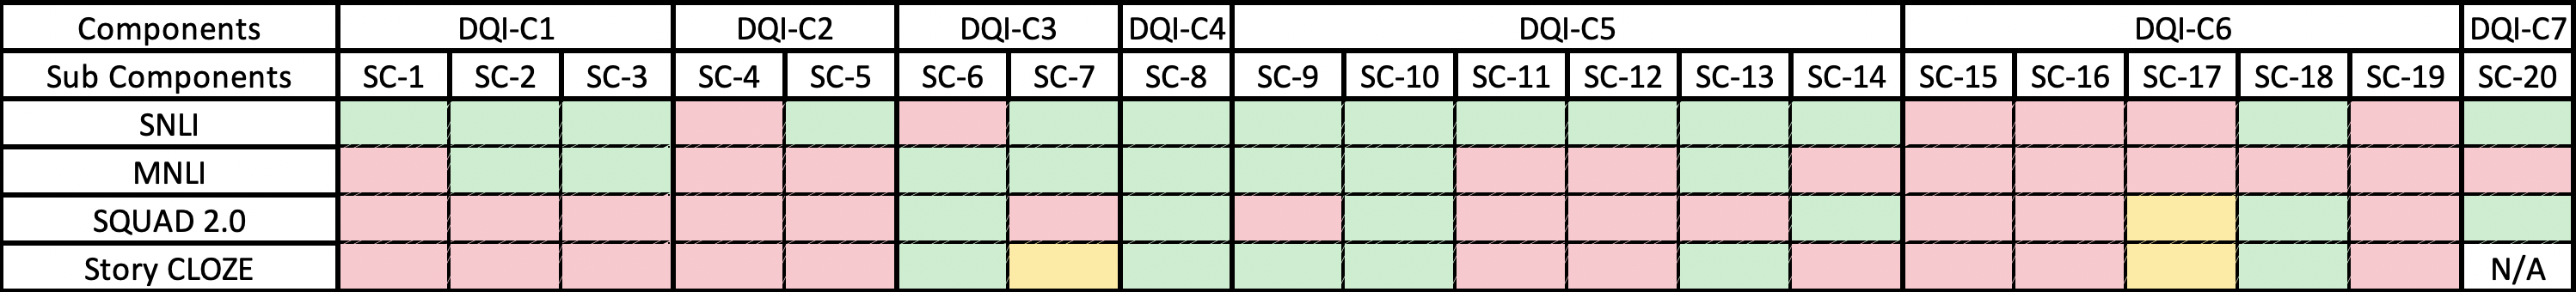
Other Datasets: Figure 2 summarizes results for SNLI, MNLI, SQUAD 2.0, and Story CLOZE Task.555Detailed results are in supplemental materials The number of sub-components for which the good split has higher DQI values than the bad split reduces as we move in order between SNLI, Story CLOZE Task, MNLI, and SQUAD 2.0. This is likely due to the decrease in the number of artifacts.
3.2. Sample-Wise Analysis
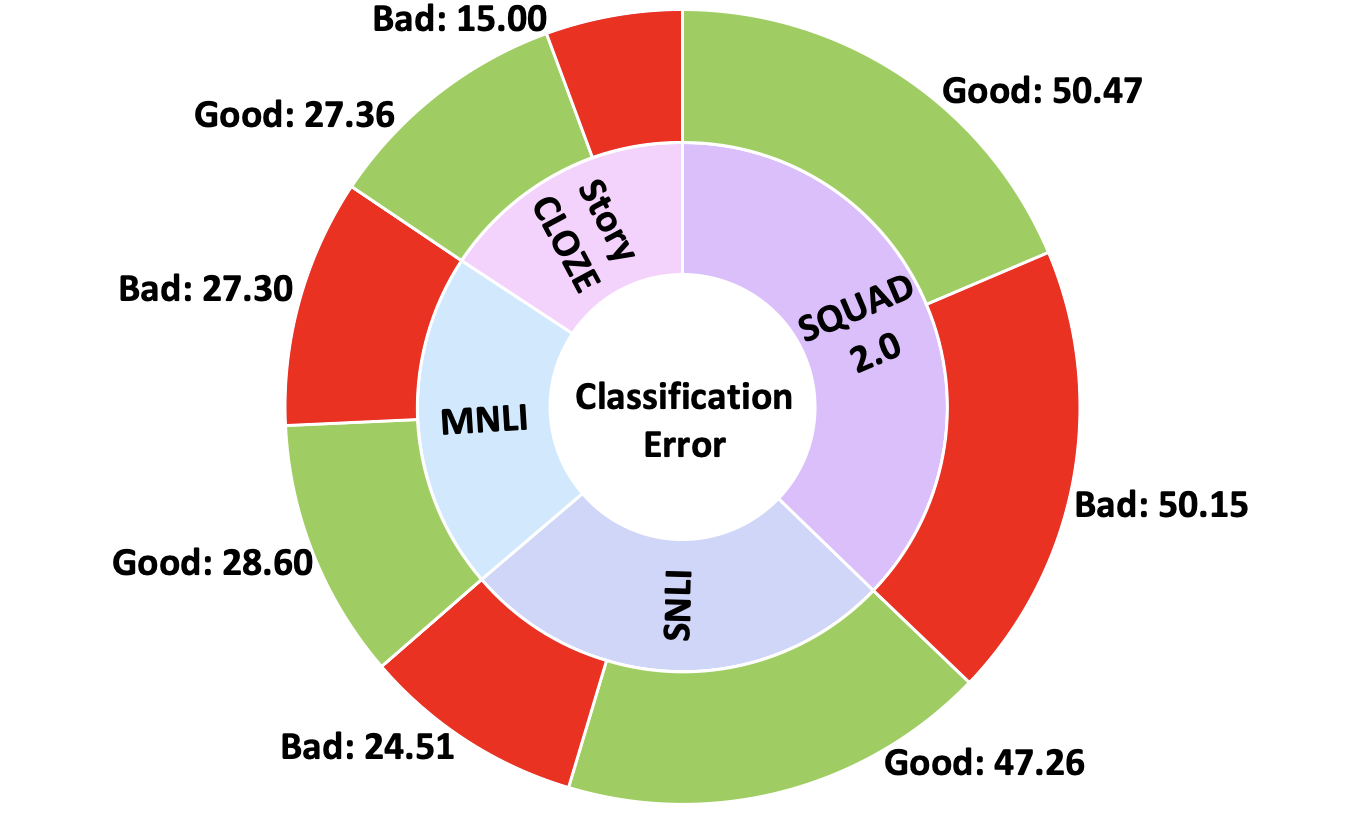
We individually evaluate a subset of samples to quantify inconsistencies in AFLite. We set a minimum threshold value for DQI components to bin samples in the good split, by following the same steps as that of hyperparameter tuning (mentioned at the top of this section). Next, we calculate the DQI of samples in the good and bad splits and look for inconsistencies. Figure 3 summarizes the results, showing that 47.26% and 24.51% of SNLI samples are misclassified in the good and bad splits. The percentages for the other datasets are MNLI 28.60%/27.30%, SQUAD 2.0 50.47%/50.15%, and Story CLOZE Task 27.36%/15.00%.
4 Discussion: Towards a Paradigm Shift in Benchmarks and Models
DQI’s ability to quantify data quality can: (i) be leveraged to repair biased legacy datasets, (ii) provide realtime feedback to crowdworkers when creating samples for benchmarks, (iii) provide flexibility in controlling the ‘hardness’ of a benchmark by tuning relevant sub-components out of the 133 terms, (iv) help better utilize the investment of resources in creating datasets, as it does not require the deletion of biased data at a later stage, and (v) help understand which language properties are important to solve a dataset.
5 Conclusion
We introduce a novel metric Data Quality Index (DQI) to evaluate the quality of data in benchmarks. We build upon existing studies on bias and propose a formula for generic DQI. In contrast to existing binary and black-box approaches that only cover a specific set of biases, DQI captures a broad range of biases. DQI can serve as an automated mechanism to provide continuous feedback, neither overloading humans nor risking the possibility of bias associated with human validation. We use DQI to evaluate AFLite, a state of the art approach for adversarial filtering of NLP benchmarks. Our results show that DQI captures varieties of biases that AFLite does not capture. We show the efficacy of DQI in datasets spanning NLI, QA, and RC tasks. DQI already empowers the novel benchmarking paradigms in a series of recent works, and can further serve to inspire and validate the next generation of datasets and models.
Acknowledgements
We thank the anonymous reviewers for their thoughtful feedback. We also thank Jason Yalim and ASU HPC for their consistent support. The support of DARPA SAIL-ON program (W911NF2020006) is gratefully acknowledged.
References
- Bollen (2000) M. H. Bollen. Understanding power quality problems. In Voltage sags and Interruptions. IEEE press, 2000.
- Bowman et al. (2015) S. R. Bowman, G. Angeli, C. Potts, and C. D. Manning. A large annotated corpus for learning natural language inference. arXiv preprint arXiv:1508.05326, 2015.
- Clark et al. (2019) C. Clark, M. Yatskar, and L. Zettlemoyer. Don’t take the easy way out: Ensemble based methods for avoiding known dataset biases. arXiv preprint arXiv:1909.03683, 2019.
- Gardner et al. (2020) M. Gardner, Y. Artzi, V. Basmova, J. Berant, B. Bogin, S. Chen, P. Dasigi, D. Dua, Y. Elazar, A. Gottumukkala, et al. Evaluating nlp models via contrast sets. arXiv preprint arXiv:2004.02709, 2020.
- Ghorbani and Zou (2019) A. Ghorbani and J. Zou. Data shapley: Equitable valuation of data for machine learning. arXiv preprint arXiv:1904.02868, 2019.
- Grunert (2005) K. G. Grunert. Food quality and safety: consumer perception and demand. European review of agricultural economics, 32(3):369–391, 2005.
- Gururangan et al. (2018) S. Gururangan, S. Swayamdipta, O. Levy, R. Schwartz, S. R. Bowman, and N. A. Smith. Annotation artifacts in natural language inference data. arXiv preprint arXiv:1803.02324, 2018.
- He et al. (2019) H. He, S. Zha, and H. Wang. Unlearn dataset bias in natural language inference by fitting the residual. arXiv preprint arXiv:1908.10763, 2019.
- Jones (1999) A. P. Jones. Indoor air quality and health. Atmospheric environment, 33(28):4535–4564, 1999.
- Kaushik and Lipton (2018) D. Kaushik and Z. C. Lipton. How much reading does reading comprehension require? a critical investigation of popular benchmarks. arXiv preprint arXiv:1808.04926, 2018.
- Kaushik et al. (2019) D. Kaushik, E. Hovy, and Z. C. Lipton. Learning the difference that makes a difference with counterfactually-augmented data. arXiv preprint arXiv:1909.12434, 2019.
- Le Bras et al. (2020) R. Le Bras, S. Swayamdipta, C. Bhagavatula, R. Zellers, M. E. Peters, A. Sabharwal, and Y. Choi. Adversarial filters of dataset biases. arXiv, pages arXiv–2002, 2020.
- Li and Vasconcelos (2019) Y. Li and N. Vasconcelos. Repair: Removing representation bias by dataset resampling. In Proceedings of the IEEE Conference on Computer Vision and Pattern Recognition, pages 9572–9581, 2019.
- Li et al. (2018) Y. Li, Y. Li, and N. Vasconcelos. Resound: Towards action recognition without representation bias. In Proceedings of the European Conference on Computer Vision (ECCV), pages 513–528, 2018.
- Liu et al. (2019) N. F. Liu, R. Schwartz, and N. A. Smith. Inoculation by fine-tuning: A method for analyzing challenge datasets. In Proceedings of the 2019 Conference of the North American Chapter of the Association for Computational Linguistics: Human Language Technologies, Volume 1 (Long and Short Papers), pages 2171–2179, Minneapolis, Minnesota, June 2019. Association for Computational Linguistics. doi: 10.18653/v1/N19-1225. URL https://www.aclweb.org/anthology/N19-1225.
- Mahabadi and Henderson (2019) R. K. Mahabadi and J. Henderson. simple but effective techniques to reduce biases. arXiv preprint arXiv:1909.06321, 2019.
- Mishra et al. (2020a) S. Mishra, A. Arunkumar, C. Bryan, and C. Baral. Our evaluation metric needs an update to encourage generalization. arXiv preprint arXiv:2007.06898, 2020a.
- Mishra et al. (2020b) S. Mishra, A. Arunkumar, B. Sachdeva, C. Bryan, and C. Baral. Dqi: Measuring data quality in nlp. arXiv preprint arXiv:2005.00816, 2020b.
- Mostafazadeh et al. (2016) N. Mostafazadeh, N. Chambers, X. He, D. Parikh, D. Batra, L. Vanderwende, P. Kohli, and J. Allen. A corpus and evaluation framework for deeper understanding of commonsense stories. arXiv preprint arXiv:1604.01696, 2016.
- Nie et al. (2019) Y. Nie, A. Williams, E. Dinan, M. Bansal, J. Weston, and D. Kiela. Adversarial nli: A new benchmark for natural language understanding. arXiv preprint arXiv:1910.14599, 2019.
- Organization (1993) W. H. Organization. Guidelines for drinking-water quality. World Health Organization, 1993.
- Poliak et al. (2018) A. Poliak, J. Naradowsky, A. Haldar, R. Rudinger, and B. Van Durme. Hypothesis only baselines in natural language inference. arXiv preprint arXiv:1805.01042, 2018.
- Rajpurkar et al. (2018) P. Rajpurkar, R. Jia, and P. Liang. Know what you don’t know: Unanswerable questions for squad. arXiv preprint arXiv:1806.03822, 2018.
- Sakaguchi et al. (2019) K. Sakaguchi, R. L. Bras, C. Bhagavatula, and Y. Choi. Winogrande: An adversarial winograd schema challenge at scale. arXiv preprint arXiv:1907.10641, 2019.
- Schwartz et al. (2017) R. Schwartz, M. Sap, I. Konstas, L. Zilles, Y. Choi, and N. A. Smith. The effect of different writing tasks on linguistic style: A case study of the roc story cloze task. arXiv preprint arXiv:1702.01841, 2017.
- Torralba and Efros (2011) A. Torralba and A. A. Efros. Unbiased look at dataset bias. In CVPR 2011, pages 1521–1528. IEEE, 2011.
- Wang et al. (2018) T. Wang, J.-Y. Zhu, A. Torralba, and A. A. Efros. Dataset distillation. arXiv preprint arXiv:1811.10959, 2018.
- Williams et al. (2017) A. Williams, N. Nangia, and S. R. Bowman. A broad-coverage challenge corpus for sentence understanding through inference. arXiv preprint arXiv:1704.05426, 2017.
- Zellers et al. (2018) R. Zellers, Y. Bisk, R. Schwartz, and Y. Choi. Swag: A large-scale adversarial dataset for grounded commonsense inference. arXiv preprint arXiv:1808.05326, 2018.
6 Supplementary
Vocabulary:
| Term | T1 | T2 | T3 | DQI C1 |
|---|---|---|---|---|
| Good | 1.8996 | 6.0409 | 0.9532 | 7.6578 |
| Bad | 0.6416 | 5.8135 | 0.9494 | 6.1609 |
.
| Term | T1 | T2 | T3 | DQI C1 |
|---|---|---|---|---|
| Good | 1.6177 | 104.6542 | 0.7550 | 80.6316 |
| Bad | 7.4100 | 14.1068 | 0.6020 | 15.9023 |
.
| Term | T1 | T2 | T3 | DQI C1 |
|---|---|---|---|---|
| Good | 1.7715 | 71.3947 | -0.0023 | 1.6073 |
| Bad | 11.1550 | 73.3092 | -0.001 | 11.1476 |
.
| Term | T1 | T2 | T3 | DQI C1 |
|---|---|---|---|---|
| Good | 3.3010 | 13.4569 | 0.2772 | 7.0313 |
| Bad | 4.7675 | 13.4895 | 0.2839 | 8.5972 |
.
Inter-Sample N-Gram Frequency and Relation:
| Granularity | Split | T1 | T2 | Contribution |
|---|---|---|---|---|
| Words | Good | 121.9512 | 0.7269 | 88.6463 |
| Bad | 52.3560 | 0.6500 | 34.0314 | |
| Adjectives | Good | 31.7460 | 0.2966 | 9.4159 |
| Bad | 16.9205 | 0.3590 | 6.0745 | |
| Adverbs | Good | 21.0970 | 0.1847 | 3.8966 |
| Bad | 10.7875 | 0.1732 | 1.8684 | |
| Verbs | Good | 43.6681 | 0.2349 | 10.2576 |
| Bad | 16.5289 | 0.1893 | 3.1289 | |
| Nouns | Good | 49.2611 | 0.4351 | 21.4335 |
| Bad | 21.0084 | 0.3685 | 7.7416 | |
| Bigrams | Good | 1296.3443 | 0.9374 | 1215.1931 |
| Bad | 873.2862 | 0.9355 | 816.9592 | |
| Trigrams | Good | 7686.3951 | 0.9546 | 7337.4328 |
| Bad | 6119.9510 | 0.9422 | 5766.2178 | |
| Sentences | Good | 9070.7819 | 0.6607 | 5993.0656 |
| Bad | 14537.0541 | 0.2705 | 3932.2731 | |
| Sentences | Good | 3.0656 | 0.6607 | 3.7263 |
| (Not Normalized) | Bad | 1.2655 | 0.2705 | 1.0607 |
| DQIC2 | Good | - | - | 8668.3012 |
| Bad | - | - | 6636.3641 |
| Granularity | Split | T1 | T2 | Contribution |
|---|---|---|---|---|
| Words | Good | 299.2489 | 0.9223 | 275.9972 |
| Bad | 1026.2828 | 1.0000 | 1026.2828 | |
| Adjectives | Good | 147.7382 | 1.0000 | 147.7382 |
| Bad | 333.8001 | 1.0000 | 333.8001 | |
| Adverbs | Good | 14.9467 | 0.5166 | 7.7214 |
| Bad | 54.2488 | 0.7318 | 39.6992 | |
| Verbs | Good | 76.0906 | 0.6893 | 52.4492 |
| Bad | 182.7695 | 0.7130 | 130.3146 | |
| Nouns | Good | 225.1162 | 0.9726 | 218.9480 |
| Bad | 477.5051 | 0.9704 | 463.3709 | |
| Bigrams | Good | 4394.8945 | 1.0000 | 4394.8945 |
| Bad | 5615.4581 | 1.0000 | 5615.4581 | |
| Trigrams | Good | 16628.8816 | 0.9907 | 16474.2330 |
| Bad | 35285.2261 | 0.9735 | 34350.1676 | |
| Sentences | Good | 15197.5684 | 0.0049 | 74.4680 |
| Bad | 11085.6756 | 0.9680 | 10730.9339 | |
| Sentences | Good | 1.2314 | 0.0049 | 0.0060 |
| (Not Normalized) | Bad | 11.1732 | 0.9680 | 10.8156 |
| DQIC2 | Good | - | - | 21646.4558 |
| Bad | - | - | 52700.84312 |
| Granularity | Split | T1 | T2 | Contribution |
|---|---|---|---|---|
| Words | Good | 138.6878 | 0.6744 | 93.5310 |
| Bad | 615.0626 | 0.6224 | 382.8149 | |
| Adjectives | Good | 37.0775 | 1.0000 | 37.0775 |
| Bad | 161.0191 | 1.0000 | 161.0191 | |
| Adverbs | Good | 4.0080 | 0.7473 | 2.9951 |
| Bad | 18.7378 | 0.7610 | 14.2594 | |
| Verbs | Good | 30.1469 | 0.9051 | 27.2859 |
| Bad | 152.9500 | 0.9372 | 143.3447 | |
| Nouns | Good | 58.5576 | 1.0000 | 58.5576 |
| Bad | 255.8677 | 1.0000 | 255.8677 | |
| Bigrams | Good | 1665.8142 | 0.9763 | 1626.3344 |
| Bad | 4563.8191 | 0.9755 | 4452.0055 | |
| Trigrams | Good | 20526.6346 | 1.0000 | 20526.6346 |
| Bad | 39155.8925 | 0.9821 | 38455.0020 | |
| Sentences | Good | 4811.1347 | -0.0013 | -6.2544 |
| Bad | 1996.9248 | 0.2460 | 491.2435 | |
| Sentences | Good | 0.3991 | -0.0013 | -0.0005 |
| (Not Normalized) | Bad | 1.3043 | 0.2460 | 0.3208 |
| DQIC2 | Good | - | - | 22366.1613 |
| Bad | - | - | 44355.87788 |
| Granularity | Split | T1 | T2 | Contribution |
|---|---|---|---|---|
| Words | Good | 396.9190 | 0.3661 | 145.3120 |
| Bad | 52.3560 | 0.3239 | 16.9581 | |
| Adjectives | Good | 77.3987 | 0.8307 | 64.2951 |
| Bad | 70.2610 | 0.8020 | 56.3493 | |
| Adverbs | Good | 17.3230 | 0.4292 | 7.4350 |
| Bad | 27.8482 | 0.6178 | 17.2046 | |
| Verbs | Good | 59.4638 | 0.5936 | 35.2977 |
| Bad | 63.3871 | 0.5511 | 34.9326 | |
| Nouns | Good | 270.8688 | 0.8953 | 242.5088 |
| Bad | 250.9358 | 0.9289 | 233.0942 | |
| Bigrams | Good | 4116.6448 | 1.0000 | 4116.6448 |
| Bad | 2991.6306 | 1.0000 | 2991.6306 | |
| Trigrams | Good | 30424.4890 | 1.0000 | 30424.4890 |
| Bad | 17757.2356 | 0.9383 | 16661.6141 | |
| Sentences | Good | 8161.7926 | -0.0015 | -12.2426 |
| Bad | 2544.5235 | 0.0000 | 0.0000 | |
| Sentences | Good | 2.1199 | -0.0015 | -0.0031 |
| (Not Normalized) | Bad | 2.1204 | 0.0000 | 0.0000 |
| DQIC2 | Good | - | - | 35023.73666 |
| Bad | - | - | 20011.78371 |
Inter-Sample STS:
| Split | SIML=0.3 | SIML=0.35 | SIML=0.4 |
|---|---|---|---|
| Good | 9.1320 | 11.3955 | 14.3267 |
| Bad | 10.3842 | 13.1062 | 16.6390 |
| Split | e=0.25 | e=0.33 | e=0.5 |
|---|---|---|---|
| Good | 0.0468 | 0.0244 | 0.0103 |
| Bad | 0.0404 | 0.0216 | 0.0094 |
| Sample Set | DQI C3 (e=0.5) | ||
|---|---|---|---|
| SIM=0.5 | SIM=0.6 | SIM=0.7 | |
| Good | 9.4123 | 11.4508 | 14.3370 |
| Bad | 10.3936 | 13.1156 | 16.7024 |
| Split | SIML=0.3 | SIML=0.35 | SIML=0.4 |
|---|---|---|---|
| Good | 334.2154 | 695.0772 | 1040.5142 |
| Bad | 312.4684 | 643.3308 | 953.5445 |
| Split | e=0.25 | e=0.33 | e=0.5 |
|---|---|---|---|
| Good | 0.0148 | 0.0108 | 0.0067 |
| Bad | 0.0111 | 0.0084 | 0.0056 |
| Sample Set | DQI C3 (e=0.5) | ||
|---|---|---|---|
| SIM=0.5 | SIM=0.6 | SIM=0.7 | |
| Good | 334.2221 | 695.0839 | 1040.5209 |
| Bad | 312.474 | 643.3364 | 953.5501 |
| Split | SIML=0.3 | SIML=0.35 | SIML=0.4 |
|---|---|---|---|
| Good | 129.8631 | 171.7117 | 228.9109 |
| Bad | 88.9812 | 110.6097 | 141.2737 |
| Split | e=0.25 | e=0.33 | e=0.5 |
|---|---|---|---|
| Good | 0.0051 | 0.0039 | 0.0026 |
| Bad | 0.0055 | 0.0042 | 0.0094 |
| Sample Set | DQI C3 (e=0.5) | ||
|---|---|---|---|
| SIM=0.5 | SIM=0.6 | SIM=0.7 | |
| Good | 129.8657 | 171.7143 | 228.9135 |
| Bad | 88.984 | 110.6125 | 141.2765 |
| Split | SIML=0.3 | SIML=0.35 | SIML=0.4 |
|---|---|---|---|
| Good | 285.1348 | 513.1720 | 820.2516 |
| Bad | 209.0823 | 368.5646 | 594.0969 |
| Split | e=0.25 | e=0.33 | e=0.5 |
|---|---|---|---|
| Good | 0.0069 | 0.0053 | 0.0036 |
| Bad | 0.0069 | 0.0053 | 0.0036 |
| Sample Set | DQI C3 (e=0.5) | ||
|---|---|---|---|
| SIM=0.5 | SIM=0.6 | SIM=0.7 | |
| Good | 285.1384 | 513.1756 | 820.2552 |
| Bad | 209.0859 | 368.5682 | 594.1005 |
Intra-Sample Word Similarity:
| Split | DQIC4 |
|---|---|
| Good | 0.0004 |
| Bad | 0.0001 |
| Split | DQIC4 |
|---|---|
| Good | 0.0197 |
| Bad | 0.0011 |
| Split | DQIC4 |
|---|---|
| Good | 5.2208 |
| Bad | 0.4577 |
| Split | DQIC4 |
|---|---|
| Good | 0.0025 |
| Bad | 0.0008 |
Intra-Sample STS:
| Split | ISIM=0.3 | ISIM=0.4 | ISIM=0.5 | ISIM=0.6 |
|---|---|---|---|---|
| Good | 2.2349 | 2.8763 | 4.0125 | 6.3065 |
| Bad | 2.2215 | 2.8558 | 3.9784 | 6.2237 |
| Split | T2 | T3 | T4 | T5 | T6 |
|---|---|---|---|---|---|
| Good | 0.1439 | 0.0038 | 6.4064e-05 | 20.3518 | 0.0903 |
| Bad | 0.1430 | 0.0007 | 1.2711e-05 | 19.9288 | 0.0900 |
| Split | DQI C5 |
|---|---|
| Good | 24.6024 |
| Bad | 24.1409 |
| Split | ISIM=0.3 | ISIM=0.4 | ISIM=0.5 | ISIM=0.6 |
|---|---|---|---|---|
| Good | 2.2233 | 2.8585 | 3.9884 | 6.3364 |
| Bad | 2.1256 | 2.6986 | 3.6843 | 5.5845 |
| Split | T2 | T3 | T4 | T5 | T6 |
|---|---|---|---|---|---|
| Good | 0.0791 | 0.0162 | 1.1073E-05 | 15.3835 | 14.7547 |
| Bad | 0.0741 | 0.0307 | 20.9407E-05 | 12.3932 | 17.6181 |
| Split | DQI C5 |
|---|---|
| Good | 34.2219 |
| Bad | 33.8006 |
| Split | ISIM=0.3 | ISIM=0.4 | ISIM=0.5 | ISIM=0.6 |
|---|---|---|---|---|
| Good | 2.5073 | 3.3460 | 5.0031 | 9.1300 |
| Bad | 2.5379 | 3.4012 | 5.1352 | 9.6189 |
| Split | T2 | T3 | T4 | T5 | T6 |
|---|---|---|---|---|---|
| Good | 0.0085 | 0.0052 | 7.3081E-06 | 22.9314 | 102.9990 |
| Bad | 0.0079 | 0.0524 | 7.4403E-05 | 27.0966 | 88.8872 |
| Split | DQI C5 |
|---|---|
| Good | 130.9472 |
| Bad | 121.1793 |
| Split | ISIM=0.3 | ISIM=0.4 | ISIM=0.5 | ISIM=0.6 |
|---|---|---|---|---|
| Good | 3.1103 | 4.5013 | 7.7337 | 14.4898 |
| Bad | 3.0639 | 4.4163 | 7.5943 | 14.7772 |
| Split | T2 | T3 | T4 | T5 | T6 |
|---|---|---|---|---|---|
| Good | 0.0400 | 0.0027 | 3.1939E-05 | 0.0400 | 2.6196e-06 |
| Bad | 0.0398 | 0.0084 | 9.7664E-05 | 0.0398 | 7.6306e-06 |
| Split | DQI C5 |
|---|---|
| Good | 7.8164 |
| Bad | 7.6824 |
N-Gram Frequency Per Label
| Split/Label | Entailment | Neutral | Contradiction |
|---|---|---|---|
| Good | 1110 | 1430 | 708 |
| Bad | 5626 | 5008 | 6118 |
| Split-Label | T1 | T2 |
|---|---|---|
| Good-Entailment | 8829.2425 | 0.9387 |
| Bad-Entailment | 21655.2868 | 0.8571 |
| Good-Neutral | 7467.5349 | 0.8699 |
| Bad-Neutral | 31616.2545 | 0.9141 |
| Good-Contradiction | 4932.7421 | 0.9210 |
| Bad-Contradiction | 29145.0957 | 0.8783 |
| Split-Label | T1 | T2 |
|---|---|---|
| Good-Entailment | 142.8571 | 0.7277 |
| Bad-Entailment | 81.9672 | 0.6110 |
| Good-Neutral | 153.8462 | 0.9118 |
| Bad-Neutral | 117.6471 | 0.7071 |
| Good-Contradiction | 163.9344 | 0.6764 |
| Bad-Contradiction | 101.0101 | 0.6088 |
| Split-Label | T1 | T2 |
|---|---|---|
| Good-Entailment | 42.1230 | 0.34114 |
| Bad-Entailment | 26.4201 | 0.30551 |
| Good-Neutral | 48.8998 | 0.46865 |
| Bad-Neutral | 38.1534 | 0.47497 |
| Good-Contradiction | 43.1593 | 0.31019 |
| Bad-Contradiction | 29.2826 | 0.32385 |
| Split-Label | T1 | T2 |
|---|---|---|
| Good-Entailment | 18.4128 | 0.056911 |
| Bad-Entailment | 11.0963 | 0.05816 |
| Good-Neutral | 8.6798 | 0.09709 |
| Bad-Neutral | 14.6135 | 0.43124 |
| Good-Contradiction | 37.9795 | 0.34286 |
| Bad-Contradiction | 23.7192 | 0.21583 |
| Split-Label | T1 | T2 |
|---|---|---|
| Good-Entailment | 41.7885 | 0.16091 |
| Bad-Entailment | 22.9410 | 0.05348 |
| Good-Neutral | 48.9476 | 0.17946 |
| Bad-Neutral | 38.9105 | 0.20192 |
| Good-Contradiction | 53.5045 | 0.20000 |
| Bad-Contradiction | 34.6380 | 0.13589 |
| Split-Label | T1 | T2 |
|---|---|---|
| Good-Entailment | 59.2768 | 0.49650 |
| Bad-Entailment | 34.3643 | 0.38238 |
| Good-Neutral | 62.7353 | 0.44534 |
| Bad-Neutral | 46.4253 | 0.40586 |
| Good-Contradiction | 66.3570 | 0.45653 |
| Bad-Contradiction | 39.9202 | 0.37431 |
| Split-Label | T1 | T2 |
|---|---|---|
| Good-Entailment | 1131.7133 | 0.93307 |
| Bad-Entailment | 1173.5409 | 0.93206 |
| Good-Neutral | 1261.2663 | 0.93783 |
| Bad-Neutral | 1598.1514 | 0.94117 |
| Good-Contradiction | 1100.8597 | 0.94325 |
| Bad-Contradiction | 1369.0528 | 0.93387 |
| Split-Label | T1 | T2 |
|---|---|---|
| Good-Entailment | 5921.2942 | 0.94672 |
| Bad-Entailment | 7757.5306 | 0.93496 |
| Good-Neutral | 6414.8208 | 0.94517 |
| Bad-Neutral | 10229.7186 | 0.95015 |
| Good-Contradiction | 5478.1014 | 0.95359 |
| Bad-Contradiction | 8984.3224 | 0.94430 |
| Split-Repetition | 1 | 2 | 3 | 4 | 5 | 6 |
|---|---|---|---|---|---|---|
| Good-Entailment | 0.9844 | 0.0155 | 0 | 0 | 0 | 0 |
| Bad-Entailment | 0.9659 | 0.0308 | 0.001849 | 0 | 0.0007 | 0.0005 |
| Good-Neutral | 0.9667 | 0.0325 | 0.0007 | 0 | 0 | 0 |
| Bad-Neutral | 0.9785 | 0.0204 | 0.0010 | 0 | 0 | 0 |
| Good-Contradiction | 0.9798 | 0.0201 | 0 | 0 | 0 | 0 |
| Bad-Contradiction | 0.9785 | 0.0204 | 0.0010 | 0 | 0 | 0 |
| Split-Label | T3 |
|---|---|
| Good-Entailment | 0.1457 |
| Bad-Entailment | 0.1330 |
| Good-Neutral | 0.1496 |
| Bad-Neutral | 0.1571 |
| Good-Contradiction | 0.1313 |
| Bad-Contradiction | 0.1434 |
| Split-Label | T4 |
|---|---|
| Good-Entailment | 0.0100 |
| Bad-Entailment | 0.0021 |
| Good-Neutral | 0.0084 |
| Bad-Neutral | 0.0022 |
| Good-Contradiction | 0.0197 |
| Bad-Contradiction | 0.0020 |
| Granularity/Split | Good | Bad |
|---|---|---|
| Sentences | 15.3475 | 11.6614 |
| Words | 0.9313 | 0.6596 |
| Adjectives | 1.2190 | 0.9185 |
| Adverbs | 1.5708 | 1.1850 |
| Verbs | 0.9667 | 0.7001 |
| Nouns | 1.0623 | 0.7358 |
| Bigrams | 0.3646 | 0.4893 |
| Trigrams | 0.1860 | 0.2760 |
| Split-Label | DQI C6 |
|---|---|
| Good | 556.6914 |
| Bad | 320.2893 |
| Split/Label | Entailment | Neutral | Contradiction |
|---|---|---|---|
| Good | 6150 | 6098 | 6082 |
| Bad | 700 | 60 | 240 |
| Split-Label | T1 | T2 |
|---|---|---|
| Good-Entailment | 2.69E+04 | 0.8133 |
| Bad-Entailment | 6.47E+03 | 0.9542 |
| Good-Neutral | 2.78E+04 | 0.8465 |
| Bad-Neutral | 4.76E+16 | 1.0000 |
| Good-Contradiction | 4.62E+04 | 0.9378 |
| Bad-Contradiction | 1.05E+17 | 1.0000 |
| Split-Label | T1 | T2 |
|---|---|---|
| Good-Entailment | 5.67E+02 | 0.970607701 |
| Bad-Entailment | 9.48E+02 | 0.957116548 |
| Good-Neutral | 8.70E+02 | 0.488048002 |
| Bad-Neutral | 6.74E+02 | 0.794573643 |
| Good-Contradiction | 9.40E+02 | 0.965482191 |
| Bad-Contradiction | 7.01E+02 | 0.885763001 |
| Split-Label | T1 | T2 |
|---|---|---|
| Good-Entailment | 1.16E+02 | 0.7834 |
| Bad-Entailment | 2.83E+02 | 1.0000 |
| Good-Neutral | 2.86E+02 | 1.0000 |
| Bad-Neutral | 1.92E+02 | 0.8771 |
| Good-Contradiction | 3.47E+02 | 1.0000 |
| Bad-Contradiction | 2.67E+02 | 1.0000 |
| Split-Label | T1 | T2 |
|---|---|---|
| Good-Entailment | 2.56E+01 | 0.4803 |
| Bad-Entailment | 5.20E+01 | 0.6531 |
| Good-Neutral | 3.61E+01 | 0.6091 |
| Bad-Neutral | 7.15E+01 | 0.6521 |
| Good-Contradiction | 3.43E+01 | 0.5017 |
| Bad-Contradiction | 5.19E+01 | 0.3939 |
| Split-Label | T1 | T2 |
|---|---|---|
| Good-Entailment | 1.71E+02 | 0.7901 |
| Bad-Entailment | 1.61E+02 | 0.6620 |
| Good-Neutral | 1.43E+02 | 0.5911 |
| Bad-Neutral | 1.69E+02 | 0.3061 |
| Good-Contradiction | 1.79E+02 | 0.7271 |
| Bad-Contradiction | 1.30E+02 | 0.5636 |
| Split-Label | T1 | T2 |
|---|---|---|
| Good-Entailment | 2.61E+02 | 0.8994 |
| Bad-Entailment | 4.52E+02 | 0.9447 |
| Good-Neutral | 4.68E+02 | 1.0000 |
| Bad-Neutral | 2.61E+02 | 0.7235 |
| Good-Contradiction | 4.84E+02 | 1.0000 |
| Bad-Contradiction | 2.80E+02 | 0.9287 |
| Split-Label | T1 | T2 |
|---|---|---|
| Good-Entailment | 3.38E+03 | 0.9361 |
| Bad-Entailment | 4.83E+03 | 1.0000 |
| Good-Neutral | 9.21E+03 | 1.0000 |
| Bad-Neutral | 1.91E+03 | 1.0000 |
| Good-Contradiction | 1.04E+04 | 1.0000 |
| Bad-Contradiction | 2.97E+03 | 1.0000 |
| Split-Label | T1 | T2 |
|---|---|---|
| Good-Entailment | 9.27E+03 | 0.9573 |
| Bad-Entailment | 2.93E+04 | 1.0000 |
| Good-Neutral | 4.54E+04 | 0.9913 |
| Bad-Neutral | 4.61E+03 | 0.8822 |
| Good-Contradiction | 1.04E+05 | 1.0000 |
| Bad-Contradiction | 6.96E+03 | 0.9937 |
| Split-Repetition | 1 | 2 | 3 |
|---|---|---|---|
| Good-Entailment | 0.9512 | 0.0484 | 0.0003 |
| Bad-Entailment | 0.9884 | 0.0115 | 0.0000 |
| Good-Neutral | 0.9612 | 0.0363 | 0.0024 |
| Bad-Neutral | 1.0000 | 0.0000 | 0.0000 |
| Good-Contradiction | 0.9844 | 0.0150 | 0.0005 |
| Bad-Contradiction | 1.0000 | 0.0000 | 0.0000 |
| Split-Label | T3 |
|---|---|
| Good-Entailment | 0.0647 |
| Bad-Entailment | 0.0860 |
| Good-Neutral | 0.0926 |
| Bad-Neutral | 0.0590 |
| Good-Contradiction | 0.1000 |
| Bad-Contradiction | 0.2290 |
| Split-Label | T4 |
|---|---|
| Good-Entailment | 0.0803 |
| Bad-Entailment | 0.0202 |
| Good-Neutral | 0.0041 |
| Bad-Neutral | 0.0484 |
| Good-Contradiction | 0.2018 |
| Bad-Contradiction | 0.0326 |
| Split-Label | DQI C6 |
|---|---|
| Good | 2.74E+05 |
| Bad | 1.53E+17 |
| Granularity/Split | Good | Bad |
|---|---|---|
| Sentences | 14.6049 | 72.1687 |
| Words | 1.2571 | 0.8533 |
| Adjectives | 1.4557 | 1.7959 |
| Adverbs | 0.7319 | 0.9429 |
| Verbs | 1.0382 | 1.0345 |
| Nouns | 1.7755 | 1.5836 |
| Bigrams | 0.4008 | 0.3561 |
| Trigrams | 0.6547 | 0.9724 |
| Split/Label | True | False |
|---|---|---|
| Good | 10946 | 10770 |
| Bad | 914 | 1086 |
| Split-Label | T1 | T2 |
|---|---|---|
| Good-True | 4431.2159 | 0.0007 |
| Bad-True | 1921.2260 | 0.5448 |
| Good-False | 4412.2037 | 0.0014 |
| Bad-False | 1853.6963 | 0.5009 |
| Split-Label | T1 | T2 |
|---|---|---|
| Good-True | 263.6776 | 1.0000 |
| Bad-True | 954.5225 | 1.0000 |
| Good-False | 259.3381 | 0.3105 |
| Bad-False | 776.2031 | 1.0000 |
| Split-Label | T1 | T2 |
|---|---|---|
| Good-True | 75.3820 | 1.0000 |
| Bad-True | 244.8719 | 1.0000 |
| Good-False | 70.8210 | 1.0000 |
| Bad-False | 222.5754 | 1.0000 |
| Split-Label | T1 | T2 |
|---|---|---|
| Good-True | 6.31677 | 0.6666 |
| Bad-True | 27.6740 | 0.6494 |
| Good-False | 6.4805 | 0.6632 |
| Bad-False | 24.6482 | 0.6878 |
| Split-Label | T1 | T2 |
|---|---|---|
| Good-True | 58.2850 | 0.8789 |
| Bad-True | 219.8726 | 0.8851 |
| Good-False | 59.0344 | 0.9066 |
| Bad-False | 208.3846 | 0.9113 |
| Split-Label | T1 | T2 |
|---|---|---|
| Good-True | 110.8118 | 1.0000 |
| Bad-True | 415.9473 | 1.0000 |
| Good-False | 109.7139 | 1.0000 |
| Bad-False | 307.1137 | 1.0000 |
| Split-Label | T1 | T2 |
|---|---|---|
| Good-True | 2923.9305 | 0.9768 |
| Bad-True | 5800.9793 | 0.9762 |
| Good-False | 2834.7978 | 0.9758 |
| Bad-False | 5157.4516 | 0.9749 |
| Split-Label | T1 | T2 |
|---|---|---|
| Good-True | 35363.3144 | 1.0000 |
| Bad-True | 49074.7258 | 1.0000 |
| Good-False | 34076.1381 | 1.0000 |
| Bad-False | 40854.1931 | 1.0000 |
| Split-Label | T3 |
|---|---|
| Good-True | 0.0085 |
| Bad-True | 0.00852 |
| Good-False | 0.0079 |
| Bad-False | 0.0078 |
| Split-Label | T4 |
|---|---|
| Good-True | 0.0104 |
| Bad-True | 0.0106 |
| Good-False | 0.1165 |
| Bad-False | 0.0954 |
| Granularity/Split | Good | Bad |
|---|---|---|
| Sentences | 20.5287 | 9.6533 |
| Words | 0.0711 | 0.0682 |
| Adjectives | 0.6497 | 1.1487 |
| Adverbs | 0.4012 | 0.6832 |
| Verbs | 0.4918 | 0.8153 |
| Nouns | 0.5183 | 0.9957 |
| Bigrams | 0.1262 | 0.05600 |
| Trigrams | 0.1366 | 0.09422 |
| Split-Label | DQI C6 |
|---|---|
| Good | 75918.2760 |
| Bad | 105949.3404 |
| Split/Label | True | False |
|---|---|---|
| Good | 2568 | 2568 |
| Bad | 800 | 800 |
| Split-Label | T1 | T2 |
|---|---|---|
| Good-True | 1.30E+05 | 0.9984 |
| Bad-True | 5.06E+16 | 1.0000 |
| Good-False | 1.30E+05 | 0.9984 |
| Bad-False | 5.06E+16 | 1.0000 |
| Split-Label | T1 | T2 |
|---|---|---|
| Good-True | 5.47E+05 | 0.9792 |
| Bad-True | 5.22E+05 | 0.8618 |
| Good-False | 5.47E+05 | 0.5316 |
| Bad-False | 4.96E+05 | 0.8537 |
| Split-Label | T1 | T2 |
|---|---|---|
| Good-True | 129.1883 | 0.7800 |
| Bad-True | 133.5904 | 0.7711 |
| Good-False | 121.0435 | 0.7459 |
| Bad-False | 128.3632 | 0.8014 |
| Split-Label | T1 | T2 |
|---|---|---|
| Good-True | 41.1600 | 0.5959 |
| Bad-True | 49.9482 | 0.5368 |
| Good-False | 36.9653 | 0.6145 |
| Bad-False | 54.7544 | 0.6194 |
| Split-Label | T1 | T2 |
|---|---|---|
| Good-True | 103.8261 | 0.5285 |
| Bad-True | 115.6968 | 0.5828 |
| Good-False | 112.3307 | 0.5946 |
| Bad-False | 113.4481 | 0.5155 |
| Split-Label | T1 | T2 |
|---|---|---|
| Good-True | 551.3272 | 0.8898 |
| Bad-True | 458.9138 | 0.8862 |
| Good-False | 520.3204 | 0.9047 |
| Bad-False | 462.2876 | 0.9252 |
| Split-Label | T1 | T2 |
|---|---|---|
| Good-True7139.05776 | 1.0000 | |
| Bad-True5158.2473 | 1.0000 | |
| Good-False6941.1989 | 1.0000 | |
| Bad-False5006.1656 | 1.0000 |
| Split-Label | T1 | T2 |
|---|---|---|
| Good-True54497.5504 | 1.0000 | |
| Bad-True33876.9502 | 1.0000 | |
| Good-False50906.0915 | 1.0000 | |
| Bad-False33618.6103 | 1.0000 |
| Split-Label | T3 |
|---|---|
| Good-True | 0.0085 |
| Bad-True | 0.0079 |
| Good-False | 0.0085 |
| Bad-False | 0.0078 |
| Split-Label | T4 |
|---|---|
| Good-True | 0.0104 |
| Bad-True | 0.1165 |
| Good-False | 0.0106 |
| Bad-False | 0.0954 |
| Granularity/Split | Good | Bad |
|---|---|---|
| Sentences | 382.2842 | 2262.7417 |
| Words | 1.0447 | 1.0192 |
| Adjectives | 3.9910 | 5.0527 |
| Adverbs | 1.7714 | 3.1284 |
| Verbs | 2.2377 | 3.5188 |
| Nouns | 5.8841 | 7.3696 |
| Bigrams | 1.6522 | 1.9489 |
| Trigrams | 4.9660 | 6.8154 |
| Split-Label | DQI C6 |
|---|---|
| Good | 1.01E+17 |
| Bad | 1.01E+17 |
Inter-Split STS:
| Split | SSMIL=0.2 | SSMIL=0.3 | SSMIL=0.4 |
|---|---|---|---|
| Good | 0.0031 | 0.0042 | 0.0063 |
| Bad | 0.0029 | 0.0040 | 0.0057 |
| Split | SSMIL=0.2 | SSMIL=0.3 | SSMIL=0.4 |
|---|---|---|---|
| Good | 0.0004 | 0.0005 | 0.0002 |
| Bad | 0.0009 | 0.0011 | 0.0005 |
![[Uncaptioned image]](/html/2008.03964/assets/Intuitions4.png)