A Survey on Device Behavior Fingerprinting: Data Sources, Techniques, Application Scenarios, and Datasets
Abstract
In the current network-based computing world, where the number of interconnected devices grows exponentially, their diversity, malfunctions, and cybersecurity threats are increasing at the same rate. To guarantee the correct functioning and performance of novel environments such as Smart Cities, Industry 4.0, or crowdsensing, it is crucial to identify the capabilities of their devices (e.g., sensors, actuators) and detect potential misbehavior that may arise due to cyberattacks, system faults, or misconfigurations. With this goal in mind, a promising research field emerged focusing on creating and managing fingerprints that model the behavior of both the device actions and its components. The article at hand studies the recent growth of the device behavior fingerprinting field in terms of application scenarios, behavioral sources, and processing and evaluation techniques. First, it performs a comprehensive review of the device types, behavioral data, and processing and evaluation techniques used by the most recent and representative research works dealing with two major scenarios: device identification and device misbehavior detection. After that, each work is deeply analyzed and compared, emphasizing its characteristics, advantages, and limitations. This article also provides researchers with a review of the most relevant characteristics of existing datasets as most of the novel processing techniques are based on Machine Learning and Deep Learning. Finally, it studies the evolution of these two scenarios in recent years, providing lessons learned, current trends, and future research challenges to guide new solutions in the area.
Index Terms:
Device Behavior Fingerprinting, Device Identification, Cyberattack Detection, Behavioral Data, Processing and Evaluation Techniques, Device Behavior Datasets.I Introduction
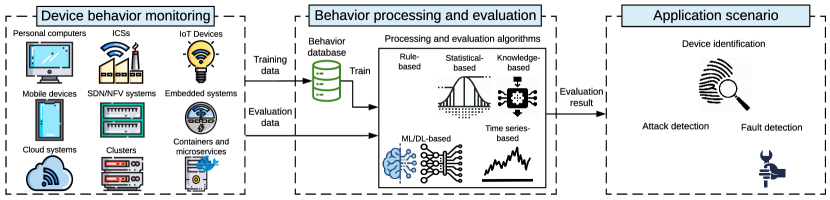
Previsions for 2025 estimate nearly 64 billion IoT devices connected to each other into diverse cutting-edge environments such as Smart Cities, Industry 4.0, or crowdsensing (e.g., Flightradar24, OpenSky, ElectroSense), among others [1]. These environments have their own particularities in terms of devices, data, communications, and purposes, which increase the complexity of achieving one of their common challenges: to optimize the performance of devices and provide accurate services. To meet this challenge, the advancement of communication networks and computing paradigms has influenced that behavioral data science evolved from studying theoretical and empirical issues related to human behaviors [2] –its initial scope– to conquer the cyberworld and offer a promising alternative to model device behaviors [3]. Nowadays, a thriving research field within behavior data science focuses on creating device behavior patterns (fingerprints) able to optimize their performance and detect potential issues in the early stages [4, 5]. In this context, this article studies the recent growth of the device behavior research field in terms of application scenarios, behavioral sources, and processing and evaluation techniques. Figure 1 shows an overview of the typical life cycle implemented by the literature, where different devices, techniques, and application scenarios are considered.
The first step to build a device fingerprint is to identify the application scenario where it will be needed. By keeping in mind the goal of optimizing devices and systems performance, the literature has recognized two critical application scenarios. The first one consists in identifying devices with different granularity levels –to differentiate them and fully exploit their capabilities [6]– while the second focuses on detecting cyberattacks [7], malfunction [8], or misbehavior [9] –to mitigate them. The nature of each scenario influences the selection of behavioral sources, data, and techniques employed to create fingerprints since the detection of misbehavior produced by a given cyberattack is different from identifying several IoT devices of the same family. Even in the same application scenario, the behavioral data might be different as well; this is the case of some cyberattacks affecting network communications [10], while others impact the CPU usage [11].
In both application scenarios, the literature contains an extensive number of works where device fingerprinting has been applied [12, 13, 4, 14, 15, 3, 16]. On the one hand and in terms of device identification, behavioral data science has dramatically improved the limitations of traditional solutions, mainly focused on using names, identifiers, labels, or tags to identify devices [17]. The main limitation of these approaches is that they can be modified or even duplicated in an environment where the number of devices grows exponentially. Another relevant drawback appears when device identification is performed at different granularity levels, requiring multiple labels and increasing management complexity. Nowadays, the literature categorizes the following identification granularity levels: type, with the main goal of creating fingerprints able to detect different types of devices [6]; model, focused on identifying different models of devices based on common hardware and software [18]; and individual, probably the most challenging level because it tries to identify identical physical devices according to minor differences occurred during manufacturing processes [14].
On the other hand and with the goal of detecting misbehavior or malfunction caused by cybersecurity issues, novel and sophisticated cyberattacks are influencing the replacement of traditional cybersecurity techniques. Existing mechanisms based on signatures are no longer effective against unseen, encrypted, or large-scale cyberattacks, and device fingerprinting has been identified as one of the most promising solutions to tackle this challenge [19]. A relevant number of works found in the literature rely on creating “normal” behavioral fingerprints to spot changes caused by some previous issues [7, 15, 20]. In this case, fingerprint evaluation is usually tackled from an anomaly detection perspective [7, 21].
In this context, the article at hand performs a comprehensive analysis of the main characteristics –devices, behavioral sources, data, and techniques– considered by the most representative and recent works of device identification and malfunctioning detection scenarios. Besides, it studies how characteristics of device identification, and misbehavior and malfunction detection scenarios are evolving since last years.
Once having the fingerprints, there is another exciting research area focused on applying the most suitable techniques to process and evaluate them. Statistical approaches have been dominating the field for the last decades. However, the incursion of Artificial Intelligence (AI), and more concretely Machine and Deep Learning (ML and DL) as the dominating trend, shifted the field and generated an open discussion concerning the most suitable methods per scenario. This manuscript seeks to help readers understand the trend concerning behavior processing and evaluation techniques, as well as the most appropriate techniques for each application scenario.
Influenced by the rise of AI techniques, there is also a crescent necessity of exhaustive datasets with which algorithms can train models able to learn and infer valuable information aligned with the target scenarios. Datasets are also critical to have standard benchmarks enabling fair comparisons of existing techniques and solutions. In this direction, this article also pretends to support researchers working on the device behavior research field with a review of the most relevant characteristics of existing datasets.
| Work | Year | Device Types / Area | Device Identification | Intrusion Detection | Malfunction Detection | Dataset review | Focus and solution categorization |
| [22] | 2015 | Wireless devices | ✓ | ✗ | ✗ | ✗ |
Survey on device fingerprinting in wireless networks.
Authors differentiate between white list-based and unsupervised algorithms. |
| [23] | 2017 | Mobile phones | ✓ | ✗ | ✗ | ✗ |
Survey on mobile device identification based on physical components.
Fingerprinting techniques are classified in two different categories, emitted signal-based and electronic component-based. |
| [19] | 2017 | Cloud environments | ✗ | ✓ | ✗ | ✗ |
Survey on IDSs applications focused on cloud computing environments.
Intrusion detection techniques are divided into misuse detection (rule-based) and anomaly detection (behavior-based). |
| [24] | 2018 | Any, focus on embedded devices | ✗ | ✓ | ✗ | ✓ |
Survey on IDSs deployed in hosts and based on system calls.
IDSs solutions are divided into anomaly and detection-based and misuse detection-based. |
| [25] | 2018 | IoT Environments | ✗ | ✓ | ✗ | ✗ |
Survey on IDSs focused on IoT-based smart environments.
IDS types are divided into anomaly, specification and misuse-based. |
| [26] | 2019 | Any | ✗ | ✓ | ✗ | ✓ |
IDS survey, groups the solutions in signature-based and anomaly-based.
Data sources divided into network and system logs and audits. |
| This work | 2020 | Any, focus on IoT | ✓ | ✓ | ✓ | ✓ | General survey on device behavior fingerprinting, its application scenarios, processing techniques and public datasets. |
II Motivation and Contributions
Device behavior fingerprinting is an encouraging research field that has inspired the publication of several survey articles for the last years. In terms of device identification, in 2016, Xu et al. [22] reviewed unique device fingerprinting in wireless networks. Moreover, Baldini and Steri [23] published in 2017 a review on mobile phone identification based on its hardware components. Regarding the usage of device fingerprint for cybersecurity purposes, the surveys related to this study are mainly focused on Intrusion Detection Systems (IDS). In 2018, Elrawy et al. [25] published a study focused on IDS and IoT-based smart environments. Similarly, Khraisat et al. [26], in 2019, published another review on general IDS-related solutions and public datasets, mostly containing network data. In [19], Mishra et al. published a survey, in 2017, where IDS analysis is addressed with a focus on cloud environments. This work explicitly considers system behavior analysis, one of the main sources to ensure a cloud system. Finally, in 2018, Liu et al. [24] analyzed existing solutions and datasets covering attack detection based on system calls, with a special focus on embedded devices.
Despite the contributions of the previous works, as illustrated in TABLE I, none of them addresses device identification and misbehavior detection in the same study. Besides, no previous survey contemplates device behavior fingerprinting for component malfunctioning detection. In addition, there is no recent work reviewing from a broad and exhaustive perspective datasets designed both for device identification and for intrusion or malfunction detection. Moreover, other surveys in domains such as digital forensics [27], threat hunting, and threat intelligence [28], relying on device identification or attack and fault detection as a basis, also considered behavior fingerprinting as an issue or challenge to cover, motivating the importance of this work. In this context, the literature has some research questions that need to be solved. As the main relevant, we highlight:
-
•
Q1. Which scenarios, device types, and sources are present in behavior-based solutions? Depending on the application scenario –device identification or malfunction detection– and the problem to be solved, the devices and behavioral sources vary. However, in the literature, there is no solution detailing these elements and how they are combined.
-
•
Q2. What and how behavior processing and evaluation tasks are used in each scenario? Device behavior can be processed and evaluated following diverse approaches. However, the literature has not studied these approaches from a broad perspective to have a complete view in the area.
-
•
Q3. What characteristics do the most recent and representative solutions of each application scenario have? It is required to analyze how device types and behavioral sources are utilized to solve the problems motivated by each application scenario. Furthermore, it is also needed to detect the limitations of solutions related to both scenarios.
-
•
Q4. Which behavior datasets are available and which are their characteristics? There is no study detailing the public datasets aligned with device behavior from a broad perspective, analyzing their characteristics, and defining in which application scenarios they can be utilized.
-
•
Q5. How have application scenarios evolved for the last years? To establish the guidelines for future research, it is critical to describe how device behavior analysis is evolving in the last years and which are the current trends and open challenges of the area.
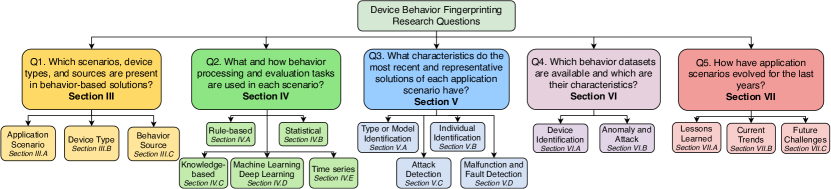
These research questions are closely related to each other and draw a complete picture of the existing challenges in device behavior analysis for identification and attack and malfunctioning detection. Q1 and Q2 deal with devices, data sources, and techniques used for device fingerprinting. Q3 and Q4 refer to current publications and datasets of device behavior –the key aspects of this survey and core sections of the document. While Q5 focuses on the consequences of the research done so far and its future. Figure 2 shows where and how the previous questions are addressed in the article at hand, acting as table of contents.
To answer the previous questions and provide readers with an up-to-date vision of device behavior fingerprinting, the main contributions of this manuscript are:
-
•
An analysis of the behavior data sources and device types utilized in the literature, paying attention to the application scenarios in which each source is contemplated (answering Q1 in Section III).
-
•
A description and comparison of the main techniques and algorithms utilized to model and evaluate device behavior based on the morphology of the available data (answering Q2 in Section IV).
-
•
A comprehensive review and comparison of the characteristics, advantages, and limitations of the most relevant proposals that consider device behavior to 1) identify device models or types, 2) identify individual devices, 3) detect cyberattacks, and 4) detect device/system functioning faults (answering Q3 in Section V).
-
•
A description of the principal public datasets containing device activity and behavior. This description is divided into datasets designed for device identification and for attack or behavior anomaly detection (answering Q4 in Section VI).
-
•
A set of lessons learned, current trends, and future challenges drawn from the device behavior works and datasets reviewed (answering Q5 in Section VII).
The remainder of this article is organized as follows. Section III gives an analysis of device types, application scenarios, and behavior sources. Section IV reviews the main approaches and algorithms utilized to process behavioral data. Section V describes and compares the main solutions found in the state-of-the-art. Section VI examines the main public datasets containing device activities. Section VII draws a set of lessons learned, current trends, and future challenges in the research area. Finally, Section VIII provides an insight into the conclusions extracted from the present work.
III Behavior Characterization Analysis
With the goal of answering Q1 (Which scenarios, device types, and sources are present in behavior-based solutions?), this section studies the most used and promising scenarios where device behavior has been considered: device identification and misbehavior detection. After that, and aligned with these scenarios, it analyzes the main device types from which behavioral data is obtained, and the most common behavior dimensions and characteristics considered by device fingerprint solutions existing in the literature.
III-A Application Scenario
According to the heterogeneous capabilities of device behavior fingerprinting, the literature has applied it in a wide variety of scenarios with different objectives. After reviewing the state-of-the-art, we highlight the following two categories as the most used and well-known: Device identification and Misbehavior detection.
III-A1 Device identification
It uses the behavior of devices to identify them and their characteristics. This task can be performed from the following two perspectives.
Device type or model identification. Device type identification [6, 12] aims to recognize the device category such as general computer, IoT sensor, or embedded device, among others. In contrast, device model identification [18, 29] aims to differentiate between devices of the same type but different hardware and software configurations.
Individual device identification [14, 30] distinguishes between devices with identical hardware and software capabilities. This approach requires the lower level data, usually related to hardware variations during fabrication. Although device activity can also be employed to model user behavior and perform user’s identification and authentication [31, 32, 33], user inputs and activity monitoring fall out of the scope of this study, which is focused only on device behavior analysis, without human interaction.
III-A2 Misbehavior detection
It seeks to identify anomalous situations based on changes in normal device behaviors. The anomalous situations are very varied; therefore, the solutions trying to recognize these situations are also heterogeneous. The next two main families of behavior anomaly detection solutions can be found in the literature.
Attack detection [7, 34, 20, 35] intends to detect anomalies, created by cyber threats, according to the previously known normal device behavior. These solutions are commonly deployed as an IDS based on device behavior, being either Network-based (NIDS) or Host-based (HIDS). The cyberattacks detected using behavior are very diverse and depend on the monitored dimensions. These can range from impersonation and spoofing to malware execution.
Malfunction and fault detection [8, 36, 16] tries to identify devices that are not functioning correctly because some component or service is failing. The malfunctioning could be caused by faults such as damaged hardware, a service or hardware overload, or network issues. Solutions addressing this approach assume that the fault will somehow affect the general device behavior.
III-B Device Type
Device activities, properties, and interactions can be monitored in an exhaustive range of heterogeneous devices and systems. Then, behavioral patterns can be built with diverse goals by almost any device. However, the data collection process is different depending on factors such as device hardware and software. At this point, it is important to describe the principal device and system categories used in the previous application scenarios.
Personal computers. This category includes computers commonly found in homes and workplaces [37]. We can differentiate two main kinds of personal computers, desktop devices and laptops, differentiated by power supply.
Mobile devices. Smartphones and tablets are grouped in this category. Mobile devices are mainly constrained by battery.
Embedded systems. These low-cost systems are designed and built to perform very specific tasks and their functionality is usually limited by processing and energy constraints [38].
Industrial Control Systems (ICS). This family groups devices and systems that supervise and control critical services of industrial processes [39], involving sensors and actuators. ICSs are usually deployed as supervisory control and data acquisition (SCADA) systems [40].
IoT devices. Any system with processing power and connected to the Internet can be considered as an IoT device. Typically, the IoT device concept is associated with embedded systems with connectivity capabilities such as sensors and smart-home objects. However, it covers a wider variety of devices [38], including drones, or wearable devices, among others.
Cloud systems. They provide the following three principal service models, in which resources can be accessed remotely and through network [41]: Infrastructure as a Service (IaaS), Platform as a Service (PaaS), and Software as a Service (SaaS). In the last years, Cloud paradigm has evolved towards Fog [42] and Edge Computing [43], where cloud systems are deployed closer to end-user devices, reducing latency and speeding up computations.
SDN/NFV systems. SDN and NFV are concepts that usually appear together, although they can also be utilized separately [44]. The Software Defined Networking (SDN) paradigm [45] is a network architecture where network control is decoupled from the data plane, having a centralized controller managing the traffic flows and enabling network programmability and abstraction. Network Function Virtualization (NFV) paradigm [46] is a network architecture where network devices are vitalized using software implementations.
Containers and microservices. Containers are software packages that include an application code and all its dependencies, allowing a lightweight deployment. Microservices [47] are applications with a single fixed function, commonly deployed as containers. Several microservices can be combined to build more complex applications distributedly.
Clusters. A cluster is a set of computers, typically Linux devices [48], connected closely to combine their resources and work as a single system. Then, the cluster behavior will be defined by the behavior of its components.
III-C Behavior Source
Once the most representative application scenarios and devices have been explained, it is necessary to describe the behavior sources found in the literature, their pros and cons, and the solutions using each source. This description has been structured by following the next two main categories considered in the literature: externally-collected behavior sources and in-device behavior sources. Finally, the key aspects of the behavior data considered by each solution are compared.
III-C1 Externally-collected behavior sources
In this category, an external device is used to monitor the device behavior. Concretely, network communications and emitted electromagnetic signals are the main externally-collected sources used to model devices behavior. In the case of network-based data, data is usually collected by a proxy or a gateway, while electromagnetic signal-based data is collected by a sensor through an antenna.
Network communications. From the network communications perspective, a diverse set of behavioral features can be extracted by monitoring network packets. They depend on the granularity of the traffic inspection and the TCP/IP layers gathered. The main advantage of this dimension is its universality, as almost any device has network interfaces, and the possibility of monitoring many devices from a single gateway. As drawbacks, this dimension can suffer impersonation attacks and encryption makes data analysis more difficult. In this context, some solutions only focus on the amount of data sent/received and the IPs to which the device is connected [9, 49]. Other solutions also perform packet header and flow statistics analysis [12, 50]. And finally, other solutions also include data related to transport or application layer protocols or payload data [51, 52]. Generally, payload data is protected using encryption methods, so the majority of solutions utilize header and flow-based data. However, some works focus on encrypted communication analysis for fingerprinting [53, 54]. From the application usage point of view, this category is utilized for device model identification [4, 50], device type identification [13, 6], [55], attack detection [56, 15, 7] and fault detection [57].
Clock Skew. Based on crystal oscillator imperfections that occurred during the manufacturing process, internal clock counters of different devices have slight variations. In this sense, it is possible to utilize this characteristic to differentiate devices based on their hardware behavior. The main advantage of this source is that it can be collected from outside the device. As drawback, clock skew distribution concentrates around 0, so this source cannot be applied as a unique source in large device deployments [58]. Clock skew can be calculated by observing how internal device timestamps vary in time, mainly using TCP and ICMP timestamps [59] and Wi-Fi beacon timestamps [60, 61], so it can be seen as a special category of network-based data. From the application perspective, clock skew has been utilized for individual device identification [60, 61, 62, 63].
Electromagnetic signals. This category relies on the behavior of electromagnetic signals emitted by each device. Its main advantage is the difficulty of tampering it, as it depends on emitted signal properties. In terms of disadvantages, we highlight that the data gathering process must be physically close to the monitored device, since electromagnetic signals lose intensity as the distance to the transmitter increases. Radio signals are used in the literature to distinguish drone models [64, 65, 66, 67] and to identify physical devices [14, 68]. However, although radio signals have been utilized to detect anomalies in the radio spectrum [69], no solution specifically focused on device behavior anomaly detection using radio signals has been found. Following a similar approach, other solutions utilize the electromagnetic signals radiated from the device components to identify physical devices [70].
TABLE II compares the main characteristics of externally-collected data. As observed, features related to network communications are used both for device identification and misbehavior detection, as this source is very heterogeneous. In contrast, clock skew and electromagnetic-based features are only applied in device identification, as they are lower-level sources related to device component characteristics.
| Feature | Behavior Source | Device Type | Application Scenario | |
| DI | MD | |||
| Packet headers statistics | Network Communications | Computers, IoT devices, ICS | [13] [12] [18] [29] [71] [53] | [5] [15] [56] [72] [9] [73] |
| Network flows statistics | Network Communications | Computers, IoT devices, ICS | [74] [6] [4] [75] [76] | [7] [10] [34] [77] [78] [57] [79] [80] [81] [82] [83] [84] |
| Packet payload data and statistics | Network Communications | Computers, IoT devices, SDN, ICS | [52] [50] [51] [85] | [86] [87] [88] [54] [89] |
| Clock drift in time | Clock Skew | Computers, mobile and IoT devices, ICSs | [60][61] [62][63] | ✗ |
| Raw IQ samples | Electromagnetic signals | Computers, mobile and IoT devices, ICSs | [64][65] [14] [68] [66] [67] | ✗ |
| Signal frequency | Electromagnetic signals | Computers, mobile and IoT devices, ICSs | [70] | ✗ |
III-C2 In-device behavior sources
In this category, behavioral data monitoring is performed on the target devices. Thus, lower-level data related to the device internal functioning can be collected. This approach has the advantage of not requiring a connection to an external monitoring device. In contrast, as a drawback, if the device suffers an anomaly, such as an attack, the monitoring solution may suffer it as well.
Hardware Events. Hardware Performance Counters (HPC) are special registers built into modern microprocessors that store hardware-related event counters. The main advantage of this category is the precision achieved to model the device operation from a low-level perspective. In contrast, the quantity and morphology of the HPCs depend on the device CPU model, which makes it difficult to build general solutions. In the literature, some solutions [90, 91, 92] utilize HPCs to model software behavior and detect abnormal operations. In addition, [91] also utilizes HPCs to identify and authenticate different devices.
System processors and oscillators. Some devices have hardware components that include a crystal oscillator. As in clock skew, the manufacturing imperfections of these components can be utilized to differentiate physical devices by comparing their counters drift in time. The main advantage of this source is its low-level, which enables to differentiate devices with the same software and hardware. However, the device should include hardware using oscillators, something unusual in resource-constrained devices. Moreover, manufacturing errors are usually small [58]. In the literature, two components used for this purpose are the Real Time Clock (RTC) and the Digital Signal Processor (DSP) [93]. In addition, the time it takes to execute a particular code or function can also be used to model system behavior. In this case, this data has been used to identify device models and the devices themselves [94].
Resource Usage. In this category, different device components usage and status are monitored. Commonly, the monitored components are CPU, memory, disk, and network. Various parameters can be extracted from each component, such as usage percentage or input/output statistics. In terms of advantages, this source is quite general and can be monitored in many devices and systems. As drawback, continuous resource usage monitoring consumes many resources. In the literature, this data is utilized to identify devices [30] and detect behavior anomalies caused by cyberattacks [21] or system malfunctioning [95, 36, 49].
Software and Processes. The software deployed in a device or system also has its particular behavior. Then, the conjunction of the isolated software behaviors can be utilized to model a global device behavior fingerprint. As advantage, software monitoring can accurately model normal device behavior. However, this source is affected by system updates and legitimate software modifications. Software can be modeled in several ways:
-
•
System calls and logs. They serve to monitor the interactions between the programs running on a device and its operating system. These interactions encompass process, file, and communication management operations. From the application usage point of view, system call sequences and logs have been used to characterize device behavior and detect anomalies [35, 96, 97, 98, 99, 100, 101].
-
•
Process properties. Device software behavior can be modeled by monitoring each process properties, such as name, status, or threads. This category also includes the resources utilized to execute a particular program or code. In the literature, this category is commonly monitored together with resource usage or system calls to detect anomalous behaviors [102].
- •
Device Sensors and Actuators. The data collected in this dimension is very diverse and depends on the device and scenario typology. The main advantage of this source is that it can also detect environment failures or attacks. As drawback, environment knowledge is required to analyze and understand the data from this dimension, as each device may have different sensors and actuators. From the application usage point of view, sensor and actuator measurements are utilized to detect anomalies [20, 8, 89, 104, 105] and model device types [4], while sensor hardware information is used to physically identify the devices [106].
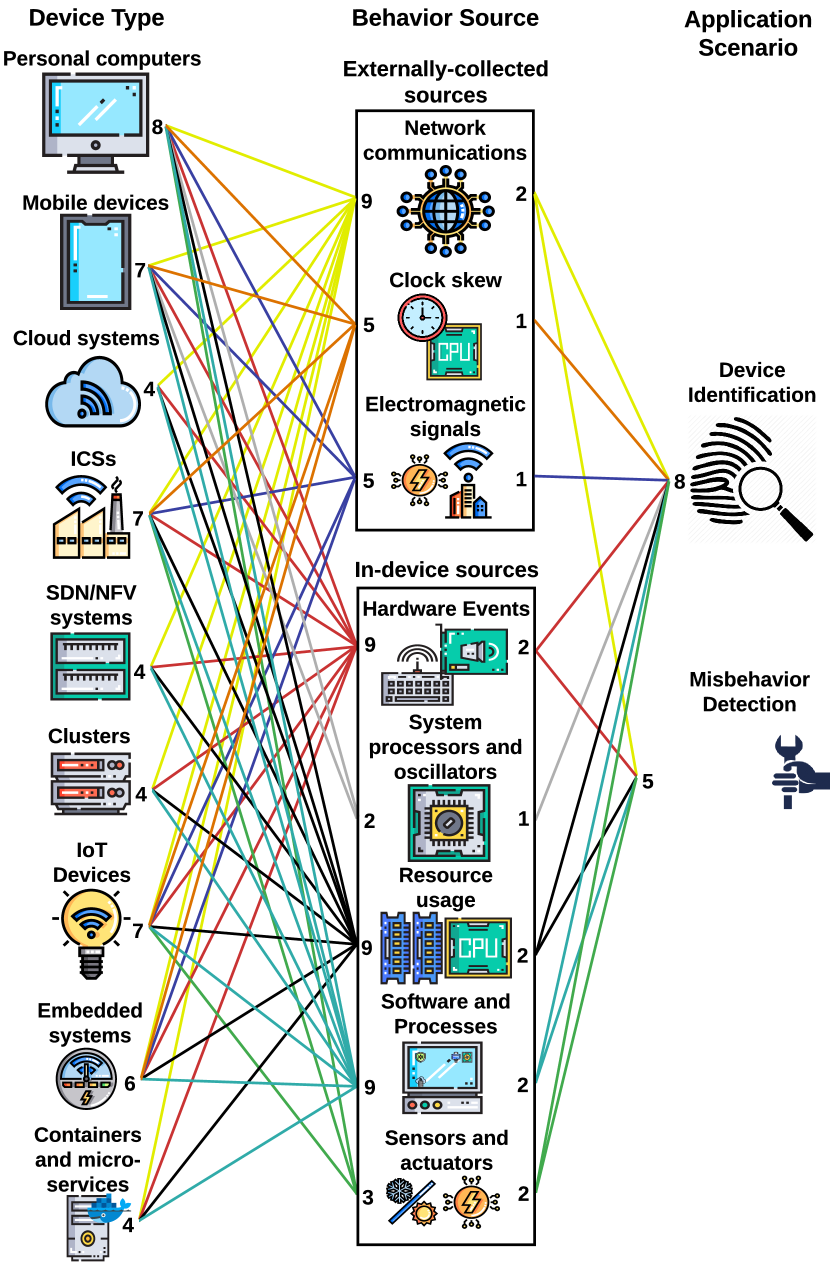
To conclude, on the one hand, TABLE III compares the main characteristics of data directly collected from the modeled device. It can be appreciated how HPCs, CPU percentage, system calls, software signatures, and sensor values are used both for device identification and misbehavior detection. Besides, low-level information related to the system processors and sensor hardware is only employed for device identification. Finally, features related to resource usage and process properties are only employed in misbehavior detection. On the other hand, Figure 3 shows the behavior sources considered by each device type, and in which application scenario these sources are utilized. The numbers indicate the total number of connections each element has. It can be appreciated that the most extended sources, based on their generality, are network communications, hardware events, resource usage, and software and processes.
| Feature | Behavior Source | Device Type | Application Scenario | |
| DI | MD | |||
| HPC | Hardware Events | Embedded systems, IoT devices | [91] | [90] [91] [92] |
| RTC drift | System processors and oscillators | Computers | [93] | ✗ |
| DSP performance | System processors and oscillators | Computers | [93] | ✗ |
| Code execution time | System processors and oscillators | Computers | [94] | ✗ |
| CPU usage percentage | Resource Usage | Computers, embedded devices, microservices, cloud, NFV, and cluster systems | [30] | [21] [36] [107] [11] [95] [49] [108] [109] [16] [110] |
| CPU activity | Resource Usage | Microservices, NFV, cloud, and cluster systems | ✗ | [36] [107] [95] [109] [3] |
| System storage usage | Resource Usage | Microservices, NFV, cloud, and cluster systems | ✗ | [36] [107] [95] [108] |
| System memory usage | Resource Usage | Microservices, NFV, cloud, and cluster systems | ✗ | [36] [107] [95] [49] [108] [109] [16] [110] [3] |
| I/O throughput per network interface | Resource Usage | Microservices, NFV, cloud, and cluster systems | ✗ | [21] [36] [95] [49] [108] [109] [110] |
| System calls and logs | Software and Processes | Computers, resource-constrained devices, cloud and NFV systems | [35] | [35][96] [97] [101] [98][100] [99] |
| Process properties | Software and Processes | Computers | ✗ | [102] [111] [3] |
| Software signatures | Software and Processes | IoT devices | [103] | [16] [103] |
| Sensor measurements values | Device Sensors and Actuators | ICS, IoT devices | [4] | [20][8][89] [104][105] |
| Sensor hardware properties | Device Sensors and Actuators | ICS | [106] | ✗ |
IV Behavior Processing and Evaluation Techniques
Once reviewed the behavioral data monitored per type of device and application scenario, the data needs to be processed to create a fingerprint. This section deals with Q2 (What and how behavior processing and evaluation tasks are used in each scenario?) by detailing the algorithms and techniques commonly used in the literature to create and evaluate fingerprinting profiles, highlighting their main advantages and drawbacks. The existing techniques are categorized in the following five groups: rule-based, statistical, knowledge-based, Machine Learning and Deep Learning, and time series approaches. The previous categories are not mutually exclusive and a particular solution can belong to several categories. Furthermore, the behavior processing can be centralized, in the own device or a server, or distributed using technologies such as blockchain [112], distributed [113] or federated learning [114], among others.
IV-A Rule-based
This is the most straightforward approach to create behavioral profiles. It is useful for devices with a well-known behavior and a reduced set of actions. In this approach, a set of rules defines how the system should behave, that is, its behavioral fingerprint. Rules can be defined statically, based on pre-defined actions, or dynamically, based on the historical actions performed by the device. Any deviation from these rules is considered a fault or anomaly. The main advantages of this approach are its speed and simplicity. As drawbacks, it requires previous knowledge about the device behavior, and it is not suitable for changing and complex scenarios. Rule-based evaluation is utilized for device type or model definition and anomaly detection.
For device behavior evaluation, a recent approach is the usage of Manufacturer Usage Descriptions (MUDs) standard [115] files, which define the normal device functioning and are commonly issued by vendors. This method is mainly utilized for IoT behavior fingerprint generation and evaluation [80, 10]. Another rule-based approach is to explicitly define the software that the device can execute [103] or thresholds for resource usage [116].
IV-B Statistical
In this approach, relatively basic statistical data processing techniques are utilized to extract inferences (properties) from data samples. This approach is usually considered in data pre-processing and anomaly detection. The main advantage of this approach is its simplicity and that these algorithms do not require large datasets. However, it does not handle well multi-dimensional data, and consistent evaluation decisions require previous knowledge in the area.
For pre-processing, it is common to infer features using statistical functions such as average, standard deviation, quartiles, maximum, or minimum, among others. Regarding evaluation, in some solutions [21], the interquartile range (IQR) is used as a statistical measure representing the presence of outliers and anomalies based on data variability (dispersion). In the same line, Euclidean Distance is used by some approaches [57, 89, 9] to determine anomaly values based on the distance between two data measurements. Finally, some works [60, 8] utilize Expectation Maximization algorithm for clustering and parameter estimation based on statistically-inferred latent variables.
IV-C Knowledge-based
This approach aims to represent knowledge extracted from received data and build a reasoning system capable of inferring new knowledge. Commonly, the knowledge is built based on a set of ontologies, and the decision-making process is based on if-then derivation rules. The main advantages of this approach are the explainability of the inferred solutions and that it can solve problems involving incomplete data. As drawbacks, this approach takes longer time, and it has reduced scalability, as the system could become too complex if large amounts of data are utilized.
Knowledge-based approaches are utilized mainly for behavioral anomaly detection, being the main ones look-ahead algorithms and finite state machines. Look-ahead algorithms are commonly combined or used to make decisions in more complicated approaches, such as state machines. Furthermore, these algorithms are also directly used to detect anomalies [35]. Finite state machines, such as Markov Models [117] and n-gram models [118], describe the sequential logic followed by a certain entity and predict its future status based on the previous ones. In the literature, they are widely applied for behavior anomaly detection [35, 16, 10, 92].
IV-D Machine Learning and Deep Learning
In recent years, and based on the increase of processing power and available data, Machine Learning (ML) [119] and Deep Learning (DL) [120] algorithms have gained enormous relevance in almost every industrial or research area, becoming the dominating trend for data processing and evaluation. The main advantages of ML/DL based approaches are their capacity to detect complex data patterns, handle multi-dimensional and multi-variate data, and adapt themselves to dynamic and heterogeneous scenarios using massive data. As disadvantages, the model decisions are usually hardly explainable, based on the black-box nature of the generated models. Besides, these algorithms, especially in DL, require large amounts of data to be trained, and the algorithm training can take much time and resources. Also, most algorithms require parameter tuning, which implies repeating the training process several times. Since ML and DL techniques are very diverse, they have been widely used for device behavior fingerprint generation and evaluation, both for device identification [4, 50, 13, 52, 76, 74, 14, 68, 70] and misbehavior detection [56, 15, 5, 72, 77, 78, 88, 100].
According to the morphology of the data they receive and the type of predictions they make, ML/DL algorithms applied in behavior analysis are distinguished into two main categories: Supervised Learning and Unsupervised Learning.
The goal of Supervised learning is to infer a model capable of predicting the output of data vectors based on training labeled data [119]. Supervised algorithms are mainly divided into classification and regression techniques.
-
•
Classification algorithms try, based on the training data, to predict the class to which unseen data vectors belong. Additionally, anomaly detection can be performed using classification algorithms by labeling the data as normal/anomaly. Common ML classification algorithms are Decision Tree (DT) [121], Random Forest (RF) [122], Logistic Regression (LR) [123], Naive Bayes (NB) [124] or Support Vector Machine (SVM) [125]. These algorithms are widely utilized for behavior evaluation in device identification [13, 6, 12, 4, 52, 75, 50, 29, 71, 51, 70] and behavioral anomaly recognition [97, 110, 77, 78, 72, 88, 79, 73, 83].
- •
In Unsupervised learning [119], data vectors are not labeled, so feature vectors only contain input data. This kind of algorithm is used to extract patterns by modeling probability densities on the given data. The three main applications of Unsupervised learning are dimensionality reduction, clustering, and anomaly detection.
-
•
Dimensionality Reduction algorithms aim to reduce the number of variables or features under consideration by obtaining a set of principal variables from the input data. In behavior-based solutions, Principal Component Analysis (PCA) [127] and t-Distributed Stochastic Neighbor Embedding (t-SNE) [128] are utilized to speed up computations and derive new features [5, 75, 10]. Moreover, dimensionality reduction is combined with statistical algorithms for anomaly evaluation [36, 57, 107, 109].
-
•
Clustering algorithms have the objective of grouping the input vectors into a different set of objects based on their similarities. In device behavior fingerprinting, k-means [129] and Density-based spatial clustering of applications with noise (DBSCAN) [130] are usually applied to infer device classes or types [6], [55], [51, 108, 3].
-
•
Anomaly Detection algorithms seek to identify rare items, events, or observations based on a set of unlabeled data points and the assumption that most of the training data is normal. From this approach, One-Class SVM (OC-SVM) [131] and Isolation Forest (IF) [132] are widely used in the literature [7, 34, 133].
From a DL perspective, Artificial Neural Networks (ANN) [120] are frequently used in the above approaches. However, a type of architecture cannot be related to a specific use due to neural networks flexibility, as layers, neurons, and their connections can be organized in many ways depending on the problem to be solved. The main types of networks applied in behavior processing are: Multi-Layer Perceptrons (MLP), utilized for device identification [29, 76] and anomaly type classification [79]; Autoencoders, applied for behavior anomaly detection [18] and dimensionality reduction purposes; Recurrent Neural Networks (RNN), such as Long Short-Term Memory networks (LSTM) and Gated Recurrent Unit networks (GRU), applied from a time series perspective for device identification [18, 14] and behavior anomaly recognition [15, 81, 100, 105, 20]; and Convolutional Neural Networks (CNN), utilized for physical device identification based on signal processing from a time series approach [14, 68].
The previous network topologies can be combined to perform more complex tasks. For example, some solutions [18] utilize LSTM layers to build an autoencoder, while other approaches [82] combine different neural networks to build Generative Adversarial Networks (GAN) [134].
| Approach | Simplicity | Expert knowledge required | Fast computation / Low resource | Large datasets required | Large training time | Multi-dimensional data | Decision explainability | Adaptability | Complex feature correlations |
| Rule-based | ✓ | ✓ | ✓ | ✗ | ✗ | ✗ | ✓ | Dynamic approaches | ✗ |
| Statistical | ✓ | ✓ | ✓ | ✗ | ✗ | ✗ | ✗ | ✗ | ✗ |
| Knowledge-based | Partial | ✗ | ✗ | ✗ | ✗ | ✗ | ✓ | ✗ | Partial |
| ML/DL-based | ✗ | ✗ | ✗ | Mainly DL | Mainly DL | ✓ | Partial | ✓ | ✓ |
| Time series | ✗ | ✗ | ✗ | ✓ | ✓ | ML/DL-based | ✗ | ML/DL-based | ML/DL-based |
IV-E Time Series
Time series analysis utilizes data measurements as a sequence of values where each measurement is related to the previous and the next ones. It includes a wide variety of algorithms and models, including the ones based on ML/DL or statistical algorithms. This approach is utilized both for device identification and anomaly detection, directly in the model generation or as data pre-processing. The main advantages of this approach are its improved performance over single-value processing approaches. However, it requires a large amount of data to detect the temporal patterns, and the processing is time-consuming.
Time series analysis methods are divided into two different types, frequency-based methods, which analyze data as a signal with a certain frequency, and time-based methods, which analyze data evolution with respect to time.
In terms of frequency-based methods, Fourier Transform (FT) [135], and derived functions, are applied as pre-processing to obtain the frequencies that form the value signal [91, 6]. From time-based methods, AutoRegressive Moving Average (ARMA) and derived algorithms are used in behavior prediction applications [49, 9]. In addition, Dynamic Time Warping algorithm is also utilized in device behavior evaluation [30], directly comparing the values of two time series.
Besides, as stated before, Deep Learning has been applied in behavioral data evaluation from a time series perspective utilizing RNNs [18, 15, 81, 100, 105, 20] and CNNs [14, 68].
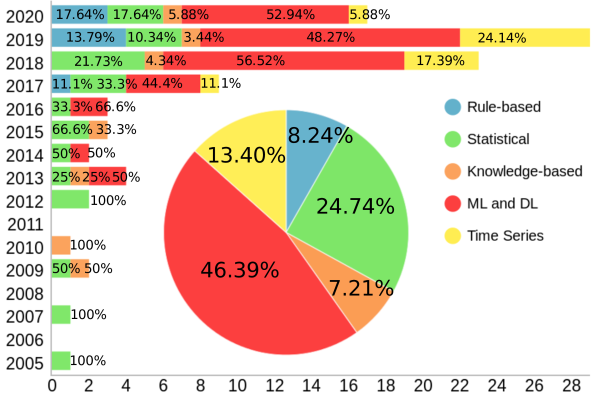
TABLE IV compares the main properties of the five behavior processing approaches identified in the literature analysis. As general conclusion, when the behavior of the device is composed of a limited and known number of actions and there is not a large number of dimensions in the data, the appropriate approaches would be those based on rules and statistical algorithms, given their reduced complexity and resource consumption. However, when the data features maintain complex relationships between them, the most suitable solutions are those based on knowledge and ML/DL approaches. Finally, when there is a relationship between the different measurements based on their order, a time series approach may provide improved results. Depending on the amount of data, the available resources, and the complexity of the feature correlations, some particular algorithms are better than others. For example, a simple IoT device, like a bulb, with a limited and known set of actions, can be modeled with a rule-based approach, leveraging its limited resources. In contrast, a cloud service that executes different tasks would be hard to model using rules, instead, an ML/DL-based approach exploiting the correlations in the sources available would be more successful. Overall, Figure 4 shows the global and per year distribution of works using each technique, note that some works may utilize techniques belonging to more than one category. ML and DL rise as the leading group of processing techniques applied to device behavior fingerprinting, as it is already the main trend in the area and is still gaining even more prominence.
Additionally, to properly evaluate and compare the solutions performance, it is critical to define relevant metrics. Then, independently of the evaluation approach followed, there is a set of common metrics utilized in the majority of behavior-based solutions. TABLE V shows these common metrics. In the case of classification approaches, these metrics are based on the values present on a confusion matrix, while in the case of regression approaches, the metrics are based on prediction errors [136, 11]. Moreover, some solutions also consider factors such as detection time or resource usage.
| Metric name | Description | Equation |
| Accuracy | Total number of correct predictions over the total made | |
| Precision | Ratio of actual positives over all the elements predicted as positives | |
| Recall, Sensitivity or True Positive Rate (TPR) | Proportion of actual positives correctly identified | |
| Specificity or True Negative Rate (TNR) | Proportion of actual negatives correctly identified | |
| False Positive Rate (FPR) or False Acceptance Rate (FAR) | Proportion of the elements wrongly determined as positive among the actual negatives | |
| False Negative Rate (FNR) or False Rejection Rate (FRR) | Proportion of the elements wrongly determined as negatives among the actual positives | |
| F1-Score | It is the harmonic mean of precision and recall. Also known as F-Score or F-measure | |
| Equal Error Rate (EER) | Threshold that equals the FAR and FRR. | |
| Area Under Curve (AUC) | Area covered by the plot of TPR and FPR (ROC Curve) at different threshold values between 0 and 1 | |
| Mean Squared Error (MSE) | Average of the squares of the prediction errors. It is utilized in regression | |
| Root Mean Squared Error (RMSE) | Root of the average of the squares of the prediction errors. It is utilized in regression | |
| Mean Absolute Error (MAE) | Absolute average of the prediction errors. It is utilized in regression | |
| Root Relative Squared Error (RRSE) | Error relative to a simple predictor that always returns the average of the actual values | |
| Detection or modeling time | Period elapsed between an attack or anomaly starts and the monitoring system detects it, or the time elapsed to model the device behavior accurately [12, 15] | |
| Processing overhead or resource consumption | Resource usage of behavior monitoring and processing, which is particularly relevant in resource-constrained devices [90, 92, 95] |
-
•
TP: True Positive, TN: True Negative, FP: False Positive, FN: False Negative.
V Behavior-based Solutions and Applications
After analyzing the processing and evaluation techniques used in device fingerprinting (Q2), and the scenarios, devices, and data sources (previously, with Q1), we have the background needed to review and understand device behavior-based solutions. In this sense, this section performs an in-depth review of the most relevant works of the literature that deal with behavioral fingerprinting to answer Q3 (What characteristics do the most recent and representative solutions of each application scenario have?). The analysis of each solution considers the application scenario, device type, behavior source, data monitored, processing and evaluation algorithms, and results criteria. We give particular importance to IoT devices because of their role in current real-world deployments. Still, it is important to note that other devices could be fingerprinted considering the same data sources. Below, the approach followed by each solution is detailed and grouped by application scenario and behavior source.
V-A Device Type or Model Identification
In this application scenario, we review solutions whose objective is to identify device models or types. Devices belonging to the same model or type are treated as equals by the literature. The main characteristics, algorithms and performance of each solution are compared in TABLE VI.
V-A1 Network-based identification
Many works in the area of device type or model behavior fingerprinting address the identification problem from a network analysis perspective, deriving statistical features for ML/DL technique application. Furthermore, they are mainly focused on IoT and ICS devices differentiation, as this section shows. In this context, the authors of [71], proposed two fingerprinting methods for ICS device models. The first was based on the response time between a TCP acknowledgment and the application layer response, once the data had been processed. The second method used physical operation times by measuring the time elapsed to apply some actions in an actuator. In [12], Miettinen et al. proposed IoT Sentinel, an IoT device type identification approach based on device setup network communications. The main goal of this work was to recognize potentially vulnerable device types and enhance their security based on rules. Packet headers were analyzed to derive features resilient to traffic encryption.
Bezawada et al. [52] also presented a network-based methodology to perform behavioral fingerprinting and device type identification inspired in SIP-based fingerprinting [137, 138]. A behavior model data was divided into static, based on the header protocols used by the IoT device, and dynamic, based on flow sequences and packet payloads. By following the same direction, Shahid et al. [75] identified different IoT device types using bidirectional flow characteristics. Four different device types were utilized: sensor, camera, bulb, and plug.
Also dealing with device type or model identification, the authors of [13], utilized ping operations to generate a fingerprint of different IoT devices to distinguish real embedded machines from virtual and emulated embedded systems. Several devices were grouped in each category to make them diverse enough to model previously unseen devices. For each ping, time-based statistical features were calculated using ping requests separated by 0.2 seconds. Oser et al. [29] utilized TCP timestamps to measure the clock skew of different IoT device models and identify them. 562 devices of 51 different models were utilized for classification-based testing. Using only clock skew, the system could not identify most of the devices. Then, the authors decided to utilize 12 additional features derived from the timestamps gathered to calculate the clock skew. Thangavelu et al. [51] proposed DEFT, a distributed device fingerprint and identification system. In this approach, SDN network gateways performed device monitoring and classification locally, while a centralized control entity generated and distributed the classifiers. Statistical features were extracted based on packet headers and application layer protocols, and grouped in 15-minutes sessions. To identify new device types, clustering algorithms (k-means) were applied. Similarly, Perdisci et al. [85] analyzed DNS application protocol to derive IoT model fingerprints following a document retrieval-based approach.
Another relevant work in the scenario of IoT device model identification was proposed by Marchal et al. [6]. The authors presented AuDI (Autonomous IoT Device-Type Identification), a system designed to identify IoT device type by passively analyzing its periodic network communications, grouping them using clustering algorithms. To recognize periodic flows, Discrete Fourier Transform (DFT) was applied to candidate periods, transforming time domain to frequency domain. Then, 33 different features were calculated for each period. Similarly, Arunan Sivanathan et al. [4, 136] worked on device type classification. In this case, packet and flow-based statistical features were utilized to perform device classification and behavioral monitoring tasks. Using the same dataset, Msadek et al. [53] focused on encrypted traffic analysis to identify IoT device models. In this work, the authors derived statistical features from headers using a sliding window.
In the same direction, OConnor et al. [50] proposed HomeSnitch, a framework designed to classify home IoT devices communication by semantic behavior (e.g., firmware update/check, audio/video recording, data uploading). To build application-level models from packet headers, HomeSnitch used adudump [139] traffic analysis tool. After that, 13 different features were extracted to describe application data exchanges. The authors used YourThings dataset [140] for solution testing. Similarly, Trimananda et al. [84] proposed Ping-Pong, a tool designed to extract packet-level signatures for events (e.g., light bulb turning ON/OFF) based on device model. This work covered traffic encryption and unknown proprietary protocols by applying a clustering-based approach over statistical packet analysis. Furthermore, Hafeez et al. [55] proposed IoT-KEEPER, a system for both identify device types and detect malicious activities using an unsupervised approach based on fuzzy C-means clustering and interpolation.
Applying more sophisticated DL-based solutions, Ortiz et al. [18] presented DeviceMien, a probabilistic framework for device identification which considered stacked LSTM-autoencoders to automatically learn features and classes from raw TCP packets. Then, the system modeled, using DBSCAN, each device as a distribution of the generated classes. For testing, the authors used two different datasets, one public, [4], and another private. Kotak and Elovici [76], as a novel approach, performed a pre-processing step that converted the TCP network traffic (pcap format) to grayscale images. Then, an MLP was utilized to classify different device flows based on the device type. The dataset utilized was from [4].
Another research line covering device identification is based on the analysis of deployment scenarios such as Smart Homes or agriculture networks [141, 142]. Kumar et al. [143] analyzed home networks in order to perform device type identification and security analysis. In total, 83M devices deployed in 16M households were collected, analyzing their distribution and known vulnerability issues. In a device subset, a 96% accuracy was achieved using expert rules and an ensemble of RF classifiers trained using data from different application layer protocols. Another smart home device analysis was performed by Huang et al. [144]. However, device categories were only manually standardized in this study, mentioning device type identification and anomaly detection as future work paths.
Digital forensics has also leveraged device identification when it helps in forensic investigations, as the increasing number of devices generates new challenges and motivates to work on more advanced identification methods [145, 146]. One example of these scenarios is Amazon Alexa ecosystem forensics [147, 148], where the behavior-based identification of the devices present in the scenario is a highly valuable asset. Moreover, the digital forensics field is also leveraging new technologies such as blockchain when dealing with large scenarios such as IoT environments [149].
V-A2 Radio-based identification
Drone model identification is the main research area where radio behavior fingerprinting is employed for type or model identification. Although this problem has been traditionally addressed based on physical characteristics, such as images [150], RADAR and LIDAR [151], or sound [152](out of the scope of this study), there is an emerging research line based on radio analysis and fingerprinting. A relevant work presented by Ezuma et al. [64] analyzed controller signals to classify unmanned aerial vehicles (UAV). In the same line, Al-Sa’d et al. [65] used DNNs to classify drone models based on their radio communications. Using the same dataset, Allahham et al. [66] improved the previous results using a 1D CNN. Similarly, Basak et al. [67] also applied CNNs for drone identification but using their own dataset, which will be published in the near future.
TABLE VI compares the solutions focused on device type and model identification. From the previous solution analysis, we can observe that the device type and model identification application scenario has been mainly covered from a network communication perspective. Moreover, it is noticed that most of the solutions in this area are focused on IoT, as the heterogeneous nature of IoT devices motivates the usefulness of solutions capable of distinguishing devices according to their type and model. Many solutions achieve classification results over 99% in accuracy and F1-Score metrics, which indicates that this area is relatively covered by approaches with good performance. Besides, drone identification is the main application of radio-based fingerprinting for model identification. Here, further research is still required to achieve similar performance to network-based identification.
| Work | Year | Device Type | Approach | Algorithms | Behavior Source | Features | Dataset | Classes | Results |
| [71] | 2016 | ICS | Classification | ANN, NB | Network | Response delay times | Private | Device Model | 99% and 92% accuracy for response and operation time recognition, respectively. |
| [12] | 2017 | IoT Devices | Classification | RF | Network | Packet header-based | [12] | Device Type | 81.5% average accuracy on 27 devices, over 95% for 17 of them. |
| [52] | 2018 | IoT Devices | Classification | Gradient boosting, k-NN, DT | Network | Header and payload statistics | Private | Device Type | 99% average accuracy and 86-99% TPR |
| [75] | 2018 | IoT Devices | Classification | t-SNE, RF | Network | Flow statistics | Private | Device Type | 99.9% accuracy differentiating sensor, camera, bulb, and plug devices. |
| [13] | 2018 | IoT Devices | Classification | RF | Network | Ping timestamps | Private | Real / Virtual Device | Detection rate of 99.5% using 25 pings and 99.9% using 200 pings. |
| [29] | 2018 | IoT Devices | Classification | RF, SVM, MLP | Network | Clock skew and timestamp features | Private | Device Model | 97.03% precision, 94.64% recall and 99.76% accuracy identifying 51 models. |
| [51] | 2018 | IoT Devices | Classification | k-means, RF | Network | IoT protocol flows statistics | Private | Device Type | 97% accuracy, +97% F1-Score (14/16 classes) |
| [6] | 2019 | IoT Devices | Classification | Clustering + k-NN | Network | Flow periods (DFT) | To be published | Device Type | F1-Score above 90% for 21/23 labels and 98.2% overall accuracy. |
| [4] | 2019 | IoT Devices | Classification | RF | Network | Flow and packet statistics | [4] | Device Model | 99.88% accuracy 5.06% RRSE. |
| [53] | 2019 | IoT Devices | Classification | AdaBoost | Network | Encrypted flow statistics | [4] | Device Model | 95.5% accuracy and F1-Score. |
| [50] | 2019 | IoT Devices | Classification | RF, k-NN, Gradient Boosting | Network | Data exchange statistics | [140] | Device Behavior Type | 99.69% accuracy, 93.93% F1-Score and 96.82% TPR, and 11.96% UBMR. |
| [143] | 2019 | IoT Devices | Classification | Rules + RF | Network | Header and app-layer statistics | Private | Device Type | 96% accuracy on a manually labeled subset. |
| [18] | 2019 | IoT Devices | Classification | LSTM-autenc., DBSCAN, OC-SVM | Network | Derived using LSTM-autoencoders | Private / [4] | Device Model | Seen devices: 99% accuracy. Unseen devices: 82% F1-Score and 70% accuracy. |
| [84] | 2020 | IoT Devices | Classification | DBSCAN, State machine | Network | Packet sequence statistics | Private | Device Activities | 97.05-97.48% avg detection and 0.18-0.32% avg FPR in actions of 19 devices. |
| [76] | 2020 | IoT Devices | Classification | DNN | Network | Images generated from raw data | [4] | Device Type | 99% accuracy identifying 10 network flow types (9 IoT and 1 non-IoT). |
| [55] | 2020 | IoT Devices | Classification | C-means and interpolation | Network | Flow and header statistics | [55] | Device Type / Anomalies | 99% accuracy for device type identification and 98% TPR, 4% FPR and 98% F1-Score for attack detection. |
| [85] | 2020 | IoT Devices | Classification | Statistical based on term frequency | Network | DNS analysis | To be published | Device model | 95% avg AUC and 0.01% max FPR on 53 models. |
| [64] | 2019 | IoT Devices | Classification | k-NN | Radio signals | IQ samples | Private | Drone model | 98.13% accuracy identifying 15 UAV controllers. |
| [65] | 2019 | IoT Devices | Classification | DNN | Radio signals | IQ samples | [153] | Drone model | 99.7% accuracy using 2 classes, 84.5% using 10 classes. |
| [66] | 2020 | IoT Devices | Classification | 1D CNN | Radio signals | IQ samples | [153] | Drone model | 94.6% accuracy for 10 drone classes. |
| [67] | 2020 | IoT Devices | Classification | CNN | Radio signals | IQ samples | Private | Drone model | 99% accuracy for 10 drones and controllers when SNR is 0 dB. |
V-B Individual Device Identification
This section analyzes behavior-based solutions focused on identifying the device itself. It means that they differentiate devices with the same hardware/software. At this point, it is important to note that these approaches will also be able to distinguish different device types and models (the previous category), and this fact is also considered and evaluated in some of them. In these solutions, features usually have a lower level, related to hardware components, trying to differentiate fabrication variations on the device components. TABLE VII compares the main characteristics, algorithms applied and performance of solutions detailed in this subsection.
V-B1 Processor-based identification
In this category, Salo’s [93] proposed a fingerprinting software method capable of differentiating identical personal computers using quartz crystals characteristics. Concretely, the author utilized the CPU Time-Stamp Counter (TSC), the Real-Time Clock (RTC), and the Sound Card Digital Signal Processor (DSP). The solution aimed to verify how accurate the RTC and DSP were in terms of CPU cycles by measuring the one-second ticks of the RTC and the time needed by the DSP to process one second of audio. Then, statistical analysis was applied to distinguish computer pairs between them. Also exploiting processor differences, but based on execution time, Sanchez-Rola et al. [94] proposed CryptoFP, a novel approach to identify machines with the same software and hardware through the generation of a fingerprint using the time taken to execute a specific function. This fingerprint was generated by executing the same function many times, repeating different parameters to model its time variability. In the fingerprint comparison, the tool compared the most frequent (mode) time values for each call parameter over all iterations. The authors conducted several experiments to test long-term fingerprint stability, and CPU workload and temperature impact in the fingerprint generation. For future work, the authors considered solution scalability as fingerprints are compared one by one. Finally, Lorenz et al. [154] considered embedded circuits of IoT sensors for unique fingerprinting. To perform the fingerprinting, predefined voltage sequences were supplied to the sensor, monitoring how its output varies. Fingerprints were evaluated directly comparing output sequences and using RMSE as error measure. Results in individual identification varied according to sensor model, meaning that some models have more fabrication variability that others.
V-B2 Clock-based identification
Based on clock skew capabilities, Jana and Kasera [60] worked on uniquely differentiate wireless access points (AP) based on the clock skew calculated from their beacon frame timestamps. This work utilized the uw/sigcomm2004 dataset [155]. The results, using Expectation Maximization statistical algorithm to compare AP frames, indicated that clock skew seems to be an efficient and robust fingerprinting method capable of detecting different WLAN APs. Similar results to the previous ones were presented by Sharma et al. in [62]. In this case, the authors utilized TCP and ICMP timestamp headers to calculate the clock skew between two devices, validating the work of Kohno et al. [59]. They tested their approach with 210 different devices, some of them identical, finding that they were able to distinguish both different and identical devices. Besides, they also tested clock skew stability based on the measurement methodology and on several environmental factors, such as temperature or operating system. Based on these results, the authors concluded that this approach is suitable for moderate size networks.
Focused on wireless unique device identification, Lanze et al. [61] considered clock skew stability and uniqueness. To measure the clock skew, the authors took the timestamps from a wireless AP (sender) sent in wireless beacons and the timestamps from the measuring wireless client (receiver). To carry out their experiments, they gathered clock skews using five different laptops from 388 different APs. Through their experiments, they concluded that all clock skews were in a rather short range (30 ppm) due to restrictions of the suppliers’ quality specifications. Therefore, although the clock skew restricts the set of possible devices, it cannot serve as a unique fingerprint for a wireless access point and has to be enriched with other features to achieve uniqueness. In the same line, Radhakrishnan et al. [74] published GTID, a system for individual wireless device and device type fingerprinting based on clock skew. This approach utilized clock skew and communication patterns to generate device signatures from a DL-based time series approach. The system was tested using a previous dataset of the team [156, 157], collected from 37 different devices, including some repeated models. Similarly to [61] and [74], Polčák et al. [58, 63] also discussed clock skew performance when uniquely identifying different devices. Here, the authors concluded that clock skew is not completely stable. Besides, based on the clock skew distribution of the evaluated devices, the authors claimed that clock skews are distributed close to 0 ppm. These factors prevent a quick fingerprint technique to be capable of uniquely differentiate devices in large scenarios. Finally, the authors also discussed and demonstrated the possibility of masquerading or falsifying the clock skew. The authors concluded that this technique might be suitable for small networks or in combination with additional data.
V-B3 Resource usage-based identification
Resource usage was exploited for individual identification in [30]. In this work, the authors developed a fingerprinting method based on the CPU usage graph when the device is executing a fixed task. For this purpose, a benchmark program that included several read/write operations and calculations was developed. In the evaluation process, the graph was compared to the previous ones of the same device using the Dynamic Time Warping algorithm. The percentage of stable fingerprints was calculated using the Shannon entropy and stability measurement, achieving a 93.43% of unique fingerprints.
V-B4 Electromagnetic signal-based identification
Other works solved the identical device identification problem using electromagnetic signals as data source. Using radio signals, Jafari et al. [14] used DL techniques to identify wireless devices and distinguish among identical wireless devices from the same manufacturer. The authors used ZigBee devices from which a historical radio frequency trace dataset was obtained. In total, six identical devices were employed in the tests, concluding that it was possible to identify devices based on their radio frequency traces, even if they were from the same model. A similar approach was addressed in [68], where Riyaz et al. utilized raw radio samples to build a unique device signature using Software Defined Radio (SDR) transmissions. This solution was tested on 5 identical devices. In addition, the authors analyzed how detection accuracy is impacted by measuring distance, concluding that classification performance starts to degrade at 34 feet. Finally, Cheng et al. proposed in [70] a method capable of identifying identical laptops and smartphone devices (also different models) based on the electromagnetic signals radiated from the CPU. As a drawback, this solution requires the use of an external sensor to measure the CPU radiated signals within a 16 mm range.
TABLE VII compares the solutions focused on individual device identification. As a general view of individual device identification solutions, it can be appreciated that solutions are focused on general computers and wireless devices. This ensures solution universality, but opens the door to future perspectives focused on more specific device types such as IoT or ICS. It is also noticed the lower-level nature of the behavior sources utilized, which in this case are mainly based on clock and processor properties, and electromagnetic signals. Many solutions achieved high individual identification performance. However, many of these approaches noticed scalability issues in large device deployments, as fabrication variations are limited within determined quality standards.
| Work | Year | Device Type | Approach | Algorithms | Behavior Source | Features | Dataset | Classes | Results |
| [93] | 2007 | General computers | Classification | Statistical | System processors and oscillators | RTC and DSP drift compared to the TSC | Private | Different physical devices | 98.5% and 93.3% of differentiation by RTC and DSP in 38 PCs, respectively. |
| [94] | 2018 | General computers | Classification | Statistical (Mode) | System processors | Matrix of code execution times | Private | Different physical devices | 100% host-based and +80% web-based device identification in two sets of 89 and 176 PCs. |
| [154] | 2020 | IoT Devices | Classification | Statistical | System circuits | Outputs based on voltage | Private | IoT sensors | 0% to 94.3% FPR in individual sensor and 0% FPR in model identification. |
| [60] | 2009 | Wireless access points | Classification | Expectation Maximization | Clock skew | Wi-Fi beacons timestamps | [155] | Known APs | Clock skew is a robust method and can detect different WLAN APs. |
| [62] | 2012 | General computers | Classification | Statistical | Clock skew | TCP and ICMP timestamp | Private | Different physical devices | Both identical and different devices correctly identified. |
| [61] | 2012 | Wireless devices | Data analysis | Statistical | Clock skew | Wi-Fi beacons timestamps | Private | Different physical devices | Clock skew is not enough to uniquely identify a large set of devices. |
| [74] | 2014 | Wireless devices | Classification | ANN | Clock skew + Network | Communi-cation skew and patterns | [156] | Individual devices and device type | From 99 to 95% accuracy and 74% recall on ID, and 86% accuracy and 68% recall on type classification. |
| [63] | 2015 | General computers | Data analysis | Statistical | Clock skew | TCP timestamps | Private | Different physical devices | Clock skew is only suitable for small networks or combined with other data. |
| [30] | 2019 | General computers | Classification | Dynamic Time Warping | Resource usage | CPU usage- based graph | Private | Physical devices | 93.43% of uniqueness in the generated fingerprints of 10 identical devices. |
| [14] | 2018 | Wireless devices | Classification | MLP, CNN, LSTM | Electromagnetic signals | Radio frequency IQ samples | Private | Different physical devices | 96.3% accuracy for MLP, 94.7% for CNN and 75% for LSTM when identifying 6 identical ZigBee devices. |
| [68] | 2018 | Wireless devices | Classification | CNN | Electromagnetic signals | Raw frequency IQ samples | Private | Different physical devices | 98% accuracy is achieved when identifying 5 identical devices. |
| [70] | 2019 | Laptops and Smartphones | Classification | Extra-Trees | Electromagnetic signals | CPU radiated magnetic signals | Private | Different physical devices | 99.1% average precision and recall for all devices (70), and 98.6% precision and recall for 30 identical devices. |
V-C Attack Detection
The third main scenario where behavior fingerprinting is highly relevant is attack detection. Abnormal situations can have a wide range of forms, such as network attacks, malware, malicious firmware modifications, or unauthorized user interactions. Detection can be performed either modeling normal device behavior and detecting deviations, from an anomaly detection standpoint, or collecting normal and abnormal labeled data and performing classification tasks. TABLE VIII compares the main characteristics, algorithms applied and performance of solutions detailed in this subsection.
V-C1 Network-based attack detection
The most exploited source in terms of behavior-based attack detection is network monitoring. Many solutions, mainly focused on IoT [78, 9, 72, 87, 7, 10, 15, 77, 88, 158, 5, 34, 56] but also on SDN/NFV [79, 80] and general computers [82, 83, 81, 73], have utilized this source for attack detection.
One of the leading research lines focuses on detecting attacks that deploy unauthorized devices in the environment. In [78], the authors worked on unauthorized IoT device detection using white lists and classification ML algorithms. TCP/IP flows were used to extract features capable of characterizing nine different types of devices (17 distinct IoT devices were used). This work also discussed the system resilience to cyberattacks. Similarly, in [77], the authors used packet headers and payload data to extract flow-based features capable of creating device type fingerprints. Then, unknown or suspicious devices with abnormal behavior could be identified, and their communication restricted for further monitoring. The dataset used for testing came from IoT Sentinel [12]. In the same line, Ferrando and Stacey [9] built a behavior profile of IoT devices based on entropy and dispersion of metrics related to IP directions, ports, bytes received/sent, and latency. Anomalies were detected based on the distance between the average values and the ones being evaluated.
In contrast, the majority of works in this area cover the detection of direct cyberattacks, both common ones such as flooding or port scans, and more sophisticated ones like DDoS, botnets or ransomware. Amouri et al. [72] proposed an IDS based on IoT device network behavior. This system had a distributed architecture composed of traffic sniffers in the local network and a central super node. Device behavior was built on packet counters determined by MAC and network layer data. The proposed architecture applied DT algorithm to classify network instances, and then Linear Regression to generate time-based device profiles relying on the measure of behavior fluctuation.
Also from an ML-based perspective, Sivanathan et al. [5] addressed behavioral changes and attack monitoring based on flow and packet network analysis and clustering. The authors tested both direct network attacks (ARP Spoofing, Ping of Death, TCP SYN flooding, and Fraggle) and reflection attacks (Smurf, SNMP, SSDP, and TCP SYN reflection). A similar approach was followed in [88], where the authors performed attack and anomaly classification using MQTT protocol traces gathered from DS2OS dataset [159]. In the same line, Lima et al. [73] presented an approach for detecting DoS/DDoS attacks using ML techniques. The authors built a customized attack dataset based on several public datasets (CIC-DoS, CIC-IDS2017, and CIC-IDS2018 [160]) to benchmark normal traffic and different DoS/DDoS classification. The solution presented in [81] also considered network traffic data extracted from the CIC-IDS 2017 [160] dataset, but in this case for an unsupervised anomaly detection approach. Here, traffic sequences were modeled in sliding windows that were fed to an LSTM network. Similarly, traffic-based anomaly detection is covered by a wide variety of other works using anomaly detection approaches [79, 87].
A different view was provided by Yin et al. [82], who applied DL for botnet behavior modeling and detection. This solution was based on a GAN that generates simulated data, augmenting the model trained with the original data. The authors utilized network flows derived from ISCX botnet dataset [161] as benchmark. Also focused on botnet attacks, Blaise et al. [56] presented a bot detection technique based on host behavior. This solution was divided into three steps: characterizing the host behavior based on network signatures (aggregated attribute frequency distribution), inferring benign host behavior using clustering algorithms (DBSCAN), and classifying new hosts based on previously labeled instances. To validate the approach, the authors used the CTU-13 dataset [162]. On similar research paths, Fernández et al. [158] analyzed ransomware detection based on behavior analysis in Medical Cyber-Physical Systems. This work analyzed network flows extracting different statistical features. Then, anomaly detection and classification ML models were combined to evaluate the live generated vectors.
In another line, some authors have proposed the usage of Manufacturer Usage Descriptions (MUDs) to enhance IoT security. In Hamza et al. [10], flow counters were used to generate feature vectors, applying PCA and k-means for dimensionality reduction and clustering, respectively. Then, an approach based on boundary detection and Markov Chains was applied for MUD monitoring and anomaly detection, testing it on several network attacks such as ARP spoofing, TCP SYN, and UDP flooding or reflection attack. Another approach using MUD to improve IoT security was proposed by Afek et al. in [80]. From an NFV perspective, this proposal presented a hybrid approach where MUD compliance checking is a service implemented as a virtual network function (VNF), and traffic monitoring is implemented on the network gateway to ensure P2P communications. For devices with no MUD, the authors used the algorithm proposed in [163] for MUD generation.
Additionally, other works also apply trust-based approaches to their solutions, increasing the granularity of the evaluation. Haefner and Ray presented ComplexIoT in [7], a behavioral framework designed to evaluate each traffic flow in an IoT device and calculate a trust score for it. The authors collected traffic of 25 devices approximately (general computers, smartphones, IoT devices). Based on the Flow Trust Score of each connection, calculated using IF, different policies and rules are applied to mitigate possible attacks. This solution is deployed on an enforcement architecture as an SDN environment based on OpenFlow.
From a distributed perspective, the authors of [15] used federated learning to build DÏoT, an autonomous self-learning distributed system for detecting compromised IoT devices. The system created communication profiles for each device based on network packets and flows. Then, an anomaly detection-based approach was applied to detect changes in the device behavior caused by network attacks (Mirai botnet). The architecture was deployed using a network gateway (router) as the Anomaly Detection component. Besides, an IoT Security Service was in charge of maintaining a repository of GRU models. Another DL-based distributed solution was proposed in [34], in which Ali et al. submitted an IoT device behavior capturing system powered by blockchain and designed to enable trust-level confidence to outside networks. The authors deployed a Trusted Execution Environment (TEE) [164] to provide a secure execution environment for sensitive code and blockchain data. The data came from the N-BaIoT dataset [165] and contained network features related to benign and botnet attack flows. Also from a distributed perspective, in [83], the authors proposed a behavior anomaly detection system based on network traffic. Here, the data was stored using a Hadoop Distributed File System (HDFS), and the processing was based on distributedly training a Deep Belief Network (DBN) and a stacked layer SVM using Apache Spark. The system was tested using different datasets, (KDD99 [166], NSL-KDD [167], UNSW NB-15 [168], CIC-IDS 2017 [160]).
V-C2 Sensor-based attack detection
Regarding sensor measurements to detect attacks, the main solutions based on this approach are applied to IoT and ICS environments [89, 20, 104, 105]. Pacheco and Hariri [89] focused on IoT sensor behavior analysis to detect common attacks such as DoS, Flooding or Impersonation. This approach recognized previously known and unknown attacks by calculating Euclidean distance from normal sensor measurements. The authors of [20] performed anomaly detection in cyber-physical systems (CPS), using GANs and time series data. From this perspective, the authors built an unsupervised GAN framework based on LSTM networks , which was tested using SWaT dataset [169], WADI dataset [170], and KDD99 dataset [166].
Similarly, Neha et al. [105] proposed a behavioral-based IDS for ICSs, in this case for SCADA systems. This approach applied RNNs to detect cyber-physical attacks. The model received sensor measurements gathered from the SWaT dataset [169]. Zhanwei and Zenghui [104] also proposed an anomaly detection system for ICSs, but based on the behavior of the data sequences from the industrial control Modbus/TCP network traffic. The authors tested their system both in a simulated water tank scenario and in a real chemical mixing infrastructure, utilizing sensor measurements to generate a behavior model and predict future behavior.
V-C3 System calls, logs and software signature-based attack detection
Other solutions rely on system calls, execution logs, and software signatures to model device activity and detect attack situations [96, 35, 97, 99, 103]. These solutions cover a wide range of device types, including resource-constrained devices, general computers, and cloud systems.
Based on system call collection and processing, Gideon Creech [96] developed an IDS based on system call patterns. The authors utilized a semantic approach over the system call traces to understand running programs and detect anomalies utilizing an Extreme Learning Machine (ELM). A Linux system was monitored under different types of vulnerability exploitation attacks, and the dataset was made publicly available as ADFA-LD [96]. Also covering cloud intrusion detection using system calls, in [98], the authors developed a HIDS for cloud environments that utilized system calls to build a normal behavior profile based on Term Frequency-Inverse Document Frequency (TF-IDF). Then, ML-based classifiers were employed to recognize the attacks. Following similar paths, Liu et al. [99] developed a general IDS based on system call TF-IDF statistical patterns derived from n-gram models. In [97], Deshpande et al. also faced cloud computing intrusion detection based on system calls using ML classifiers and call frequency vectors.
From a different perspective, Attia et al. proposed in [35] an adaptive host-based anomaly detection framework for resource-constrained devices. The designed use case targeted the detection of malicious updates on Android applications. It generated a normal behavioral model for each monitored application using n-gram language models. Additionally, He et al. [103] proposed BoSMoS, a distributed software status monitoring system for Industrial IoT (IIoT) enabled by blockchain. To accomplish its goal, the system stored a snapshot of the device software in the blockchain and then monitored its system file calls. This solution was executed in 300s intervals, so modified software did not run for more than these 300s. Finally, the authors also tested solution scalability, performance, and security.
V-C4 Hardware event-based attack detection
Apart from the behavioral data considered by the previous solutions, other works such as [90, 92, 91] used Hardware Performance Counters (HPC) to model system behavior. These solutions focused on resource-constrained devices such as embedded systems and IoT devices. In [90], the authors presented ConFirm, a technique to identify device behavior and detect malicious modifications in the firmware of embedded systems using HPCs. Deviations, based on execution paths, were calculated to evaluate the system performance. The proposal was tested on ARM and PowerPC embedded processors, verifying that the solution was able to detect all the tested modifications with low resource overhead. In [92], Golomb et al. proposed CIoTA, a lightweight framework using blockchain to perform distributed and collaborative anomaly detection in resource-constrained devices. In this solution, an Extended Markov Model (EMM) captured an application control-flow asynchronously using HPCs. Attack informing blocks were submitted to the blockchain (validated by neighbor devices) to ensure that an attacker cannot exploit a large number of devices within a short period of time. The system was tested in an IoT platform composed of 48 Raspberry Pi simulating smart cameras and lights. An exploit was executed to simulate a bot behavior in some devices. The authors also mentioned some countermeasures, such as alerts, service restart, or poweroff.
Ott and Mahapatra [91] utilized HPCs and their occurrence frequency to enable continuous authentication of embedded software. For this purpose, the HPCs streams were processed using Short-Time Fourier Transforms (STFT) to extract frequency information. The authors discussed the usage of classifiers; however, they considered these models too heavy for embedded systems and chose to build their own authentication algorithm based on cyclic redundancy check (CRC) function and state machines.
V-C5 Resource usage-based attack detection
An alternative approach to detect anomalies caused by attacks consists in resource usage monitoring [3, 21, 11], applied mainly in cloud and container systems. Shone et al. proposed in [3] a misbehavior monitoring solution for DoS detection in cluster-based systems. This solution utilized resource usage metrics together with process and file modification monitoring to model the system behavior. Anomaly detection was addressed based on thresholds, clustering, and statistical similarity calculation. Similarly, Barbhuiya et al. proposed in [21] a DDoS and cryptomining attack detection framework for cloud data centers. The solution, called RADS (Real-time Anomaly Detection System), monitored CPU and network utilization as a time series for anomaly detection. Then, different window-based approaches were applied to perform attack identification based on IQR Spike detection analysis. For testing, a real-world dataset was gathered from Bitbrains data center [171].
Additionally, some works have also covered attack countermeasure actions. In this line, the authors of [11] presented an anomaly detection mechanism based on resource behavior designed to identify when a cloud system should be auto-scaled. To detect anomalies, an AutoRegressive (AR) model was trained using CPU usage statistics, and the prediction error on the test dataset was used as anomaly measurement. The system was only tested using two DoS and stress attacks, detecting both of them.
The main characteristics of the attack detection solutions are summarized in TABLE VIII. Based on the attack detection solution analysis, we can claim that attack detection is the most varied behavior application scenario. Although network is the most used source, others such as system calls or resource usage also have notable relevance. The same heterogeneous distribution can be observed regarding processing and evaluation approaches, having a balance between classification and anomaly detection. The concrete sources and techniques applied are related to the type of attacks addressed. Thus, although many solutions achieved successful results, the rapid evolution of attack techniques leads to the need for new future solutions in this area.
| Work | Year | Device Type | Approach | Algorithms | Behavior Source | Features | Dataset | Attack Type | Results |
| [78] | 2017 | IoT Devices | Classification | RF | Network | Flow-based statistics | Private | Untargeted / targeted attacks | 99% accuracy in white-listed devices and 96% in not white-listed. |
| [9] | 2017 | IoT Devices | Classification | ARIMA, Euclidean distance | Network | Header statistics | Private | Unusual changes and attacks | Anomalies visualized based on behavioral distance, no performance metrics were given. |
| [72] | 2018 | IoT Devices | Classification | DT, Linear Regression | Network | Mac and network layer counters | Private | Traffic anomalies | 100% detection (TPR) after 3000s (3 reports). |
| [82] | 2018 | General computers | Classification | GAN | Network | Traffic flow statistics | [161] | Botnet behavior | 74.04% precision, 71.17% accuracy, 70.59% F1-Score, 15.59% TPR for botnet activity detection. |
| [83] | 2018 | General computers | Classification | (Spark) DBN and SVM | Network | Traffic flow statistics | [166], [167], [168], [160] | Network attacks | 93-97% F1-Score in the tested datasets. |
| [79] | 2018 | SDN | Anomaly Detection | SVM, kNN, MLP | Network | Traffic statistics | Private | DDoS, port-scan and flash crowd | Attacks were detected and mitigated |
| [81] | 2018 | General networks | Anomaly Detection | LSTM | Network | Traffic flows | [160] | Common network attacks | 87% AUC average, over 71% AUC in all attacks. |
| [87] | 2019 | IoT Devices | Anomaly Detection | RPNI + RANSAC | Network | Application-layer series | Private | IoT anomalies | The attacks are discovered with high accuracy. |
| [7] | 2019 | PCs, IoT Devices | Anomaly Detection | IF | Network | Flow statistics | Private | DDoS and botnets | Different device confidence based on behavior Flow Trust Score. |
| [10] | 2019 | IoT Devices | Anomaly Detection | PCA, k-means, Markov Chains | Network | Flow counters | [10] | Network attacks | 94.9% accuracy, 89.7% TPR, and 5.1% FPR. |
| [80] | 2019 | NFV | Anomaly Detection | While-listing (MUD) | Network | Traffic flows | Private | Unauthorized connections | Unknown connections forbidden |
| [77] | 2019 | IoT Devices | Classification | RF | Network | Flow-based statistics | [12] | Attack prevention | 90.3% accuracy using RF, outperforming other ML algorithms. |
| [88] | 2019 | IoT Devices | Classification | SVM, RF, ANN, LR | Network | MQTT-traces features | [159] | DoS, control, Scan | 99% F1-Score classifying normal and attack traces. |
| [73] | 2019 | General computers | Classification | RF | Network | TCP/IP header statistics | [73] | DoS/DDoS | 96.5% attack detection rate, 99.5% F1-Score, 0.2% FAR |
| [158] | 2019 | CPSs | Anomaly Detection / Classification | OC-SVM / NB | Network | Flow statistics | Private | Ransomware attacks | 95.9% F1-Score, 4.6% FPR in anomaly detection, and +99% classification accuracy. |
| [15] | 2019 | IoT Devices | Anomaly Detection | (Fed. Learn.) GRU | Network | Header statistics | To be published | IoT attacks | 95.6% attack detection rate and fast (257 ms) attack detection. |
| [5] | 2020 | IoT Devices | Anomaly Detection | PCA, k-means | Network | Header statistics | [4, 10] | Network attacks | 91.3%-84.3% average detection rate for direct network attacks, and 99.1%-58.8% for reflection attacks. |
| [34] | 2020 | IoT Devices | Anomaly Detection | (Blockchain) Neural Network | Network | Flow statistics | [165] | DDoS attacks | 99.2% TPR and 175 230ms to attack detection. |
| [56] | 2020 | IoT Devices | Classification | DBSCAN | Network | TCP, UDP, ICMP headers | [162] | Botnet detection (and attacks) | 100% TPR, 0.9% FPR |
| [89] | 2018 | IoT Devices | Classification | Euclidean Distance | Sensors | Sensor measurements | Private | Common network attacks | 98% accuracy for known attacks and up to 97.4% for unknown attacks. |
| [20] | 2019 | ICSs | Anomaly Detection | LSTM-based GAN | Sensors | Measurement value sequences | [169], [170], [166] | Cyber-physical attacks | 99.99%-46.98% precision, 99.98%-96.33% recall and 94%-37% F1-Score, depending on the dataset. |
| [104] | 2019 | ICSs | Anomaly Detection | Linear model | Sensors | Sensor measurements | Private | Tampering and MitM | 5.5-6.4% FPR and 11-17% FNR |
| [105] | 2020 | ICSs | Classification | RNN | Sensors | Sensor value sequences | [169] | Cyber-physical attacks | 98.05% accuracy and 97% TPR when classifying normal and injected data. |
| [96] | 2013 | General computers | Anomaly Detection | ELM | System calls | Semantic features | [96] | Vulnerability exploitation | 100% TPR and 0.6% FPR. |
| [35] | 2015 | Mobile devices | Anomaly Detection | Look-ahead, N-gram tree | System calls | n-gram sequences | Private | Malicious app updates | 70% detection rate and 0% FPR. 20-50% CPU and 8% RAM. |
| [97] | 2018 | Cloud systems | Classification | k-NN | System calls | System call traces (audit) | Private | Anomalous call sequences | 90% accuracy, 96% TPR, 42.5% TNR |
| [98] | 2020 | Cloud systems | Classification | RF | System calls | Frequency statistics | [172] | Anomalous system calls | 100-94% TPF, 6.2-0% FPR and 6-0% FNR. |
| [99] | 2020 | General computers | Classification | IF, LOF, OC-SVM, k-NN | System calls | n-gram sequence stats. | [96], [173], [102] | Anomalous system calls | 73.7% overall best AUC. 110s for evaluation. |
| [103] | 2020 | IoT Devices | Anomaly Detection | Hash equality checking | Software signatures | File snapshots | Private (Simulated) | Software modification | Executable modification detection within 300 seconds. |
| [90] | 2015 | Embedded systems | Anomaly Detection | Execution path deviation | Hardware Events | HPCs | Private | Firmware modifications | The system is plactical with low overhead |
| [92] | 2018 | IoT Devices | Anomaly Detection | (Blockchain) EMM | Hardware Events | HPCs app control-flow | Private | Adversarial attacks | Exploit execution easily identified, enhancing network overall security. |
| [91] | 2019 | Embedded systems | Continuous Authenticat. | Own (Window + Fourier + CRC) | Hardware Events | HPCs | Private | Abnormal software | 97% TPR, 1.5% FPR in the authentication of embedded software. |
| [3] | 2013 | Cluster systems | Anomaly Detection | Threshold+ k-means + statistical | Resource usage | Hardware, process and file info | Private | DoS attacks | 0.11% FPR and 0% FNR detecting DoS attacks, consuming only 0.5% RAM and 14% of CPU. |
| [21] | 2018 | Cloud data centers | Anomaly Detection | IQR | Resource usage | CPU, network | [171] | DDoS, Cryptomining | 90-95% F1-Score and FPR of 0-3% |
| [11] | 2018 | Cloud systems | Anomaly Detection | Autoregressive (AR) model | Resource usage | CPU | Private | DoS, service stress attack | Attacks are fully detected |
V-D Malfunction and Fault Detection
The last behavior application scenario identified is malfunction and fault detection. In these solutions, the purpose is to detect faulty devices or malfunctioning components based on device behavior changes. This approach has been applied to several device types, such as IoT [86, 57], ICSs [8], NFV systems [100, 95, 49, 108], general computers [101], cloud systems [36, 107], and containers [109, 16, 110]. TABLE IX compares the solutions detailed in this subsection.
V-D1 Network-based fault detection
Choi et al. [86] addressed faulty IoT device identification based on behavior fingerprinting from sensor data and its correlation. This solution was named DICE, and it was installed in the network gateway to extract context from application-layer communications and generate statistical features for a vector distance-based evaluation. In the same line, Spanos et al. [57] proposed a security solution based on the generation of behavioral templates using the IoT device network communications. PCA dimensionality reduction and DBSCAN clustering were applied to the network data to detect abnormal devices. Based on Euclidean distance, devices located far from a cluster center generated an alert and triggered some mitigation actions. This proposal was validated under simulated physical damage and mechanical exhaustion anomalies.
V-D2 Sensor-based fault detection
Sensor data has also been applied in the literature for fault detection. In this line, Manco et al. [8] explored ICS fault detection based on sensor stream data analysis. The system performed window-based processing to obtain statistical features, and then clustering to build classes from unlabeled data. Finally, outlier detection was performed to distinguish failures using Expectation Maximization algorithm. This approach was tested in train door failure detection.
V-D3 System log-based fault detection
From the system log perspective, in [100], the authors applied a multimodal LSTM network approach to perform anomaly detection in NFV microservices based on distributed execution traces. Kubacki et al. [101] explored abnormal behavior detection based on system logs related to performance metrics. The authors performed a pulse-oriented time series analysis to characterize periodical behaviors and detect anomalies using a self-developed algorithm called PANAL. The correlation between metrics was evaluated on real logs, finding a high correlation during anomalous situations such as truncated cyberattacks or data backups.
V-D4 Resource usage-based fault detection
In the malfunction and fault detection scenario, the most common data source is resource usage, especially for fault finding in cloud and container systems. In this context, Gulenko et al. [95] proposed an anomaly detection architecture for large-scale NFV systems. In this proposal, different resource usage metrics were collected from each host in short time intervals. To process the data, the architecture used techniques based on online unsupervised clustering and classification algorithms. The authors claimed that the preliminary evaluation showed a high degree of reliable recognition of pre-defined failure scenarios. In addition, Sorkunlu et al. [109] published a method to track the behavior of a cluster system based on its resource usage. Data was organized into three-dimensional tensors (compute nodes, usage metrics, and time). To measure behavior changes, data was grouped in ten-minute time windows and dimensionality reduction algorithms were applied. Finally, the reconstruction error was measured. In [49], by the same team as [95], the authors proposed an unsupervised detection approach using the Online ARIMA forecasting algorithm [174]. This model was based on predicting the next expected values and comparing them with the actual ones. The authors introduced controlled anomalies, such as disk pollution, or HDD, CPU, and memory stress and leak, being able to recognize all of them. This team also addressed black-box service modeling [108] based on clustering to detect functioning anomalies like in the previous work. The used clustering algorithm was BIRCH [175].
Following a similar approach, Wang et al. [36] proposed a self-adaptive monitoring architecture for online anomaly detection in cloud computing. The system gathered performance metrics from different sources such as CPU, Network, Memory, and Disk. To calculate anomalies, the PCA-based eigenvector of the metrics was compared to the standard eigenvector. The adaptability could be achieved by adjusting a sliding window based on the estimated anomaly degree. A similar line to this work was covered by Agrawal et al. [107], where similar features were collected and PCA was used as dimensionality reduction algorithm. Besides, Du et al. [110] proposed a framework to monitor and classify anomalous behaviors in microservices and containers. Different anomalies, such as high CPU consumption or memory leak, were injected, and the generated data was labeled for using ML classifiers. Finally, Samir and Pahl [16] utilized hierarchical hidden Markov models (HHMM) to detect anomalies in container clusters. HHMM model was compared with Dynamic Bayesian Network and Hierarchical Temporal Memory to detect resource exhaustion and workload contention, achieving the best results in three different generated datasets.
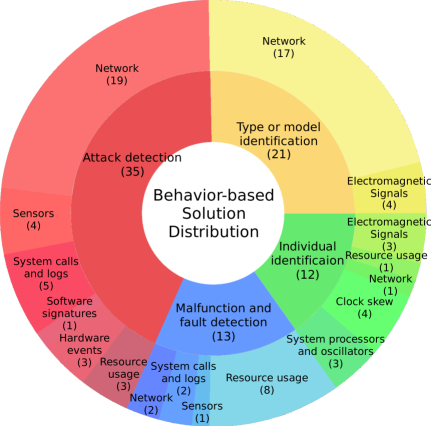
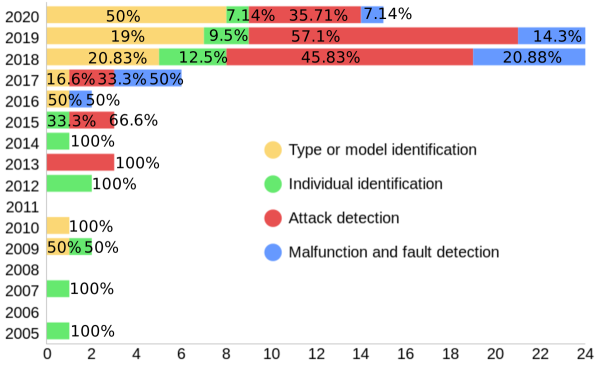
TABLE IX compares the main characteristics and results of the solutions focused on fault and malfunction detection. From the description of the previous solutions, we can observe that resource usage and system logs are the most used behavior source for fault detection, especially in NFV, cloud, containers, and microservice systems. In contrast, IoT devices and ICSs faults have been solved based on a network and sensor-based perspective. Moreover, most of the solutions are focused on anomaly detection-based evaluation, instead of using labeled data. Finally, Figure 5 shows the distribution of the analyzed solutions regarding their application scenario and behavior source, and their publication year.
| Work | Year | Device Type | Approach | Algorithms | Behavior Source | Features | Dataset | Anomaly | Results |
| [86] | 2018 | IoT Devices | Anomaly Detection | Vector distance | Network | Sensor values statistics | [176, 177] | Faulty IoT sensors | 94.9% and 92.5% average precision and recall, respectively. 3 mins for detection. |
| [57] | 2019 | IoT Devices | Classification | PCA, DBSCAN, Euclidean distance | Network | Statistical features | Private | Physical and mechanical errors | Successful threat detection regarding physical damage and mechanical exhaustion. |
| [8] | 2017 | ICSs | Anomaly Detection | Expectation Maximization | Sensors | Sensor values statistics | Private | System Faults | 89.5% AUC detection train door failures. |
| [100] | 2019 | NFV systems | Anomaly Detection | LSTM | System logs | Execution traces statistics | Private | Microservice anomalies | 90% accuracy using real-word cloud traces. |
| [101] | 2019 | General computers | Statistical Analysis | PANAL (time series) | System logs | Performance metrics | Private | Anomalous behavior | Study on metric correlations regarding performance, event, and process logs. |
| [95] | 2016 | NFV systems | Anomaly Detection | Clustering and Classification | Resource usage | CPU, memory, disk, network | Private | NFV anomalies | 95% recognition of pre-defined anomalous scenarios. |
| [109] | 2017 | Cluster systems | Anomaly Detection | PCA | Resource usage | CPU, memory, disk, network | Private | Cluster anomalies | Anomalies correctly detected. |
| [107] | 2017 | Cloud systems | Anomaly Detection | Robust PCA | Resource usage | CPU, memory, disk | Private | Cloud faults | 88.54% accuracy and 86% F1-Score |
| [49] | 2018 | NFV systems | Anomaly Detection | Online ARIMA | Resource usage | CPU, memory, disk, network | Private | NFV Resource anomalies | 100% accuracy detecting controlled HDD, CPU and memory anomalies. |
| [36] | 2018 | Cloud systems | Anomaly Detection | PCA, eigenvector | Resource usage | CPU, memory, disk, network | Private | Cloud faults | The system detects injected test faults. |
| [108] | 2018 | NFV systems | Anomaly Detection | BIRCH | Resource usage | CPU, memory, disk, network | Private | System anomalies | All anomalies detected, except 83% detection for memory leak and CPU stress. |
| [110] | 2018 | Microservices Containers | Classification | SVM, RF, k-NN, NB | Resource usage | CPU, memory, network | Private | Container anomalies | 97-93% F1-Score using k-NN as classifier. |
| [16] | 2020 | Container clusters | Anomaly Detection | HHMM | Resource usage | CPU, memory | Private | Resource exhaustion | 95-90% F1-Score and 19-31% FAR. |
VI Public Datasets
To address Q4 (Which behavior datasets are available and which are their characteristics?), this section reviews the main public datasets containing device behavior activities and characteristics found in the literature. Specifically, it analyzes datasets contemplating the scenarios, devices and sources discussed in Q1, allowing validating most of the techniques presented in Q2, and studying the scope of the solutions analyzed in Q3. Each dataset is described by taking into account the devices and sources monitored, and data morphology. Below, the analysis is organized according to the two main application scenarios stated in Section III, which are Device identification and Misbehavior detection –attack and anomaly detection.
VI-A Device Identification Datasets
Several datasets published in recent years and collecting device behavior are conceived to perform device model, type, or individual identification. In 2006, Maya Rodrig et al. published the uw/sigcomm2004 dataset [155]. The main purpose of this dataset is to analyze how Wi-Fi networks work and how they can be improved. This dataset contains 70 GB of both wired and wireless traces. The wireless traces were collected for five days using three computers in monitor mode near access points. Selcuk Uluagac published in [156] the dataset associated with his research work on network-based individual device identification [74, 157]. This dataset contains the inter-arrival time of network traffic packets collected from 30 wireless devices. 1.5 GB of data was collected both actively, directly communicating with the devices, and passively, sniffing the communications. This dataset can be used to generate network-based fingerprints and derive parameters such as approximated clock skew.
With a similar goal, but focused on IoT, Miettinen et al. published the IoT Sentinel dataset [12]. This dataset contains the traffic generated during the setup of 31 IoT devices of 27 different types (4 types have 2 devices). To avoid anomalies and have data variety, the device setup process was collected at least 20 times for each device, generating a total of 64 MB of data. Another dataset dealing with IoT devices is the Yourthings dataset [140], which contains raw network traffic from 45 different smart-home IoT devices. The data was collected for 10 days in March and April of 2018. Each day data contains from 10 to 13 GB. Following the same approach, in [4], Sivanathan et al. published a dataset collected for IoT device classification under IoT Traffic Traces name. The data was collected in 2016 for 20 days from 28 different IoT devices, including cameras, lights, plugs, sensors, appliances, and health-monitors. In addition, this dataset also includes captures from non-IoT devices such as laptops and smartphones. In total, 9.5 GB of raw pcap files are available. As additional content, post-processing tools to obtain IP, NTP, and DNS flows are also enclosed. Regarding radio frequency, Allahham et al. [153] published DroneRF in 2019, a dataset containing 3.8 GB of radio data collected from 3 different drones during functioning. This dataset has been designed for drone detection, identification and tracking. More recently, Hagelskjær et al. published in 2020 a dataset designed for IoT device identification based on radio spectrum monitoring [178]. The dataset contains +50 GB of 863-870 MHz band raw spectrum measurements with a sampling frequency of 10 MSPS collected in November 2018. The published dataset contains both raw spectrum captures and pre-processed features extracted with PCA.
| Dataset | Year | Device Type | Data Source | Data | Size | Details |
| The uw/sigcomm2004 dataset [155] | 2006 | Wireless and wired devices | Network | Raw traces | 70 GB | This dataset includes the traces collected by wireless and wired monitoring using tcpdump. |
| The gatech/fingerprinting dataset [156] | 2014 | Wireless devices | Network | Inter-arrival time information | 1.5 GB | Inter-arrival time information collected from 30 wireless devices to generate unique fingerprints. |
| IoT Sentinel [12] | 2017 | IoT devices | Network | Raw traces and processed features | 64 MB | Network communications dataset collected during the setup process of 31 devices. |
| Yourthings [140] | 2018 | IoT devices | Network | Raw traces and processed features | +110 GB | 10 days of network traffic collected from 45 different smart-home IoT devices. Flows utilized to evaluate security. |
| IoT Trace Dataset [4] | 2018 | IoT devices | Network | Raw traces and processed features | 9.5 GB | Network flows collected during 20 days from 28 different IoT Devices. The source includes tools to derive flow statistics. |
| DroneRF [153] | 2019 | IoT devices (Drones) | Radio spectrum | Radio segments | 3.8 GB | 227 segments collected from 3 different drones during functioning. |
| Device spectrum identification [178] | 2020 | IoT devices | Radio Spectrum | Raw spectrum and processed features | +50 GB | 863-870 MHz radio spectrum measurements collected in diverse scenarios, like in the same room and different rooms. |
TABLE X summarizes the public datasets previously described, paying attention in their publication year, monitored devices, and data sources collected. Most of the datasets (5 of 7) contain network traces or network-based features. It could be due to the facility to monitor from outside the device behavior without modifying its software. Furthermore, this source is quite generic as almost every device has at least one network interface. Additionally, the two datasets not based in network communications contain spectrum measurements, another externally-collected source. In this context, there is a missing spot for device identification datasets containing sources such as clock skew, system logs or events, and resource usage metrics.
VI-B Anomalous Behavior and Attack Datasets
The second dataset category is based on public datasets containing anomalous device behavior, either based on attacks or other exceptional situations. Note that most of these datasets also contain normal or benign device behavior, which can be utilized to model normal device behavior and identify it, like in the previous subsection. Next, the main datasets found in the literature will be detailed.
The family of datasets that considers network communications to create device behavior fingerprints is extensive. One of the most representative is the CTU-13 dataset [162], a botnet traffic activity dataset collected in 2011. 13 different botnet samples were captured during different attack conditions such as Command and Control (C&C) connection and the launching of diverse attacks –DDoS, or port scanning, among others. Additionally, the dataset also contains normal and background network traffic. In total, this dataset contains +140 hours of network traffic with a total size of 700 GB. Besides, the dataset has been updated in the last years to include IoT malware captures. A set of relevant datasets, IDS 2017 and 2018 datasets [160], was created by the Canadian Institute of Cybersecurity (CIC). They contain raw network traces and derived features obtained during different network attacks. Concretely, the monitored attacks were FTP and SSH Brute Force, DoS, Heartbleed, Web Attacks, Infiltration, Botnet, and DDoS. In addition, these datasets also contain benign traffic. The 2017 dataset was collected from 25 users and contains 51.1 GB of data, while the 2018 dataset contains 220 GB of traffic from 500 different devices. The previous datasets were collected and processed by Lima et al. [73] to extract 40 MB of vectors with 73 features relative to IP headers of the traffic flows. Then, the dataset was published together with a research article. Also from CIC, the ISCX botnet dataset [161] contains raw network captures of 16 different botnet malware. This dataset is generated by combining previous CIC datasets containing botnet activity. In total, the dataset contains 5.3 GB of training traces and 8.5 GB for testing. Aligned with the previous datasets, in [179], the authors provided a novel network dataset, published in September 2019, which contains several types of attacks in an IoT environment. The dataset is composed of 1.5 GB of real and simulated attacks, such as port scanning, flooding, brute force, or ARP spoofing, among others. In the case of real attacks, the network packets were obtained from Mirai botnet. To identify the network behavior of the devices infected, packets were captured while simulating attacks through tools such as NMAP.
Anomalous behavior or attacks affecting IoT devices is another cutting edge field where several datasets have been created and published. In this sense, the N-BaIoT dataset [165] contains more than 7 million vectors, with 115 features each, giving around 20 GB, obtained by processing the network communications of 9 different IoT commercial devices under attack. Vectors contain 11 labels, 10 for different botnet attacks, produced by Mirai and BASHLITE, and 1 for benign traffic. Similarly, the DS2OS dataset [159] contains 61 MB of features obtained from application layer traces collected from simulated IoT devices such as light controllers, thermometers, movement sensors, washing machines, batteries, thermostats, smart doors, and smartphones. This dataset is designed for anomaly detection in IoT node communications. In the same line, the USNW IoT Benign and Attack Traces Dataset [10] monitored network communications of 27 devices for 30 days, being 10 of these devices victims of network attacks such as ARP spoofing, TCP/UDP flooding, and packet reflection. In total, more than 64 GB of data is available. This dataset also provides the source code to derive vectors with 238 features using packet counters and traffic flows. Another relevant dataset is the NGIDS-DS dataset [102], which consists of 6.7 GB of labeled network and device operating system logs collected on a simulated critical infrastructure. The dataset is designed for host-based intrusion detection and contains normal and attack scenarios. The authors used the IXIA Perfect Storm tool to generate a wide variety of network attacks. The data was obtained from a machine running Ubuntu 14.04 and different common services such as Apache. The OS logs contain the date, process id, system call, event id, and the network data consist of raw traffic.
A similar approach was followed to generate the UNSW-NB15 dataset [168]. This dataset contains 100 GB of raw traffic flows and derived features from several attacks launched using IXIA Perfect Storm. This attack set includes the same type of attacks as NGIDS-DS dataset. The Aposemat IoT-23 dataset [180], published in January 2020 by the same team as for CTU-13 [162], is another labeled dataset containing 23 captures of malicious and benign IoT network traffic. Concretely, 20 captures include malware activity, while 3 include normal network activity of 3 IoT device types. The dataset includes 11.3 GB of pcap files and 8.7 GB of network log files. The authors utilized known malware, such as Mirai, Okiru, or Torii botnets, port scanning, DDoS, C&C connections. In the same direction, IoT-KEEPER dataset [55] was published in 2020. This dataset contains 11.8GB of pcap files collected from several IoT devices affected by common attacks such as port scanning, botnet execution, DoS, or malware injection. Besides, it also contains network activity from real computers, replicating a real edge network environment. Finally, LITNET-2020 dataset [181] contains feature vectors generated during 12 attacks on general computers deployed on an academic network. In total, this dataset contains 26.9 GB of vectors with 85 processed flow features extracted using Netflow.
Focused on application layer communications of general computers, ECML-PKDD 2007 [182] and HTTP CSIC 2010 [183] datasets are available. ECML-PKDD 2007 [182] contains 80 MB of application layer requests in XML format. There are 25000 valid and 15000 attack requests, the attack requests include SQL Injection, LDAP Injection, cross-site scripting (XSS), and command execution, among others. The data includes web requests and also context information such as server operating system, services, etc. The HTTP CSIC 2010 dataset [183] includes 56 MB of normal and abnormal HTTP requests. It was published by the Spanish Research National Council (CSIC) to test web application attack protection systems. The dataset is divided into 36000 normal and 25000 anomalous requests. The anomalous requests are divided into three types of attacks: static, dynamic, and unintentional illegal requests. Concretely, static attacks try to gather hidden resources, while dynamic attacks are SQL injections, XSS, etc. This dataset is usually used as benchmark for HTTP anomalous behavior detection solutions.
From the system calls and execution traces perspective, it is worth commenting the ADFA Intrusion Detection Datasets for Linux [96] and Windows [173]. These datasets contain 9 MB of Linux system call identifiers and 13.6 GB of Windows XML system call traces of DLL libraries. Both datasets include normal and attack system calls. Attacks include HydraFTP, HydraSSH, Meterpreter, Webshell, and a poisoned executable. Currently, these are widely used for benchmarking solutions based on system call traces [184, 185]. The Firefox-SD dataset [186] is also based on system calls, but in this case made by Firefox browser in Linux. The dataset contains +1 TB of normal activity traces, collected while executing seven browser testing frameworks, and attack-based traces, generated under attacks using known exploits such as memory consumption, integer overflow, or null pointer exploit.
Dealing with ICSs and anomaly detection, one of the reference datasets is the Secure Water Treatment (SWaT) dataset [169]. This dataset was collected in 2016 from a real water treatment testbed managed by a SCADA system. It contains 11 days of continuous operation, 7 of them normal and 4 under attack by 36 different data injections. This dataset contains 16 GB of traffic logs and 361 MB of measurements obtained from 51 sensors and actuators. Additionally, SWaT dataset was updated in December 2019 with 45 GB of raw traffic and 6 MB of measurement logs, collected during 3 hours of normal traffic and 1 hour in which 6 attacks were launched. Similarly, the Water Distribution (WADI) dataset [170] contains 575 MB of labeled sensor and actuator logs collected in the same water treatment plant. In this case, the dataset contains data from 123 sensors and actuators collected during 16 days of operation, having 14 days of normal traffic and 2 days with 15 data injection attacks launched in total. Also in the ICS field, in [133], Perales et al. developed a dataset called Electra, based on a railway electric traction substation. The monitored network protocols were Modbus TCP and S7Comm, common in SCADA systems. This dataset contains 1.7 GB of derived features originating from raw captures.
Regarding resource usage monitoring, the GWA-T-12 Bitbrains dataset [171] contains performance metrics collected from 1750 virtual machines located in Bitbrains data center. Resource usage metrics are collected in five-minute samples, the monitored resources are the CPU usage, memory usage, disk read/write throughput, and network received/transmitted throughput. In total, 2.7 GB of traces are available, divided into two sets of machines (1250 VMs used for fast storage and 500 with lower performance). Although BEHACOM [187] dataset is focused on user activity monitoring (keyboard and mouse interactions), it also contains resource usage metrics regarding active applications, CPU, and memory. This data was collected from the computers of 12 users over 55 days. In total, this dataset contains 6.1 GB of features derived from user activity. Also dealing with resource usage monitoring but from the mobile devices prism, CIC has released two different datasets on dynamic smartphone behavior and its relationship with malware. The first one is CIC-AAGM (CIC Android Adware and General Malware) [188], which contains +20 GB of traffic flows generated when installing 1900 different applications, being 250 adware, 150 malware, and 1500 benign. The second is InvesAndMal2019 [189] dataset, which includes device status, traffic flows, permissions, API calls, and logs generated by 426 malware and 5065 benign Android applications. In total +275 MB of logs and features are available.
Other existing datasets are more than 20 years old, which makes them outdated with regard to current scenarios. This is the case of DARPA 1998/1999 [190, 191], KDD99 [166], and NSL-KDD [167] datasets. The original datasets, DARPA 1998 and 1999, are composed of 10 GB of network traffic and system logs collected by MIT Lincoln Laboratory. The aim of these datasets was to build a generic evaluation dataset for intrusion detection. 56 different attacks were recorded, including different DoS, buffer overflow, and reconnaissance attacks, among others. The network traces were stored in tcpdump format and the system logs as BSM/NT audit data. Afterward, KDD99 dataset was derived from DARPA traffic by extracting 1.2 GB of features from the traffic flows. Besides, NSL-KDD is a refinement of KDD99 were duplicated entries are deleted and classes are more balanced, reducing the dataset to around 60 MB. These datasets have become some of the most popular datasets for intrusion detection evaluation. However, as commented before, they are outdated compared to current networks and attacks.
| Dataset | Year | Device Type | Data Source | Data | Size | Details |
| DARPA [190, 191] | 1998-1999 | General computers | Network and system logs | Raw network packets and logs (bsm) | 10 GB | Attack and normal network and system activity. One of the most used IDS datasets, but it is outdated. |
| KDD99 [166] | 1999 | General computers | Network | Connection record features | 1.2 GB | Derived features based on DARPA 1998/1999 network traffic. |
| UNM dataset [172] | 1999 | General computers | System calls | System calls and process IDs | 500 KB | System call identifiers collected during normal behavior and under some attacks. |
| ECML-PKDD 2007 [182] | 2007 | Web systems | Network | Requests and contextual information | 80 MB | 25000 valid and 15000 attack XML web queries, including context information such as server OS. |
| NSL-KDD [167] | 2009 | General computers | Network | Connection record features | 60 MB | Based on KDD99 data, but with additional processing like filtering duplicated data. |
| HTTP CSIC 2010 [183] | 2010 | Web systems | Network | HTTP requests | 56 MB | 61000 normal and anomalous HTTP requests. It includes diverse attacks and also unintentional illegal requests. |
| CTU-13 [162] | 2011 | General computers | Network | Raw captures and flows | 700 GB | 13 different scenarios were botnet activity is combined with normal traffic. |
| Firefox-SD [186] | 2013 | Application (Firefox) | System calls | Raw system calls | +1 TB | Firefox browser system calls while normal activity and under different attacks. |
| ADFA-LD [96] | 2013 | General computers | System calls | Linux system logs | 9 MB | System calls collected on 60 different attack sets. |
| ADFA-WD [173] | 2014 | General computers | System calls | XML Windows DLL traces | 13.6 GB | System call dataset composed by virtual kernel calls done by DLL libraries. |
| CIC-ISCX [161] | 2014 | General computers | Network | Raw captures | 13.8 GB | Botnet activity dataset collected from 16 real botnet malware. |
| GWA-T-12 Bitbrains [171] | 2015 | Distributed data centers (Cloud) | Resource usage | CPU, Memory, Disk and Network statistics | 2.7 GB | Performance metrics (CPU, memory, disk and network) collected from 1750 VMs each 5 mins. |
| SWaT [169] | 2016 | ICSs | Network, and sensors/actuators | Network and sensor/actuator logs | 16.3 GB | 7 days of normal activity and 4 days of data injection attacks in a real water treatment testbed. |
| WADI [170] | 2016 | ICSs | Sensors / actuators | Sensor/actuator logs | 575 MB | 16 days of logs of 123 industrial sensors and actuators. 15 attacks launched over 2 days. |
| NGIDS-DS [102] | 2017 | Critical infrastructure | Network and system logs | Raw network packets and audit logs | 6.7 GB | Critical infrastructure attacks simulated on an Ubuntu 14.04 machine using IXIA PerfectStorm tool. |
| UNSW-NB15 [168] | 2017 | General computers | Network | Raw captures and processed features | 100 GB | IDS dataset, attacks generated using IXIA PerfectStorm tool. |
| CIC-IDS 2017[160] | 2017 | General computers | Network | Raw captures and processed features | 51.1 GB | IDS dataset based on 25 users activity, it contains common network attacks. |
| CIC-AAGM [188] | 2017 | Mobile devices | Network | Raw captures and processed features | +20 GB | Flows generated by 1900 different applications (250 adware, 150 malware, 1500 benign). |
| DS2OS [159] | 2018 | IoT devices | Network | Application traces | 61 MB | IoT smart home devices normal and abnormal activity. |
| N-BaIoT [165] | 2018 | IoT devices | Network | Processed features | 20 GB | Botnet (Mirai and BASHLITE) activity collected from 9 IoT devices. |
| CIC-IDS 2018 [160] | 2018 | General computers | Network | Raw captures and processed features | 220 GB | IDS dataset collected in 500 devices which contain common network attacks. |
| Smart-Detection [73] | 2019 | General computers | Network | Processed features | 40 MB | DoS detection based on previous datasets (CIC-DoS, CIC-IDS 2017 and CIC-IDS 2018). |
| ELECTRA [133] | 2019 | ICSs | Network | Processed features | 1.7 GB | Data collected from attacks to an electric traction system. |
| USNW IoT Benign and Attack Traces [10] | 2019 | IoT devices | Network | Raw captures and processed features | +64 GB | IoT benign and attack network traces. Attacks include ARP spoofing, TCP/UDP flooding and packet reflection. |
| IoT network intrusion dataset [179] | 2019 | IoT devices | Network | Raw captures | 1.5 GB | Network captures of real and simulated attacks to IoT and non-IoT devices. |
| InvesAndMal2019 [189] | 2019 | Mobile devices | System logs and Network | Processed logs and features | +275 MB | Device status, traffic flows, API calls and logs generated from +5500 apps (426 malware and 5065 benign). |
| BEHACOM [187] | 2020 | General computers | Resource usage | CPU and memory statistics | 6.1 GB | Active application, CPU and memory statistics collected from 12 users over 55 days. |
| IoT-23 [180] | 2020 | IoT devices | Network | Raw captures | 20 GB | By the same team that CTU-13. 20 attack and 3 benign traces. Attacks simulated using infected Raspberry Pis. |
| IoT-KEEPER dataset [55] | 2020 | IoT devices | Network | Raw captures | 11.8 GB | Network captures collected from IoT devices under common attacks. |
| LITNET-2020 [181] | 2020 | General Computers | Network | Processed features | 26.9 GB | Dataset collected on an academic network under 12 different attacks. |
The same issue occurs with the system call dataset of the University of New Mexico (UNM) [172]. This dataset was collected in 1999 and contains 500 kB of system call and process identifiers. The collected system calls contain normal activity and different attacks such as buffer overflows and trojans. This dataset has been widely used as benchmark for system call anomalies-based attack detectors [111]. However, the system call arguments are not available and it is outdated regarding modern attacks.
TABLE XI gives an overview of the public datasets with focus on behavior anomaly and attack detection. It can be appreciated how most of the datasets are focused on network, followed by system calls and logs. The datasets monitoring the previous sources are varied and cover several device types such as IoT, ICSs, mobile devices, or general computers. However, other sources such as resource usage or HPCs are under-exploited regarding public datasets for anomaly detection. Datasets monitoring IoT device communications during attack and malware execution have gained importance for the last years and nowadays are the dominant type of anomalous behavior datasets. The most common IoT malware families, such as Mirai botnet, have been largely monitored from a network-based perspective in datasets such as CTU, USNW IoT Traces or IoT-23. However, there is no IoT-based dataset containing in-device behavior sources, something highly useful for modeling how malware works and what changes occur within the device functioning itself.
Figure 6 shows the dataset distribution regarding main application scenarios and behavior source collected, and their publication year. Note that some datasets can contain several sources at the same time, for example, network communications and system logs. As final section thoughts, we notice that when it comes to developing a behavior evaluation solution, a key aspect is data availability, as the underlying solutions depend on it. Many works utilize self-collected private datasets to validate their approaches. However, to have a proper performance comparison, it is worth having public datasets allowing to cross-verify the proposed solutions. Furthermore, some teams do not have enough resources to collect enough data but have good processing and evaluation ideas. Therefore, having public datasets is essential to make diverse and well-performing behavior-based proposals possible.
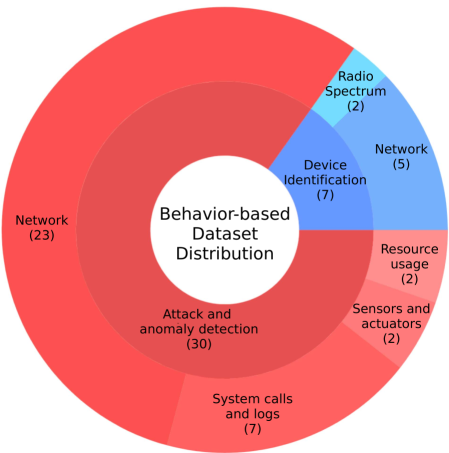
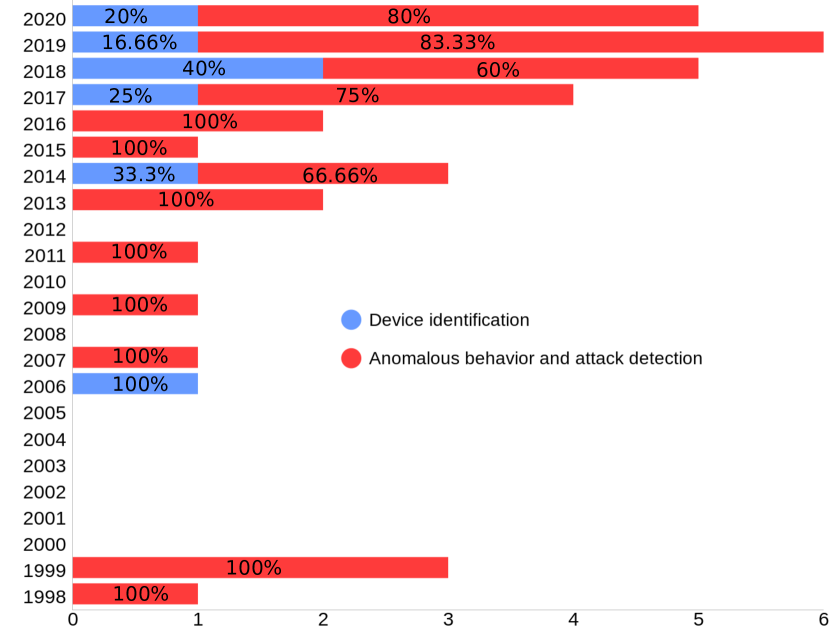
VII Lessons Learned, Trends and Challenges
Based on the different aspects of behavior fingerprinting analyzed through questions Q1-Q4, this section responds Q5 (How have application scenarios evolved for the last years?). To this end, it summarizes the main lessons learned, trends, and open challenges extracted from the present study of device behavior fingerprinting.
VII-A Lessons Learned
After reviewing and analyzing the state-of-the-art, we were able to identify the following main lessons:
Network communications are the most exploited source. As Figure 5 shows, it is utilized in 85% of works focused on device models or type identification, and in 54.28% of attack detection solutions. However, this source is less exploited in individual device identification (8.33% of the solutions) and malfunction detection (15.38%). This is because the data obtained from the network communication perspective is not sensitive enough as required for these scenarios, e.g., two devices of the same model deployed with the same purpose will have almost identical network communications.
Clustering is widely applied for inferring classes. As TABLE VI shows, in device type or model identification approaches, many solutions combine unlabeled data with clustering to group data samples and derive device classes, and then apply ML/DL classification approaches. Besides, some attack and malfunction detection techniques also rely on this approach (see TABLE VIII and TABLE IX). This fact shows the viability of clustering techniques for deriving classes from unlabeled behavioral data.
ML and DL are the favorite approaches for both classification and anomaly detection. TABLE VI, VII, VIII, and IX show that ML and DL are the main solutions applied for data processing, no matter if the objective is classification (of device types/models or attacks) or anomaly detection, either to detect attacks or faults. This fact shows the enormous flexibility and capabilities of these techniques inferring complex data patterns, outperforming traditional processing methods.
Individual device identification is one of the most complex application scenarios. Only some lower-level features, such as system clocks, code execution time, clock skew, or electromagnetic signals are sensitive enough to detect minimum physical differences that occurred during the device manufacturing processes. Thus, these are the ones required for individual identification. However, the monitoring of these sources is usually complex.
There is no consensus in misbehavior detection solutions. As TABLE VIII and IX show, attack and malfunction detection is addressed from heterogeneous perspectives. The selection of data sources and processing techniques depends on the type of anomalies that will be detected. Although network is the most used source, many solutions use system calls and logs, hardware events, or resource usage.
Public datasets are mainly focused on network, system calls, and logs. Figure 6 shows that there are 35 datasets containing these sources (note that some datasets contain both sources at the same time, so they are counted both as network and calls/logs source). Moreover, TABLE X and XI show that in most cases the datasets contain raw data instead of processed information or features.
VII-B Current Trends
The main approaches expected in future works, based on the evolution of the proposals published in recent years, are:
ML and DL algorithms are gaining prominence. As Figure 4 shows, ML and DL are the most usual techniques, with 46.39% of importance (note that many solutions utilize different techniques). In addition, DL-based techniques are gaining more importance, especially for time series processing, due to their performance handling raw data without pre-calculated features. TABLE VI, VII, VIII, and IX show that in both behavior fingerprinting scenarios (identification and misbehavior detection), ML and DL approaches are gaining importance in the last years. Overall, ML and DL algorithms are applied in the 71.87% of identification and in the 62.5% of misbehavior detection solutions.
Statistical and knowledge-based algorithms relegation. As Figure 4 shows, processing and evaluation techniques based on statistical and knowledge-based algorithms are losing importance as evaluation approaches, in favor of ML and DL trend.
IoT and ML/DL convergence. In modern IoT scenarios where devices are massively deployed, behavior fingerprinting is critical management solution, grouping similar devices and detecting faults. ML and DL techniques are the best alternative when it comes to leverage the vast amount of data generated with the required performance and adaptability. This fact can be observed in the solution comparisons located in TABLE VI, VII, VIII, and IX.
Dataset publication. As it can be appreciated in Figure 6 and in TABLE X and TABLE XI, a good number of datasets have been published for the last years. In the last five years (2016-2020), 23 public datasets were released, while in the previous five years (2011-2015) were only 7. This trend is influenced by the AI explosion, as ML and DL are powered by datasets.
Attack detection and model identification are the prominent application scenarios. Figure 5 shows how attack detection and type or model identification solutions have been gaining prominence in the last years, increasing from 50% in 2017 to 85.71% in 2020. This trend is a direct consequence of the explosion in IoT deployments, as new requirements rise associated with the heterogeneous variety of devices and the new security issues generated by them.
VII-C Future Challenges
Based on the current state-of-the-art, the following points represent the main challenges that future behavior fingerprinting solutions might consider to enhance current solutions.
Usage of public datasets for behavior-based solution performance comparison. Many solutions are based on private datasets, which makes it difficult, if not impossible, to compare performance between different solutions. Among the solutions analyzed, only 45% of device model/type identification used public datasets. The same goes for the 16.66% about individual device identification, 42.85% tackling attacks, and 7.69% concerning malfunction detection, by using public datasets. Thus, a right direction for future approaches is to evaluate and compare their performance through public datasets.
Diverse and quality behavior dataset publication. Regarding device identification, the main publicly available datasets are focused on the network communications source. However, there is a lack of modern and variate datasets based on other sources. Then, it would be interesting for novel proposals addressing behavioral fingerprinting to publish the collected datasets, if any. Besides, datasets should have enough quality to ensure that research results are not influenced or damaged by low-quality data.
Solution scalability regarding the number of monitored devices and deployment architecture. Scalability is an issue that affects various aspects of behavior monitoring solutions. Many solutions covering individual device identification have detected that the number of devices is a challenge [61, 74, 63]. The more devices in the scenario, the worse classification results. Furthermore, centralized deployments may suffer if too many devices send behavioral data, or blockchain-based solutions may suffer block validation issues. Finally, during data evaluation, solutions based on statistical approaches that require one to one evaluation [94] may not scale at all when the number of devices increases.
Define anomaly countermeasures to apply when an attack or fault is detected. Many solutions solve the misbehavior detection problem, both when it is caused by a cyberattack or a system fault. However, most solutions do not propose any countermeasure [192] to mitigate the detected misbehavior. Only a few works propose some remedies for misbehavior, such as [7, 92].
Secure the behavior monitoring and analysis process against attacks. The fingerprinting solutions can suffer attacks or modifications performed by malicious entities. This fact can jeopardize the entire fingerprinting mechanism, and in the case of centralized processing solutions, even affect other device behavior evaluation. However, few works took behavior monitoring security into account [90]. To solve this issue, additional security mechanisms, such as encryption, should be added to current solutions. Besides, there is an emerging area on adversarial attacks to ML/DL models that should also be considered in future solutions [193]. Finally, trust frameworks [194] can be included in behavior monitoring deployments to guarantee system safety.
Private device model and type to guarantee security. In some circumstances, like when there are known vulnerabilities, the model and type of devices should be private to avoid targeted attacks [195]. It has been demonstrated how privacy leakage attacks can be used to identify device model and type [196, 197] and further countermeasures, such as dummy traffic generation are required. In this context, there is a growing research area on device privacy enhancement [198] working in different solutions such as blocking traffic, concealing DNS, tunneling traffic, and shaping and injecting traffic.
User’s privacy impact and awareness. Device behavior analysis can be leveraged to perform users’ activity tracking and behavior monitoring [199]. The inference of users’ activity has been demonstrated possible by behavior analysis [200] in health care and smart home IoT environments, even with encrypted traffic [201]. As an example, the TV channels watched by a given subject have been inferred in [202]. Therefore, manufacturers and service providers should include solutions to improve users privacy and defend them against activity inference attacks. These solutions are aligned with the ones commented in the previous challenge, as they can cover both user and device privacy at the same time.
Guarantee behavioral data and model privacy. As in user behavior, data and model privacy is a crucial aspect to consider when performing data analysis. From an ethical perspective, behavior analysis solutions should be employed to fingerprint devices in a non-intrusive way. However, privacy laws, such as GDPR [203] in Europe, are mainly focused on user perspective, leaving some device behavior fingerprinting methods out of their scope. To solve this problem, privacy-preserving solutions, such as federated learning [114] combined with differential privacy [204], allow training ML/DL models that ensure data privacy.
Apply novel ML/DL approaches for behavior processing and evaluation. As ML and DL are fast-evolving fields, some recent techniques have not been applied yet. For example, UMAP [205] for dimensionality reduction, or XGBoost [206] for classification, could improve current solution performance. Besides, DL architectures may combine convolutional and recurrent neuron layers for DL-based time series processing [207, 208]. Finally, any of the analyzed solutions addressed an approach based on Reinforcement learning [209], which has gained notable relevance in communications and networking areas [210], and human behavior analysis [211].
Consider ML/DL models behavior in the device analysis. Nowadays, devices usually include embedded ML and DL models that perform specific tasks with the data the device manipulates. However, the ML and DL models deployed on the devices have their own behavior [212], which influences the general device behavior. Then, understanding AI-powered applications and services is critical to identify the device behavior and its anomalies.
VIII Conclusions
Device behavior fingerprinting has been determined in recent years as a promising solution to identify devices with different granularity levels, as well as to detect misbehavior originated by cyberattacks or faulty components. The article at hand studies the evolution of the device behavior research field, performing a comprehensive review of the devices, behavioral sources, datasets, and techniques used in both application scenarios. In this context, the present work has been performed with the goal of answering the following research questions.
Q1. Which scenarios, device types, and sources are present in behavior-based solutions? Section III reviews how these three aspects are used in the most recent and representative works of the literature. The performed analysis shows a relevant heterogeneity of device types and behavioral sources in the existing solutions, and highlights the usage of network communications in the majority of the solutions.
Q2. What and how behavior processing and evaluation tasks are used in each scenario? Section IV analyzes the main techniques and algorithms –rule-based, statistical, knowledge-based, ML and DL, and time-series approaches– used by works dealing with device and misbehavior identification. The analysis results show how ML and DL-based approaches are gaining importanc due to their versatility and excellent performance when enough training data is available, and to the detriment of statistical and knowledge-based solutions.
Q3. What characteristics do the most recent and representative solutions of each application scenario have? In the core section of this article, Section V, the reviewed solutions are described, analyzed, and compared according to their application scenario, device types, sources, techniques, and results. Regarding sources, this section shows that in device type or model identification solutions, network source is the dominant approach. In individual device identification, clock skew and electromagnetic signals are the main data sources. Attack detection is also mainly tackled using network communications. In contrast, for fault detection, the main approach is to utilize resource usage data. In terms of processing and evaluation techniques, ML and DL techniques are dominant in all the considered scenarios.
Q4. Which behavior datasets are available and which are their characteristics? In Section VI, the main public datasets containing device behavioral data are analyzed according to their application scenario. It also details the characteristics of the data they contain and how they were collected. This section shows the prominence of network source in the current public datasets, and the lack of other sources such as resource usage or hardware events.
Q5. How have application scenarios evolved for the last years? Lessons learned, current trends, and future challenges have been drawn in Section VII, which details how network source and ML/DL algorithms are gaining prominence. Furthermore, it is also remarkable that novel ML/DL approaches, such as recurrent and convolutional neuron layer combination or Reinforcement learning, have not yet been applied in the area, which opens up pathways for future research. It also depicts how dataset publication is gaining importance during the last years; however, more relevant datasets are still required for sources and devices that are not covered in recent ones, e.g., resource usage or system logs in IoT devices or ICSs.
Aligned with the current trend and challenges drawn in this work, we will focus our next efforts on designing and implementing scalable behavior-based solutions to identify individual devices and detect cyberattacks affecting IoT devices. In both scenarios, we plan to utilize privacy-preserving ML and DL techniques, such as distributed and federated learning, to protect behavioral data while guaranteeing performance capabilities. Finally, we plan to build datasets for both scenarios, which will be publicly accessible to improve current dataset diversity and quality.
Acknowledgment
This work has been partially supported by the Swiss Federal Office for Defence Procurement (armasuisse) (project codes Aramis R-3210/047-31 and CYD-C-2020003).
References
- [1] K. Riad, T. Huang, and L. Ke. A dynamic and hierarchical access control for IoT in multi-authority cloud storage. Journal of Network and Computer Applications, 160:102633, 2020.
- [2] A. Fuentes. Human niche, human behaviour, human nature. Interface Focus, 7(5):20160136, 2017.
- [3] N. Shone, Q. Shi, M. Merabti, and K. Kifayat. Misbehaviour monitoring on system-of-systems components. In 2013 International Conference on Risks and Security of Internet and Systems, pages 1–6, Oct. 2013.
- [4] A. Sivanathan, H. H. Gharakheili, F. Loi, A. Radford, C. Wijenayake, A. Vishwanath, and V. Sivaraman. Classifying IoT devices in smart environments using network traffic characteristics. IEEE Transactions on Mobile Computing, 18(8):1745–1759, 2019.
- [5] A. Sivanathan, H. H. Gharakheili, and V. Sivaraman. Detecting behavioral change of IoT devices using clustering-based network traffic modeling. IEEE Internet of Things Journal, pages 1–1, 2020.
- [6] S. Marchal, M. Miettinen, T. D. Nguyen, A. Sadeghi, and N. Asokan. AuDI: Toward autonomous IoT device-type identification using periodic communication. IEEE Journal on Selected Areas in Communications, 37(6):1402–1412, 2019.
- [7] K. Haefner and I. Ray. ComplexIoT: Behavior-based trust for IoT networks. In 1st IEEE International Conference on Trust, Privacy and Security in Intelligent Systems and Applications, pages 56–65, Dec. 2019.
- [8] G. Manco, E. Ritacco, P. Rullo, L. Gallucci, W. Astill, D. Kimber, and M. Antonelli. Fault detection and explanation through big data analysis on sensor streams. Expert Systems with Applications, 87:141–156, 2017.
- [9] R. Ferrando and P. Stacey. Classification of device behaviour in internet of things infrastructures: Towards distinguishing the abnormal from security threats. In 1st International Conference on Internet of Things and Machine Learning, pages 1–7, Oct. 2017.
- [10] A. Hamza, H. H. Gharakheili, T. A. Benson, and V. Sivaraman. Detecting volumetric attacks on IoT devices via SDN-based monitoring of MUD activity. In 2019 ACM Symposium on SDN Research, pages 36–48, Apr. 2019.
- [11] R. Ravichandiran, H. Bannazadeh, and A. Leon-Garcia. Anomaly detection using resource behaviour analysis for autoscaling systems. In 4th IEEE Conference on Network Softwarization and Workshops, pages 192–196, June 2018.
- [12] M. Miettinen, S. Marchal, I. Hafeez, T. Frassetto, N. Asokan, A. Sadeghi, and S. Tarkoma. IoT Sentinel: Automated device-type identification for security enforcement in IoT. In 37th IEEE International Conference on Distributed Computing Systems, pages 2511–2514, June 2017.
- [13] V. Selis and A. Marshall. A classification-based algorithm to detect forged embedded machines in IoT environments. IEEE Systems Journal, 13(1):389–399, 2018.
- [14] H. Jafari, O. Omotere, D. Adesina, H. Wu, and L. Qian. IoT devices fingerprinting using deep learning. In 2018 IEEE Military Communications Conference, pages 1–9, Oct. 2018.
- [15] T. D. Nguyen, S. Marchal, M. Miettinen, H. Fereidooni, N. Asokan, and A. Sadeghi. DÏot: A federated self-learning anomaly detection system for IoT. In 39th IEEE International Conference on Distributed Computing Systems, pages 756–767, July 2019.
- [16] A. Samir and C. Pahl. Detecting and localizing anomalies in container clusters using Markov models. Electronics, 9(1):64, 2020.
- [17] X. Liu, B. Xiao, S. Zhang, and K. Bu. Unknown tag identification in large RFID systems: An efficient and complete solution. IEEE Transactions on Parallel and Distributed Systems, 26(6):1775–1788, 2014.
- [18] J. Ortiz, C. Crawford, and F. Le. DeviceMien: Network device behavior modeling for identifying unknown IoT devices. In International Conference on Internet of Things Design and Implementation, page 106–117, Apr. 2019.
- [19] P. Mishra, E. S. Pilli, V. Varadharajan, and U. Tupakula. Intrusion detection techniques in cloud environment: A survey. Journal of Network and Computer Applications, 77:18–47, 2017.
- [20] D. Li, D. Chen, B. Jin, L. Shi, J. Goh, and S. K. Ng. MAD-GAN: Multivariate anomaly detection for time series data with generative adversarial networks. In 28th International Conference on Artificial Neural Networks, pages 703–716, Sept. 2019.
- [21] S. Barbhuiya, Z. Papazachos, P. Kilpatrick, and D. S. Nikolopoulos. RADS: Real-time anomaly detection system for cloud data centres, 2018. Available: arXiv:1811.04481.
- [22] Q. Xu, R. Zheng, W. Saad, and Z. Han. Device fingerprinting in wireless networks: Challenges and opportunities. IEEE Communications Surveys & Tutorials, 18(1):94–104, 2016.
- [23] G. Baldini and G. Steri. A survey of techniques for the identification of mobile phones using the physical fingerprints of the built-in components. IEEE Communications Surveys & Tutorials, 19(3):1761–1789, 2017.
- [24] M. Liu, Z. Xue, X. Xu, C. Zhong, and J. Chen. Host-based intrusion detection system with system calls: Review and future trends. ACM Computing Surveys, 51(5):1–36, 2018.
- [25] M. F. Elrawy, A. I. Awad, and H. F. A. Hamed. Intrusion detection systems for IoT-based smart environments: A survey. Journal of Cloud Computing, 7(1):21, 2018.
- [26] A. Khraisat, I. Gondal, P. Vamplew, and J. Kamruzzaman. Survey of intrusion detection systems: Techniques, datasets and challenges. Cybersecurity, 2(1):20, 2019.
- [27] J. Hou, Y. Li, J. Yu, and W. Shi. A survey on digital forensics in internet of things. IEEE Internet of Things Journal, 7(1):1–15, 2019.
- [28] W. Tounsi and H. Rais. A survey on technical threat intelligence in the age of sophisticated cyber attacks. Computers & Security, 72:212–233, 2018.
- [29] P. Oser, F. Kargl, and S. Lüders. Identifying devices of the internet of things using machine learning on clock characteristics. In 11th International Conference and Satellite Workshops on Security, Privacy, and Anonymity in Computation, Communication, and Storage, pages 417–427, Dec. 2018.
- [30] S. Dong, F. Farha, S. Cui, J. Ma, and H. Ning. CPG-FS: A CPU performance graph based device fingerprint scheme for devices identification and authentication. In 4th IEEE Cyber Science and Technology Congress, pages 266–270, Aug. 2019.
- [31] A. Majma’ah and S. Arabia. A systematic literature review of behavioural profiling for smartphone security: Challenges and open problems. International Journal for Information Security Research, 7:734–743, 2017.
- [32] J. M. Jorquera Valero, P. M. Sánchez Sánchez, L. Fernández Maimó, A. Huertas Celdrán, M. Arjona Fernández, S. De Los Santos Vílchez, and G. Martínez Pérez. Improving the security and QoE in mobile devices through an intelligent and adaptive continuous authentication system. Sensors, 18(11):3769, 2018.
- [33] P. M. Sánchez Sánchez, A. Huertas Celdrán, L. Fernández Maimó, and G. Martínez Pérez. AuthCODE: A privacy-preserving and multi-device continuous authentication architecture based on machine and deep learning, 2020. Available: arXiv:2004.07877.
- [34] J. Ali, A. S. Khalid, E. Yafi, S. Musa, and W. Ahmed. Towards a secure behavior modeling for IoT networks using Blockchain, 2020. Available: arXiv:2001.01841.
- [35] M. B. Attia, C. Talhi, A. Hamou-Lhadj, B. Khosravifar, V. Turpaud, and M. Couture. On-device anomaly detection for resource-limited systems. In 30th Annual ACM Symposium on Applied Computing, page 548–554, Apr. 2015.
- [36] T. Wang, J. Xu, W. Zhang, Z. Gu, and H. Zhong. Self-adaptive cloud monitoring with online anomaly detection. Future Generation Computer Systems, 80:89–101, 2018.
- [37] J. P. Robinson and M. Kestnbaum. The personal computer, culture, and other uses of free time. Social Science Computer Review, 17(2):209–216, 1999.
- [38] Q. Jabeen, F. Khan, M. N. Hayat, H. Khan, S. R. Jan, and F. Ullah. A survey: Embedded systems supporting by different operating systems, 2016. Available: arXiv:1610.07899.
- [39] H. Holm, M. Karresand, A. Vidström, and E. Westring. A survey of industrial control system testbeds. In 20th Nordic Conference on Secure IT Systems, pages 11–26, Oct. 2015.
- [40] J. A. Gomez Gomez. Survey of SCADA systems and visualization of a real life process. Linköping University, Department of Electrical Engineering, LITH-ISY-EX-ET-0246-2002, 83, 2002.
- [41] J. W. Rittinghouse and J. F. Ransome. Cloud computing: Implementation, management, and security. CRC press, 2016.
- [42] O. Osanaiye, S. Chen, Z. Yan, R. Lu, K. K. R. Choo, and M. Dlodlo. From cloud to fog computing: A review and a conceptual live VM migration framework. IEEE Access, 5:8284–8300, 2017.
- [43] W. Shi, J. Cao, Q. Zhang, Y. Li, and L. Xu. Edge computing: Vision and challenges. IEEE Internet of Things Journal, 3(5):637–646, 2016.
- [44] M. S. Bonfim, K. L. Dias, and S. F. L. Fernandes. Integrated NFV/SDN architectures: A systematic literature review. ACM Computing Surveys, 51(6):1–39, 2019.
- [45] M. K. Shin, K. H. Nam, and H. J. Kim. Software-defined networking (SDN): A reference architecture and open APIs. In 2012 International Conference on ICT Convergence, pages 360–361, Oct. 2012.
- [46] R. Mijumbi, J. Serrat, J. L. Gorricho, N. Bouten, F. De Turck, and R. Boutaba. Network function virtualization: State-of-the-art and research challenges. IEEE Communications Surveys & Tutorials, 18(1):236–262, 2015.
- [47] C. Pahl and P. Jamshidi. Microservices: A systematic mapping study. In 6th International Conference on Cloud Computing and Services Science, pages 137–146, Apr. 2016.
- [48] A. Vrenios. Linux cluster architecture. Sams, 2002.
- [49] F. Schmidt, F. Suri-Payer, A. Gulenko, M. Wallschläger, A. Acker, and O. Kao. Unsupervised anomaly event detection for cloud monitoring using online Arima. In 2018 IEEE/ACM International Conference on Utility and Cloud Computing Companion, pages 71–76, Dec. 2018.
- [50] T. J. OConnor, R. Mohamed, M. Miettinen, W. Enck, B. Reaves, and A. R. Sadeghi. HomeSnitch: Behavior transparency and control for smart home IoT devices. In 12th Conference on Security and Privacy in Wireless and Mobile Networks, pages 128–138, May 2019.
- [51] V. Thangavelu, D. M. Divakaran, R. Sairam, S. S. Bhunia, and M. Gurusamy. DEFT: A distributed IoT fingerprinting technique. IEEE Internet of Things Journal, 6(1):940–952, 2019.
- [52] B. Bezawada, M. Bachani, J. Peterson, H. Shirazi, I. Ray, and I. Ray. IoTSense: Behavioral fingerprinting of IoT devices, 2018. Available: arXiv:1804.03852.
- [53] N. Msadek, R. Soua, and T. Engel. IoT device fingerprinting: Machine learning based encrypted traffic analysis. In 2019 IEEE Wireless Communications and Networking Conference (WCNC), pages 1–8. IEEE, 2019.
- [54] R. Dai, C. Gao, B. Lang, L. Yang, H. Liu, and S. Chen. SSL malicious traffic detection based on multi-view features. In Proceedings of the 2019 the 9th International Conference on Communication and Network Security, pages 40–46, 2019.
- [55] I. Hafeez, M. Antikainen, Aaron Y. Ding, and S. Tarkoma. IoT-KEEPER: Detecting malicious IoT network activity using online traffic analysis at the edge. IEEE Transactions on Network and Service Management, 17(1):45–59, 2020.
- [56] A. Blaise, M. Bouet, V. Conan, and S. Secci. BotFP: Fingerprints clustering for bot detection. In IEEE/IFIP Network Operations and Management Symposium, pages 1–7, Apr. 2020.
- [57] G. Spanos, K. M. Giannoutakis, K. Votis, and D. Tzovaras. Combining statistical and machine learning techniques in IoT anomaly detection for smart homes. In 24th IEEE International Workshop on Computer Aided Modeling and Design of Communication Links and Networks, pages 1–6, Sept. 2019.
- [58] L. Polčák and B. Franková. On reliability of clock-skew-based remote computer identification. In 11th International Conference on Security and Cryptography, pages 1–8, Aug. 2014.
- [59] T. Kohno, A. Broido, and K. C. Claffy. Remote physical device fingerprinting. IEEE Transactions on Dependable and Secure Computing, 2(2):93–108, 2005.
- [60] S. Jana and S. K. Kasera. On fast and accurate detection of unauthorized wireless access points using clock skews. IEEE Transactions on Mobile Computing, 9(3):449–462, 2009.
- [61] F. Lanze, A. Panchenko, B. Braatz, and A. Zinnen. Clock skew based remote device fingerprinting demystified. In 2012 IEEE Global Communications Conference, pages 813–819, Dec. 2012.
- [62] S. Sharma, A. Hussain, and H. Saran. Experience with heterogenous clock-skew based device fingerprinting. In 2012 Workshop on Learning from Authoritative Security Experiment Results, pages 9–18, July 2012.
- [63] L. Polcák and B. Franková. Clock-skew-based computer identification: Traps and pitfalls. Journal of Universal Computer Science, 21(9):1210–1233, 2015.
- [64] M. Ezuma, F. Erden, C. K. Anjinappa, O. Ozdemir, and I. Guvenc. Detection and classification of uavs using rf fingerprints in the presence of wi-fi and bluetooth interference. IEEE Open Journal of the Communications Society, 1:60–76, 2019.
- [65] M. F. Al-Sa’d, A. Al-Ali, A. Mohamed, T. Khattab, and A. Erbad. Rf-based drone detection and identification using deep learning approaches: An initiative towards a large open source drone database. Future Generation Computer Systems, 100:86–97, 2019.
- [66] Mhd S. Allahham, T. Khattab, and A. Mohamed. Deep learning for rf-based drone detection and identification: A multi-channel 1-d convolutional neural networks approach. In 2020 IEEE International Conference on Informatics, IoT, and Enabling Technologies (ICIoT), pages 112–117. IEEE, 2020.
- [67] Sanjoy Basak, Sreeraj Rajendran, Sofie Pollin, and Bart Scheers. Drone classification from rf fingerprints using deep residual nets, 2020.
- [68] S. Riyaz, K. Sankhe, S. Ioannidis, and K. Chowdhury. Deep learning convolutional neural networks for radio identification. IEEE Communications Magazine, 56(9):146–152, 2018.
- [69] S. Rajendran, W. Meert, V. Lenders, and S. Pollin. Unsupervised wireless spectrum anomaly detection with interpretable features. IEEE Transactions on Cognitive Communications and Networking, 5(3):637–647, 2019.
- [70] Y. Cheng, X. Ji, J. Zhang, W. Xu, and Y. C. Chen. DeMiCPU: Device fingerprinting with magnetic signals radiated by CPU. In 2019 ACM SIGSAC Conference on Computer and Communications Security, page 1149–1170, Nov. 2019.
- [71] D. Formby, P. Srinivasan, A. Leonard, J. Rogers, and R. A. Beyah. Who’s in control of your control system? Device fingerprinting for cyber-physical systems. In 2016 Network and Distributed System Security Symposium, pages 1–15, Feb. 2016.
- [72] A. Amouri, V. T. Alaparthy, and S. D. Morgera. Cross layer-based intrusion detection based on network behavior for IoT. In 19th IEEE Wireless and Microwave Technology Conference, pages 1–4, Apr. 2018.
- [73] F. S. D. Lima Filho, F. A. Silveira, A. B. R. de Medeiros, G. Vargas-Solar, and L. F. Silveira. Smart detection: An online approach for DoS/DDoS attack detection using machine learning. Security and Communication Networks, 2019:1574749, 2019.
- [74] S. V. Radhakrishnan, A. S. Uluagac, and R. Beyah. GTID: A technique for physical device and device type fingerprinting. IEEE Transactions on Dependable and Secure Computing, 12(5):519–532, 2014.
- [75] M. R. Shahid, G. Blanc, Z. Zhang, and H. Debar. IoT devices recognition through network traffic analysis. In 2018 IEEE International Conference on Big Data, pages 5187–5192, Dec. 2018.
- [76] J. Kotak and Y. Elovici. IoT device identification using deep learning, 2020. Available: arXiv:2002.11686.
- [77] S. A. Hamad, W. E. Zhang, Q. Z. Sheng, and S. Nepal. IoT device identification via network-flow based fingerprinting and learning. In 18th IEEE International Conference On Trust, Security And Privacy In Computing And Communications/13th IEEE International Conference On Big Data Science And Engineering, pages 103–111, Aug. 2019.
- [78] Y. Meidan, M. Bohadana, A. Shabtai, M. Ochoa, N. O. Tippenhauer, J. D. Guarnizo, and Y. Elovici. Detection of unauthorized IoT devices using machine learning techniques. arXiv preprint arXiv:1709.04647, 2017.
- [79] L. F. Carvalho, T. Abrão, L. S. Mendes, and M. L. Proença Jr. An ecosystem for anomaly detection and mitigation in software-defined networking. Expert Systems with Applications, 104:121–133, 2018.
- [80] Y. Afek, A. Bremler-Barr, D. Hay, R. Goldschmidt, L. Shafir, G. Avraham, and A. Shalev. NFV-based IoT security for home networks using MUD. In 2020 IEEE/IFIP Network Operations and Management Symposium, pages 1–9, Apr. 2020.
- [81] B. J. Radford, B. D. Richardson, and S. E. Davis. Sequence aggregation rules for anomaly detection in computer network traffic, 2018. Available: arXiv:1805.03735.
- [82] C. Yin, Y. Zhu, S. Liu, J. Fei, and H. Zhang. An enhancing framework for botnet detection using generative adversarial networks. In 2018 International Conference on Artificial Intelligence and Big Data, pages 228–234, May 2018.
- [83] N. Marir, H. Wang, G. Feng, B. Li, and M. Jia. Distributed abnormal behavior detection approach based on deep belief network and ensemble SVM using Spark. IEEE Access, 6:59657–59671, 2018.
- [84] R. Trimananda, J. Varmarken, Markopoulou A., and Demsky B. Packet-level signatures for smart home devices. In 27th Annual Network and Distributed System Security Symposium, NDSS 2020, San Diego, California, USA, February 23-26, 2020. The Internet Society, 2020.
- [85] R. Perdisci, T. Papastergiou, O. Alrawi, and M. Antonakakis. IoTFinder: Efficient large-scale identification of IoT devices via passive dns traffic analysis. In 2020 IEEE European Symposium on Security and Privacy (EuroS&P), pages 474–489. IEEE, 2020.
- [86] J. Choi, H. Jeoung, J. Kim, Y. Ko, W. Jung, H. Kim, and J. Kim. Detecting and identifying faulty IoT devices in smart home with context extraction. In 48th Annual IEEE/IFIP International Conference on Dependable Systems and Networks, pages 610–621, June 2018.
- [87] T. Yu, Y. Sun, S. Nanda, V. Sekar, and S. Seshan. RADAR: A robust behavioral anomaly detection for IoT devices in enterprise networks. Technical Report CMU-CyLab-19-003, Carnegie Mellon University, 2019.
- [88] M. Hasan, Md. M. Islam, Md. I. I. Zarif, and M. M. A. Hashem. Attack and anomaly detection in IoT sensors in IoT sites using machine learning approaches. Internet of Things, 7:100059, 2019.
- [89] J. Pacheco and S. Hariri. Anomaly behavior analysis for IoT sensors. Transactions on Emerging Telecommunications Technologies, 29(4):e3188, 2018.
- [90] X. Wang, C. Konstantinou, M. Maniatakos, and R. Karri. Confirm: Detecting firmware modifications in embedded systems using hardware performance counters. In 2015 IEEE/ACM International Conference on Computer-Aided Design, pages 544–551, Nov. 2015.
- [91] K. Ott and R. Mahapatra. Continuous authentication of embedded software. In 18th IEEE International Conference On Trust, Security And Privacy In Computing And Communications/13th IEEE International Conference On Big Data Science And Engineering, pages 128–135, Aug. 2019.
- [92] T. Golomb, Y. Mirsky, and Y. Elovici. CIoTA: Collaborative IoT anomaly detection via blockchain, 2018. Available: arXiv:1803.03807.
- [93] T. J. Salo. Multi-factor fingerprints for personal computer hardware. In MILCOM 2007-IEEE Military Communications Conference, pages 1–7, Oct. 2007.
- [94] I. Sanchez-Rola, I. Santos, and D. Balzarotti. Clock around the clock: Time-based device fingerprinting. In 2018 ACM SIGSAC Conference on Computer and Communications Security, pages 1502–1514, Jan. 2018.
- [95] A. Gulenko, M. Wallschläger, F. Schmidt, O. Kao, and F. Liu. A system architecture for real-time anomaly detection in large-scale NFV systems. Procedia Computer Science, 94:491–496, 2016.
- [96] G. Creech and J. Hu. A semantic approach to host-based intrusion detection systems using contiguousand discontiguous system call patterns. IEEE Transactions on Computers, 63(4):807–819, 2013.
- [97] P. Deshpande, S. C. Sharma, S. K. Peddoju, and S. Junaid. HIDS: A host based intrusion detection system for cloud computing environment. International Journal of System Assurance Engineering and Management, 9(3):567–576, 2018.
- [98] P. Mishra, V. Varadharajan, E. S. Pilli, and U. Tupakula. Vmguard: A vmi-based security architecture for intrusion detection in cloud environment. IEEE Transactions on Cloud Computing, 8(3):957–971, 2020.
- [99] Z. Liu, N. Japkowicz, R. Wang, Y. Cai, D. Tang, and X. Cai. A statistical pattern based feature extraction method on system call traces for anomaly detection. Information and Software Technology, page 106348, 2020.
- [100] S. Nedelkoski, J. Cardoso, and O. Kao. Anomaly detection from system tracing data using multimodal deep learning. In 12th IEEE International Conference on Cloud Computing, pages 179–186, July 2019.
- [101] M. Kubacki and J. Sosnowski. Exploring operational profiles and anomalies in computer performance logs. Microprocessors and Microsystems, 69:1–15, 2019.
- [102] W. Haider, J. Hu, J. Slay, B. P. Turnbull, and Y. Xie. Generating realistic intrusion detection system dataset based on fuzzy qualitative modeling. Journal of Network and Computer Applications, 87:185–192, 2017.
- [103] S. He, W. Ren, T. Zhu, and K. R. Choo. Bosmos: A blockchain-based status monitoring system for defending against unauthorized software updating in industrial internet of things. IEEE Internet of Things Journal, 7(2):948–959, 2020.
- [104] S. Zhanwei and L. Zenghui. Abnormal detection method of industrial control system based on behavior model. Computers & Security, 84:166–178, 2019.
- [105] N. Neha, S. Priyanga, S. Seshan, R. Senthilnathan, and V. S. Shankar Sriram. SCO-RNN: A behavioral-based intrusion detection approach for cyber physical attacks in SCADA systems. In Inventive Communication and Computational Technologies, pages 911–919, 2020.
- [106] C. M. Ahmed and A. P. Mathur. Hardware identification via sensor fingerprinting in a cyber physical system. In 2017 IEEE International Conference on Software Quality, Reliability and Security Companion, pages 517–524, July 2017.
- [107] B. Agrawal, T. Wiktorski, and C. Rong. Adaptive real-time anomaly detection in cloud infrastructures. Concurrency and Computation: Practice and Experience, 29(24):e4193, 2017.
- [108] A. Gulenko, F. Schmidt, A. Acker, M. Wallschläger, O. Kao, and F. Liu. Detecting anomalous behavior of black-box services modeled with distance-based online clustering. In 11th IEEE International Conference on Cloud Computing, pages 912–915, July 2018.
- [109] N. Sorkunlu, V. Chandola, and A. Patra. Tracking system behavior from resource usage data. In 2017 IEEE International Conference on Cluster Computing, pages 410–418, Sept. 2017.
- [110] Q. Du, T. Xie, and Y. He. Anomaly detection and diagnosis for container-based microservices with performance monitoring. In 18th International Conference on Algorithms and Architectures for Parallel Processing, pages 560–572, Nov. 2018.
- [111] X. D. Hoang, J. Hu, and P. Bertok. A program-based anomaly intrusion detection scheme using multiple detection engines and fuzzy inference. Journal of Network and Computer Applications, 32(6):1219–1228, 2009.
- [112] Z. Zheng, S. Xie, H. N. Dai, X. Chen, and H. Wang. Blockchain challenges and opportunities: A survey. International Journal of Web and Grid Services, 14(4):352–375, 2018.
- [113] J. Verbraeken, M. Wolting, J. Katzy, J. Kloppenburg, T. Verbelen, and J. S. Rellermeyer. A survey on distributed machine learning, 2019. Available: arXiv:1912.09789.
- [114] Q. Yang, Y. Liu, T. Chen, and Y. Tong. Federated machine learning: Concept and applications. ACM Transactions on Intelligent Systems and Technology, 10(2):1–19, 2019.
- [115] E. Lear, R. Droms, and D. Romascanu. Manufacturer usage description specification. RFC 8520, RFC Editor, 2019.
- [116] R. Alcarria, B. Bordel, D. Martín, and D. S. De Rivera. Rule-based monitoring and coordination of resource consumption in smart communities. IEEE Transactions on Consumer Electronics, 63(2):191–199, 2017.
- [117] P. A. Gagniuc. Markov chains: From theory to implementation and experimentation. John Wiley & Sons, 2017.
- [118] C. Wressnegger, G. Schwenk, D. Arp, and K. Rieck. A close look on n-grams in intrusion detection: Anomaly detection vs. classification. In 2013 ACM workshop on Artificial intelligence and security, pages 67–76, Nov. 2013.
- [119] E. Alpaydin. Introduction to machine learning. MIT press, 2020.
- [120] Y. LeCun, Y. Bengio, and G. Hinton. Deep learning. Nature, 521(7553):436–444, 2015.
- [121] S. R. Safavian and D. Landgrebe. A survey of decision tree classifier methodology. IEEE Transactions on Systems, Man, and Cybernetics, 21(3):660–674, 1991.
- [122] A. Liaw and M. Wiener. Classification and regression by randomForest. R News, 2(3):18–22, 2002.
- [123] D. G. Kleinbaum, K. Dietz, M. Gail, M. Klein, and M. Klein. Logistic regression. Springer, 2002.
- [124] N. Friedman, D. Geiger, and M. Goldszmidt. Bayesian network classifiers. Machine learning, 29(2-3):131–163, 1997.
- [125] I. Steinwart and A. Christmann. Support vector machines. Springer Science & Business Media, 2008.
- [126] S. Weisberg. Applied linear regression, volume 528. John Wiley & Sons, 2005.
- [127] S. Wold, K. Esbensen, and P. Geladi. Principal component analysis. Chemometrics and Intelligent Laboratory Systems, 2(1-3):37–52, 1987.
- [128] L. Maaten and G. Hinton. Visualizing data using t-SNE. Journal of Machine Learning Research, 9(Nov):2579–2605, 2008.
- [129] K. Krishna and M. N. Murty. Genetic K-means algorithm. IEEE Transactions on Systems, Man, and Cybernetics, Part B, 29(3):433–439, 1999.
- [130] T. N. Tran, K. Drab, and M. Daszykowski. Revised DBSCAN algorithm to cluster data with dense adjacent clusters. Chemometrics and Intelligent Laboratory Systems, 120:92–96, 2013.
- [131] K. L. Li, H. K. Huang, S. F. Tian, and W. Xu. Improving one-class SVM for anomaly detection. In 2003 International Conference on Machine Learning and Cybernetics (IEEE Cat. No. 03EX693), pages 3077–3081, Nov. 2003.
- [132] F. T. Liu, K. M. Ting, and Z. H. Zhou. Isolation forest. In 8th IEEE International Conference on Data Mining, pages 413–422, Dec. 2008.
- [133] Á. L. Perales Gómez, L. Fernández Maimó, A. Huertas Celdrán, F. J. García Clemente, C. Cadenas Sarmiento, C. J. Del Canto Masa, and R. Méndez Nistal. On the generation of anomaly detection datasets in industrial control systems. IEEE Access, 7:177460–177473, 2019.
- [134] L. Metz, B. Poole, D. Pfau, and J. Sohl-Dickstein. Unrolled generative adversarial networks, 2016. Available: arXiv:1611.02163.
- [135] R. N. Bracewell and R. N. Bracewell. The Fourier transform and its applications, volume 31999. McGraw-Hill New York, 1986.
- [136] A. Sivanathan, D. Sherratt, H. H. Gharakheili, A. Radford, C. Wijenayake, A. Vishwanath, and V. Sivaraman. Characterizing and classifying IoT traffic in smart cities and campuses. In 2017 IEEE Conference on Computer Communications Workshops, pages 559–564, May 2017.
- [137] J. François, H. Abdelnur, R. State, and O. Festor. Automated behavioral fingerprinting. In 12th International Symposium on Recent Advances in Intrusion Detection, pages 182–201, Sept. 2009.
- [138] J. Francois, H. Abdelnur, R. State, and O. Festor. Machine learning techniques for passive network inventory. IEEE Transactions on Network and Service Management, 7(4):244–257, 2010.
- [139] J. Terrell, K. Jeffay, F. D. Smith, J. Gogan, and J. Keller. Passive, streaming inference of TCP connection structure for network server management. In 1st International Workshop on Traffic Monitoring and Analysis, pages 42–53, May 2009.
- [140] O. Alrawi, C. Lever, M. Antonakakis, and F. Monrose. SoK: Security evaluation of home-based IoT deployments. In 2019 IEEE Symposium on Security and Privacy, pages 1362–1380, May 2019.
- [141] J. Guth, U. Breitenbücher, M. Falkenthal, P. Fremantle, O. Kopp, F. Leymann, and L. Reinfurt. A detailed analysis of IoT platform architectures: concepts, similarities, and differences. In Internet of everything, pages 81–101. Springer, 2018.
- [142] H. Boyes, B. Hallaq, J. Cunningham, and T. Watson. The industrial internet of things (IIoT): An analysis framework. Computers in industry, 101:1–12, 2018.
- [143] D. Kumar, K. Shen, B. Case, D. Garg, G. Alperovich, D. Kuznetsov, R. Gupta, and Z. Durumeric. All things considered: an analysis of IoT devices on home networks. In 28th USENIX Security Symposium (USENIX Security 19), pages 1169–1185, 2019.
- [144] D. Y. Huang, N. Apthorpe, F. Li, F. Acar, and N. Feamster. IoT inspector: Crowdsourcing labeled network traffic from smart home devices at scale. Proceedings of the ACM on Interactive, Mobile, Wearable and Ubiquitous Technologies, 4(2):1–21, 2020.
- [145] A. MacDermott, T. Baker, and Q. Shi. IoT forensics: Challenges for the ioa era. In 2018 9th IFIP International Conference on New Technologies, Mobility and Security (NTMS), pages 1–5. IEEE, 2018.
- [146] I. Yaqoob, Ibrahim A. T. Hashem, A. Ahmed, SM A. Kazmi, and C. S. Hong. Internet of things forensics: Recent advances, taxonomy, requirements, and open challenges. Future Generation Computer Systems, 92:265–275, 2019.
- [147] H. Chung, J. Park, and S. Lee. Digital forensic approaches for amazon alexa ecosystem. Digital Investigation, 22:S15–S25, 2017.
- [148] S. Li, K. R. Choo, Q. Sun, W. J. Buchanan, and J. Cao. IoT forensics: Amazon echo as a use case. IEEE Internet of Things Journal, 6(4):6487–6497, 2019.
- [149] J. H. Ryu, P. K. Sharma, J. H. Jo, and J. H. Park. A blockchain-based decentralized efficient investigation framework for IoT digital forensics. The Journal of Supercomputing, 75(8):4372–4387, 2019.
- [150] C. Ruiz, S. Pan, A. Bannis, X. Chen, C. Joe-Wong, H. Y. Noh, and P. Zhang. Idrone: Robust drone identification through motion actuation feedback. Proceedings of the ACM on Interactive, Mobile, Wearable and Ubiquitous Technologies, 2(2):1–22, 2018.
- [151] A. Coluccia, G. Parisi, and A. Fascista. Detection and classification of multirotor drones in radar sensor networks: A review. Sensors, 20(15):4172, 2020.
- [152] A. Bernardini, F. Mangiatordi, E. Pallotti, and L. Capodiferro. Drone detection by acoustic signature identification. Electronic Imaging, 2017(10):60–64, 2017.
- [153] MHD S. Allahham, M. F. Al-Sa’d, A. Al-Ali, A. Mohamed, T. Khattab, and A. Erbad. Dronerf dataset: A dataset of drones for rf-based detection, classification and identification. Data in brief, 26:104313, 2019.
- [154] Felix Lorenz, Lauritz Thamsen, Andreas Wilke, Ilja Behnke, Jens Waldmüller-Littke, Ilya Komarov, Odej Kao, and Manfred Paeschke. Fingerprinting analog IoT sensors for secret-free authentication. arXiv preprint arXiv:2006.06296, 2020.
- [155] M. Rodrig, C. Reis, R. Mahajan, D. Wetherall, J. Zahorjan, and E. Lazowska. CRAWDAD dataset uw/sigcomm2004 (v. 2006-10-17). https://crawdad.org/uw/sigcomm2004/20061017, 2006. [Online; accessed 31-July-2020].
- [156] A. S. Uluagac. CRAWDAD dataset gatech/fingerprinting (v. 2014-06-09). https://crawdad.org/gatech/fingerprinting/20140609, 2014. [Online; accessed 31-July-2020].
- [157] A. S. Uluagac, S. V. Radhakrishnan, C. Corbett, A. Baca, and R. Beyah. A passive technique for fingerprinting wireless devices with wired-side observations. In 2013 IEEE conference on communications and network security, pages 305–313, Oct. 2013.
- [158] L. Fernández Maimó, A. Huertas Celdrán, Á. L. Perales Gómez, F. J. García Clemente, J. Weimer, and I. Lee. Intelligent and dynamic ransomware spread detection and mitigation in integrated clinical environments. Sensors, 19(5):1114, 2019.
- [159] M. O. Pahl and F. X. Aubet. All eyes on you: Distributed multi-dimensional IoT microservice anomaly detection. In 14th International Conference on Network and Service Management, pages 72–80, Nov. 2018.
- [160] I. Sharafaldin, A. H. Lashkari, and A. A. Ghorbani. Toward generating a new intrusion detection dataset and intrusion traffic characterization. In 4th International Conference on Information Systems Security and Privacy, pages 108–116, Jan. 2018.
- [161] E. B. Beigi, H. H. Jazi, N. Stakhanova, and A. A. Ghorbani. Towards effective feature selection in machine learning-based botnet detection approaches. In 2014 IEEE Conference on Communications and Network Security, pages 247–255, Oct. 2014.
- [162] S. García, M. Grill, J. Stiborek, and A. Zunino. An empirical comparison of botnet detection methods. Computers & Security, 45:100–123, 2014.
- [163] A. Hamza, D. Ranathunga, H. H. Gharakheili, M. Roughan, and V. Sivaraman. Clear as MUD: Generating, validating and applying IoT behavioral profiles. In 2018 Workshop on IoT Security and Privacy, page 8–14, Aug. 2018.
- [164] M. Sabt, M. Achemlal, and A. Bouabdallah. Trusted execution environment: What it is, and what it is not. In 2015 IEEE International Conference on Trust, Security and Privacy in Computing and Communications, volume 1, pages 57–64, Aug. 2015.
- [165] Y. Meidan, M. Bohadana, Y. Mathov, Y. Mirsky, A. Shabtai, D. Breitenbacher, and Y. Elovici. N-BaIoT—network-based detection of IoT botnet attacks using deep autoencoders. IEEE Pervasive Computing, 17(3):12–22, 2018.
- [166] S. J. Stolfo, W. Fan, W. Lee, A. Prodromidis, and P. K. Chan. Cost-based modeling for fraud and intrusion detection: Results from the JAM project. In DARPA Information Survivability Conference and Exposition, volume 2, pages 130–144, Jan. 2000.
- [167] M. Tavallaee, E. Bagheri, W. Lu, and A. A. Ghorbani. A detailed analysis of the KDD CUP 99 data set. In 2009 IEEE Symposium on Computational Intelligence for Security and Defense Applications, pages 1–6, July 2009.
- [168] N. Moustafa and J. Slay. UNSW-NB15: A comprehensive data set for network intrusion detection systems (UNSW-NB15 network data set). In 2015 Military Communications and Information Systems Conference, pages 1–6, Nov. 2015.
- [169] A. P. Mathur and N. O. Tippenhauer. SWaT: A water treatment testbed for research and training on ICS security. In 2016 International Workshop on Cyber-physical Systems for Smart Water Networks, pages 31–36, Apr. 2016.
- [170] J. Goh, S. Adepu, K. N. Junejo, and A. Mathur. A dataset to support research in the design of secure water treatment systems. In 11th International Conference on Critical Information Infrastructures Security, pages 88–99, Oct. 2016.
- [171] S. Shen, V. V. Beek, and A. Iosup. Statistical characterization of business-critical workloads hosted in cloud datacenters. In 15th IEEE/ACM International Symposium on Cluster, Cloud and Grid Computing, pages 465–474, May 2015.
- [172] C. Warrender, S. Forrest, and B. Pearlmutter. Detecting intrusions using system calls: Alternative data models. In 1999 IEEE Symposium on Security and Privacy (Cat. No. 99CB36344), pages 133–145, May 1999.
- [173] G. Creech. Developing a high-accuracy cross platform Host-Based Intrusion Detection System capable of reliably detecting zero-day attacks. PhD thesis, University of New South Wales, Canberra, Australia, 2014.
- [174] C. Liu, S. CH. Hoi, P. Zhao, and J. Sun. Online ARIMA algorithms for time series prediction. In 30th AAAI Conference on Artificial Intelligence, pages 1867–1873, Feb. 2016.
- [175] T. Zhang, R. Ramakrishnan, and M. Livny. BIRCH: An efficient data clustering method for very large databases. ACM Sigmod Record, 25(2):103–114, 1996.
- [176] Center of Advanced Studies In Adaptive System. WSU CASAS datasets. http://casas.wsu.edu/datasets/, 2020. [Online; accessed 31-July-2020].
- [177] T. V. Kasteren. Datasets for activity recognition. https://sites.google.com/site/tim0306/datasets/, 2010. [Online; accessed 31-July-2020].
- [178] A. K. Hagelskjær, B. H. Grevenkop-Castenskiold, M. H. Jespersen, T. Arildsen, E. Carvalho, and P. Popovski. IoT device identification dataset. https://doi.org/10.5281/zenodo.3638165, 2020. [Online; accessed 31-July-2020].
- [179] H. Kang, D. H. Ahn, G. M. Lee, J. D. Yoo, K. H. Park, and H. K. Kim. IoT network intrusion dataset. https://doi.org/10.21227/q70p-q449, 2019. [Online; accessed 31-July-2020].
- [180] A. Parmisano, S. Garcia, and M. J. Erquiaga (Stratosphere Laboratory). Aposemat IoT-23: A labeled dataset with malicious and benign IoT network traffic. https://www.stratosphereips.org/datasets-iot23, 2020. [Online; accessed 31-July-2020].
- [181] R. Damasevicius, A. Venckauskas, S. Grigaliunas, J. Toldinas, N. Morkevicius, T. Aleliunas, and P. Smuikys. Litnet-2020: An annotated real-world network flow dataset for network intrusion detection. Electronics, 9(5):800, 2020.
- [182] European Conference on Machine Learning and Knowledge Discovery. ECML-PKDD discovery challenge. http://www.lirmm.fr/pkdd2007-challenge/, 2007. [Online; accessed 31-July-2020].
- [183] C. Torrano Giménez, A. Pérez Villegas, and G. Álvarez Marañón. HTTP dataset CSIC 2010. https://www.isi.csic.es/dataset. [Online; accessed 31-July-2020].
- [184] E. Aghaei and G. Serpen. Host-based anomaly detection using Eigentraces feature extraction and one-class classification on system call trace data, 2019. Available: arXiv:1911.11284.
- [185] B. S. Khater, A. Wahab, A. W. Bin, M. Y. I. B. Idris, M. A. Hussain, and A. A. Ibrahim. A lightweight perceptron-based intrusion detection system for fog computing. Applied Sciences, 9(1):178, 2019.
- [186] S. S. Murtaza, W. Khreich, A. Hamou-Lhadj, and M. Couture. A host-based anomaly detection approach by representing system calls as states of kernel modules. In 24th IEEE International Symposium on Software Reliability Engineering, pages 431–440, Nov. 2013.
- [187] P. M. Sánchez Sánchez, J. M. Jorquera Valero, M. Zago, A. Huertas Celdrán, L. Fernández Maimó, E. López Bernal, S. López Bernal, J. Martínez Valverde, P. Nespoli, J. Pastor-Galindo, Á. L. Perales Gómez, M. Gil Pérez, and G. Martínez Pérez. BEHACOM-a dataset modelling users’ behaviour in computers. Data in Brief, page 105767, 2020.
- [188] A. H. Lashkari, A. F. A. Kadir, H. Gonzalez, K. F. Mbah, and A. A. Ghorbani. Towards a network-based framework for Android malware detection and characterization. In 15th Annual Conference on Privacy, Security and Trust, pages 233–23309, Aug. 2017.
- [189] L. Taheri, A. F. Abdul Kadir, and A. H. Lashkari. Extensible Android malware detection and family classification using network-flows and API-calls. In 2019 International Carnahan Conference on Security Technology, pages 1–8, Oct. 2019.
- [190] MIT Lincoln Laboratory. 1998 DARPA intrusion detection evaluation dataset. https://www.ll.mit.edu/r-d/datasets/1998-darpa-intrusion-detection-evaluation-dataset, 1998. [Online; accessed 31-July-2020].
- [191] MIT Lincoln Laboratory. 1999 DARPA intrusion detection evaluation dataset. https://www.ll.mit.edu/r-d/datasets/1999-darpa-intrusion-detection-evaluation-dataset, 1999. [Online; accessed 31-July-2020].
- [192] P. Nespoli, D. Papamartzivanos, F. Gómez Mármol, and G. Kambourakis. Optimal countermeasures selection against cyber attacks: A comprehensive survey on reaction frameworks. IEEE Communications Surveys & Tutorials, 20(2):1361–1396, 2018.
- [193] Xianmin Wang, Jing Li, Xiaohui Kuang, Yu-an Tan, and Jin Li. The security of machine learning in an adversarial setting: A survey. Journal of Parallel and Distributed Computing, 130:12–23, 2019.
- [194] D. D. S. Braga, M. Niemann, B. Hellingrath, and F. B. L. Neto. Survey on computational trust and reputation models. ACM Computing Surveys, 51(5):1–40, 2018.
- [195] Daniel Bastos, Mark Shackleton, and Fadiali El-Moussa. Internet of things: A survey of technologies and security risks in smart home and city environments. IET, 2018.
- [196] Abbas Acar, Hossein Fereidooni, Tigist Abera, Amit Kumar Sikder, Markus Miettinen, Hidayet Aksu, Mauro Conti, Ahmad-Reza Sadeghi, and Selcuk Uluagac. Peek-a-boo: I see your smart home activities, even encrypted! In Proceedings of the 13th ACM Conference on Security and Privacy in Wireless and Mobile Networks, pages 207–218, 2020.
- [197] Joseph Bugeja, Andreas Jacobsson, and Paul Davidsson. On privacy and security challenges in smart connected homes. In 2016 European Intelligence and Security Informatics Conference (EISIC), pages 172–175. IEEE, 2016.
- [198] Noah Apthorpe, Dillon Reisman, and Nick Feamster. Closing the blinds: Four strategies for protecting smart home privacy from network observers. arXiv preprint arXiv:1705.06809, 2017.
- [199] Jingjing Ren, Daniel J Dubois, David Choffnes, Anna Maria Mandalari, Roman Kolcun, and Hamed Haddadi. Information exposure from consumer iot devices: A multidimensional, network-informed measurement approach. In Proceedings of the Internet Measurement Conference, pages 267–279, 2019.
- [200] Noah Apthorpe, Danny Yuxing Huang, Dillon Reisman, Arvind Narayanan, and Nick Feamster. Keeping the smart home private with smart (er) iot traffic shaping. Proceedings on Privacy Enhancing Technologies, 2019(3):128–148, 2019.
- [201] Noah Apthorpe, Dillon Reisman, Srikanth Sundaresan, Arvind Narayanan, and Nick Feamster. Spying on the smart home: Privacy attacks and defenses on encrypted iot traffic. arXiv preprint arXiv:1708.05044, 2017.
- [202] Yi Xu, Jan-Michael Frahm, and Fabian Monrose. Watching the watchers: Automatically inferring tv content from outdoor light effusions. In Proceedings of the 2014 ACM SIGSAC Conference on Computer and Communications Security, pages 418–428, 2014.
- [203] A. Huertas Celdrán, M. Gil Pérez, I. Mlakar, J. M. Alcaraz Calero, F. J. García Clemente, G. Martínez Pérez, and Z. A. Bhuiyan. PROTECTOR: Towards the protection of sensitive data in Europe and the US. Computer Networks, page 107448, 2020.
- [204] C. Dwork and A. Roth. The algorithmic foundations of differential privacy. Foundations and Trends in Theoretical Computer Science, 9(3-4):211–407, 2014.
- [205] L. McInnes, J. Healy, and J. Melville. UMAP: Uniform manifold approximation and projection for dimension reduction, 2018. Available: arXiv:1802.03426.
- [206] T. Chen and C. Guestrin. XGBoost: A scalable tree boosting system. In 22nd ACM SIGKDD International Conference on Knowledge Discovery and Data Mining, pages 785–794, Aug. 2016.
- [207] G. Lai, W. C. Chang, Y. Yang, and H. Liu. Modeling long-and short-term temporal patterns with deep neural networks. In 41st International ACM SIGIR Conference on Research & Development in Information Retrieval, pages 95–104, June 2018.
- [208] F. Karim, S. Majumdar, H. Darabi, and S. Chen. LSTM fully convolutional networks for time series classification. IEEE Access, 6:1662–1669, 2017.
- [209] P. Henderson, R. Islam, P. Bachman, J. Pineau, D. Precup, and D. Meger. Deep reinforcement learning that matters. In 32nd AAAI Conference on Artificial Intelligence, Feb. 2018.
- [210] N. C. Luong, D. T. Hoang, S. Gong, D. Niyato, P. Wang, Y. C. Liang, and D. I. Kim. Applications of deep reinforcement learning in communications and networking: A survey. IEEE Communications Surveys & Tutorials, 21(4):3133–3174, 2019.
- [211] P. L. Lockwood and M. Klein-Flügge. Computational modelling of social cognition and behaviour—a reinforcement learning primer. Social Cognitive and Affective Neuroscience, 2019.
- [212] I. Rahwan, M. Cebrian, N. Obradovich, J. Bongard, J. F. Bonnefon, C. Breazeal, J. W. Crandall, N. A. Christakis, I. D. Couzin, M. O. Jackson, et al. Machine behaviour. Nature, 568(7753):477–486, 2019.