NuSTAR Hard X-ray Spectra of radio galaxies
Abstract
NuSTAR observatory, with its 3 – 78 keV broadband spectral coverage, enables the detections of the high-energy cutoff in a number of active galaxies, including several individual radio loud ones. In this work we present systematic and uniform analyses of 55 NuSTAR spectra for a large sample of 28 radio galaxies, 20 of which are FR II galaxies. We perform spectral fitting to measure the high energy cut-off , photon index , reflection factor R and Fe K line equivalent width. Measurements of are given for 13 sources, and lower limits for the rest. We find those non-detections could primarily be attributed to the obviously smaller net photon counts in their spectra. This indicates that the NuSTAR spectra of the majority of our sample are dominated by the thermal corona emission, and the distribution of the sample is indistinguishable from that of a radio quiet one in literature. The flatter NuSTAR spectra we observed, comparing with radio quiet sources, are thus unlikely due to jet contamination. The radio galaxies also show weaker X-ray reflection (both in R and Fe K line EW) comparing with radio quiet ones. Combining with the radio quiet sample we see a correlation between R and EW, but with considerably large scatter. Notably, the radio loud and quiet sources appear to follow a common – R correlation trend, supporting the outflowing corona model for both populations in which higher bulk outflowing velocity yields weaker reflection and flatter X-ray slope.
Subject headings:
Galaxies: active – Galaxies: nuclei – Galaxies: radio loud – X-rays: galaxiesI. Introduction
Active Galactic Nuclei (AGNs), powered by the accretion of matter onto supermassive black holes, are the most dominant and powerful X-ray population in the sky. For radio-quiet AGNs, it is widely accepted that the primary X-ray emission originates in a hot, compact corona located above the accretion disk (e.g. Haardt & Maraschi 1993). Besides the cutoffed power-law (e.g. Molina et al. 2013; Ricci et al. 2011), an X-ray reflection bump at around 30 keV and an iron K line emission at around 6.4 keV are also detected, produced by the surrounding material illuminated by the central X-ray source (e.g. Matt et al. 1991).
The circumstance is more complicated in radio loud AGNs in which relativistic jets exist (Blandford & Königl 1979; Begelman et al. 1984) and could also produce X-ray emission. The jet contribution may vary between different classes of radio sources. Studies have suggested that the core X-ray emission of FR II galaxies could be dominated by the corona rather than the jet, but the reverse for FR Is (Evans et al. 2006; Hardcastle et al. 2009). Meanwhile, the jet dominance could be higher in core-dominated or young radio galaxies (e.g. Migliori et al. 2014).
It is found that radio galaxies generally have flatter X-ray spectra, weaker X-ray reflection as well as weaker Fe K line (e.g. Sambruna et al. 1999; Reeves & Turner 2000; Eracleous et al. 2000; Grandi et al. 2001; Ballantyne et al. 2002; Ogle et al. 2005; Ballantyne 2007; Sambruna et al. 2009; Walton et al. 2013). Such feathers have been broadly discussed in literature, and many possible explanations have been raised, including significantly dilution from the relativistic jet (Reeves & Turner 2000); inner disk geometry changing (Eracleous et al. 2000); high ionization of inner disk (Ballantyne et al. 2002); obscuration of the central accretion flow by the jet (Sambruna et al. 2009), outflowing corona (Beloborodov 1999; Malzac et al. 2001), etc.
A prominent and key feature of X-ray corona emission is the high energy cutoff in the spectrum which is an indicator of the coronal temperature . For an optically thick thermal corona with opacity , is approximately , while for (e.g. Petrucci et al. 2001). The Nuclear Spectroscopic Telescope Array (NuSTAR Harrison et al. 2013), the first focusing high-energy X-ray mission with a broad and high quality spectral coverage from 3–78 keV, is very powerful in probing the coronal properties of X-ray bright AGNs, as well as constraining the X-ray reflection component (e.g. Kamraj et al. 2018; Panagiotou & Walter 2019; Tortosa et al. 2018; Molina et al. 2019; Rani et al. 2019).
Particularly, NuSTAR observations have detected the high energy cutoff in a couple of radio loud AGNs, including 3C 382 (Ballantyne et al. 2014), 3C 390.3 (Lohfink et al. 2015), 4C 74.26 (Lohfink et al. 2017), 3C 120 (Rani & Stalin 2018a), 3C 273 (Madsen et al. 2015), IGR J21247+5058 (Buisson et al. 2018). This indicates that the hard X-ray emission in these individual sources are dominated by the thermal corona emission, instead of the non-thermal jet. Meanwhile, non-detections of the high energy cutoff were also reported with NuSTAR spectra in several other radio galaxies, including CentaurusA(Fürst et al. 2016), 3C 227 (Kamraj et al. 2018), 4C +18.51 (Kamraj et al. 2018), NGC 1275 (Rani et al. 2018), S5 2116+81(Molina et al. 2019), PKS 2331-240 and PKS 2356-61(Ursini et al. 2018).
Systematical and statistical study of a large sample of radio galaxies is thus essential to address the following questions: 1) are the hard X-ray spectra of radio galaxies ubiquitously dominated by the thermal corona emission? 2) are their corona properties different from their radio quiet counterparts? Such a large sample study could also constrain the strength of X-ray reflection uniformly in the population utilizing the broad spectral coverage of NuSTAR.
In this work we present NuSTAR spectra for a sample of 28 radio galaxies, mostly non-blazar AGNs. The paper is organized as follows. §II presents our sample selection along with NuSTAR observations and data reduction. In §III we describe the spectral model we use and give the fitting results. In §IV we present the statistical analyses and comparison with radio quiet AGNs. Finally §V summarizes this work.
II. The Sample and Data Reduction
II.1. Radio Loud AGN Sample
| Source | ID | Radio Morpology | Redshift | Exposure | Total Net Counts | |
|---|---|---|---|---|---|---|
| (ks) | () | |||||
| 3C 273 | 10002020001 | core dominated | 0.158 | 244.1 | 1074.6 | |
| 10002020003 | 49.4 | 160.6 | ||||
| 10202020002 | 35.4 | 279.0 | ||||
| 10302020002 | 35.3 | 140.2 | ||||
| 10402020002 | 16.1 | 64.0 | ||||
| 10402020004 | 21.1 | 69.0 | ||||
| 10402020006 | 40.2 | 133.3 | ||||
| 80301602002 | 60.6 | 212.8 | ||||
| PicA | 60101047002 | FR II | 0.035 | 109.2 | 46.0 | |
| CentaurusA | 60001081002 | FR I | 0.001 | 51.4 | 1580.4 | |
| 60101063002 | 22.5 | 156.6 | ||||
| 60466005002 | 17.3 | 258.7 | ||||
| 3C 382 | 60001084002 | FR II | 0.058 | 82.4 | 137.2 | |
| 60061286002 | 16.6 | 47.1 | ||||
| 60202015002 | 23.0 | 48.6 | ||||
| 60202015004 | 24.5 | 60.3 | ||||
| 60202015006 | 20.8 | 49.2 | ||||
| 60202015008 | 21.7 | 49.3 | ||||
| 60202015010 | 21.0 | 53.4 | ||||
| IGR J21247+5058 | 60061305002 | FR II | 0.02 | 24.3 | 102.9 | |
| 60301005002 | 40.2 | 210.3 | ||||
| 3C 390.3 | 60001082002 | FR II | 0.057 | 23.6 | 50.3 | |
| 60001082003 | 47.5 | 99.1 | ||||
| 3C 109 | 60301011002 | FR II | 0.31 | 67.5 | 21.7 | |
| 60301011004 | 88.9 | 26.3 | ||||
| 4C 74.26 | 60001080002 | FR II | 0.104 | 19.0 | 30.1 | |
| 60001080004 | 56.5 | 92.2 | ||||
| 60001080006 | 90.8 | 128.6 | ||||
| 60001080008 | 42.8 | 62.3 | ||||
| 3C 120 | 60001042002 | FR I | 0.033 | 21.6 | 54.6 | |
| 60001042003 | 127.7 | 334.2 | ||||
| 3C 227 | 60061329002 | FR II | 0.086 | 17.2 | 10.1 | |
| 60061329004 | 12.1 | 6.1 | ||||
| 3C 184.1 | 60160300002 | FR II | 0.119 | 22.2 | 4.0 | |
| 3C 111 | 60202061002 | FR II | 0.049 | 21.2 | 46.0 | |
| 60202061004 | 49.2 | 98.1 | ||||
| PKS 2356-61 | 60061330002 | FR II | 0.096 | 23.0 | 4.2 | |
| 3C 206 | 60160332002 | FR II | 0.2 | 17.3 | 10.0 | |
| 3C 345 | 60160647002 | core dominated | 0.593 | 24.3 | 4.7 | |
| 2MASX J03181899+6829322 | 60061342002 | FR II | 0.09 | 24.1 | 5.8 | |
| 4C +18.51 | 60160672002 | FR II | 0.186 | 22.4 | 3.9 | |
| S5 2116+81 | 60061303002 | FR I | 0.084 | 18.5 | 13.7 | |
| 4C +21.55 | 60160740002 | FR II | 0.173 | 21.5 | 8.9 | |
| PKS 2331-240 | 60160832002 | FR II | 0.048 | 21.1 | 12.1 | |
| PKS 1916-300 | 60160707002 | FR II | 0.167 | 21.7 | 6.0 | |
| IGR 14488-4008 | 60463049002 | FR II | 0.123 | 20.2 | 6.8 | |
| 3C 279 | 60002020002 | core dominated | 0.536 | 39.5 | 23.1 | |
| 60002020004 | 42.7 | 52.0 | ||||
| Leda 100168 | 60160631002 | FR II | 0.183 | 24.1 | 4.1 | |
| 3C 309.1 | 60376006002 | core dominated | 0.905 | 60.9 | 5.9 | |
| 3C 332 | 60160634002 | FR II | 0.152 | 20.9 | 11.2 | |
| PKS 0442-28 | 60160205002 | FR II | 0.147 | 22.4 | 6.0 | |
| NGC 1275 | 60061361002 | FR I | 0.018 | 19.9 | 57.1 | |
| 90202046002 | 22.3 | 80.1 | ||||
| 90202046004 | 28.1 | 88.1 |
Note. — For sources from Bassani et al. (2016), we adopt the radio morphology given by Bassani et al. (2016). For the rest three sources from 3C Catalog, we adopt the morphology from NASA/IPAC Extragalactic Database (NED). Total net counts are the sum of net counts from FPMA and FPMB in the energy range of 3 – 78 keV.
The main purpose of this paper is to systematically study the intrinsic hard X-ray spectra of non-blazar radio galaxies, and we are especially interested in the coronal physics in such sources. A radio galaxy sample composed of sources without severe absorption or strong relativistic beaming is thus needed. Besides, we need NuSTAR spectra with sufficient signal to noise ratios (S/N) to perform X-ray spectral fitting.
Using the NVSS (Condon et al. 1998), FIRST (White et al. 1997) and SUMSS radio surveys (Mauch et al. 2003), Bassani et al. (2016) searched for radio counterparts for INTEGRAL/IBIS and Swift/BAT detected AGNs. The radio galaxies in their sample (64 radio loud AGNs, 70% is made of high-excitation radio galaxies) are required to display a double lobe radio morphology, which guarantees a weak relativistic beaming. We crossmatch their sample with HEASARC111https://heasarc.gsfc.nasa.gov/ (High Energy Astrophysics Archive Research Center) for publicly released NuSTAR observations till May 1, 2019. In this way, we get a sample of 36 NuSTAR observed radio galaxies.
We notice that some well known radio loud sources, such as 3C 273, are not included in this sample, because of the requirement of displaying double lobe radio morphology by Bassani et al. (2016). Through cross-matching the 3C and 3CR Catalogues (Edge et al. 2002) with Swift/BAT 105 month hard X-ray catalog (Oh et al. 2018, to ensure the hard X-ray brightness) and NuSTAR archive, we find three more sources (3C 273, 3C 279 and 3C 345), and the NuSTAR observation of 3C 345 has not been published elsewhere. All three sources are core dominated, flat-spectrum radio quasars. The jet contributions to their NuSTAR X-ray spectra are expected to be stronger comparing with the radio galaxies we introduced above. However we note a high energy X-ray cutoff has been detected in 3C 273 with NuSTAR observation (Madsen et al. 2015), indicating its hard X-ray emission is significantly dominated by the corona. We note that both 3C 279 and 3C 345 show strong emission lines in UV/optical spectra (White et al. 2000; Bechtold et al. 2002), similar to 3C 273, indicating their optical emission are not dominated by the jet emission. We speculate their hard X-ray spectra could be similarly dominated by the corona emission. We include these three sources into this study, and stress that excluding them will not alter our main scientific results (see §IV.4 for comparison and discussion).
We further exclude Compton-thick and heavily obscured sources (with ) which need more complicated spectral models, and are beyond the scope of this paper. Moreover, faint sources with NuSTAR 3 – 78 keV total net counts (FPMA FPMB, hereafter the same) 3000 are also excluded. Our final sample consists of 28 radio galaxies. We note that NuSTAR spectra for 13 out of the 28 sources have not been published elsewhere. We present the sample along with the corresponding 55 NuSTAR observations in Tab. LABEL:sources. The 11 excluded sources can be found in Tab. 6 in Appendix A.
The final sample (see Table LABEL:sources) consists of 20 FR II galaxies, 4 FR I galaxies (NGC 1275, 3C 120, Centaurus A, and S5 2116+81), and 4 core dominated sources (one compact steep spectrum quasar, 3C 309.1; and 3 flat-spectrum radio quasars, 3C 273, 3C 279 and 3C 345), thus is dominated by powerful lobe-dominated FR II galaxies and high-excitation and efficiently accreting sources (see §IV.4 for further discussion). Further matching the whole Swift/BAT catalog with NuSTAR archive yields no additional sources satisfying our selection criteria. Note that our sample is primarily hard X-ray/soft -ray selected as all sources are /BAT detected. This is indeed a necessary condition of this study as we need sufficient X-ray photons to perform spectral fitting, and we expect no significant bias due to this condition on the hard X-ray spectral properties. Meanwhile, the comparison samples of radio quiet AGNs used in this work are similarly hard X-ray/soft -ray selected.
II.2. Data Reduction
We download raw data from HEASARC, derived from both NuSTAR modules (FPMA & FPMB, Harrison et al. 2013). The data reduction is performed using the NuSTAR Data Analysis Software (NuSTAR-DAS), which is part of the HEAsoft package (version 6.26). We use CALDB version 20190513 for calibration, and the calibrated and cleaned event files are produced using the software tool nupipeline.
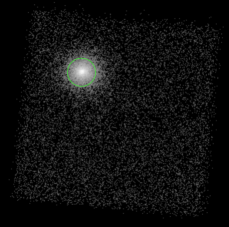
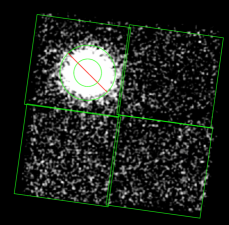
We use the nuproducts module to extract source spectra within a circle centered on each source. The S/N of the extracted net counts (subtracted given background spectrum) relies on the circle radius utilized. To find the optimized source extraction radius which could maximize the output S/N, we adopt a set of values of source region radii to extract the source spectra and calculate the S/N of the net counts (after subtracting the background, in the energy range of 3 – 78 keV). We find for our sample the median optimal radius for source extraction is 60″ (slightly smaller radii for fainter sources, and vice versa), which is also the value widely used in literature. In this work we extract source spectra within a uniform radius of 60″.
As for background extraction, due to the spatially variable background of NuSTAR observations (Wik et al. 2014), the common approach adopted in literature to extract the background spectrum within a region near the source could be improved. As shown in Wik et al. (2014), the NuSTAR background consists of different components, including internal background, aperture stray light, scattered and reflected stray light, and focused cosmic X-ray background.Among them, the aperture background (stray light) is clearly spatially variable and its spatial distribution can be fully modulated. Wik et al. (2014) depveloped NUSKYBGD with built-in models for each background component, and background spectra extracted from different source-free regions within the FOV could be fitted with the built-in models using XSPEC (Arnaud 1996). With the best-fit parameters, NUSKYBGD could simulate the background spectra in any region within the FoV, taking care of the spatial variation of the background. In this work we use NUSKYBGD to calculate background spectra within the source extraction region for each source. An example of source and background spectra extraction is shown in Fig. 1. As a final step, we re-bin the source spectra to achieve a minimum of 50 counts per bin using grppha.
III. Spectral Fitting
Spectral fitting is performed in 3–78 keV band using XSPEC (Arnaud 1996), statistics, and relative element abundances given by Anders & Grevesse (1989). Unless otherwise noted, all the errors along with upper/lower limits reported throughout the paper are calculated using = 2.71 criterion (90% confidence range). For each source, the spectra obtained by the two NuSTAR detectors, FPMA and FPMB, are fitted simultaneously, with a cross-normalization difference typically less than 5% (Madsen et al. 2015).
We would like to measure the key hard X-ray spectral properties (including photon index , high energy cutoff Ec, Fe K line and the strength of reflection component) of non-blazar radio galaxies, and make comparison with those of radio-quiet AGNs. We adopt a base model pexrav + zgauss, in which pexrav describes the exponentially cut-off power-law plus the reflection component (a widely used model in literature, Magdziarz & Zdziarski 1995), and zgauss the Fe K line. Intrinsic absorption is modeled with , and Galactic absorption is ignored as it has little and negligible impact to NuSTAR spectra.
We note in some X-ray models, the continuum reflection component and the Fe K line are jointly and self-consistently fitted (under certain assumptions), such as (Nandra et al. 2007) and (García et al. 2014). In this work, we adopt the more general approach to model the continuum reflection and the Fe K line separately, because:
- •
-
•
The wide energy band of NuSTAR enables us to constrain the continuum reflection independent to the Fe K line. This also enables us to potentially investigate the yet-unclear coupling between the continuum reflection and the Fe K line emission. Furthermore, in case of clear decoupling between the Fe K line and the continuum reflection, fitting with them simply tied may hinder precise measurement of (Zhang et al. 2018).
In pexrav the parameter R, the reflection scaling factor, describes the strength of the reflection with respect to the primary emission. For simplicity, we adopt the solar element abundance for the reflector and an inclination of , which is the default value of the model. We fix the Gaussian emission line at 6.4 keV in the rest frame, and the line width at 19 eV (the mean Fe K line width in AGNs measured with Chandra HETG, Shu et al. 2010), to model the neutral and narrow Fe K line. The free parameters during the fitting include the cross-normalization constant between FPMA and FPMB, photon index , , the reflection scaling factor R of pexrav, and the normalizations of the cutoff powerlaw and the Gaussian line.
Our base model provides adequate fits () to all but one source. The only exception is NGC 1275 (3C 84). Following Rani et al. (2018), we add an apec component to account for significant radiation from hot diffuse gas. We fix the abundance parameter of at 0.39 and set the parameter free to vary. With this updated model, its spectra are well fitted with for all three NuSTAR observations.
‘ Source ID nH (keV) R Fe K EW (eV) 3C 273γ 10002020001 1.62 226 0.05 1.02 10002020003 1.72 0.96 10202020002 1.54 225 10.9 1.02 10302020002 0.7 1.64 1.00 10402020002 1.64 221 0.21 1.05 10402020004 1.64 0.94 10402020006 1.67 300 0.94 80301602002 1.58 271 0.95 total 1.61 248 0.03 6.3 1.05 PicA⋆γ 60101047002 1.72 202 49.0 0.98 CentaurusAγ 60001081002 8.5 1.74 335 42.3 1.00 60101063002∙ 9.6 1.75 190 140.8 1.13 60466005002 9.7 1.80 70.2 1.03 total 8.8 1.75 343 52.4 1.11 3C 382 60001084002∙ 1.1 1.76 49.4 0.95 60061286002 1.88 0.27 0.95 60202015002 1.1 1.83 27.3 0.99 60202015004 1.72 174 29.3 1.02 60202015006∙ 1.78 45.8 0.96 60202015008 1.74 43.0 0.97 60202015010∙ 1.80 47.0 1.07 total 0.7 1.78 0.07 39.6 1.01 IGR J21247+5058 60061305002∙ 2.9 1.56 97 36.2 1.01 60301005002 2.6 1.62 100 31.7 1.07 total 2.7 1.60 98 33.8 1.08 3C 390.3 60001082002 1.75 197 0.19 80.4 0.98 60001082003 1.72 208 0.14 67.1 0.98 total 0.5 1.73 203 0.16 71.5 0.98 3C 109⋆ 60301011002 1.69 41.4 1.05 60301011004 1.63 87 0.32 45.6 0.95 total 1.64 97 0.23 46.1 1.00 4C 74.26 60001080002 1.91 137 1.0 1.00 60001080004 1.2 1.89 240 0.55 86.0 0.99 60001080006∙ 1.79 121 0.66 145.1 0.99 60001080008 1.85 0.5 92.1 0.94 total 0.6 1.84 166 0.63 108.3 0.99 3C 120γ 60001042002 1.86 0.32 66.5 0.93 60001042003∙ 0.5 1.85 300 0.4 54.6 1.01 total 0.4 1.85 313 0.39 56.8 0.99 3C 227⊙ 60061329002 3.1 1.87 0.95 60061329004 1.39 58 1.00 total 1.8 1.65 1.05 3C 184.1⋆ 60160300002 7.7 1.34 38 1.19 3C 111⋆γ 60202061002 1.1 1.79 43.3 0.98 60202061004∙ 0.7 1.69 165 48.5 1.07 total 0.9 1.73 252 46.9 1.04 PKS 2356-61⊙ 60061330002 7.9 1.42 59 149.5 0.97 3C 206⋆ 60160332002 1.81 0.51 0.81 3C 345⋆γ 60160647002 1.53 1.01 2MASX J03181899+6829322⊙ 60061342002 9.0 1.77 78.7 1.18 4C +18.51 60160672002 1.55 0.94 S5 2116+81 60061303002∙ 1.82 67.7 1.08 4C +21.55⋆ 60160740002 1.75 0.95 PKS 2331-240 60160832002 1.95 1.06 PKS 1916-300⋆ 60160707002 1.76 0.88 IGR 14488-4008⋆ 60463049002 2.6 2.06 2.22 78.8 1.15 3C 279⊙γ 60002020002 1.68 33.1 1.01 60002020004 2.2 1.76 0.89 total 2.0 1.76 0.93 Leda 100168⋆ 60160631002 3.6 1.86 135.0 0.93 3C 309.1⋆γ 60376006002 1.71 0.86 3C 332⋆ 60160634002 1.83 0.5 0.90 PKS 0442-28⋆ 60160205002 1.78 1.09 NGC 1275γ 60061361002 1.82 41.9 0.94 90202046002 1.79 70.3 0.95 90202046004 1.99 62.6 1.01 total 1.82 61.2 1.10
-
•
The Fe K line EW is measured with a fixed rest frame central energy (6.4 keV) and a fixed line width (19 eV).
-
•
: Sources for which NuSTAR observations are reported for the first time.
-
•
: Sources with NuSTAR observations reported in literature, but detection or lower limits reported for the first time in this work.
-
•
: Observations for which a broad Fe K line is required. The updated fitting results are given in Tab. 3.
-
•
γ: Sources in Fermi-LAT catalog.
|
|
|
|
|
|
|
|
|
|||||||||||||
|---|---|---|---|---|---|---|---|---|---|---|---|---|---|---|---|---|---|---|---|---|---|
| CentaurusA | 60101063002 | 9.1 | 1.71 | 144 | 0.19 | 187.7 | 1.11 | ||||||||||||||
| 3C382 | 60001084002 | 0.7 | 1.72 | 0.28 | 84.1 | 0.94 | |||||||||||||||
| 3C382 | 60202015006 | 1.76 | 0.32 | 85.2 | 0.95 | ||||||||||||||||
| 3C382 | 60202015010 | 1.77 | 0.35 | 96.6 | 1.06 | ||||||||||||||||
| IGRJ21247p5058 | 60301005002 | 2.2 | 1.58 | 90 | 0.4 | 74.2 | 1.06 | ||||||||||||||
| 4C74d26 | 60001080006 | 1.79 | 124 | 0.62 | 0.4 | 122.7 | 0.99 | ||||||||||||||
| 3C120 | 60001042003 | 1.80 | 228 | 0.33 | 0.33 | 103.7 | 0.99 | ||||||||||||||
| 3C111 | 60202061004 | 1.67 | 147 | 0.26 | 85.0 | 1.06 | |||||||||||||||
| S52116p81 | 60061303002 | 1.73 | 0.06 | 0.44 | 192.3 | 1.06 |
We present our best-fit results in Tab. 2, the spectra in Appendix B, and the vs contours in Appendix C. For spectra with no intrinsic obscuration, X-ray reflection, narrow Fe K line or detected (significance 90%), we present their high or low limits (90% confidence level) respectively. In addition, as we do not see dramatic variations in obscuration, photon index , line EW and high energy cut-off between NuSTAR exposures for sources with multiple observations, we also fit those multiple exposures simultaneously with , , , R and EW tied. The results (labelled as ‘total’) are also given in Tab. 2.
Since the Fe K line could be relativistically broadened in some sources, we also perform spectral fitting allowing the line width to vary freely. We find in 9 observations, allowing the line width to vary can significantly improve the fit (). The updated spectral fitting results are presented in Tab. 3. Such an approach could elevate the best-fit line equivalent width (EW) by a factor of 2–3, but barely affects the best-fit continuum properties.
We finally note that in §IV.3 we compare our Fe K line EW with a radio quiet sample of Panagiotou & Walter (2019), who fit spectra with the same model as ours except for that they fixed the Fe K line width at 50 eV. We find that using 50 eV instead of 19 eV (adopted in this work) negligibly alters the fitting results as both values are far smaller than the spectral resolution of , 0.4 keV at around 6.4 keV (Harrison et al. 2013). Also, for consistency, we only adopt our measurements with line width fixed for comparison (those reported in Table 2).
IV. Results and Discussion
In this work we present the first systematic study of NuSTAR hard X-ray spectra of radio loud AGNs. In this section we present the distribution of their measured spectral parameters, together with discussion and comparison with radio quiet ones. As we did not reveal strong variations in most spectral parameters concerned in individual sources, the comparison presented below is primarily between sources. For those with multiple exposures, we adopt the following parameters for further analyses, unless explicitly stated otherwise: the best-fit , reflection factor and Fe K line EW from the ‘total’ fit in table 2 which generally yield better constraints to these parameters; the lower limit to from the ‘total’ fit for sources with non-detected, and the best-fit (and other spectral parameters if involved) from the corresponding individual exposure for sources with detections. Following Rani et al. 2019 we adopt the lowest best-fit for sources with detected in multiple exposures.
IV.1. High Energy Cutoff
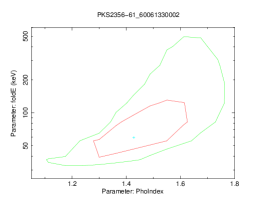
Through performing uniform spectral fitting to NuSTAR spectra, we detect high energy cut-off (in at least one exposure for sources with multiple exposures, with a confidence level 90%, ) in 13 out of 28 radio galaxies, and present lower limits for the rest 15 sources. The ‘total’ fit in Tab. 2 does not yield new detections of . Note for a couple of exposures, the derived error bars of the best-fit are rather large. For instance Pic A and PKS 2356-61 (see Tab. 2) show reaching 600 keV within 90% confidence ranges, which is out of the NuSTAR energy range (because the cutoff is not a very sharp feature). For such exposures the detections of are marginal (with confidence level slightly above 90%, see the contour plots in Appendix C). Note they also have smaller number of NuSTAR photons comparing with the majority sources with detections (see §IV.2). We keep the marginal detections for these two sources for statistical consistency. Excluding them would not alter the key results presented in this work.
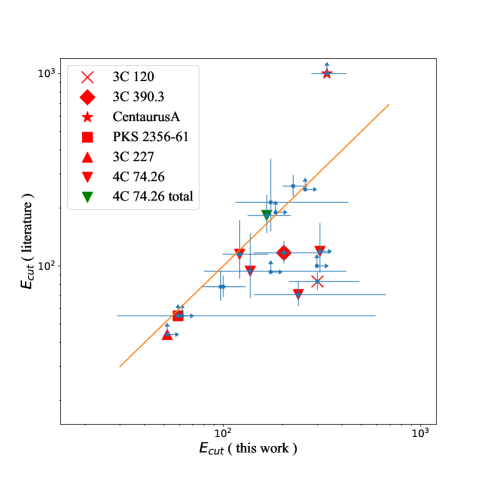
IV.1.1 Comparison of measurements with literature studies
21 out of the 55 NuSTAR exposures presented in this work have been reported with measurements in literature. In Fig. 2 and Tab. 4 we present comparison between our with those published for the 21 exposures of 13 sources. Among them, we yield detections for 3C 227, CentaurusA and PKS 2356-61 for which literature studies of NuSTAR spectra only provided lower limits. Below we provide brief notes on the three sources.
-
•
For 3C 227, Kamraj et al. (2018) co-added two NuSTAR spectra and reported a lower limit to ( 44 keV), while we presented an measurement (58 keV) for one exposure and a lower limit ( 87 keV) for another.
-
•
For Centaurus A, Fürst et al. (2016) claimed non-detection of ( 1 MeV) using one NuSTAR exposure (ID: 60001081002) together with a partially simultaneous XMM exposure, though a coronal temperature keV was derived using a Comptonization model. However, the NuSTAR exposure only slightly overlap with XMM exposure (MJD range of 56510.54-56511.67 versus 56511.53-56511.66) thus the fitting results could have been biased by potential variation of the spectral slope222For the same NuSTAR exposure, Fürst et al. (2016) yielded a powerlaw spectral slope of =1.815 through fitting together with the XMM spectra, considerably steeper than = 1.74 we obtained using NuSTAR spectra alone, and the inter-instrument calibration may also have played a role (e.g. Fürst et al. 2016; Cappi et al. 2016; Middei et al. 2019). Meanwhile we derived measurements from three NuSTAR exposures of Centaurus A (335 keV, 190 keV, 334 keV).
-
•
For PKS 2356-61, our marginal detection of (59 keV) is statistically consistent with the lower limit ( keV) given by Ursini et al. (2018).
While our measurements are generally consistent with literature studies (Fig. 2), we report considerably higher and larger error bars for 3C 120, 3C 390.3 and individual exposures of 4C 74.26.
-
•
For 3C 120, this is likely because Rani & Stalin (2018a) did not re-bin the spectra of 3C 120 (presumably, based on the degree of freedom reported) but adopted statistics. Utilizing C-statistic on un-rebinned spectra would yield results well consistent with what we present in this work.
-
•
For 3C 390.3, this could be due to the fact that the Fe K line and continuum reflection component were fitted jointly in literature (Lohfink et al. 2015), while we adopt a conservative approach with two components decoupled.
- •
Meanwhile, in our sample, NuSTAR observation(s) are reported for the first time333Here the “first time” claim is obtained through crossmatching with NuSTAR bibliographies: https://heasarc.gsfc.nasa.gov/docs/heasarc/biblio/pubs/nustar.html for 13 sources in our sample, yielding 4 detections of and 9 lower limits, which are marked with asterisks in Tab. 2. Additionally, for 3C 279 and 2MASX J03181899+6829322, for which the literature studies, though fitted the spectra with cutoff powerlaw, did not provide constraints to . (Hayashida et al. 2015; Panagiotou & Walter 2019). Over all, this work presents for the first time detections in 7 sources and lower limits in 11 sources.
|
|
|
|
|
|
|||||||||
|---|---|---|---|---|---|---|---|---|---|---|---|---|---|---|
| 3C 273 | 10002020001 | 226 | 202 | Madsen et al. (2015) | ||||||||||
| CentaurusA | 60001081002 | 335 | Fürst et al. (2016) | with XMM | ||||||||||
| 3C 382 | 60061286002 | Ballantyne et al. (2014) | ||||||||||||
| 60001084002 | Ballantyne et al. (2014) | |||||||||||||
| IGR J21247+5058 | 60061305002 | 97 | Buisson et al. (2018) | |||||||||||
| 60301005002 | 100 | Buisson et al. (2018) | ||||||||||||
| 3C 390.3∗ | 60001082002 | 197 | ||||||||||||
| 60001082003 | 208 | |||||||||||||
| total | 203 | Lohfink et al. (2015) | addspec, with Suzaku | |||||||||||
| 4C 74.26 | 60001080002 | 137 | Molina et al. (2019) | with XRT | ||||||||||
| 60001080004 | 240 | Molina et al. (2019) | with XRT | |||||||||||
| 60001080006 | 121 | Molina et al. (2019) | with XRT | |||||||||||
| 60001080008 | Molina et al. (2019) | with XRT | ||||||||||||
| total | Lohfink et al. (2017) | with XRT | ||||||||||||
| 3C 120 | 60001042003 | 300 | Rani & Stalin (2018a) | un-binned with statistics | ||||||||||
| 3C 227∗ | 60061329002 | |||||||||||||
| 60061329004 | 58 | |||||||||||||
| total | Kamraj et al. (2018) | addspec | ||||||||||||
| PKS 2356-61 | 60061330002 | 59 | Ursini et al. (2018) | with BAT | ||||||||||
| 4C +18.51 | 60160672002 | Kamraj et al. (2018) | ||||||||||||
| S5 2116+81 | 60061303002 | Molina et al. (2019) | with XRT | |||||||||||
| PKS 2331-240 | 60160832002 | Ursini et al. (2018) | with BAT and XMM | |||||||||||
| NGC 1275∗ | 90202046002 | |||||||||||||
| 90202046004 | ||||||||||||||
| total | Rani et al. (2018) | with BAT |
IV.1.2 Comparison with radio quiet AGNs
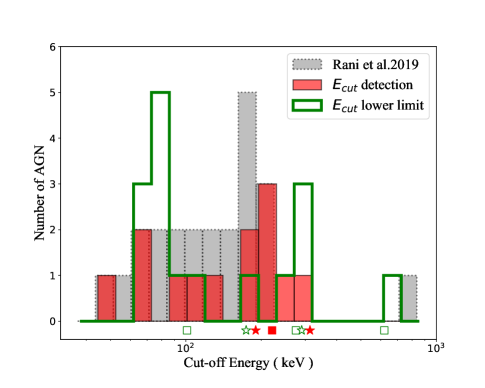
We plot in Fig. 3 the distribution of our measurements. Following Rani et al. (2019), we plot the lowest value for sources with more than one measurements.
It is useful to compare the of our radio galaxies with those of radio quiet ones. Up to now, there are a number of sample studies of NuSTAR spectra of (mostly radio quiet) AGNs. For example, Kamraj et al. (2018) studies NuSTAR spectra of 46 Seyfert 1 AGNs with NuSTAR and reports detection in 2 sources and lower limits in 44 sources. Tortosa et al. (2018), Molina et al. (2019) and Rani et al. (2019) respectively measure and detect in NuSTAR samples, with all three added up to about 25 sources with detections. Besides, there are many works focus on the corona property of individual sources (e.g. Buisson et al. 2018; Middei et al. 2018; Lanzuisi et al. 2016; Porquet et al. 2018).
Rani et al. (2019) collected from literature a list of NuSTAR sources with measurements (e.g. Rani & Stalin 2018a, b; Tortosa et al. 2018, 2017; Buisson et al. 2018; Middei et al. 2018; Lanzuisi et al. 2016; Porquet et al. 2018). Their sample consists of 28 sources, of which 5 overlaps with our sample. We use the rest 23 sources (all are radio quiet) for comparison with our work (Fig. 3). Our detections result in an arithmetically averaged value and scatter of keV, showing no difference from that of Rani et al. (2019, keV). Kolmogorov-Smirnov test shows no significant difference either between two samples.
IV.2. detections versus non-detections
It is valuable to check whether those non-detections are due to intrinsically larger (or no cutoff at all) or insufficient S/N in the spectra. In Fig. 3 we over-plot the distribution of the lower limits to our non-detections, which are indistinguishable from the distribution of the detections. This indicates that such non-detections do not necessarily correspond to intrinsically higher .
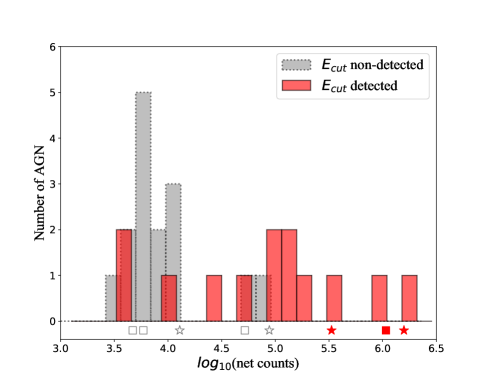
We show the distribution of NuSTAR net counts (FPMA FPMB) in Fig. 4. For sources with multiple observations, we use the exposure with maximum net counts. We clearly see less net counts in sources without detections, and at net counts 105.0, the detection fraction is 100%, showing the non-detections are dominantly due to their lower S/N. KS test shows that the distributions of the two subsamples (with and w/o detections) are significantly different with a confidence level of 99.8%. We obtain a mean net count and scatter of for the sources with detections, and for the rest. Excluding the two brightest sources (3C273 and CentaurusA) does not alter the results. We conclude that the non-detections in our sample are primarily due to the smaller S/N of the corresponding spectra, demonstrating that the hard X-ray spectra of non-blazar radio galaxies are ubiquitously dominated by the thermal corona.
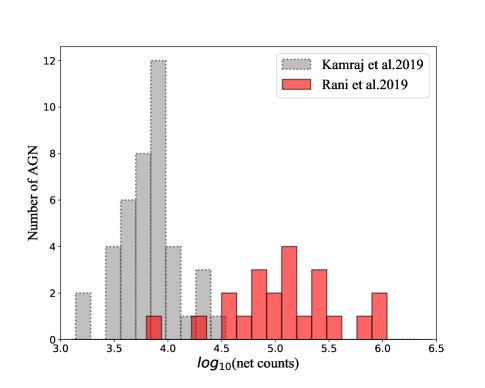
We also plot in Fig. 4 the net counts distribution of the large sample in Kamraj et al. (2018, mostly non-detected) and the -detected sample in Rani et al. (2019). To estimate their NuSTAR net counts, we download their NuSTAR data from HEASARC and perform the same data reduction process as in §II.2444For simplicity, here we do not use NUSKYBGD to calculate the background. Instead we use the common approach, i.e., an annular region around the source to extract the background. This may be inaccurate for spectral analysis but sufficient for the purpose here.. Finally, after excluding radio loud samples, we derive the total net counts (FPMA FPMB) of the 41 non-detections in Kamraj et al. (2018) and 22 detections in Rani et al. (2019). PG 1247+268 is excluded because its detection was obtained through joint fitting with XMM-Newton data (Lanzuisi et al. 2016). Again for those with multiple observations, the maximum net counts value is adopted. Similarly, we conclude that those non-detections in radio quiet AGNs are also to a great extent due to lower S/N in the spectra.
We note in our sample there are 4 detections with net counts 104.5, while all but one detections from Rani et al. (2019) have net counts 104.5. This is likely because detections are more sensitive to net counts at higher energy instead of 3 – 78 keV, thus for radio galaxies with flatter X-rays spectra, relatively less 3 – 78 keV net counts are required to enable detections. In deed, all the 4 detections with net counts 104.5 have 1.63.
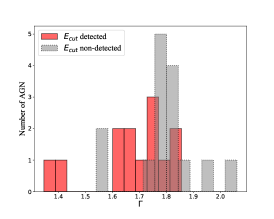
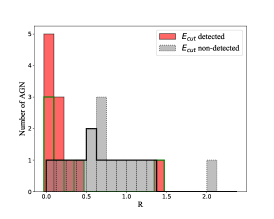
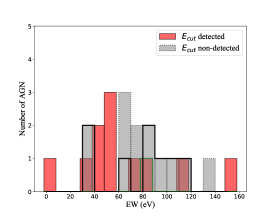
In Fig. 5 we plot the distribution of , reflection factor and Fe K EW for our sources with and without detections. Note only upper limits to or could be derived for the majority of non-detections because of their small photon counts (see the upper panel of Fig. 4). Log–rank test within ASURV (Feigelson & Nelson 1985), which handles the censored data points, shows the two subsamples are indistinguishable in and Fe K EW (with p-value = 0.45 and 0.80 respectively). But sources with detections tend to have flatter X-ray spectra (with a statistical confidence level of 98%). This could also be attributed to the fact that detection is easier (harder) in flatter (steeper) spectra.
IV.3. , R and Fe K EW
Panagiotou & Walter (2019, hereafter PW19) studied the X-ray reflection in both absorbed and unabsorbed AGNs, consisting of 87 sources of different types (e.g., narrow-line Seyfert 1, Seyfert 1, Seyfert 1.5, Seyfert 2, Compton-thick, etc). The sample of PW19 contains 46 unabsorbed sources (, the same definition as in this paper), among which the only radio-loud one is 2MASX J03181899+6829322 (which is also in our sample). In this section we choose their 45 unabsorbed and radio quiet sources for comparison (hereafter PW19 sample).
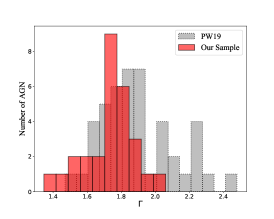
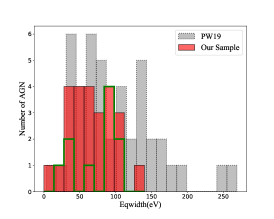
The distribution of photon index , R and Fe K EW from our sample and PW19 are given in Fig. 6. It is obviously seen that radio galaxies in our sample show flatter NuSTAR spectra comparing with radio quiet AGNs in PW19. More precisely, the mean value and scatter of is for our sample, while that of PW19 is . With KS test, we find that the difference in the spectral slope between our sample and PW19 is significant at 99.7% confidence. This is in good agreement with previous studies showing radio loud AGNs have harder X-ray spectra (e.g. Reeves & Turner 2000; Page et al. 2005; Piconcelli et al. 2005; Ishibashi & Courvoisier 2010), but for the first time with observations which extend the spectral range to 78 keV.
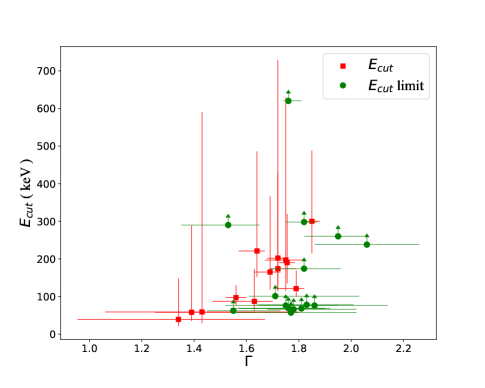
We examine for potential correlations between each two of the spectral parameters (, , , and EW), but only find statistically significant correlation between and for the 13 sources with detections, for which Spearman test gives = 0.764 and P-value = 0.006 (but note the large statistical uncertainties in both and , Fig. 7). Such a correlation, i.e., smaller in flatter spectra, was similarly reported in a recent study (mostly radio quiet AGNs) by Molina et al. (2019), but not seen in earlier works (e.g. Molina et al. 2009; Tortosa et al. 2018). As Molina et al. (2019) pointed out, such a correlation however could be artificial since there is clear degeneracy between and during the spectral fitting.
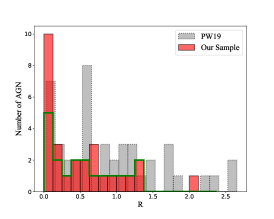
Our radio galaxies also show weaker X-ray reflection (both in R and Fe K line EW) while comparing with radio quiet ones in PW19 (both with confidence level 99.9%, see Fig. 6). To properly deal with sources with only upper limits to line EW and/or R, we use the Kaplan-Meier estimator within the ASURV package to calculate the mean value and scatter of both parameters in both samples. We get and eV for our sample, while for radio quiet ones in PW19, and eV. This also confirms previous findings that radio galaxies tend to have weak X-ray reflection components(e.g. Lohfink et al. 2013a; Sambruna et al. 1999; Reeves & Turner 2000), including both the continuum reflection and the Fe K line emission.
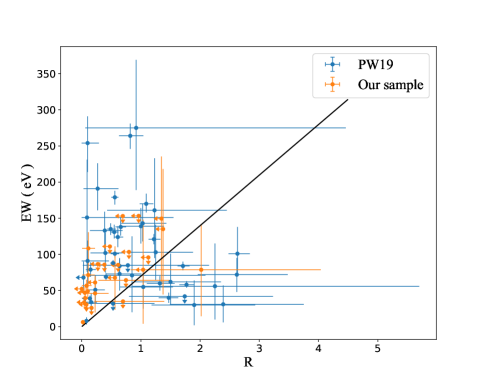
Positive correlation between the reflection factor R and Fe K line strength EW is expected, as both are expected to correlate with the covering factor of the surrounding cold medium, e.g., the accretion disc and the torus, which is illuminated by the central X-ray source and reradiates the reflection continuum and Fe K line (e.g. Matt et al. 1991). However, we are unable to detect significant correlation using our sample alone (Fig. 8), likely because the large statistical uncertainties. We find no correlation either between R and EW using the radio quiet PW19 sample, though PW19 reported clear correlation between the Fe K line flux and the flux of the reflected emission at 30 keV (likely because both fluxes positively correlate with source brightness). Combining our sample with PW19 sample, we find a marginal correlation between R and EW (generalized Spearman test within ASURV finding = 0.260 and P-value = 0.014). However the scatter is also remarkable (see Fig. 8), with only 65.7% of sources agree with the best-fit linear correlation within 90% statistical uncertainties. This suggests that the coupling between continuum reflection and Fe K line is more complicated than a simple linear relation. For instance an anti-correlation between R and EW had been revealed in literature (e.g. in NGC 5548, Chiang et al. 2000). Fitting the continuum reflection and Fe K line strictly tied, which thus should only be used with caution, may bias the measurements of continuum reflection and then (e.g. Mantovani et al. 2016; Zhang et al. 2018).
IV.4. Jet contamination
In this work we have shown that a significant fraction of of our radio galaxies (13 out of 28) show high energy cutoff in their X-ray spectra, and those non-detections of Ecut could be dominantly attributed to their low counts. This suggests that the X-ray spectra of our sample is dominated by the thermal corona emission instead of jet.
However, strong jet contamination are still possible in a small number of individual sources. The jet contamination could be particularly severe in some sources, from which the known extended jet-driven X-ray emission (Pic A, for an example, see Hardcastle & Croston 2005; Hardcastle et al. 2016; Migliori et al. 2007) is unresolvable for . In fact the Ecut detection in Pic A presented in this work is marginal, and we are unable to rule out severe jet contamination in this source.
A more proper interpretation of our results is, for the majority of our sample, the spectra are corona dominated. Our sample also contains 4 FR I galaxies, and 4 core-dominated sources. We mark those sources in Fig. 3 and Fig. 4. Likely due to the small numbers, we are unable to reveal statistical differences between their detection rates of Ecut (2 out of 4 FR Is, 1 out of 4 core-dominated, and 10 out of 20 FR II galaxies), or between their distributions of Ecut, , R or Fe K line EW. Interestingly, however, from Fig. 4 we do see hints that the jet contribution to spectra in our FR I and core-dominated galaxies are likely higher than in FR II galaxies: the 3 FR I or core-dominated galaxies with Ecut detections have the most counts among all sources, and the only two Ecut non-detections at counts 104.5 are FR I or core-dominated. This suggests that while detecting Ecut with spectra is feasible in FR I or core-dominated galaxies, it could be more challenging (comparing to FR IIs) due to jet contamination.
Radio galaxies with strong jet contributions could be gamma-ray bright sources. We further match our sample with Fermi-LAT Fourth Source Catalog (Abdollahi et al. 2020) which includes 5,064 sources above 4 significance based on the first eight years of science data from the Fermi Gamma-ray Space Telescope mission in the energy range from 50 MeV to 1 TeV. We find 9 Fermi gamma-ray sources in our sample, including all the 4 core-dominated sources, 3 out of 4 FR Is, and 2 out of 20 FR IIs. These 9 sources, which are marked in Tab. 2, may have stronger jet contribution to the spectra. Among them we report Ecut detections for 5 sources, including 1 core-dominated, 2 FR Is, and 2 FR IIs. Likely due to the small number of sources, we are unable to reveal significant difference between this subsample (Fermi detected) and the rest of the sample, in the distribution of their Ecut, , R and Fe K line EW. We calculate the ratio of Fermi/LAT 100 MeV – 100 GeV flux to 3–78 keV flux for the 9 sources (see Tab. 5). We find that the 3 sources with highest LAT/NuSTAR flux ratios (3C 279, 3C 345, NGC 1275) have Ecut non-detected, meanwhile 5 out the rest 6 sources show Ecut detections, including 3C 273 which has the 4th highest LAT/NuSTAR flux ratio ( 0.53). This also hints that while the jet contamination does not affect the Ecut detection in the majority of our sample, it may have hindered the detection of Ecut in a few sources.
|
|
|
|
||||||
|---|---|---|---|---|---|---|---|---|---|
| 3C 279 | 2.8e-10 | 3.3e-11 | 8.37 | ||||||
| NGC 1275 | 2.8e-10 | 1.1e-10 | 2.56 | ||||||
| 3C 345 | 2.8e-11 | 1.5e-11 | 1.92 | ||||||
| 3C 273 | 1.3e-10 | 2.4e-10 | 0.53 | ||||||
| 3C 309.1 | 3.0e-12 | 5.8e-12 | 0.51 | ||||||
| PicA | 4.7e-12 | 2.2e-11 | 0.22 | ||||||
| 3C 111 | 1.6e-11 | 1.1e-10 | 0.14 | ||||||
| 3C 120 | 1.3e-11 | 1.3e-10 | 0.10 | ||||||
| CentaurusA | 6.4e-11 | 9.1e-10 | 0.07 |
-
•
: The Fermi/LAT flux is calculated in 100 MeV – 100 GeV, while the flux is in 3 – 78 keV.
Detailed X-ray spectral fitting including both the jet and corona components (Lohfink et al. 2013b; Madsen et al. 2015) or broadband SED modeling (e.g. Kataoka et al. 2011) might be able to quantifying the jet contamination. For instance Madsen et al. (2015) examined possible jet contribution to spectra of 3C 273 with simultaneous and INTEGRAL observations. They found jet emission starts to dominate only above 30 – 40 keV, and fitting spectra alone can not reveal the jet component. While measuring the jet contribution is beyond the scope of this work, we expect the jet contribution to spectra in most of our sources be weaker than that in the blazar 3C 273.
IV.5. The physical nature of the X-ray coronae in radio galaxies?
The facts that radio AGNs show flatter X-ray spectra as well as weaker reflection and Fe K line, have been extensively discussed. One possibility is strong contamination to hard X-ray spectra from the jet emission (e.g. Reeves et al. 1997; Grandi et al. 2002), as the Doppler boosted X-ray emission from the jet is flatter and yields little illumination on the disk and equatorial material. However, in this work we have shown that the spectra of the majority of our radio galaxy sample are dominated by corona emission, thus jet contamination is unable to explain the observed flatter spectra and smaller R and EW.
Since the distribution of our radio galaxies is similar to that of radio quiet AGNs (see §IV.1), we expect the corona temperature in radio galaxies is similar to that in radio quiet AGNs. The spectral hardening in our radio galaxies thus can not be attributed to higher coronal temperature either. Consequently, the X-ray coronae in radio galaxies should have geometry different from those in radio quiet AGNs.
A further note is that in 3C 273, though the jet contamination is weak, including a jet component yields even lower (Madsen et al. 2015), which means we may have overestimated (then corona temperature) in radio galaxies if the jet contamination in which is comparable to or stronger than that in 3C 273.
Possible mechanisms to explain the weak X-ray reflection and Fe K line in radio galaxies also include highly ionized inner disk (Ballantyne et al. 2002), different inner disc geometry (in the form of ion-supported torus or advection-dominated accretion flow, Eracleous et al. 2000), obscuration of the central accretion flow (where reflection is produced) by the jet or the corona itself (Sambruna et al. 2009), self-obscuration by the geometrically thick accretion disc (Paltani et al. 1998), and outflowing corona (Beloborodov 1999; Malzac et al. 2001; Ballantyne et al. 2014; Lohfink et al. 2015, 2017; King et al. 2017).
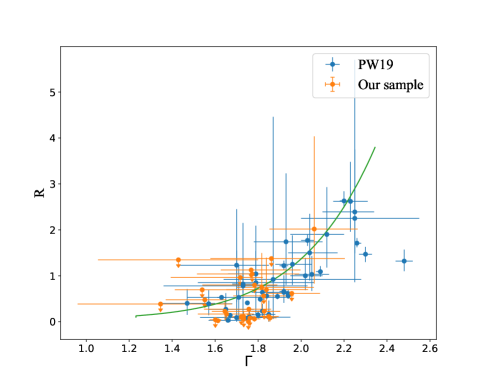
Below we show that the findings in this work favor the outflowing corona model, in which the flatter X-ray spectra and weaker X-ray reflection in radio galaxies could be consistently be attributed to higher outflowing velocity, though we are unable to robustly rule out other possibilities. PW19 reported a clear correlation between and the reflection factor R for their (mostly radio quiet) sample, and the correlation is genuine, e.g., can not be attributed to the coupling between the two parameters and R in the model. In Fig. 9 we plot photon index and the reflection factor R for our sample. Due to the usually small R and large uncertainties, we are unable to detect significant correlation using our sample alone. However, combining with the PW19 sample, we find a strong correlation between and R (generalized Spearman test finding = 0.712 and P-value , Fig. 9). More importantly, while radio loud AGNs have clearly flatter spectra and smaller R, they appear well consistent with the – R correlation defined by the radio quiet sources, suggesting a common underlying mechanism for both populations. Such a – R correlation, firstly observed by Zdziarski et al. (1999), appears consistent with the outflowing corona model555 Alternatively, the observed – R correlation may be attributed to variable overlap between hot and cold accretion flows (e.g. Zdziarski et al. 1999), or a combination of distant reflection and a pivoting primary powerlaw spectrum with a nearly constant Comptonized luminosity (e.g. Malzac & Petrucci 2002). of Beloborodov (1999) in which the corona is outflowing with a relativistic bulk velocity perpendicular to the disc. In the model, the apparent strength of the disk reflection component R is given by:
| (1) |
where is the bulk velocity of the outflowing away from the reflector, and determined by the coronal geometry (for example, describes a slab geometry, while roughly corresponds to a blob with radius of order its height(for details, please refer to Beloborodov 1999). Assuming a typical , the photon index can be approximated as:
| (2) |
The expected -R relation is shown in Fig. 9, generally consistent with the observed trend.
Note in the model of Beloborodov (1999), = 2.0 is assumed for spectra from static corona. Based on the model, outflowing (inflowing) corona yields flatter (steeper) spectra. For instance, = 1.44 is expected for an outflowing velocity of 0.8c, and 2.36 for an inflowing velocity of 0.6c. However, considering possible large scatter in the corona physical properties (geometry, temperature, opacity) of various AGNs, and there are additional factors which may affect the reflection strength (such as the light bending effect, and reflection from distant material other than the disk), we stress that spectra steeper than = 2.0 in Fig. 9 do not necessarily imply inflowing corona, thus do not necessarily object the studies which reported other observational evidences supporting outflowing corona also in radio quiet AGNs (Liu et al. 2014; Wilkins & Gallo 2015). Nevertheless, based on the outflowing corona model, Fig. 9 implies that the corona in radio galaxies could have higher outflow velocity compared with radio quiet AGNs.
V. Summary
In this work we present 55 NuSTAR observations of a sample of 28 radio galaxies (mostly FR II galaxies) with weak beaming effect of the relativistic jet and X-ray absorption column density NH 1023 cm-2. We fit the spectra uniformly to measure the spectral photon index , high energy cutoff , the X-ray reflection factor R, and the Fe K line EW. Our main results are as follows:
-
•
We report detections in 13 sources and lower limits to the rest 15 sources. Over half of them (7 detections and 11 lower limits) are reported for the first time.
-
•
The non-detections is primarily due to the their lower NuSTAR net photon counts. This implies that the NuSTAR X-ray emission of the majority of our sample, are dominated by the thermal corona emission.
-
•
Meanwhile, we do see hints that jet contribution may have hindered the detection of in a couple of core-dominated or FR I galaxies.
-
•
The distribution of the detected in our radio sample is indistinguishable from that of radio quiet AGNs reported in literature.
-
•
The radio galaxies in our sample have flatter NuSTAR spectra, as well as smaller reflection factor R and Fe K line EW, comparing with radio quiet ones. The flatter spectra however can not be attributed to jet contamination.
-
•
Combining with a large radio quiet sample, we see a correlation between reflection factor R and Fe K line EW, but with considerably large scatter, showing the coupling between continuum reflection and Fe K line is rather complicated.
-
•
In the plot of R versus , the radio galaxies follow the same correlation trend with the radio quiet sample. This supports the outflowing corona model which predicts weaker reflection and flatter X-ray spectra in case of higher corona outflowing velocity.
References
- Abdollahi et al. (2020) Abdollahi, S., Acero, F., Ackermann, M., et al. 2020, ApJS, 247, 33
- Anders & Grevesse (1989) Anders, E., & Grevesse, N. 1989, Geochimica et Cosmochimica Acta, 53, 197
- Arnaud (1996) Arnaud, K. A. 1996, in Astronomical Society of the Pacific Conference Series, Vol. 101, Astronomical Data Analysis Software and Systems V, ed. G. H. Jacoby & J. Barnes, 17
- Ballantyne (2007) Ballantyne, D. R. 2007, Modern Physics Letters A, 22, 2397
- Ballantyne et al. (2002) Ballantyne, D. R., Ross, R. R., & Fabian, A. C. 2002, MNRAS, 332, L45
- Ballantyne et al. (2014) Ballantyne, D. R., Bollenbacher, J. M., Brenneman, L. W., et al. 2014, The Astrophysical Journal, 794, 62
- Bassani et al. (2016) Bassani, L., Venturi, T., Molina, M., et al. 2016, Monthly Notices of the Royal Astronomical Society, 461, 3165
- Bechtold et al. (2002) Bechtold, J., Dobrzycki, A., Wilden, B., et al. 2002, ApJS, 140, 143
- Begelman et al. (1984) Begelman, M. C., Blandford, R. D., & Rees, M. J. 1984, Reviews of Modern Physics, 56, 255
- Beloborodov (1999) Beloborodov, A. M. 1999, ApJ, 510, L123
- Blandford & Königl (1979) Blandford, R. D., & Königl, A. 1979, ApJ, 232, 34
- Buisson et al. (2018) Buisson, D. J. K., Fabian, A. C., & Lohfink, A. M. 2018, MNRAS, 481, 4419
- Cappi et al. (2016) Cappi, M., De Marco, B., Ponti, G., et al. 2016, A&A, 592, A27
- Chiang et al. (2000) Chiang, J., Reynolds, C. S., Blaes, O. M., et al. 2000, ApJ, 528, 292
- Condon et al. (1998) Condon, J. J., Cotton, W. D., Greisen, E. W., et al. 1998, AJ, 115, 1693
- Edge et al. (2002) Edge, D. O., Shakeshaft, J. R., McAdam, W. B., Baldwin, J. E., & Archer, S. 2002, VizieR Online Data Catalog, 8001
- Eracleous et al. (2000) Eracleous, M., Sambruna, R., & Mushotzky, R. F. 2000, ApJ, 537, 654
- Evans et al. (2006) Evans, D. A., Worrall, D. M., Hardcastle, M. J., Kraft, R. P., & Birkinshaw, M. 2006, ApJ, 642, 96
- Feigelson & Nelson (1985) Feigelson, E. D., & Nelson, P. I. 1985, ApJ, 293, 192
- Fürst et al. (2016) Fürst, F., Müller, C., Madsen, K. K., et al. 2016, The Astrophysical Journal, 819, 150
- García et al. (2014) García, J., Dauser, T., Lohfink, A., et al. 2014, The Astrophysical Journal, 782, 76
- Grandi et al. (2001) Grandi, P., Maraschi, L., Urry, C. M., & Matt, G. 2001, ApJ, 556, 35
- Grandi et al. (2002) Grandi, P., Urry, C. M., & Maraschi, L. 2002, NewAR, 46, 221
- Haardt & Maraschi (1993) Haardt, F., & Maraschi, L. 1993, ApJ, 413, 507
- Hardcastle & Croston (2005) Hardcastle, M. J., & Croston, J. H. 2005, MNRAS, 363, 649
- Hardcastle et al. (2009) Hardcastle, M. J., Evans, D. A., & Croston, J. H. 2009, MNRAS, 396, 1929
- Hardcastle et al. (2016) Hardcastle, M. J., Lenc, E., Birkinshaw, M., et al. 2016, MNRAS, 455, 3526
- Harrison et al. (2013) Harrison, F. A., Craig, W. W., Christensen, F. E., et al. 2013, The Astrophysical Journal, 770, 103
- Hayashida et al. (2015) Hayashida, M., Nalewajko, K., Madejski, G. M., et al. 2015, The Astrophysical Journal, 807, 79
- Hernández-García et al. (2019) Hernández-García, L., Panessa, F., Bassani, L., et al. 2019, Monthly Notices of the Royal Astronomical Society, 489, 4049
- Ishibashi & Courvoisier (2010) Ishibashi, W., & Courvoisier, T. J. L. 2010, A&A, 512, A58
- Kamraj et al. (2018) Kamraj, N., Harrison, F. A., Baloković, M., Lohfink, A., & Brightman, M. 2018, The Astrophysical Journal, 866, 124
- Kataoka et al. (2011) Kataoka, J., Stawarz, Ł., Takahashi, Y., et al. 2011, ApJ, 740, 29
- King et al. (2017) King, A. L., Lohfink, A., & Kara, E. 2017, ApJ, 835, 226
- Lanzuisi et al. (2016) Lanzuisi, G., Perna, M., Comastri, A., et al. 2016, A&A, 590, A77
- Liu et al. (2014) Liu, T., Wang, J.-X., Yang, H., Zhu, F.-F., & Zhou, Y.-Y. 2014, The Astrophysical Journal, 783, 106
- Lohfink et al. (2013a) Lohfink, A. M., Reynolds, C. S., Jorstad, S. G., et al. 2013a, ApJ, 772, 83
- Lohfink et al. (2013b) —. 2013b, ApJ, 772, 83
- Lohfink et al. (2015) Lohfink, A. M., Ogle, P., Tombesi, F., et al. 2015, ApJ, 814, 24
- Lohfink et al. (2017) Lohfink, A. M., Fabian, A. C., Ballantyne, D. R., et al. 2017, ApJ, 841, 80
- Madsen et al. (2015) Madsen, K. K., Fürst, F., Walton, D. J., et al. 2015, The Astrophysical Journal, 812, 14
- Madsen et al. (2015) Madsen, K. K., Harrison, F. A., Markwardt, C. B., et al. 2015, ApJS, 220, 8
- Magdziarz & Zdziarski (1995) Magdziarz, P., & Zdziarski, A. A. 1995, MNRAS, 273, 837
- Malzac et al. (2001) Malzac, J., Beloborodov, A. M., & Poutanen, J. 2001, MNRAS, 326, 417
- Malzac & Petrucci (2002) Malzac, J., & Petrucci, P.-O. 2002, MNRAS, 336, 1209
- Mantovani et al. (2016) Mantovani, G., Nandra, K., & Ponti, G. 2016, MNRAS, 458, 4198
- Matt et al. (1991) Matt, G., Perola, G. C., & Piro, L. 1991, A&A, 247, 25
- Mauch et al. (2003) Mauch, T., Murphy, T., Buttery, H. J., et al. 2003, MNRAS, 342, 1117
- Middei et al. (2018) Middei, R., Bianchi, S., Cappi, M., et al. 2018, A&A, 615, A163
- Middei et al. (2019) Middei, R., Bianchi, S., Petrucci, P. O., et al. 2019, MNRAS, 483, 4695
- Migliori et al. (2007) Migliori, G., Grandi, P., Palumbo, G. G. C., Brunetti, G., & Stanghellini, C. 2007, ApJ, 668, 203
- Migliori et al. (2014) Migliori, G., Siemiginowska, A., Kelly, B. C., et al. 2014, ApJ, 780, 165
- Molina et al. (2013) Molina, M., Bassani, L., Malizia, A., et al. 2013, MNRAS, 433, 1687
- Molina et al. (2019) Molina, M., Malizia, A., Bassani, L., et al. 2019, Monthly Notices of the Royal Astronomical Society, 484, 2735
- Molina et al. (2009) Molina, M., Bassani, L., Malizia, A., et al. 2009, Monthly Notices of the Royal Astronomical Society, 399, 1293
- Nandra et al. (2007) Nandra, K., O’Neill, P. M., George, I. M., & Reeves, J. N. 2007, MNRAS, 382, 194
- Ogle et al. (2005) Ogle, P. M., Davis, S. W., Antonucci, R. R. J., et al. 2005, ApJ, 618, 139
- Oh et al. (2018) Oh, K., Koss, M., Markwardt, C. B., et al. 2018, ApJS, 235, 4
- Page et al. (2005) Page, K. L., Reeves, J. N., O’Brien, P. T., & Turner, M. J. L. 2005, Monthly Notices of the Royal Astronomical Society, 364, 195
- Paltani et al. (1998) Paltani, S., Courvoisier, T. J. L., & Walter, R. 1998, A&A, 340, 47
- Panagiotou & Walter (2019) Panagiotou, C., & Walter, R. 2019, A&A, 626, A40
- Panessa et al. (2016) Panessa, F., Bassani, L., Landi, R., et al. 2016, Monthly Notices of the Royal Astronomical Society, 461, 3153
- Petrucci et al. (2001) Petrucci, P. O., Haardt, F., Maraschi, L., et al. 2001, ApJ, 556, 716
- Piconcelli et al. (2005) Piconcelli, E., Jimenez-Bailón, E., Guainazzi, M., et al. 2005, A&A, 432, 15
- Porquet et al. (2018) Porquet, D., Reeves, J. N., Matt, G., et al. 2018, A&A, 609, A42
- Rani et al. (2018) Rani, B., Madejski, G. M., Mushotzky, R. F., Reynolds, C., & Hodgson, J. A. 2018, The Astrophysical Journal, 866, L13
- Rani & Stalin (2018a) Rani, P., & Stalin, C. S. 2018a, The Astrophysical Journal, 856, 120
- Rani & Stalin (2018b) —. 2018b, Journal of Astrophysics and Astronomy, 39, 15
- Rani et al. (2019) Rani, P., Stalin, C. S., & Goswami, K. D. 2019, Monthly Notices of the Royal Astronomical Society, 484, 5113
- Reeves & Turner (2000) Reeves, J. N., & Turner, M. J. L. 2000, Monthly Notices of the Royal Astronomical Society, 316, 234
- Reeves et al. (1997) Reeves, J. N., Turner, M. J. L., Ohashi, T., & Kii, T. 1997, MNRAS, 292, 468
- Reynolds et al. (2015) Reynolds, C. S., Lohfink, A. M., Ogle, P. M., et al. 2015, The Astrophysical Journal, 808, 154
- Ricci et al. (2011) Ricci, C., Walter, R., Courvoisier, T. J. L., & Paltani, S. 2011, A&A, 532, A102
- Sambruna et al. (1999) Sambruna, R. M., Eracleous, M., & Mushotzky, R. F. 1999, ApJ, 526, 60
- Sambruna et al. (2007) Sambruna, R. M., Reeves, J. N., & Braito, V. 2007, The Astrophysical Journal, 665, 1030
- Sambruna et al. (2009) Sambruna, R. M., Reeves, J. N., Braito, V., et al. 2009, ApJ, 700, 1473
- Shu et al. (2010) Shu, X. W., Yaqoob, T., & Wang, J. X. 2010, The Astrophysical Journal Supplement Series, 187, 581
- Siemiginowska et al. (2012) Siemiginowska, A., Stawarz, Ł., Cheung, C. C., et al. 2012, The Astrophysical Journal, 750, 124
- Tange (2011) Tange, O. 2011, ;login: The USENIX Magazine, 36, 42
- Tortosa et al. (2018) Tortosa, A., Bianchi, S., Marinucci, A., Matt, G., & Petrucci, P. O. 2018, A&A, 614, A37
- Tortosa et al. (2017) Tortosa, A., Bianchi, S., Marinucci, A., et al. 2017, Monthly Notices of the Royal Astronomical Society, 473, 3104
- Ursini et al. (2017) Ursini, F., Bassani, L., Panessa, F., et al. 2017, Monthly Notices of the Royal Astronomical Society, 474, 5684
- Ursini et al. (2018) Ursini, F., Bassani, L., Panessa, F., et al. 2018, MNRAS, 481, 4250
- Walton et al. (2013) Walton, D. J., Nardini, E., Fabian, A. C., Gallo, L. C., & Reis, R. C. 2013, MNRAS, 428, 2901
- White et al. (1997) White, R. L., Becker, R. H., Helfand, D. J., & Gregg, M. D. 1997, ApJ, 475, 479
- White et al. (2000) White, R. L., Becker, R. H., Gregg, M. D., et al. 2000, ApJS, 126, 133
- Wik et al. (2014) Wik, D. R., Hornstrup, A., Molendi, S., et al. 2014, The Astrophysical Journal, 792, 48
- Wilkins & Gallo (2015) Wilkins, D. R., & Gallo, L. C. 2015, MNRAS, 448, 703
- Zdziarski et al. (1999) Zdziarski, A. A., Lubiński, P., & Smith, D. A. 1999, MNRAS, 303, L11
- Zhang et al. (2018) Zhang, J.-X., Wang, J.-X., & Zhu, F.-F. 2018, ApJ, 863, 71
Appendix A A: Sources Excluded from Analyses
We exclude 11 NuSTAR observed radio galaxies from analyses in this work, either because they are heavily obscured ( ), or NuSTAR spectra have too few net counts (3000). The sources are listed in Table 6.
|
|
|
|
|
|
||||||||
|---|---|---|---|---|---|---|---|---|---|---|---|---|---|
| Cygnus A | 60001083002 | 0.056 | 43.6 | 106.9 | 0 | ||||||||
| 60001083004 | 20.7 | 51.2 | |||||||||||
| VII Zw 292 | 60160374002 | 0.058 | 13.0 | 2.0 | 1 | ||||||||
| 3C 452 | 60261004002 | 0.081 | 51.7 | 15.4 | 2 | ||||||||
| 3C 445 | 60160788002 | 0.056 | 19.9 | 8.3 | 3 | ||||||||
| NGC612 | 60061014002 | 0.03 | 16.7 | 2.9 | 4 | ||||||||
| 3C 098 | 60061042002 | 0.03 | 27.3 | 4.4 | 5 | ||||||||
| 3C 234.0 | 60160382002 | 0.185 | 14.9 | 2.1 | 6 | ||||||||
| PKS 0707-35 | 60160285002 | 0.111 | 18.9 | 1.6 | 7 | ||||||||
| 4C 29.30 | 60061083002 | 0.065 | 21.0 | 2.1 | 8 | ||||||||
| Mrk 1498 | 60160640002 | 0.055 | 23.6 | 14.1 | 9 | ||||||||
| 3C 403 | 60061293002 | 0.059 | 20.0 | 4.6 | 10 |
-
•
0 : too strong absorption with (Reynolds et al. 2015).
-
•
1 : too faint with total net counts1000 and compton-thick (Ursini et al. 2017).
-
•
2 : too strong absorption with (Ursini et al. 2017).
-
•
3 : too strong absorption with (Sambruna et al. 2007).
-
•
4 : too faint with total net counts1500 and compton-thick (Ursini et al. 2017).
-
•
5 : too strong absorption with (Panessa et al. 2016).
-
•
6 : too faint with total net counts1100.
-
•
7 : too faint with total net counts800.
-
•
8 : too faint with total net counts1100 and too strong absorption with (Siemiginowska et al. 2012).
-
•
9 : too strong absorption with (Hernández-García et al. 2019).
-
•
10 : too strong absorption with . The NuSTAR spectra for this source is reported the first time in this work. The best-fit spectral parameters with our base model are , keV, and eV ().
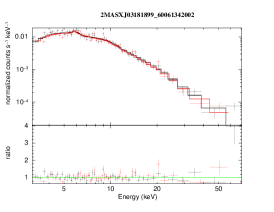
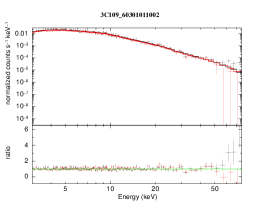
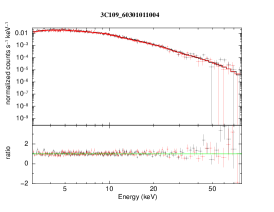
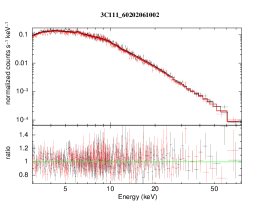
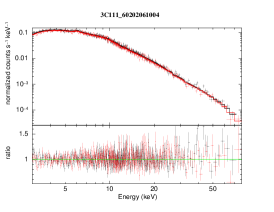
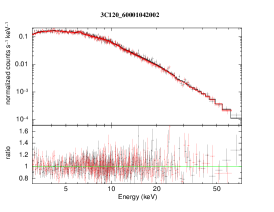
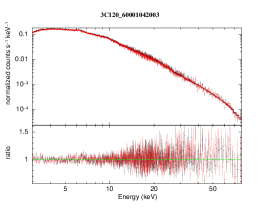
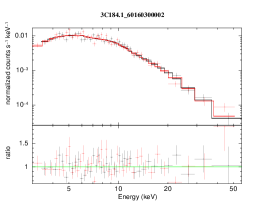
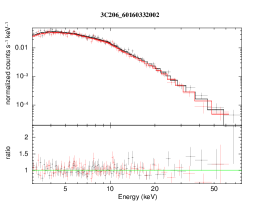
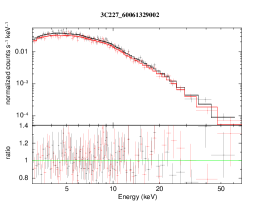
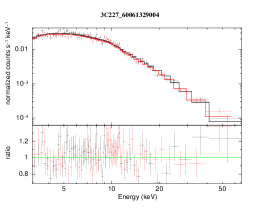
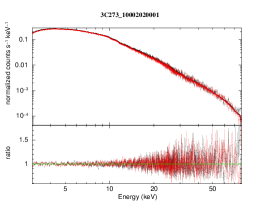
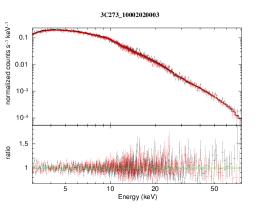
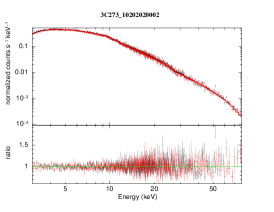
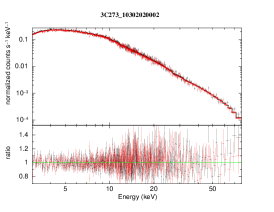
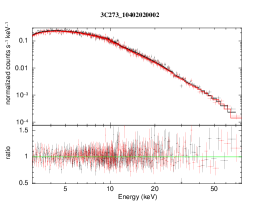
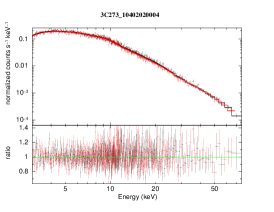
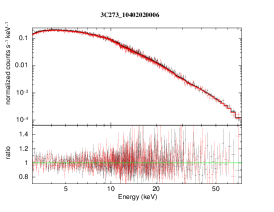
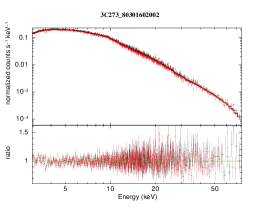
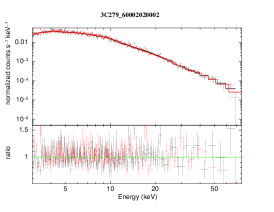
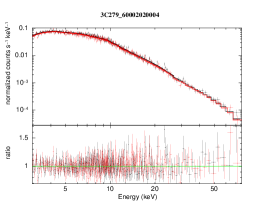
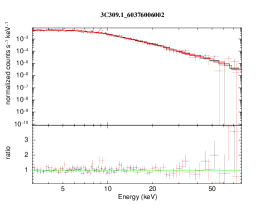
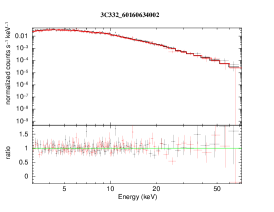
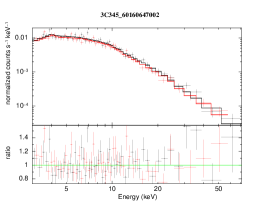
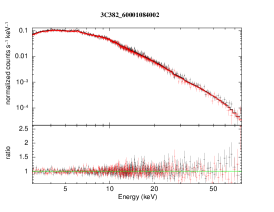
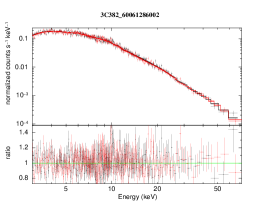
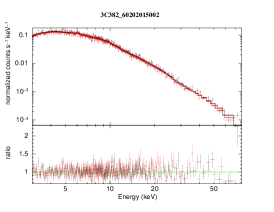
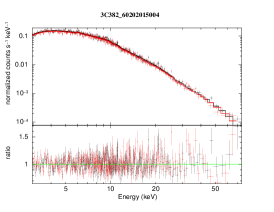
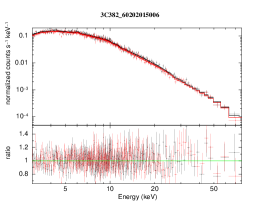
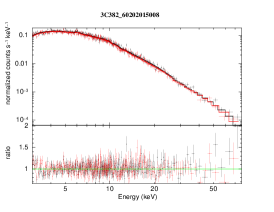
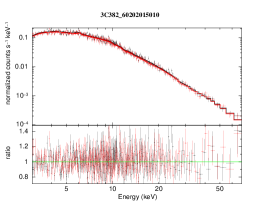
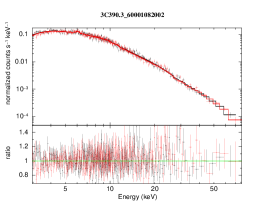
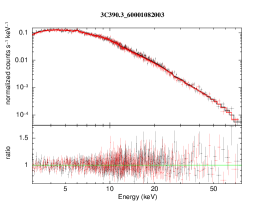
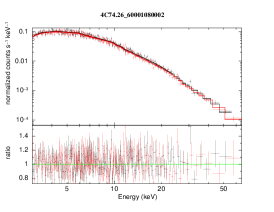
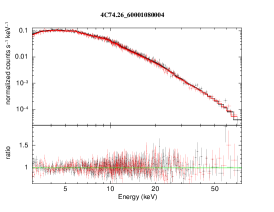
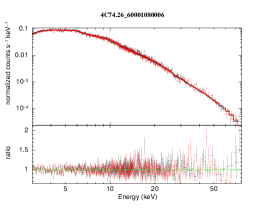
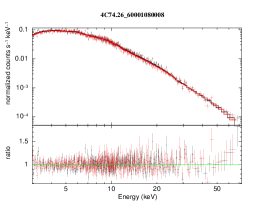
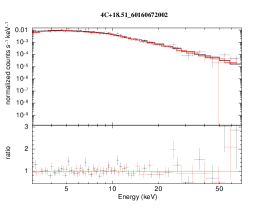
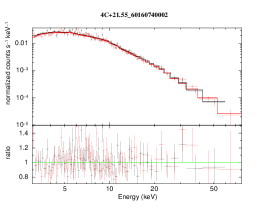
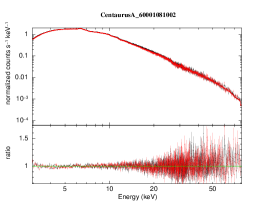
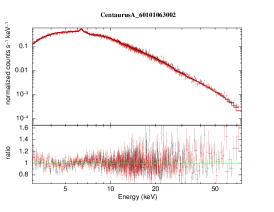
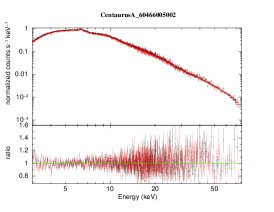
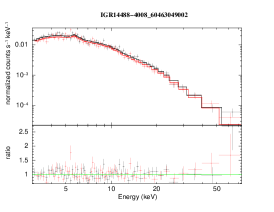
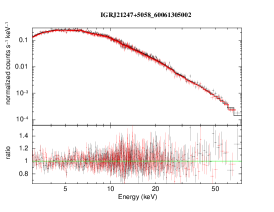
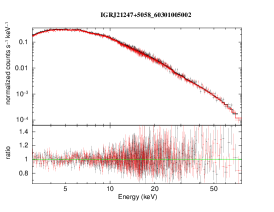
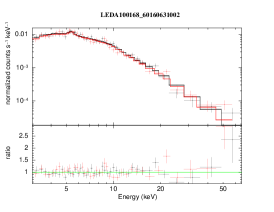
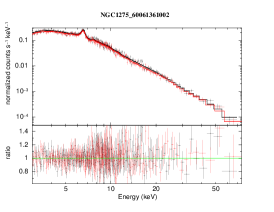
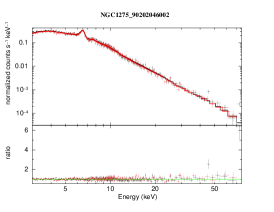
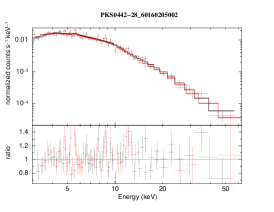
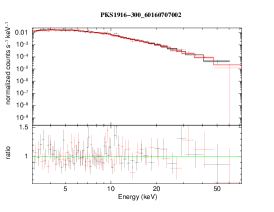
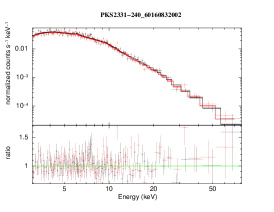
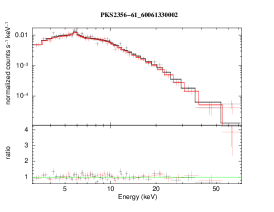
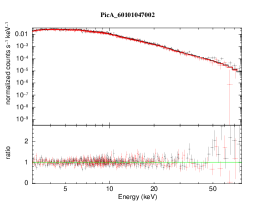
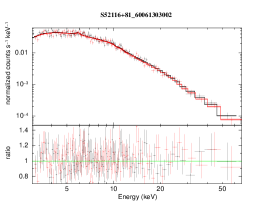
Appendix B B: NuSTAR Spectra
In this section, we present NuSTAR unfolded spectra analyzed in this work, along with the best-fit models and the residual data-to-model ratios (Fig. 10).
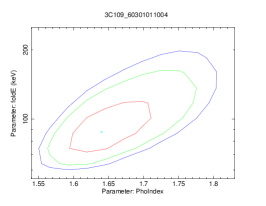
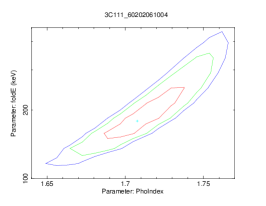
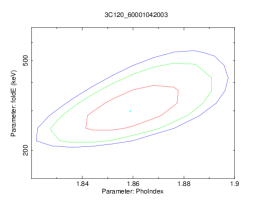
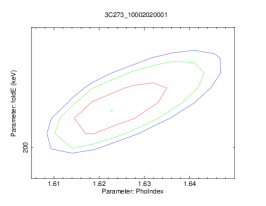
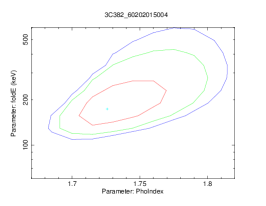
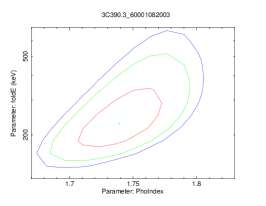
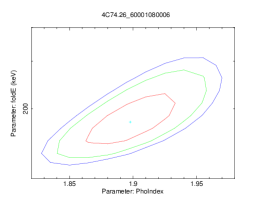
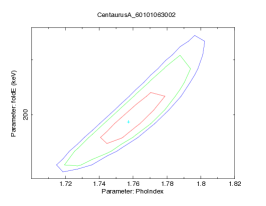
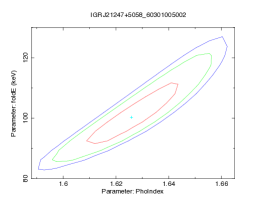
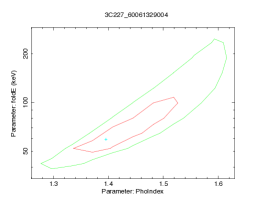
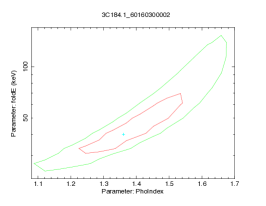
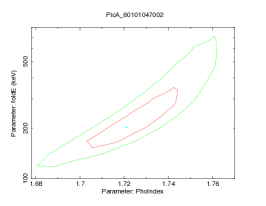
Appendix C C: – contours
We plot the vs contours of 13 sources with detection. For sources with multiple observations, the best constrained one is plotted.