A Study on Visual Perception of Light Field Content
Abstract
The effective design of visual computing systems depends heavily on the anticipation of visual attention, or saliency. While visual attention is well investigated for conventional 2D images and video, it is nevertheless a very active research area for emerging immersive media. In particular, visual attention of light fields (light rays of a scene captured by a grid of cameras or micro lenses) has only recently become a focus of research. As they may be rendered and consumed in various ways, a primary challenge that arises is the definition of what visual perception of light field content should be. In this work, we present a visual attention study on light field content. We conducted perception experiments displaying them to users in various ways and collected corresponding visual attention data. Our analysis highlights characteristics of user behaviour in light field imaging applications. The light field data set and attention data are provided with this paper.
Keywords: Light fields, rendering, visual perception, visual attention, saliency
1 Introduction
New developments in capture [Broxton et al., 2019] and display technologies [Lee et al., 2016, Overbeck et al., 2018] introduced a novel way of visual media representation - the light field. In contrast to traditional imaging systems, which capture a 3D scene by projecting it onto a 2D surface, light fields [Levoy and Hanrahan, 1996, Gortler et al., 1996] encode all angular, directional and intensity information of light rays travelling within a 3D-space. Light fields can be displayed in 3D on 360-degree displays [Jones et al., 2007] or specialised light field displays [Lanman et al., 2011]. They can also be viewed in 2D, as sheared perspective views or as focal stacks - where images with differing focal planes of the light field appear sharp or “in focus". Focal stacks are computed using digital refocusing [Ng et al., 2005, Le Pendu et al., 2019].
Light fields hold more information than a regular image and can be used in various applications [Matysiak et al., 2020] including refocusing [Le Pendu et al., 2019] and streaming [Alain et al., 2019]. It’s plausible that visual attention (where people look when they view a scene) varies according to media type. As a type distinct from 2D-image captures of scenes, light fields’ relationship with visual attention may differ from conventional images. To our knowledge, saliency of varied renderings of light fields has not been previously investigated.
Hence, in this study, we built a light field visual attention database by bringing light fields from different sources together and collecting eye tracking data for different rendering scenarios of them. Our goal was to obtain ground truth visual attention data for light fields and analyse if it differs from attention in 2D images not generated from light fields. Light field refocusing was our chosen method to render the light fields which was representative of their 3D nature, but for a 2D display. We subsequently examined how changes in focus affected participants’ visual attention, treating focus as a cue characteristic of light fields.
The rest of this paper is structured as follows. Section 2 discusses related work. Section 3 introduces the selected light fields and rendering scenarios considered in this study. Details related to the collection of eye-tracking data and user study are given in Section 4. Section 5 provides an analysis and presents the results. We outline our conclusions in Section 6.
2 Related Work
Visual saliency is the subjective term describing perceived pertinent regions or elements of a scene which stand out in the scene context. It has been studied for images [Judd et al., 2009] and videos [Itti, 2005] on planar surfaces. Humans have been found to fixate on regions with greater edge density and local contrast [Reinagel and Zador, 1999]. Low level features such as intensity, orientation and color contrast have been found to guide visual attention [Itti et al., 1998] as well as high level features like faces [Buswell, 1935, Yarbus, 2013]. Viewers in visual attention experiments tend to move their gaze to targets near where they are currently looking. There is also a tendency to look at centrally located targets in their field of view. [Parkhurst et al., 2002].
Previous work in light field saliency has focused on object-based methods of visual saliency prediction [Li et al., 2016, Zhang et al., 2015, Sheng et al., 2016, Zhang et al., 2017, Wang et al., 2019, Zhang et al., 2020]. These works represent saliency ground truth as binary maps. These maps are obtained by manually segmenting objects that stand out in all-in-focus renderings of the light fields and human-labelling those segments as 1 and all other regions as 0. They focus on the localisation of instances of dominant objects, not taking into account tracked human gaze. Only one type of light field rendering is considered, effectively ignoring the 3D nature of light fields.
Eye fixation data collected using eye-tracking devices provides a more meaningful form of ground truth for visual attention compared to binary maps, since it represents the statistical distribution of fixation data. Saliency maps [Koch and Ullman, 1987], which are continuous density maps that represent the probability of fixation at every point in an image, can be computed from this data and can be analysed to make more accurate models for predicting visual attention in light fields. Our work addresses the visual saliency of all spatial locations that attract visual attention, be they regions, objects or points of interest, which is in contrast to previous work. We investigated how attention is affected by changes in focus. Our results show that characteristics specific to light fields influence visual attention, as refocusing is a distinctive feature of light field technology.
3 Database
The data was selected from four main light field datasets: Stanford (New) Light Field Archive [Vaish and Adams, 2008], EPFL Light Field Image Dataset [Rerabek and Ebrahimi, 2016], Disney High Spatio-Angular Resolution Light Fields [Kim et al., 2013] and HCI Heidelberg 4D Light Field Dataset [Honauer et al., 2016]. We believe that the selection of these four datasets makes the collected data representative as the light fields were acquired using a camera array [Vaish and Adams, 2008], a single camera with microlens array [Rerabek and Ebrahimi, 2016], a camera on a gantry [Kim et al., 2013], and computer generated imagery [Honauer et al., 2016] respectively.
We selected 20 light fields from these datasets according to the following criteria: they contained multiple regions or objects with high colour contrast between each other and contained regions with great edge density and local contrast at varied depths and spatial locations.
Slices of a light field focused at a sequence of depths form what is known as a focal stack. We generated these focal stacks for each of our light fields using the Fourier Disparity Layers method [Le Pendu et al., 2019] and used them to simulate traversing a 3D scene on a 2D display. We considered three different scenarios for light field rendering and rendered each light field in five ways as follows:
-
1.
all-in-focus: all the points in the rendered image are in focus.
-
2.
region-in-focus: one slice/image of the focal stack is rendered so only objects at that slice’s specific depth of focus appear sharp. We rendered two regions region-1 and region-2 which have objects in opposite positions of the frame eg. left/right, top/bottom, foreground/background.
-
3.
focal-sweep: all the images of the focal stack are rendered in sequence. We rendered two focal sweeps front-to-back with region of focus moving from foreground to background and back-to-front with region of focus moving from background to foreground.
This created database is made publicly available on our project webpage111https://v-sense.scss.tcd.ie/research/light-fields/visual-attention-for-light-fields/, in order to support further scientific studies in this field. On this webpage, we also share some additional results which we could not add to this paper due to page limitations.
4 Eye Tracking Data Collection
4.1 Apparatus & Setup
We used a desktop mounted eye-tracker, the Eyelink 1000 plus [SR Research, 2016] which records eye movements with a sampling rate of 1000Hz. The visual stimuli were presented on a 23.8 inch Dell P2415Q monitor (height width: 29.6 52.7 cm; native resolution: 4K/UHD/2160p; refresh rate: 60Hz). The monitor was placed at 67cm from the users eye which kept the visual angle of the stimuli between 39∘ and 24∘. The resolution of the monitor was set to be 1920 1080 pixels (16:9 aspect ratio).
The experiment was held in a quiet, well lit room with white walls. We used the standard Eyelink 1000 chin rest to minimise head movement. We specified the width and height of the monitor as well as the resolution and our measured eye to screen distance in the eye-tracker configuration files. The test script was written in Matlab (R2019b) using the EyeLink Toolbox within Psychtoolbox 3 [Kleiner et al., 2007].
4.2 Participants & Methodology
We conducted the experiment, following ethics approval, on 21 participants (16 male and 5 female), aged between 18 and 37 with a mean age of 25.3. A department wide email was sent to students and staff for recruitment. All participants had normal vision or corrected-to-normal vision. The experiment lasted between 25 and 35 minutes for each participant. A brief oral overview of the experiment as well as an information sheet and consent form were provided to participants. They were instructed to view the stimuli freely and naturally while keeping their heads as still as possible. The chin rest position was fixed but the participants could raise or lower their chair until they were comfortable. The distance from the eye to eyetracker was kept at 53cm.
Eye movements of the left eye only were recorded. We used the Eyelink default monocular nine-point calibration and validation procedure. We showed the participants the light fields rendered all-in-focus for 4 seconds each to acquaint them with the data. They were then shown the five renderings of each light field, for 10 seconds each (120 frames with 12 fps), in randomised order, with a 2 seconds interval between. The interval screen was to ensure fixation was re-centered. Randomisation was used to avoid carryover [Greenwald, 1976].
The eye-tracker records eye events, saccades, fixations and blinks. Fixations are periods in which an area of a visual scene is kept on the fovea. Saccades are rapid movements of the eyes whose function is to change the point of fixation by directing the fovea towards an area of visual interest [Yarbus, 2013]. In the subsequent analysis section, we use fixations recorded by the EyeLink Core System in an EyeLink data file (EDF).
5 Results
5.1 Qualitative Analysis
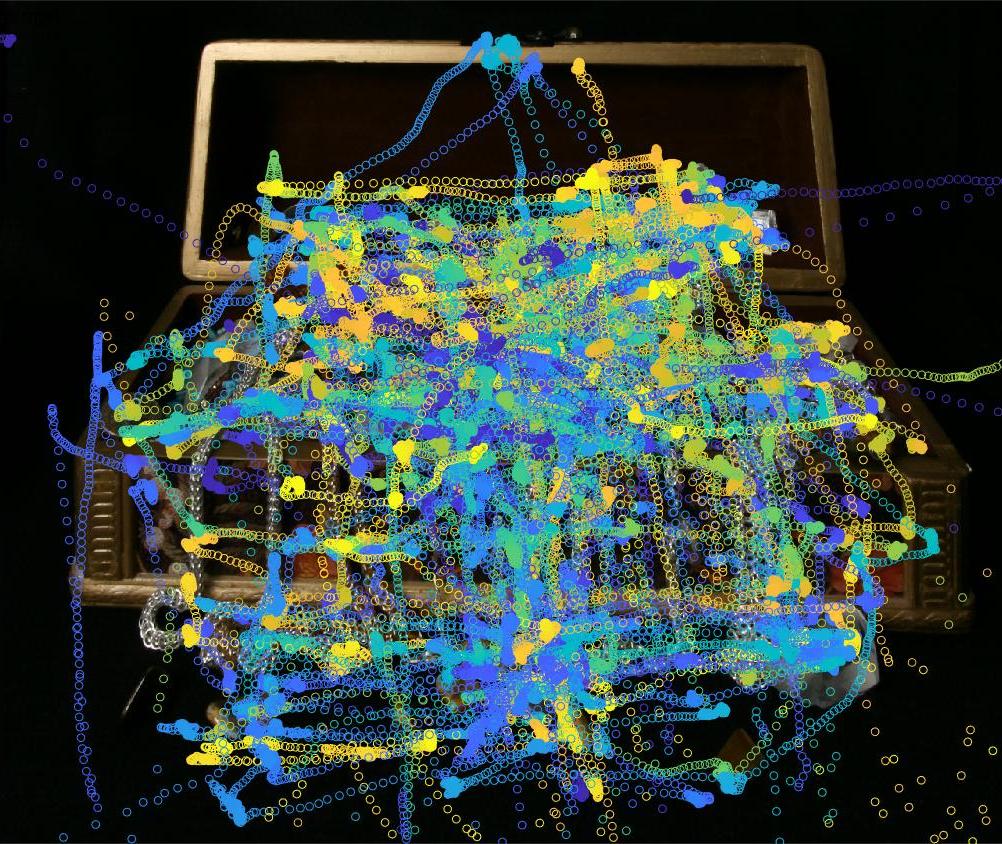
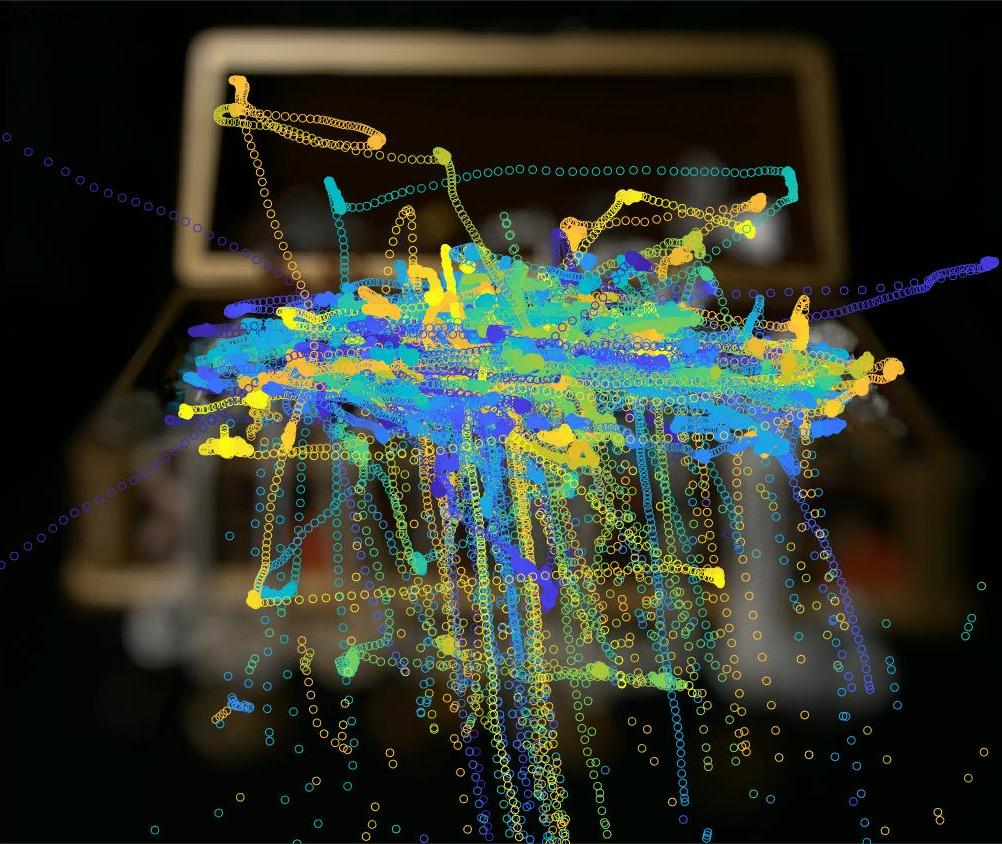
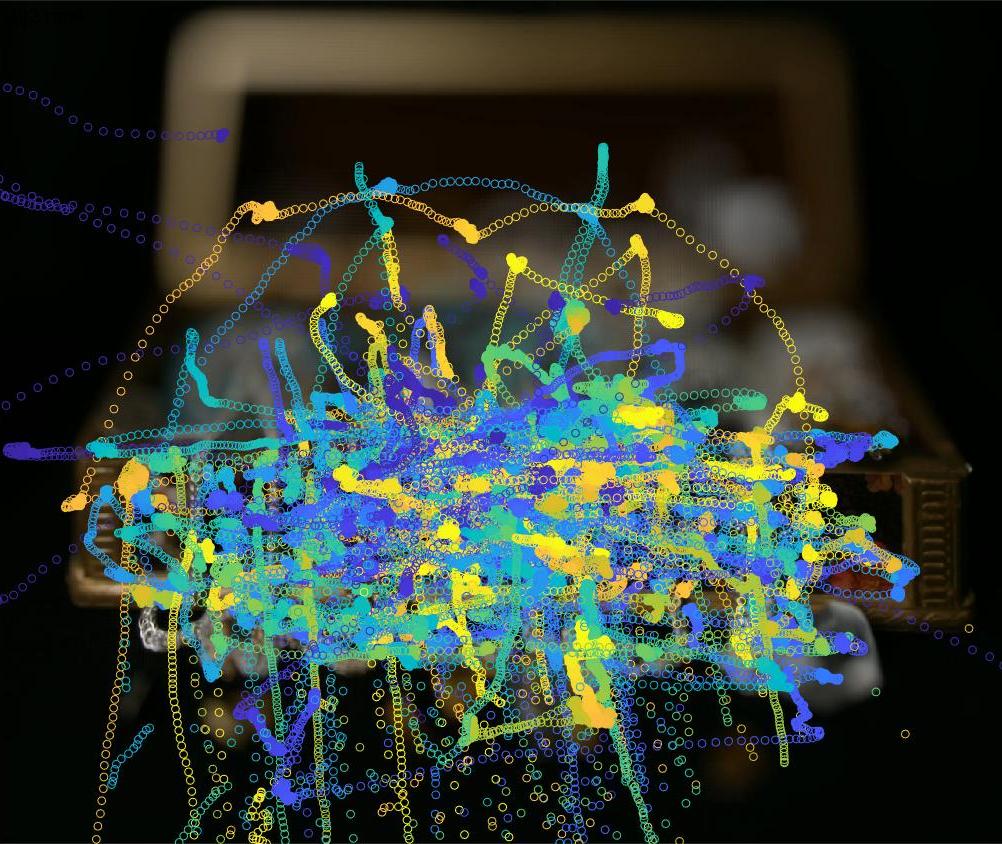
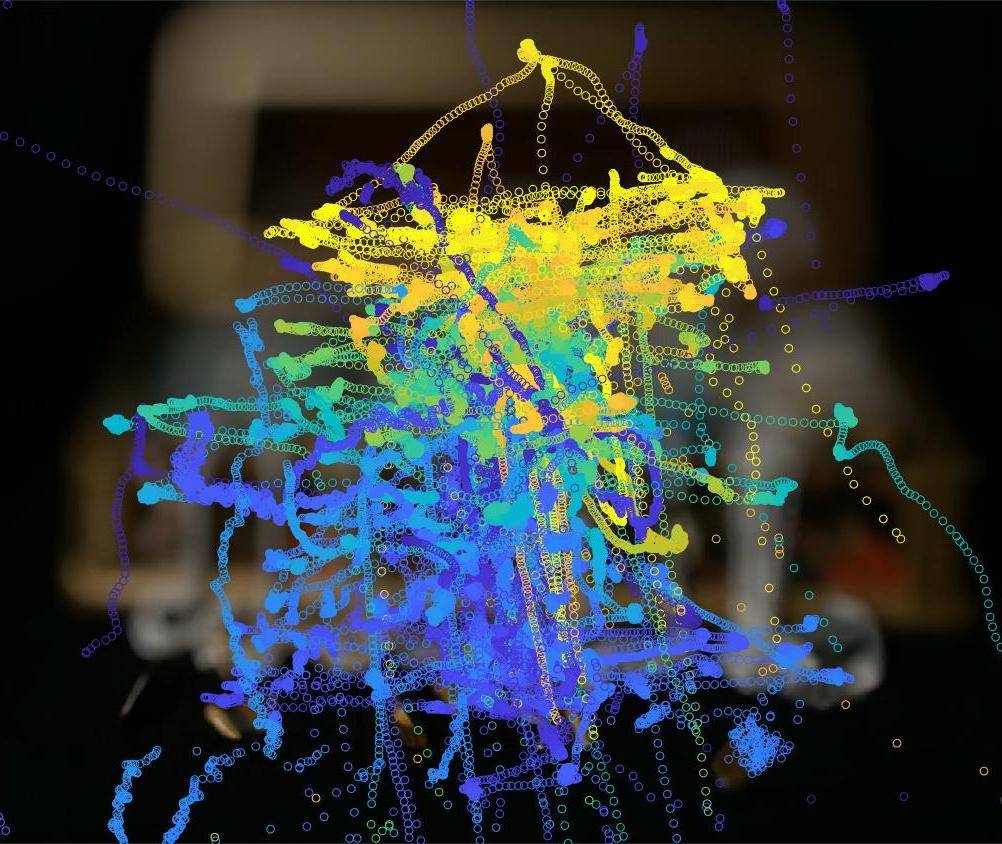
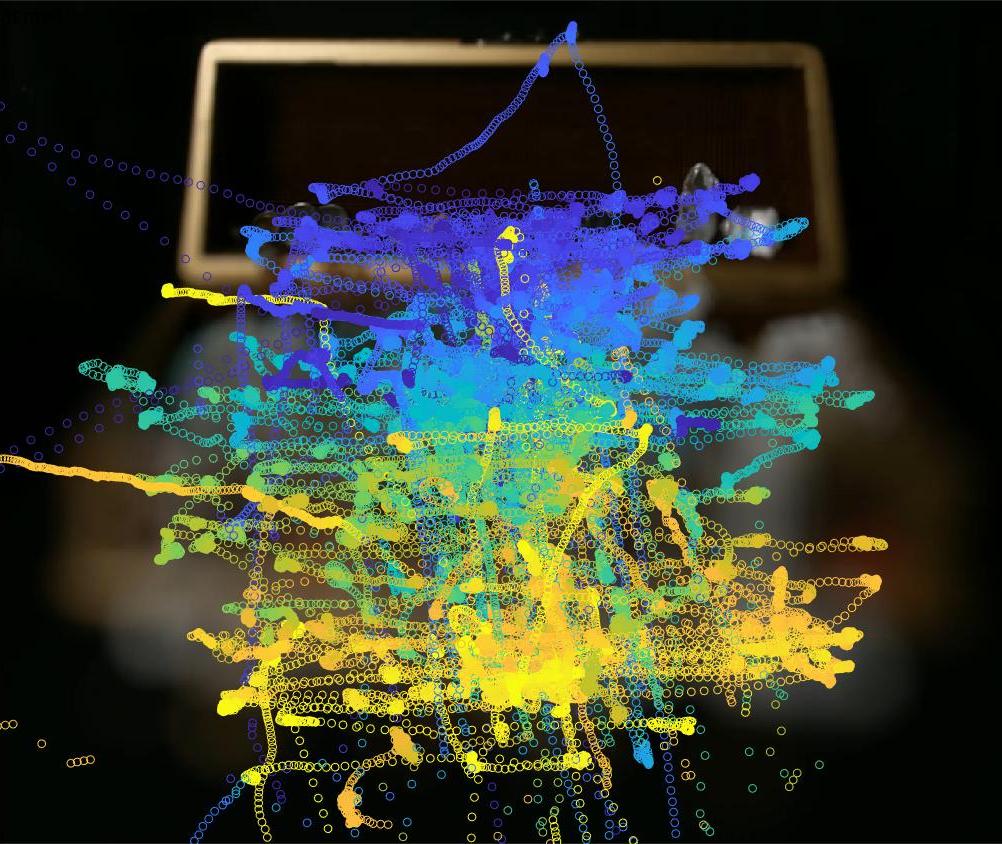
Fig. 1 shows the scanpaths of the raw eye tracking data for each rendering of two sample light fields. Clusters where the colours of the scanpaths are the same reveal a clear path of fixation. This can be observed in the scanpaths of the videos where the focal plane varies over time, as shown in the front-to-back and back-to-front renderings in Fig. 1. This is in contrast to the scanpaths of the data collected with non-varying focal planes i.e, all-in-focus, region-1 and region-2, which suggest that each participant views regions of the scene in a different order. This phenomenon is also seen in images rendered from the other light fields in this data set.


We generated saliency maps from the fixation points recorded by our eye-tracker to further analyse the visual saliency patterns in our data. We applied a Gaussian filter to our fixation data to obtain these maps. As our largest image width was 47.11cm and height was 29.60cm, we calculated the visual angle to be 24.91∘ to 38.74∘ respectively. We then found that 1∘ visual angle corresponds to 47.66 pixels horizontally and 42.67 pixels vertically and used these values as our standard deviations and [Le Meur and Baccino, 2013]. We used the duration of the fixations as a weight when computing the Gaussian.
We created saliency maps for each light field and corresponding rendering in two ways. The first method involved computing maps using the fixations of all participants for the full 10 second video. The second split each video over time into 5 segments (of 2 seconds each). For each of these, we generated a saliency map per segment using the fixations of all participants. This allowed us to see changes in visual attention over time.

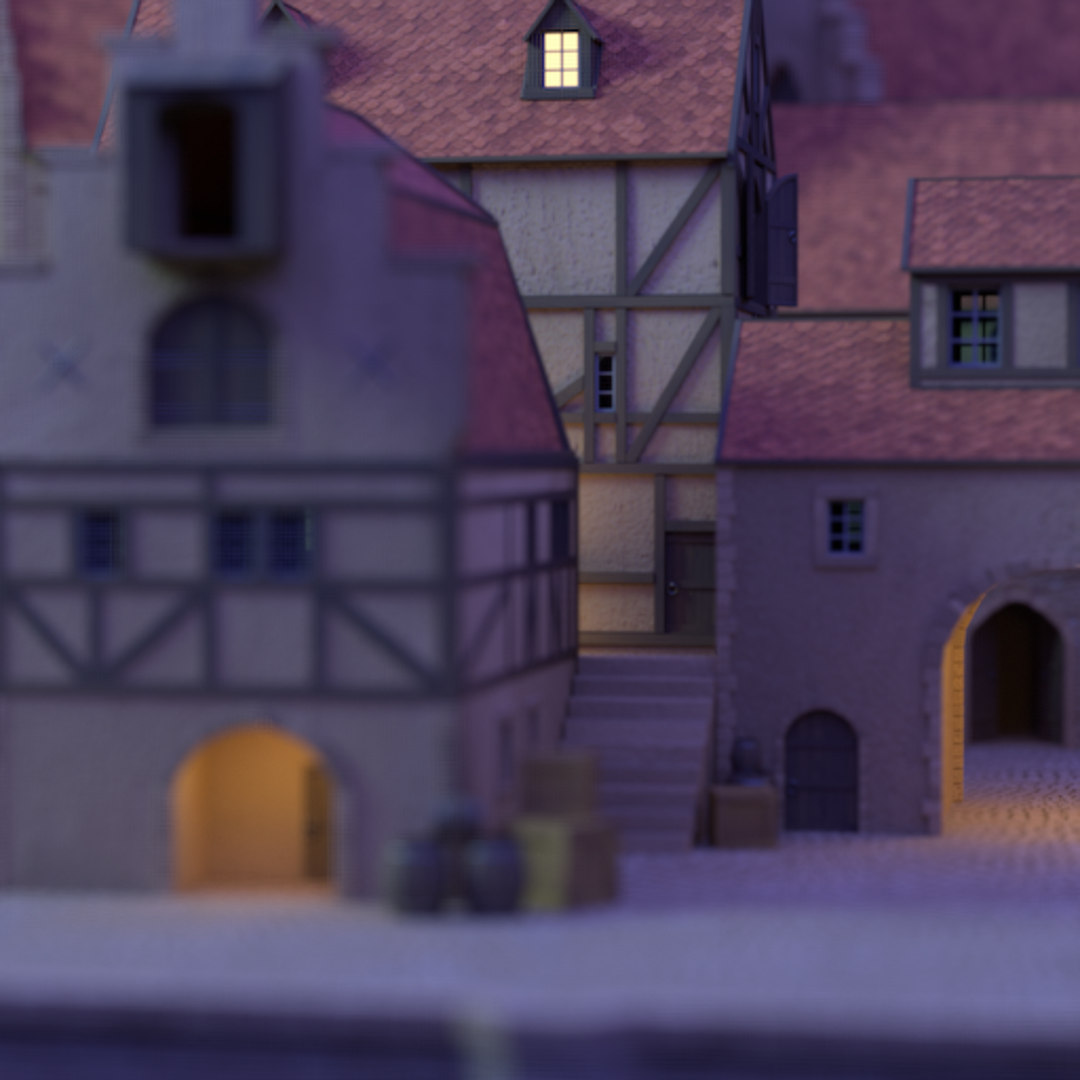


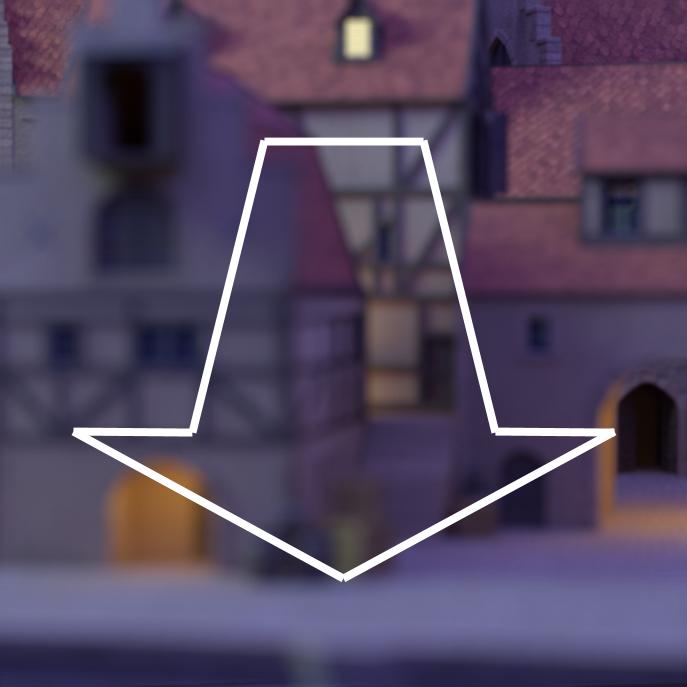
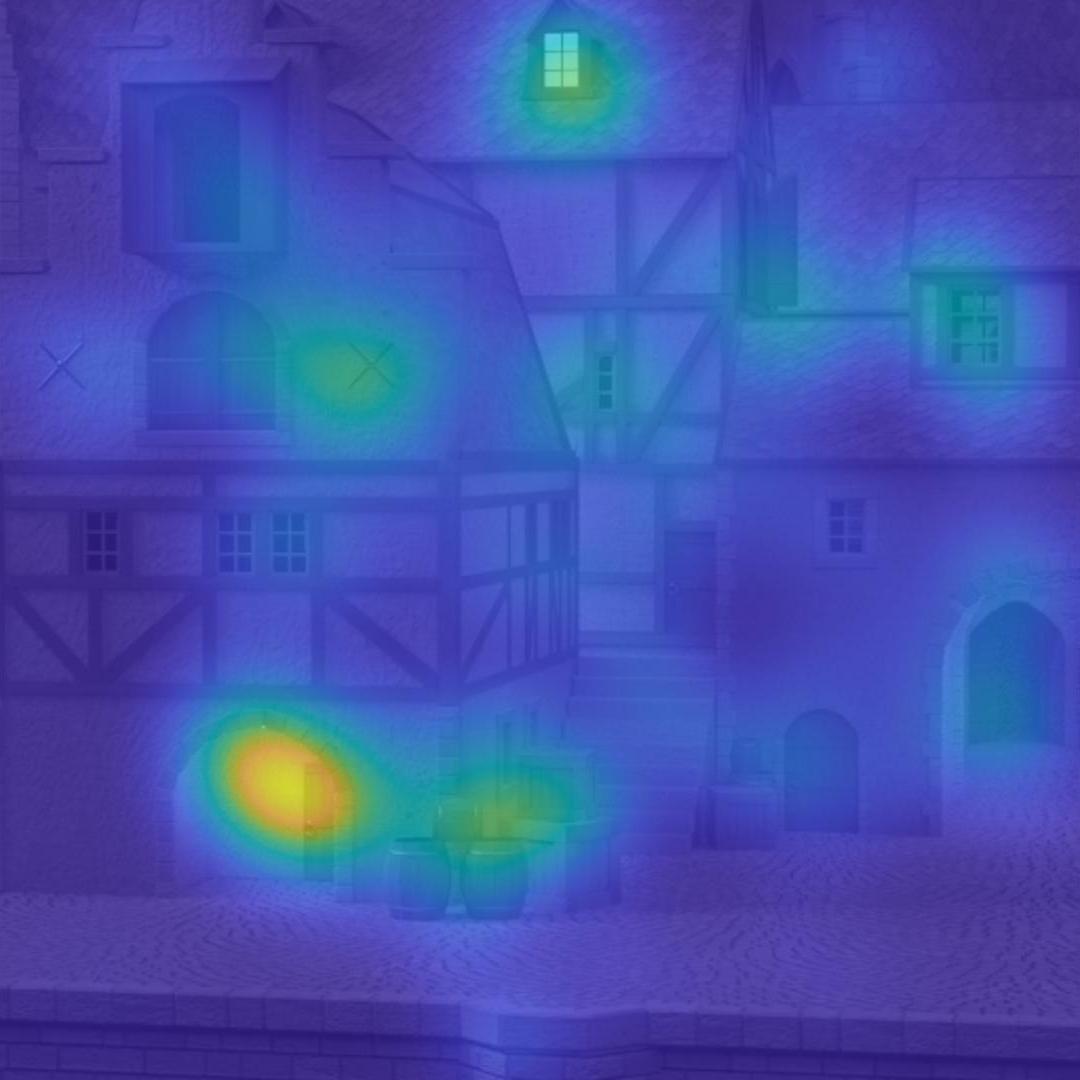
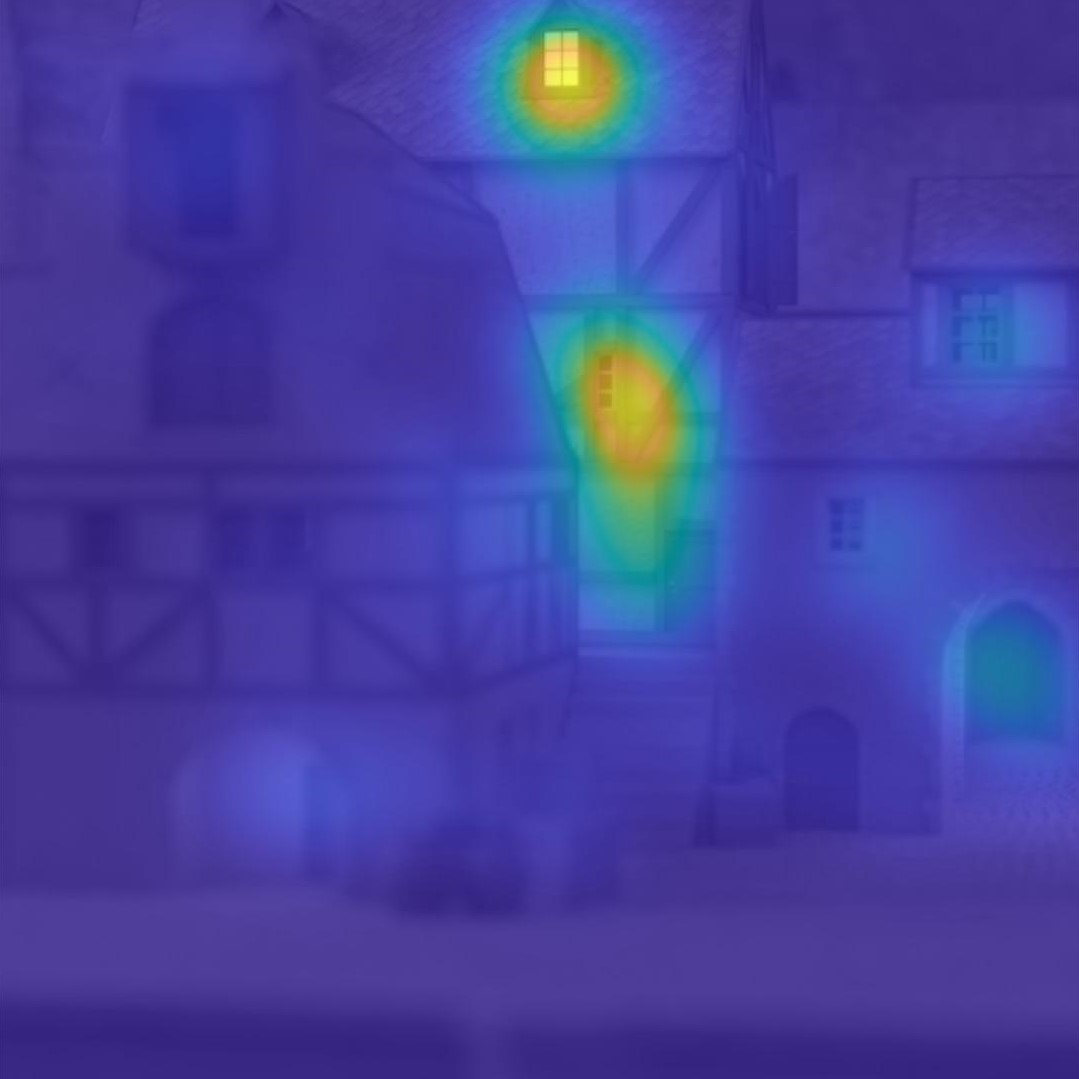
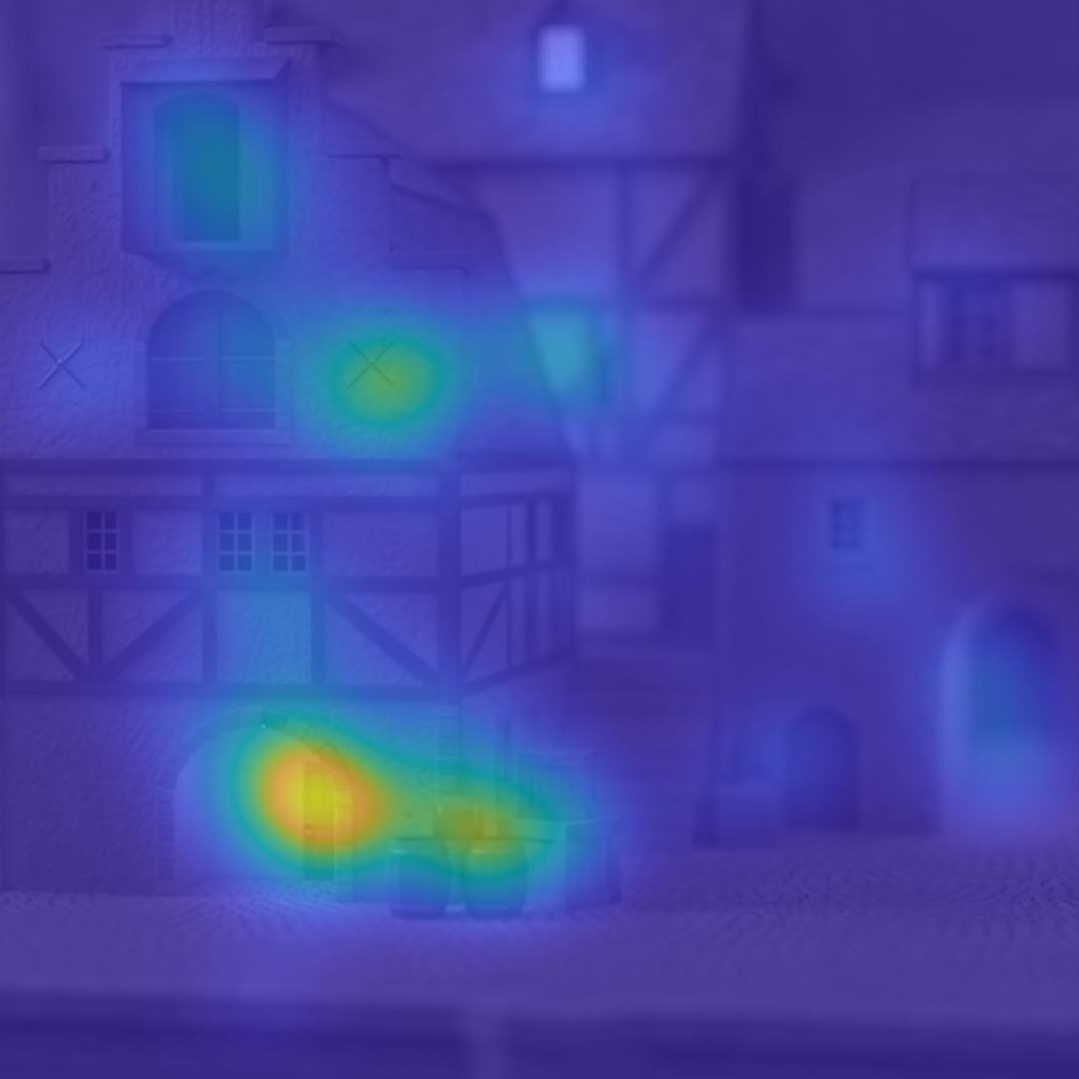
We studied the heatmaps averaged over the entire 10-second video. We found that some had very similar saliency maps for the all-in-focus and focal-sweeps. However, there were also many saliency maps where focal-sweeps revealed other salient regions. For example, in the Medieval light field in Fig. 2, the centre building is salient in the back-to-front rendering whereas it is not in the all-in-focus rendering. This shows that a static rendering of a scene may not reveal all the salient regions present in the 3-dimensional light field data.
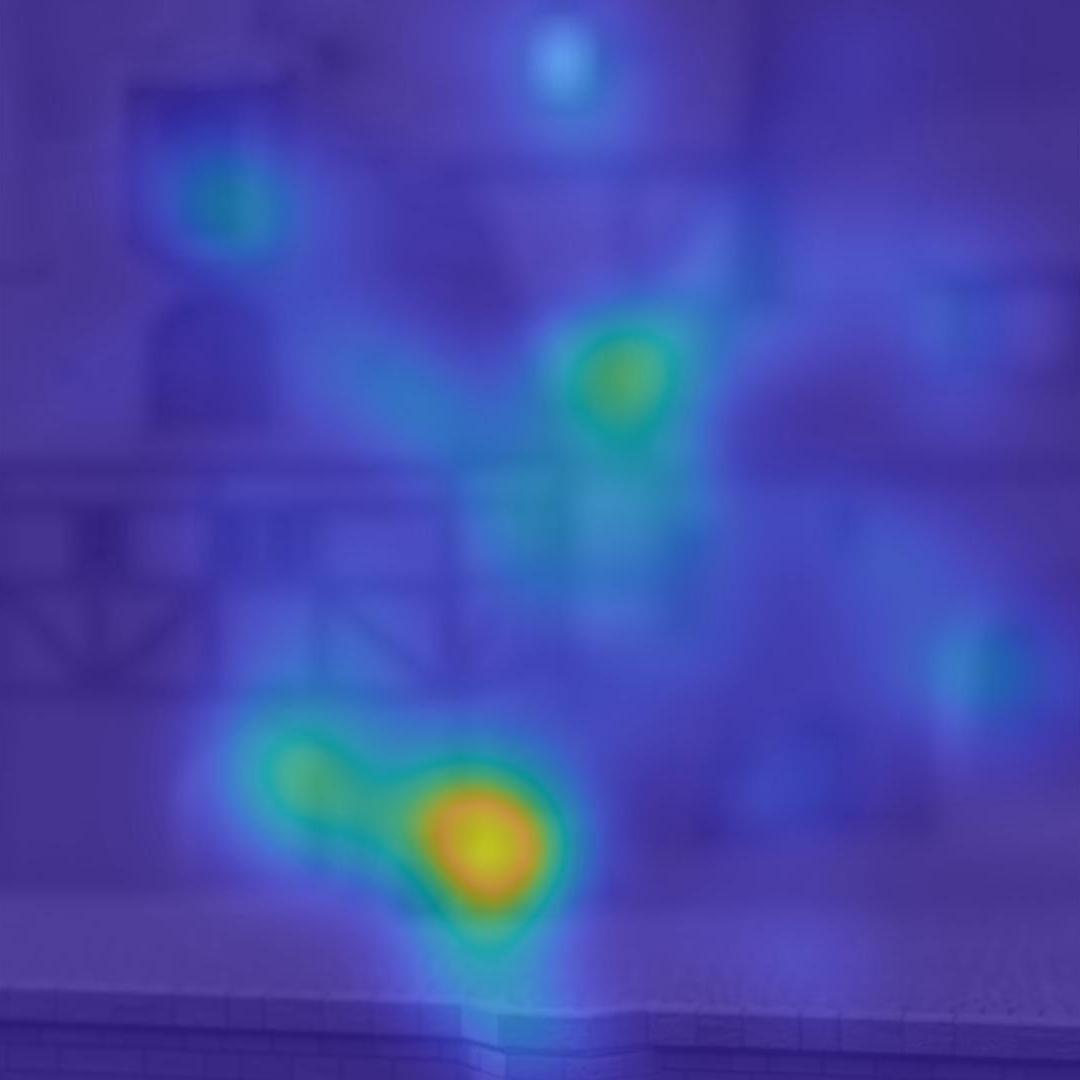
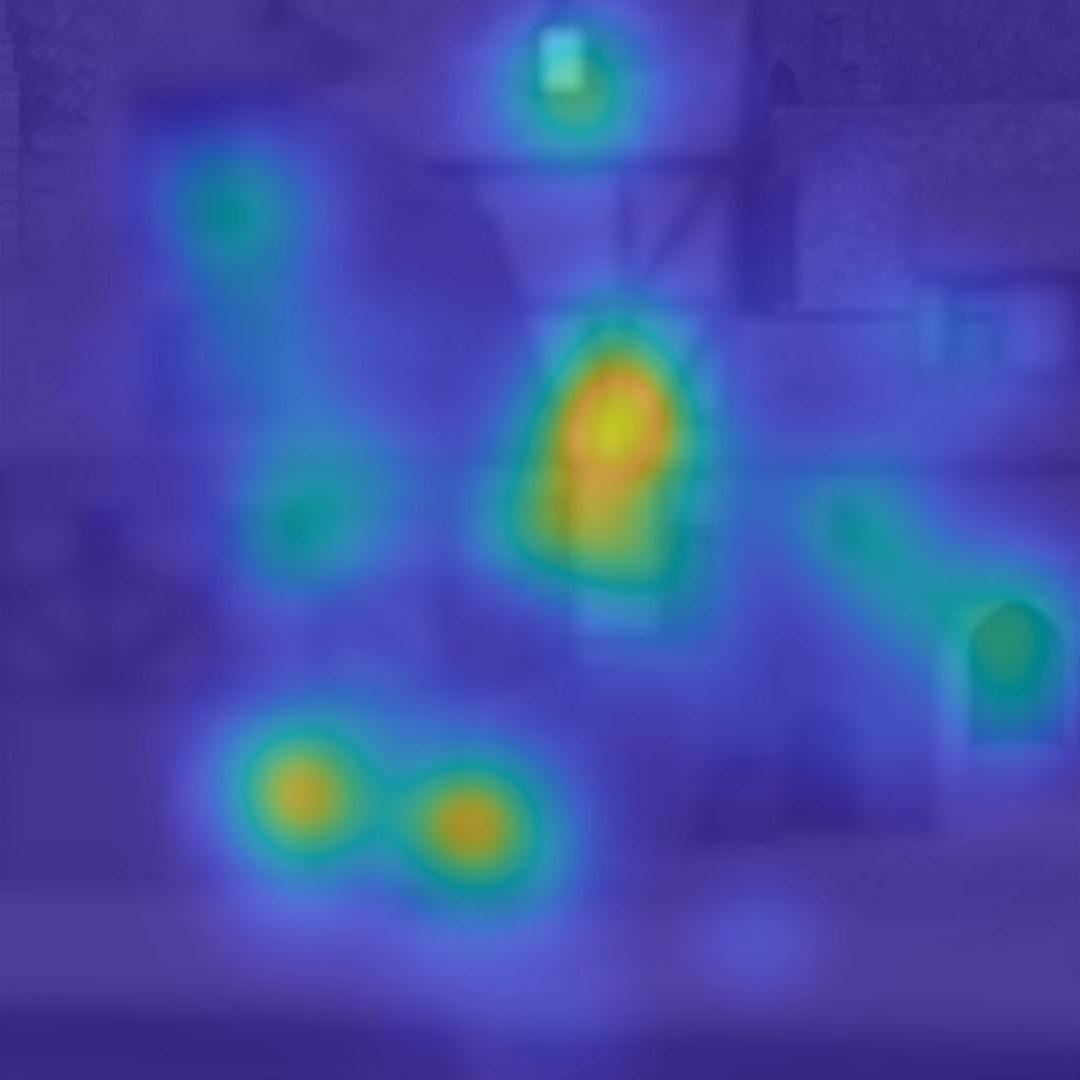
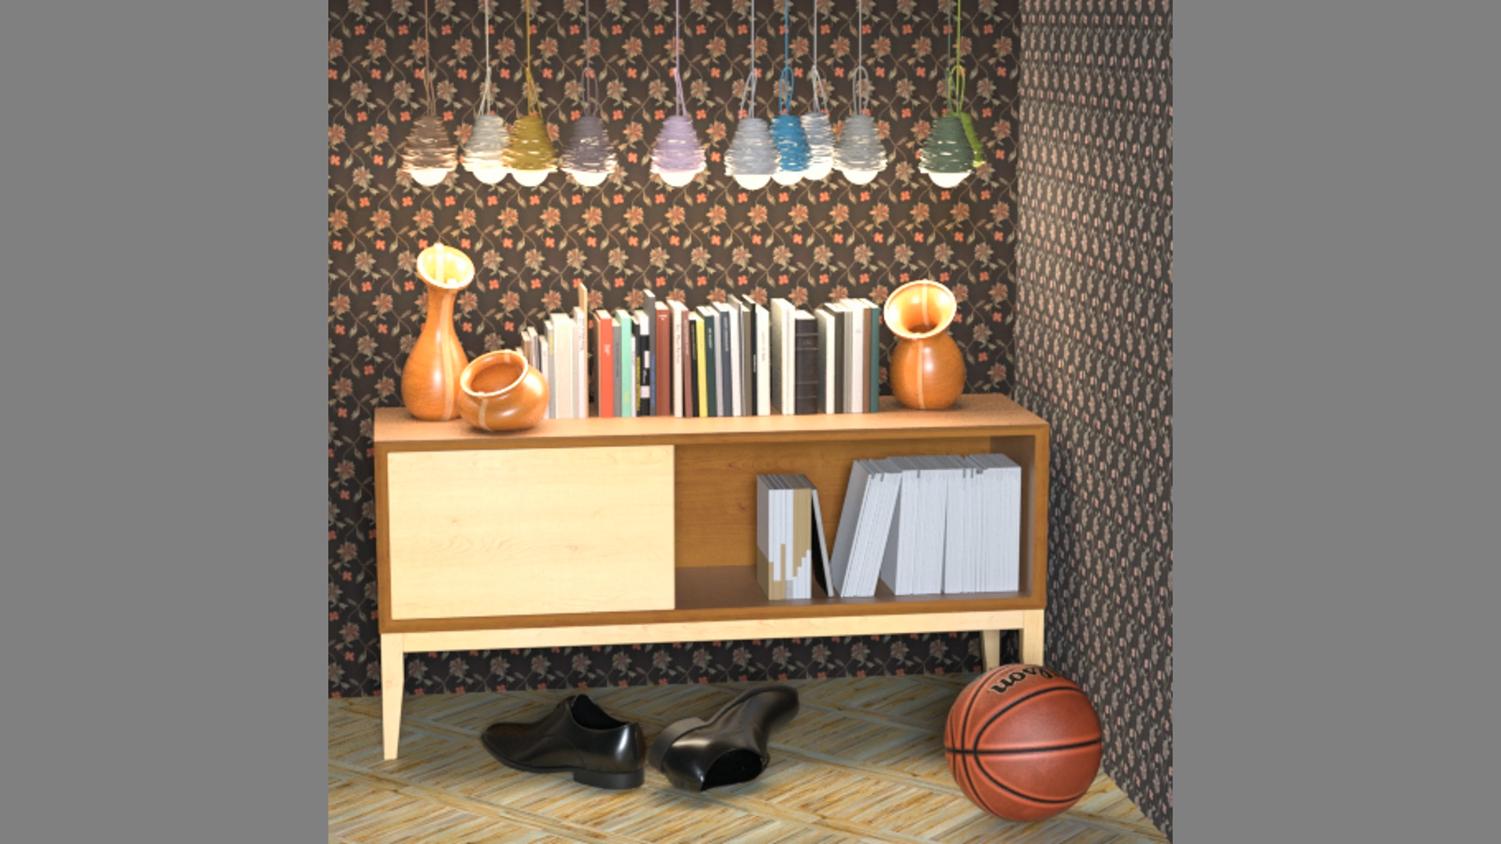
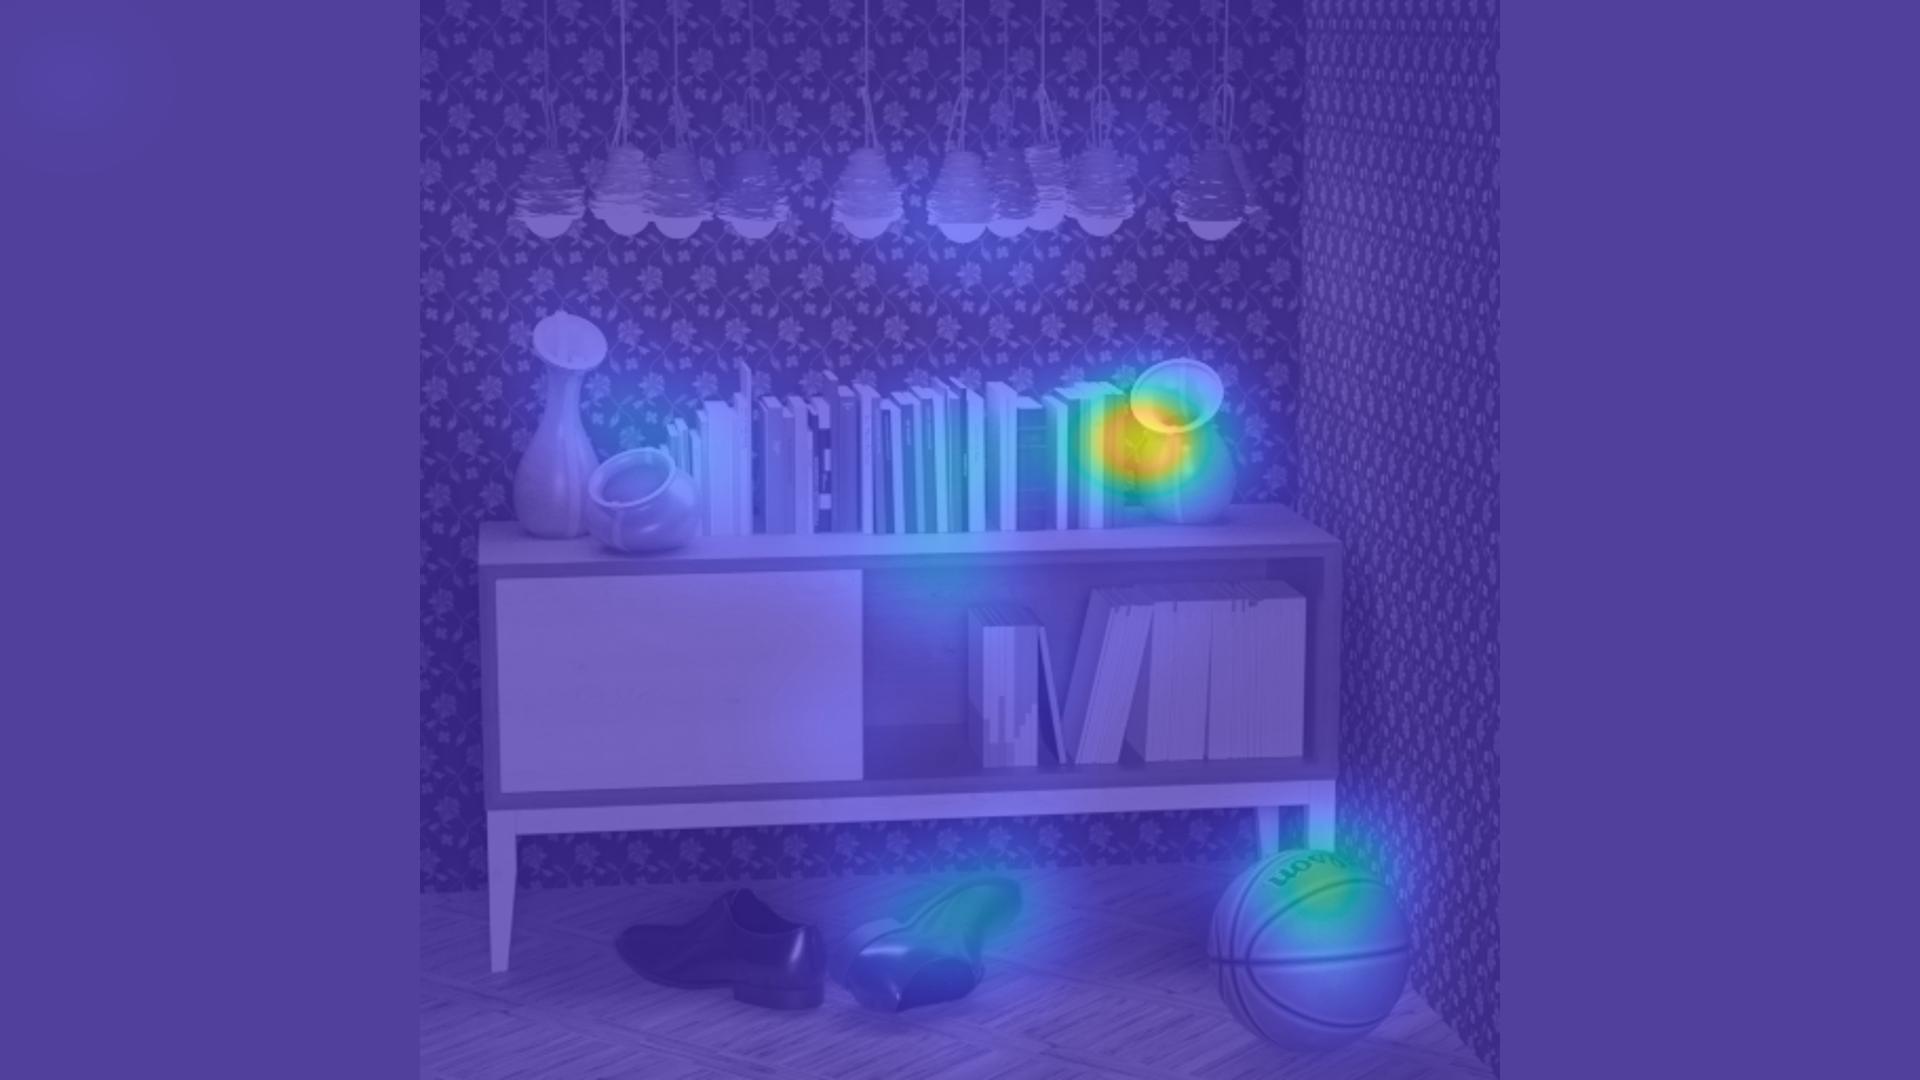
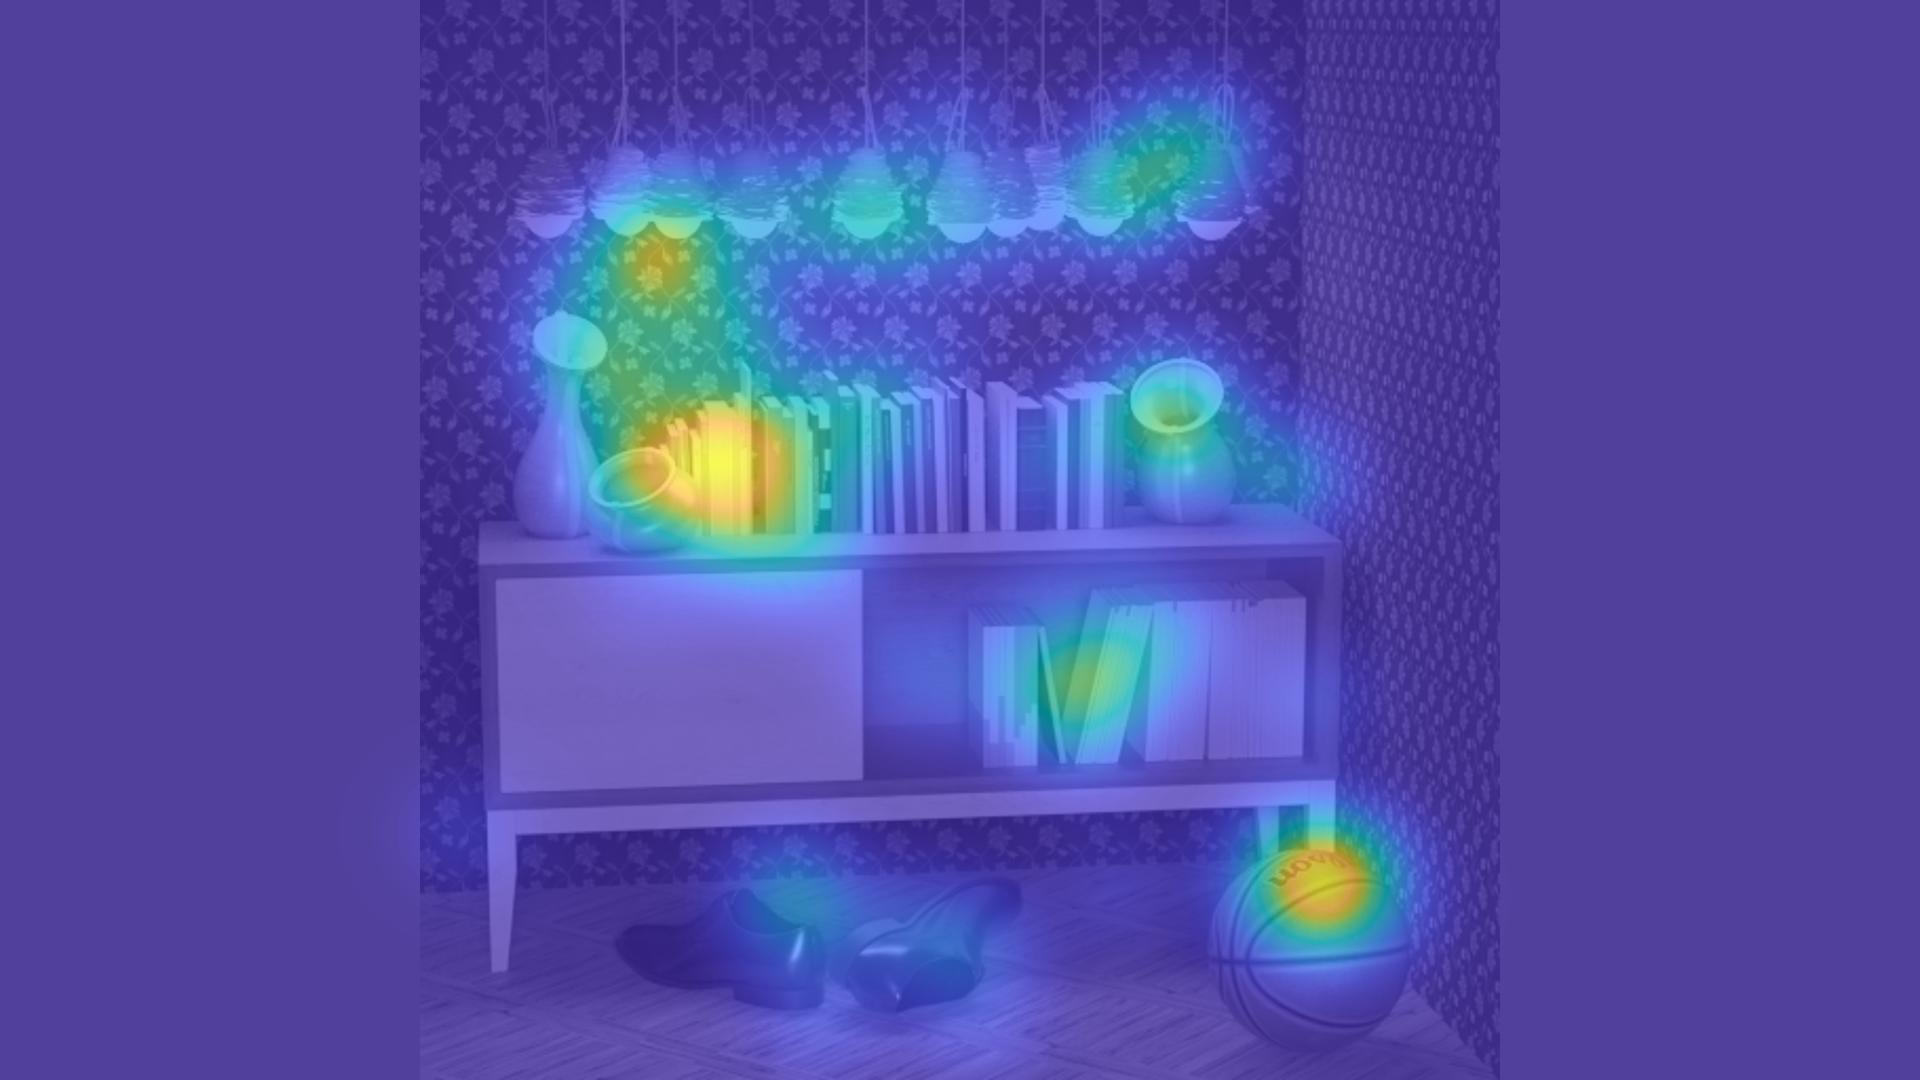
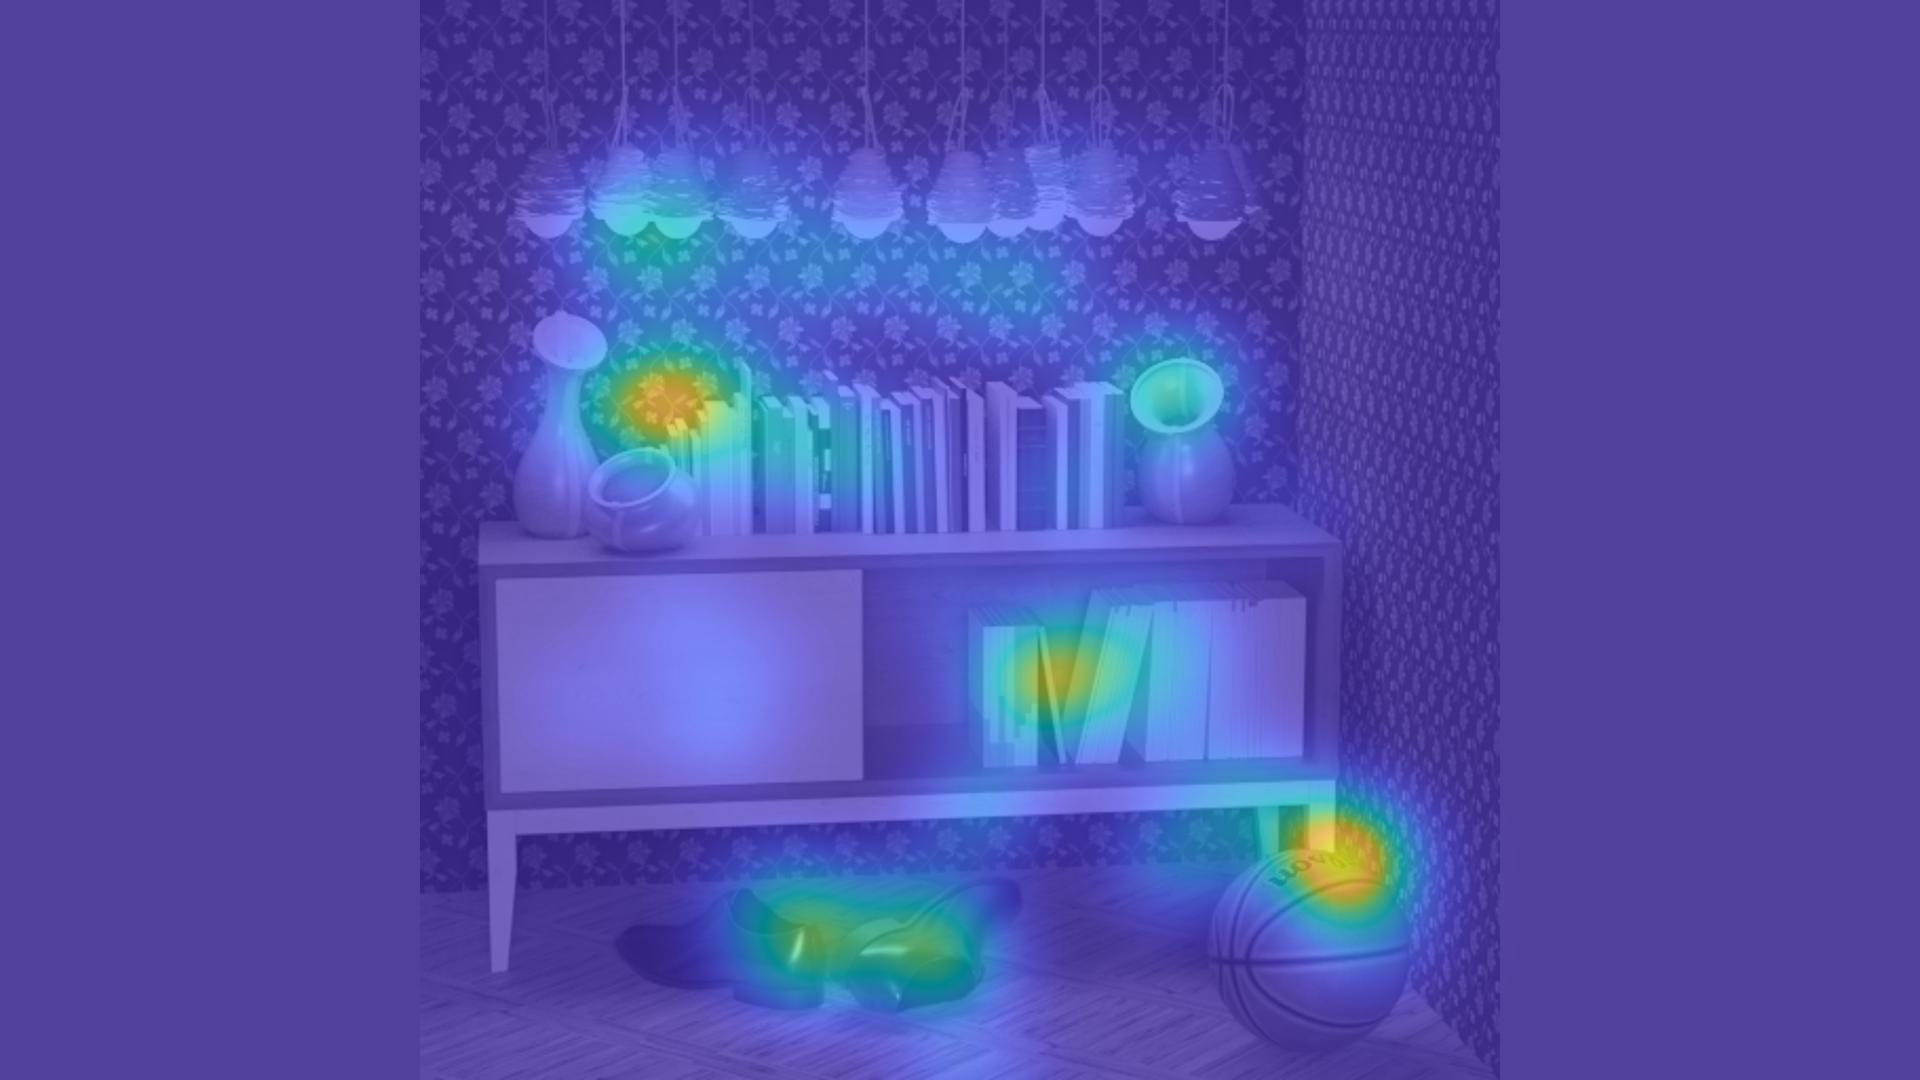
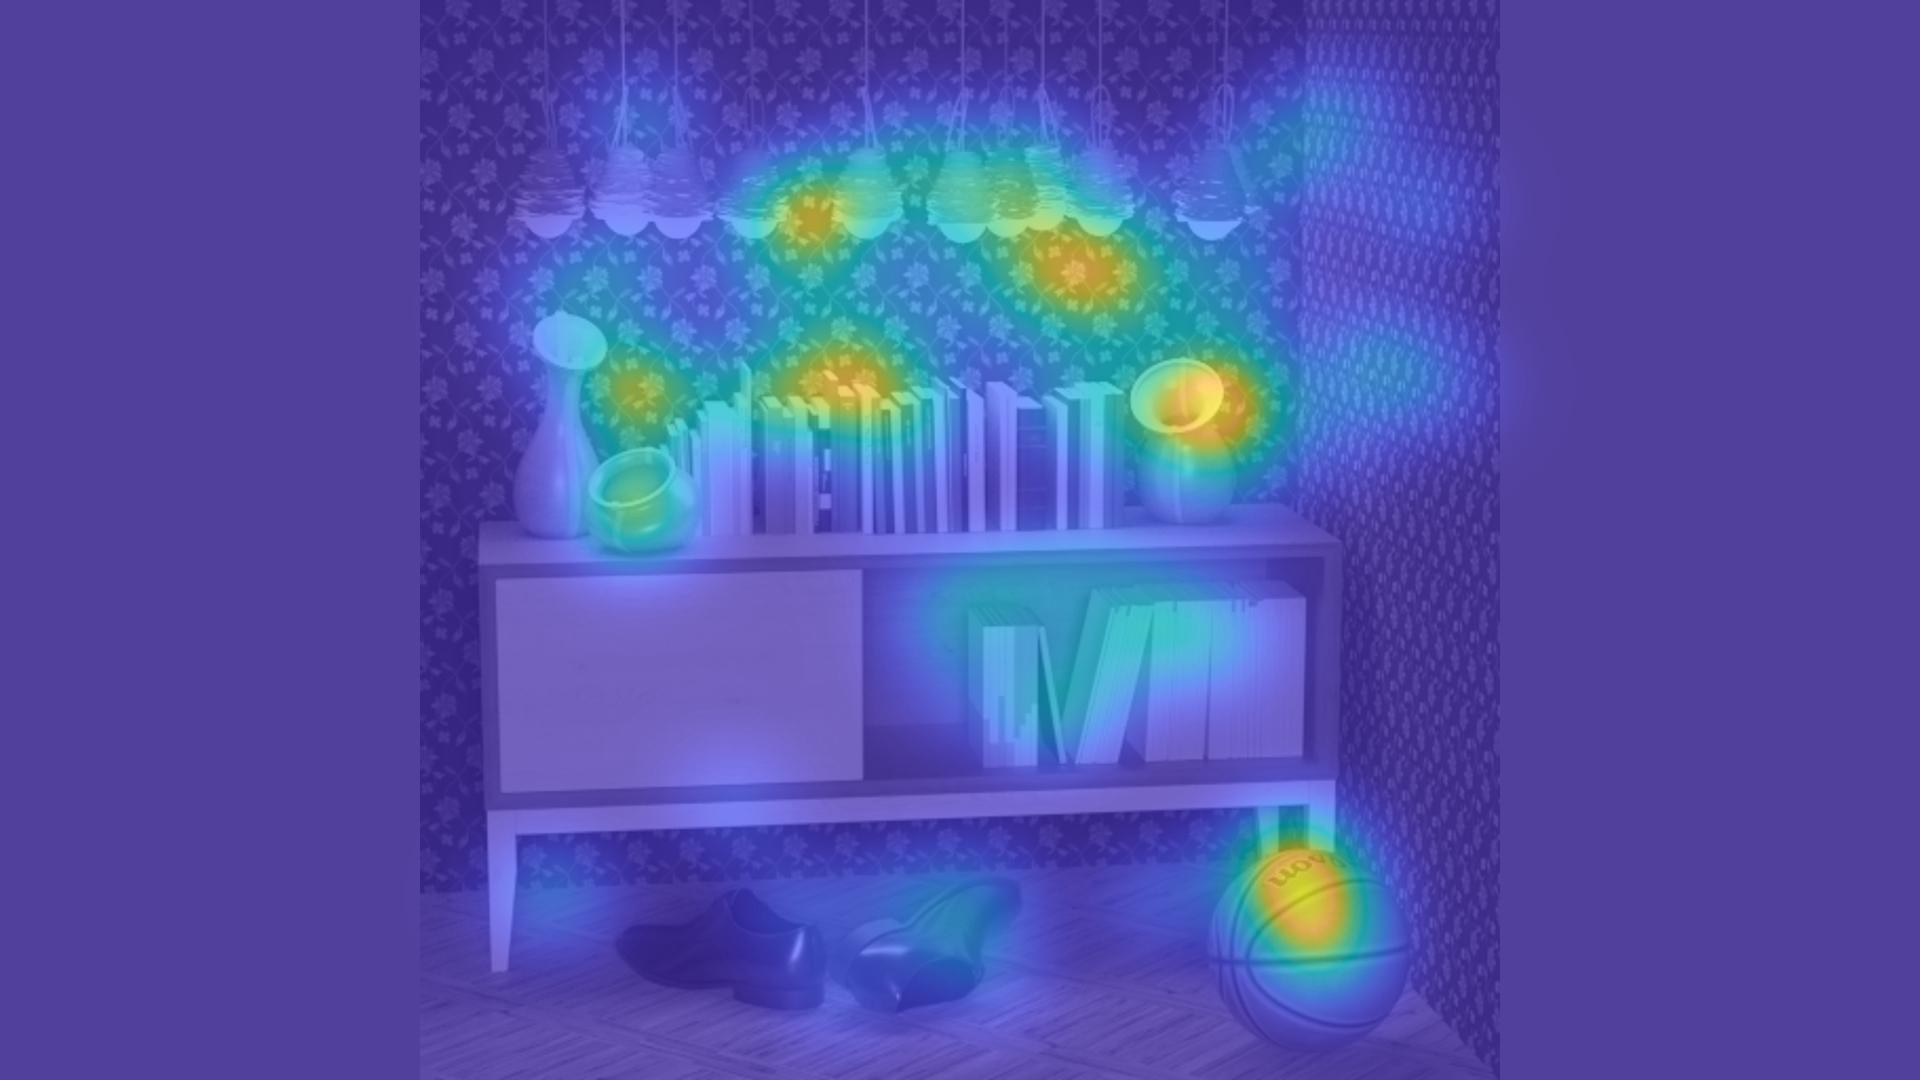
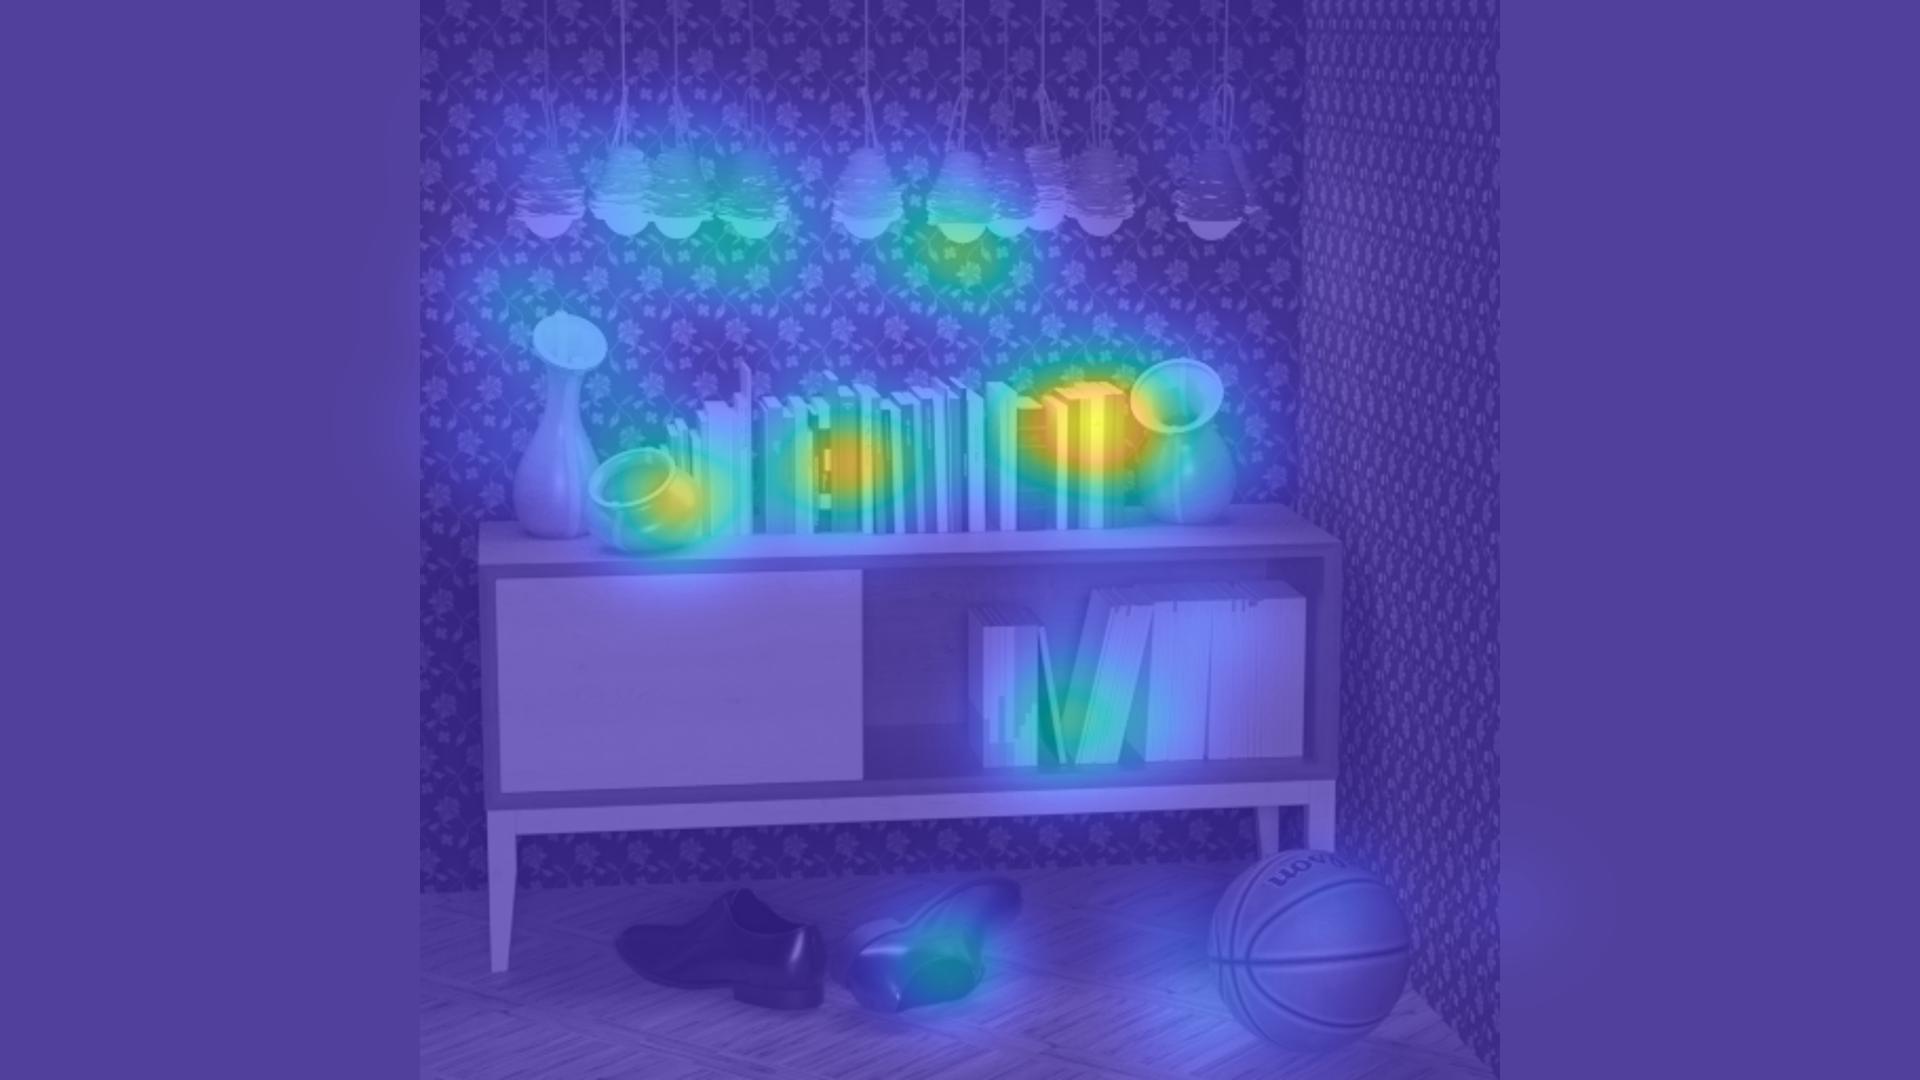
Moreover, to understand what causes participants to fixate on regions of focus and whether or not this is always the case, we compared the segments over time of static data (all-in-focus and region-in-focus renderings) to those of focally-varying data (focal-sweeps) for each light field. We found that gaze is held on objects that are in focus when they are also salient in the all-in-focus rendering. For example, the basketball and centre shoe in the Sideboard light field shown in Fig. 3 (a) and (b).
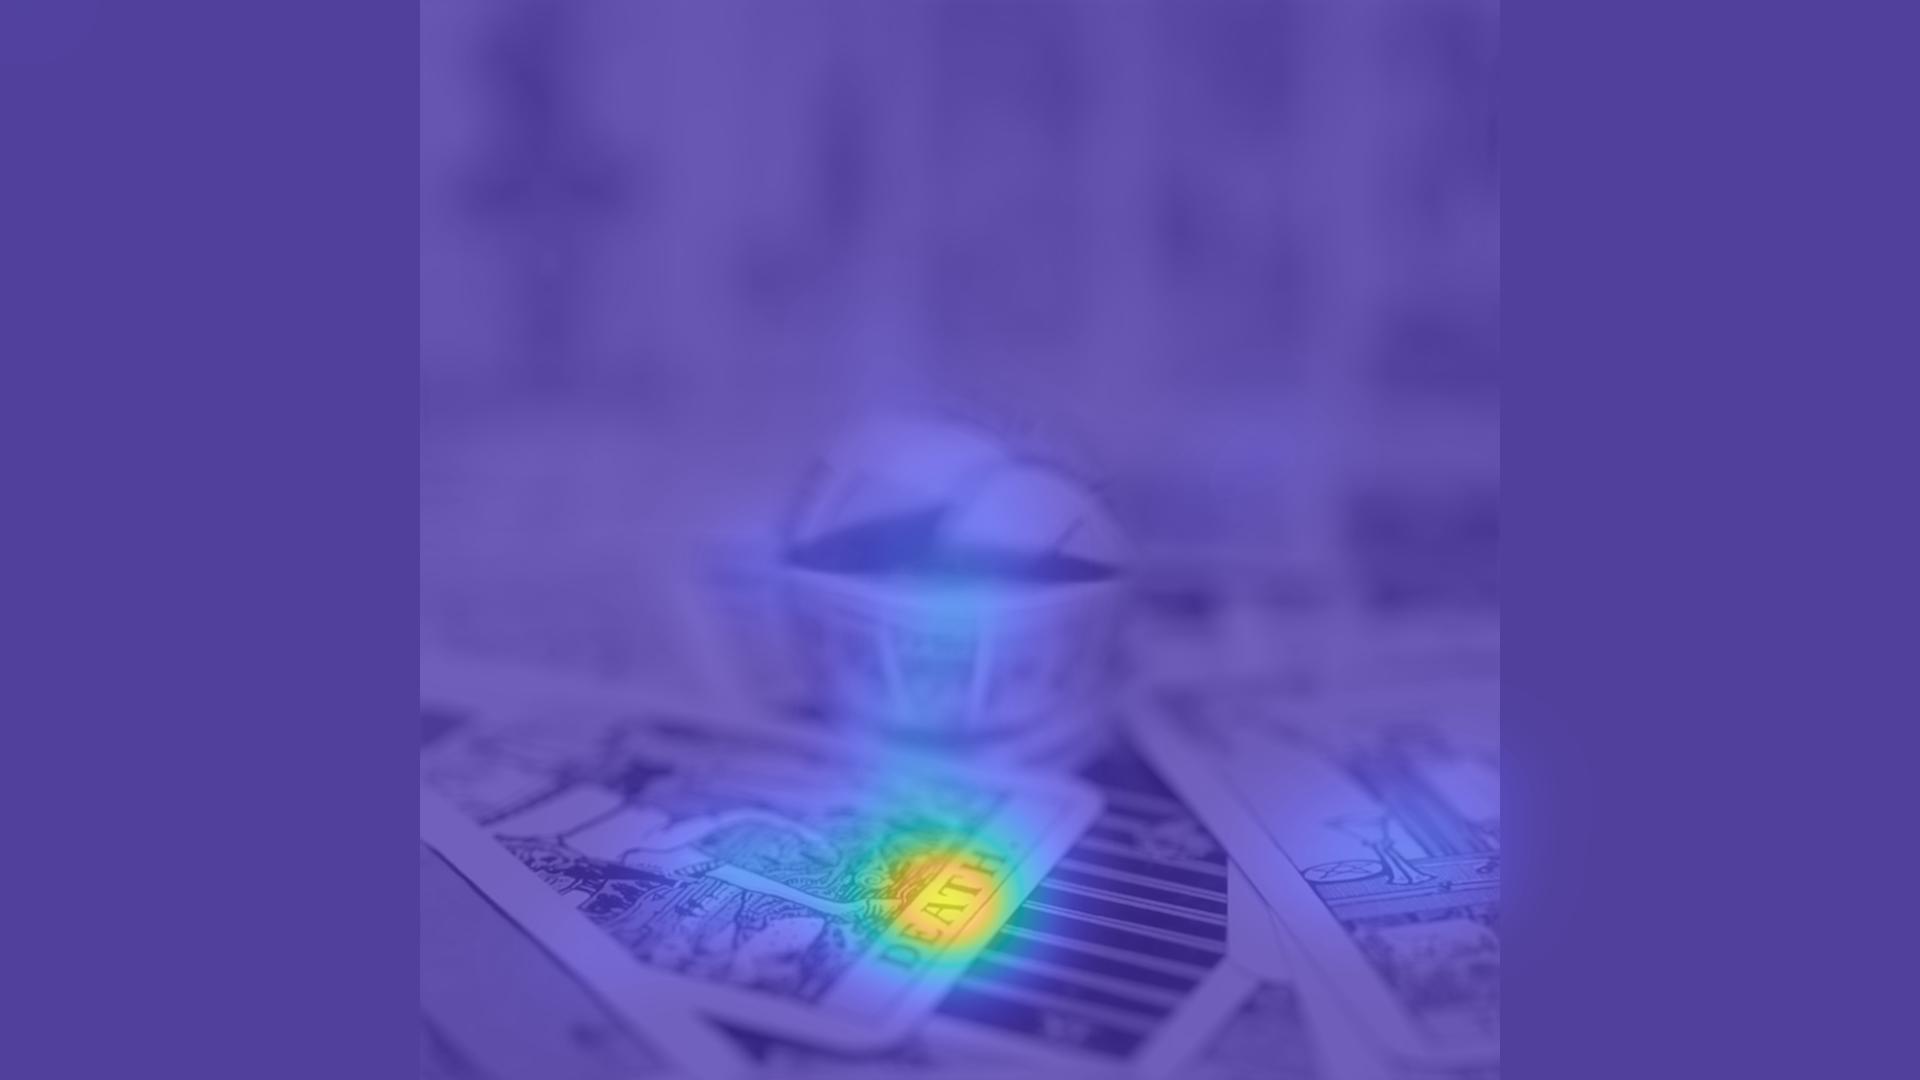
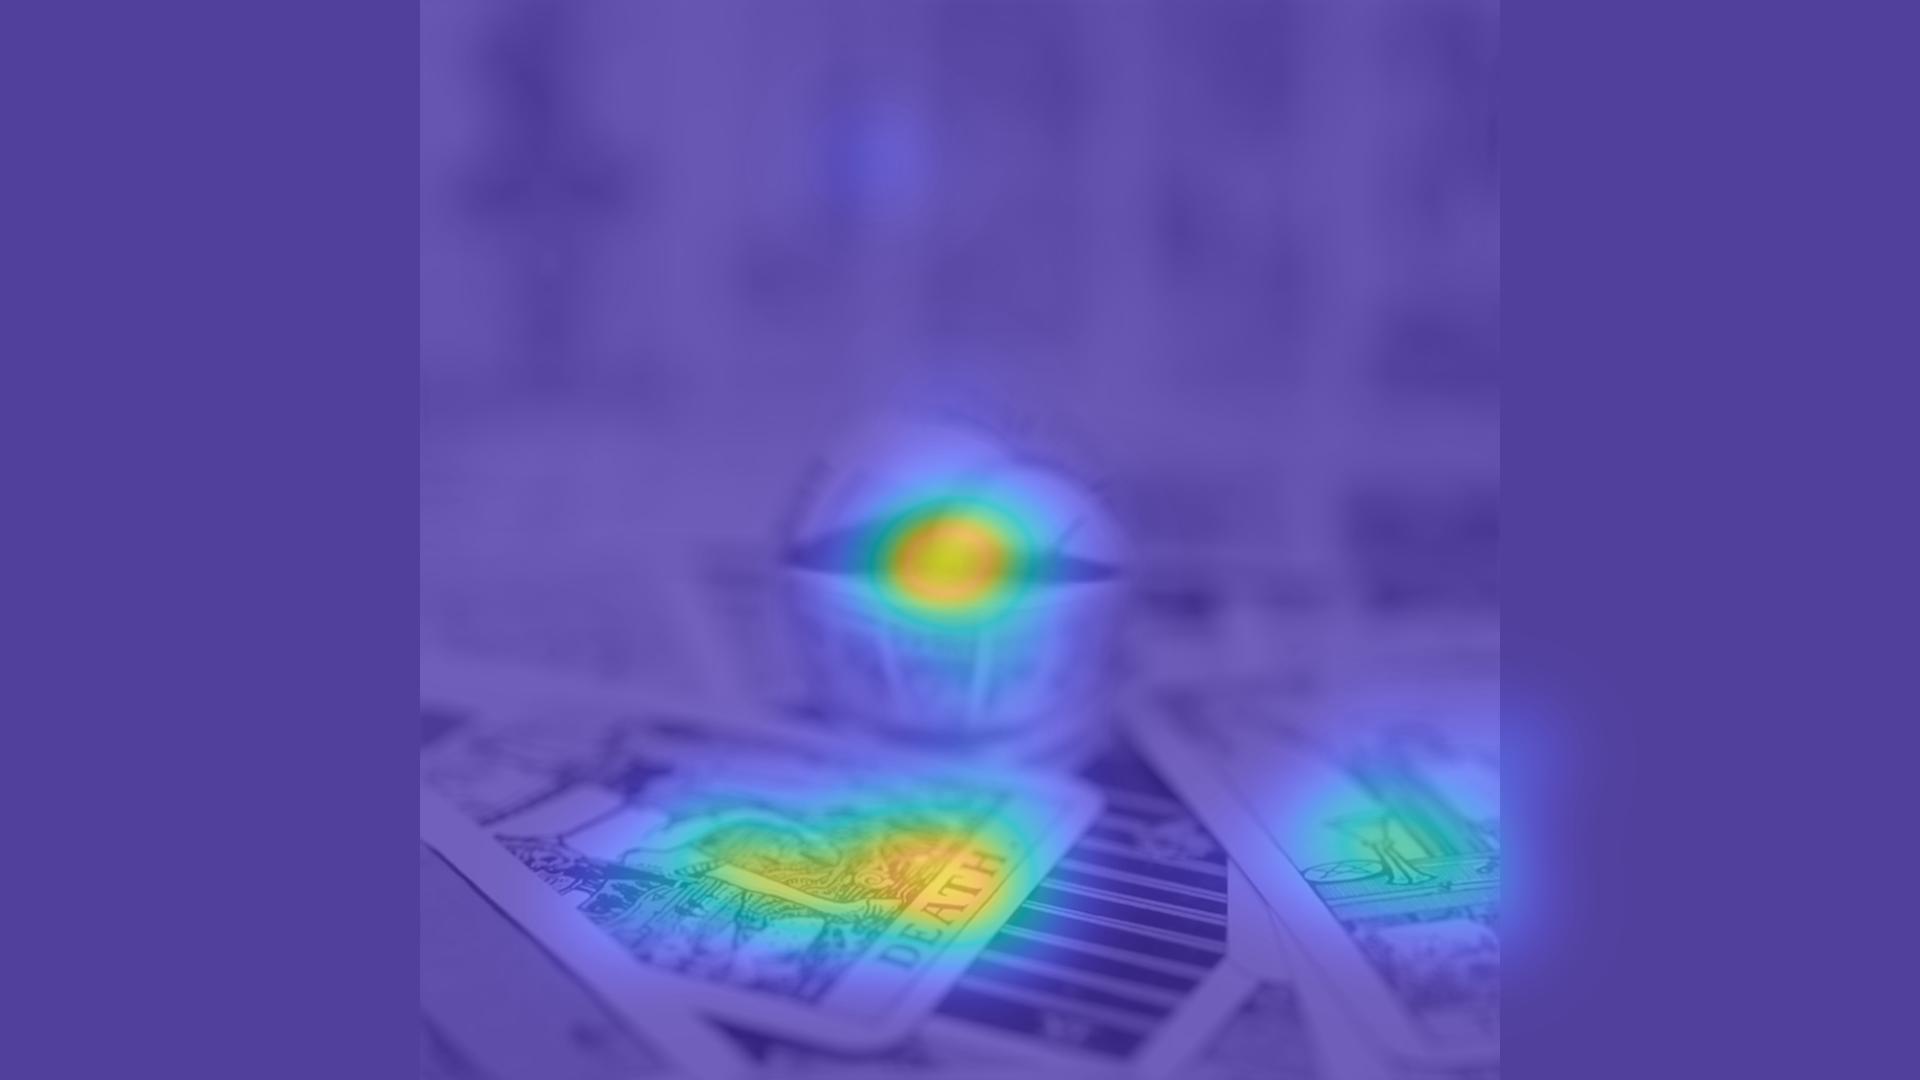
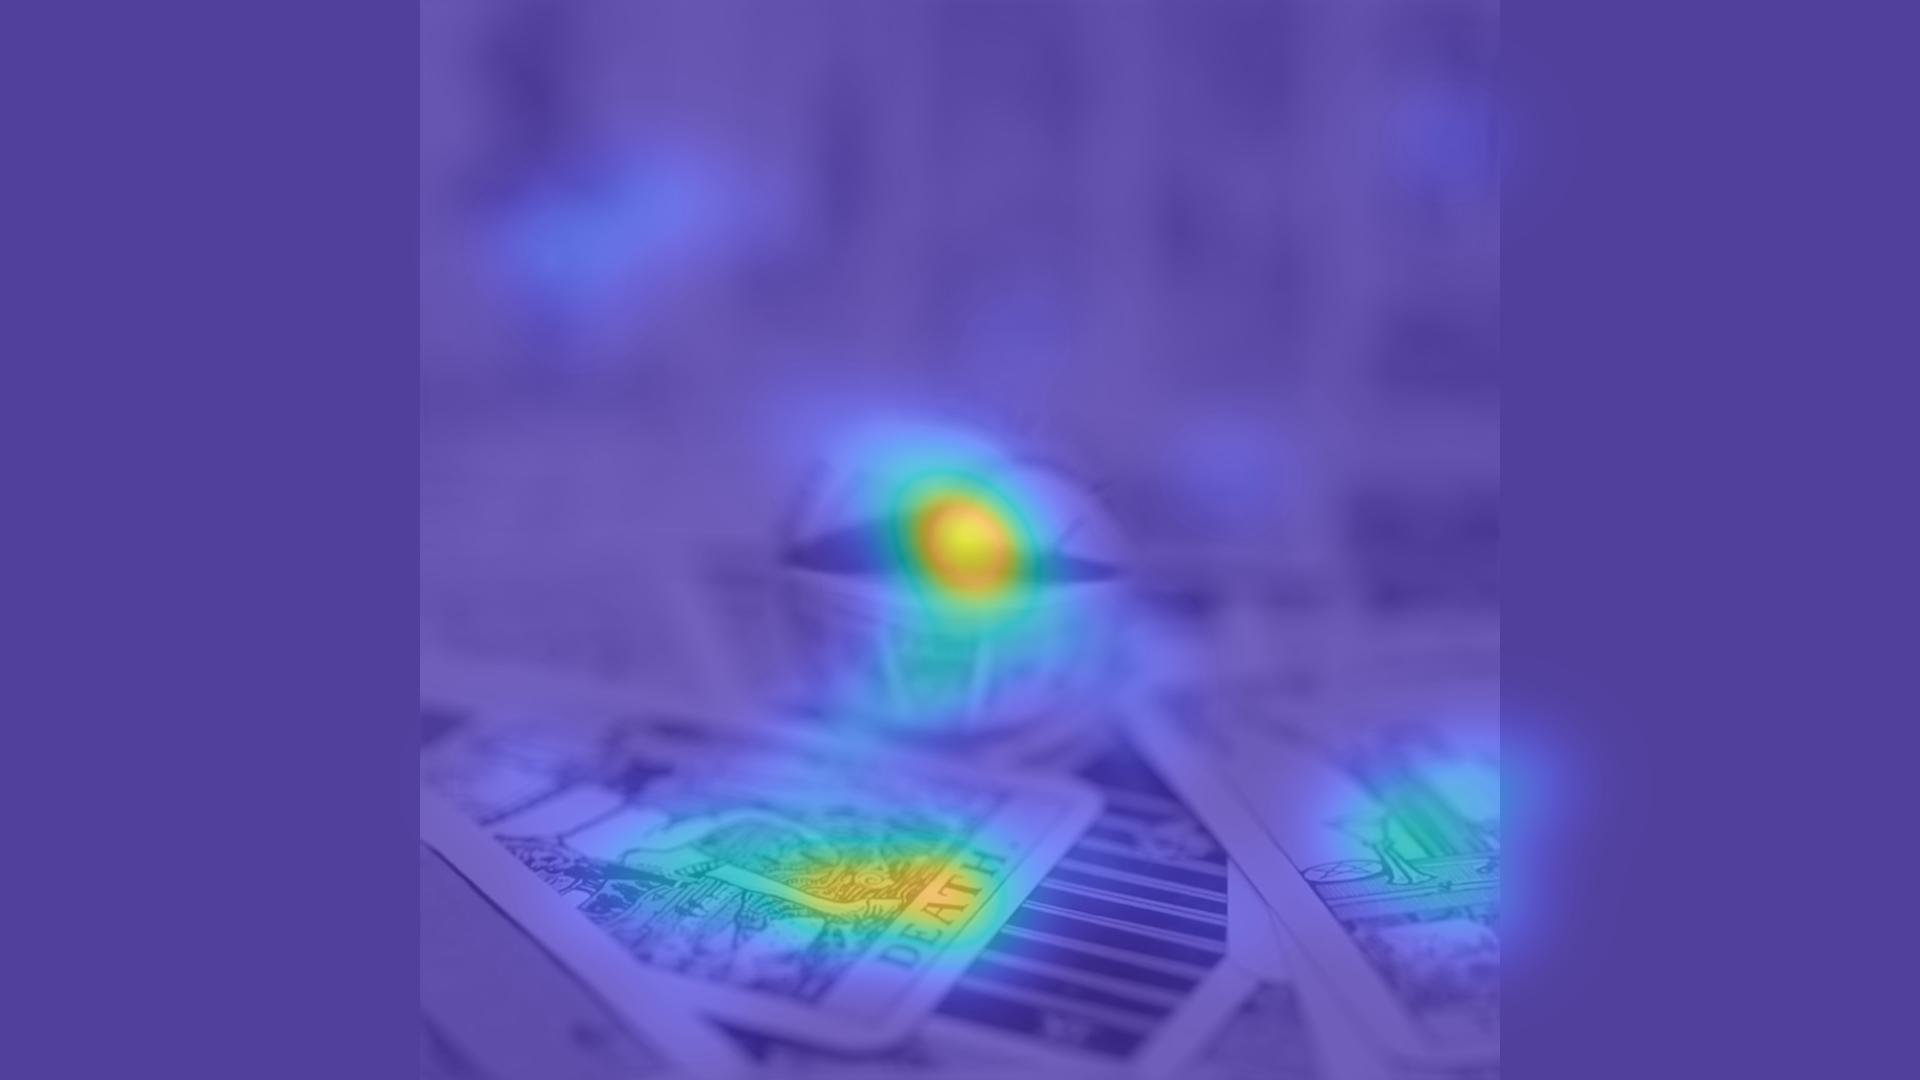
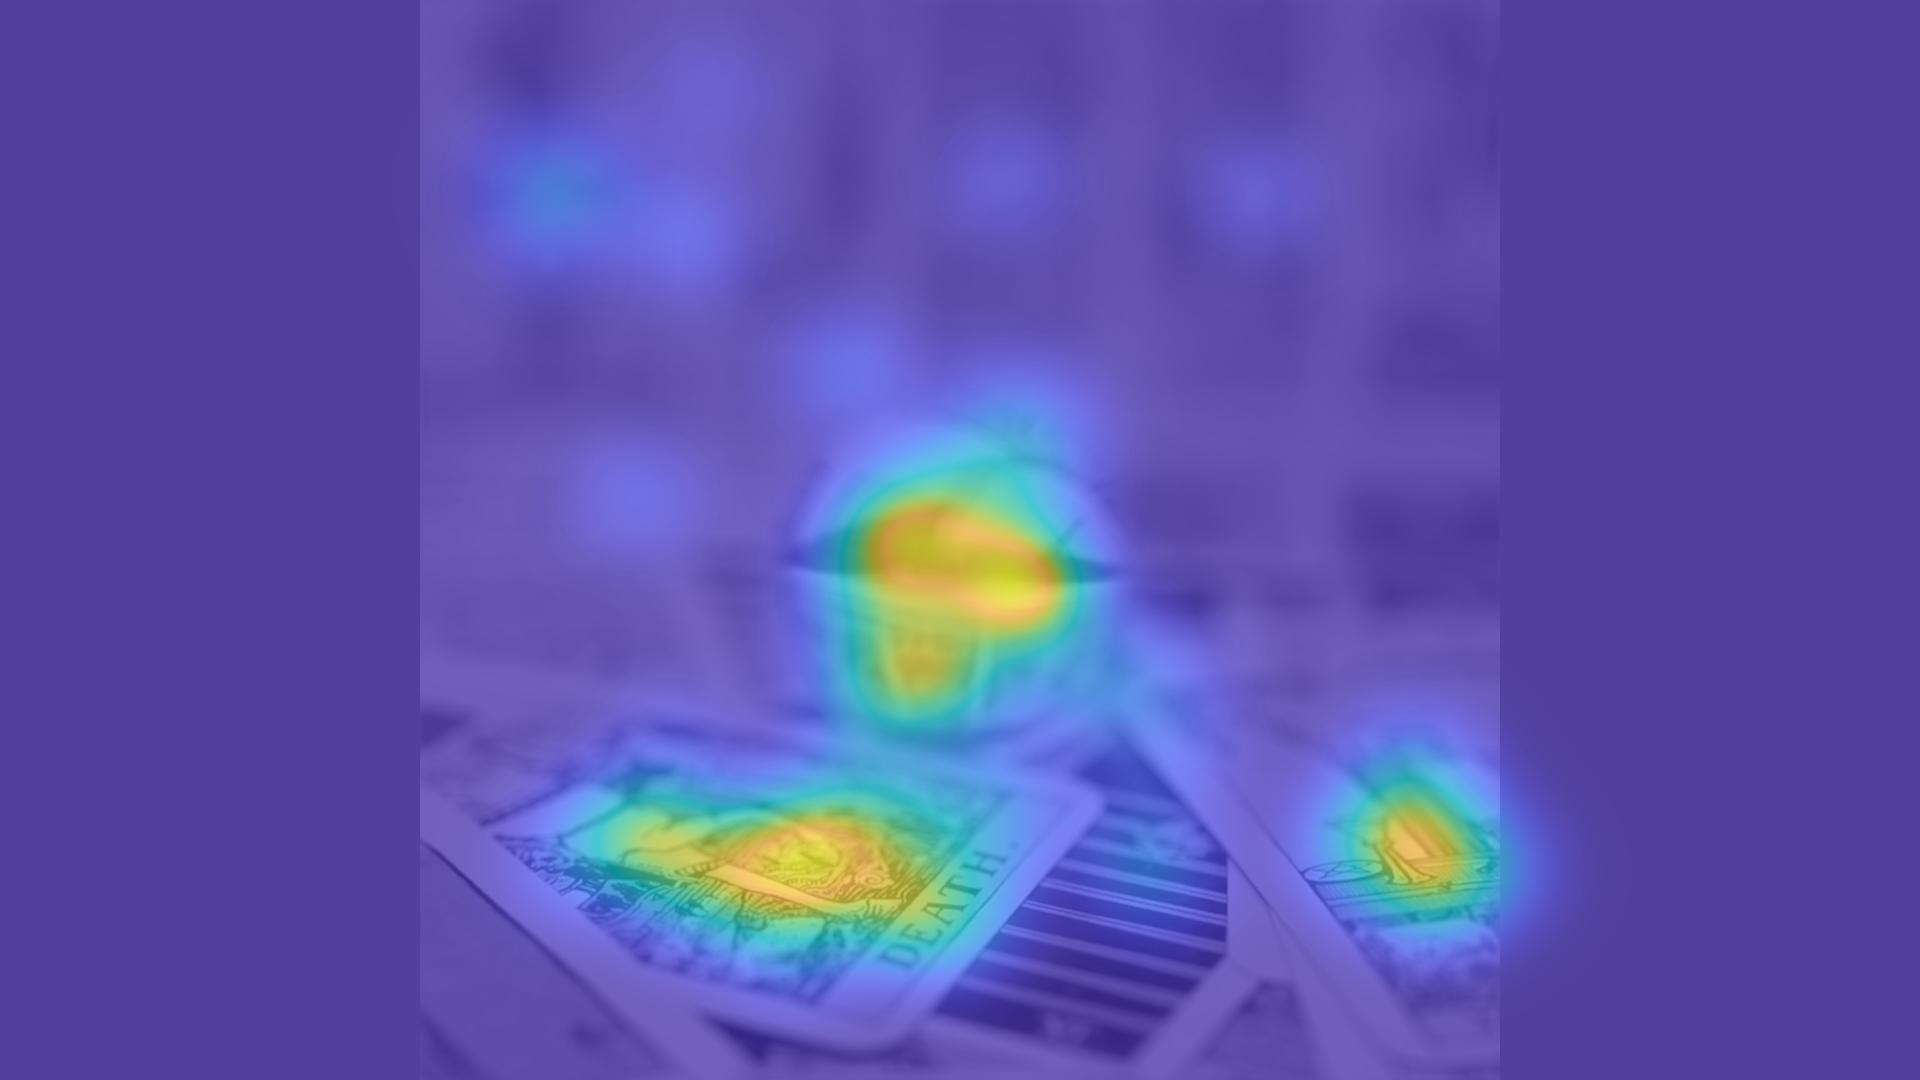
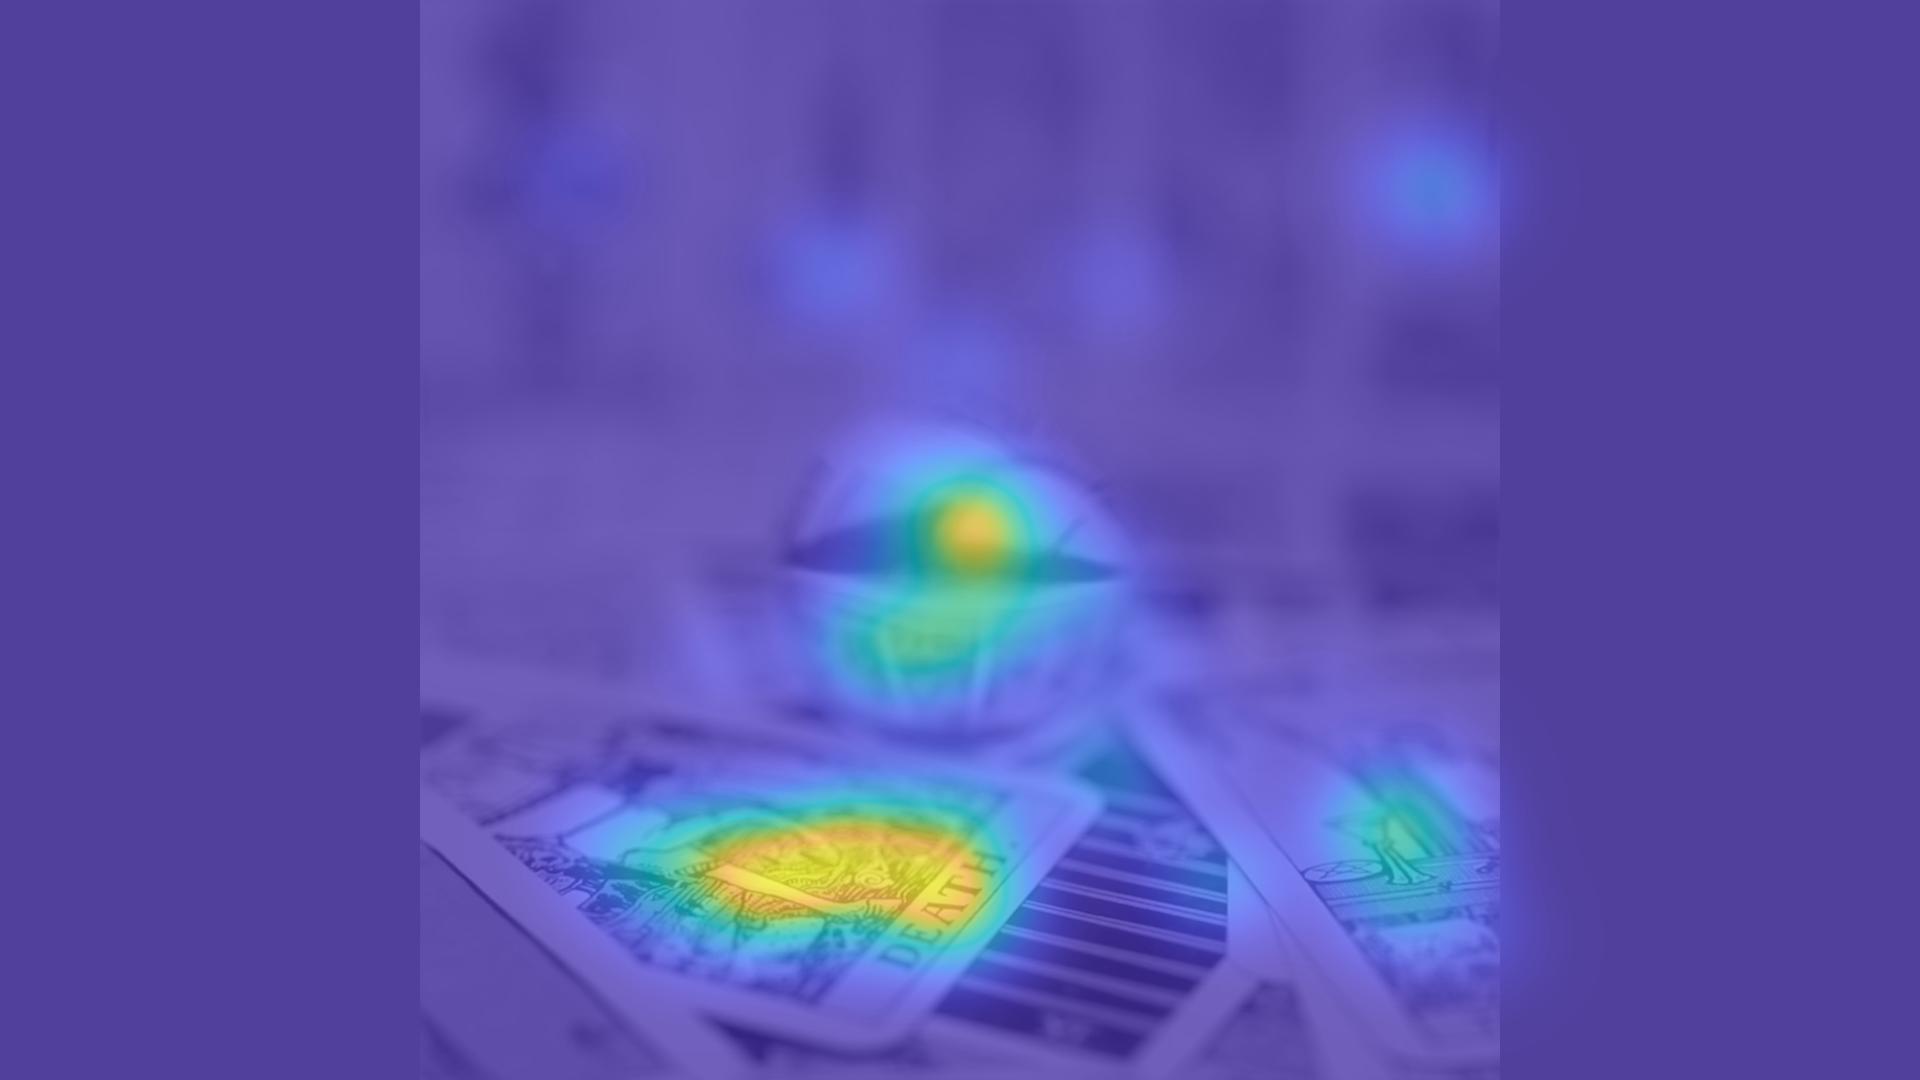
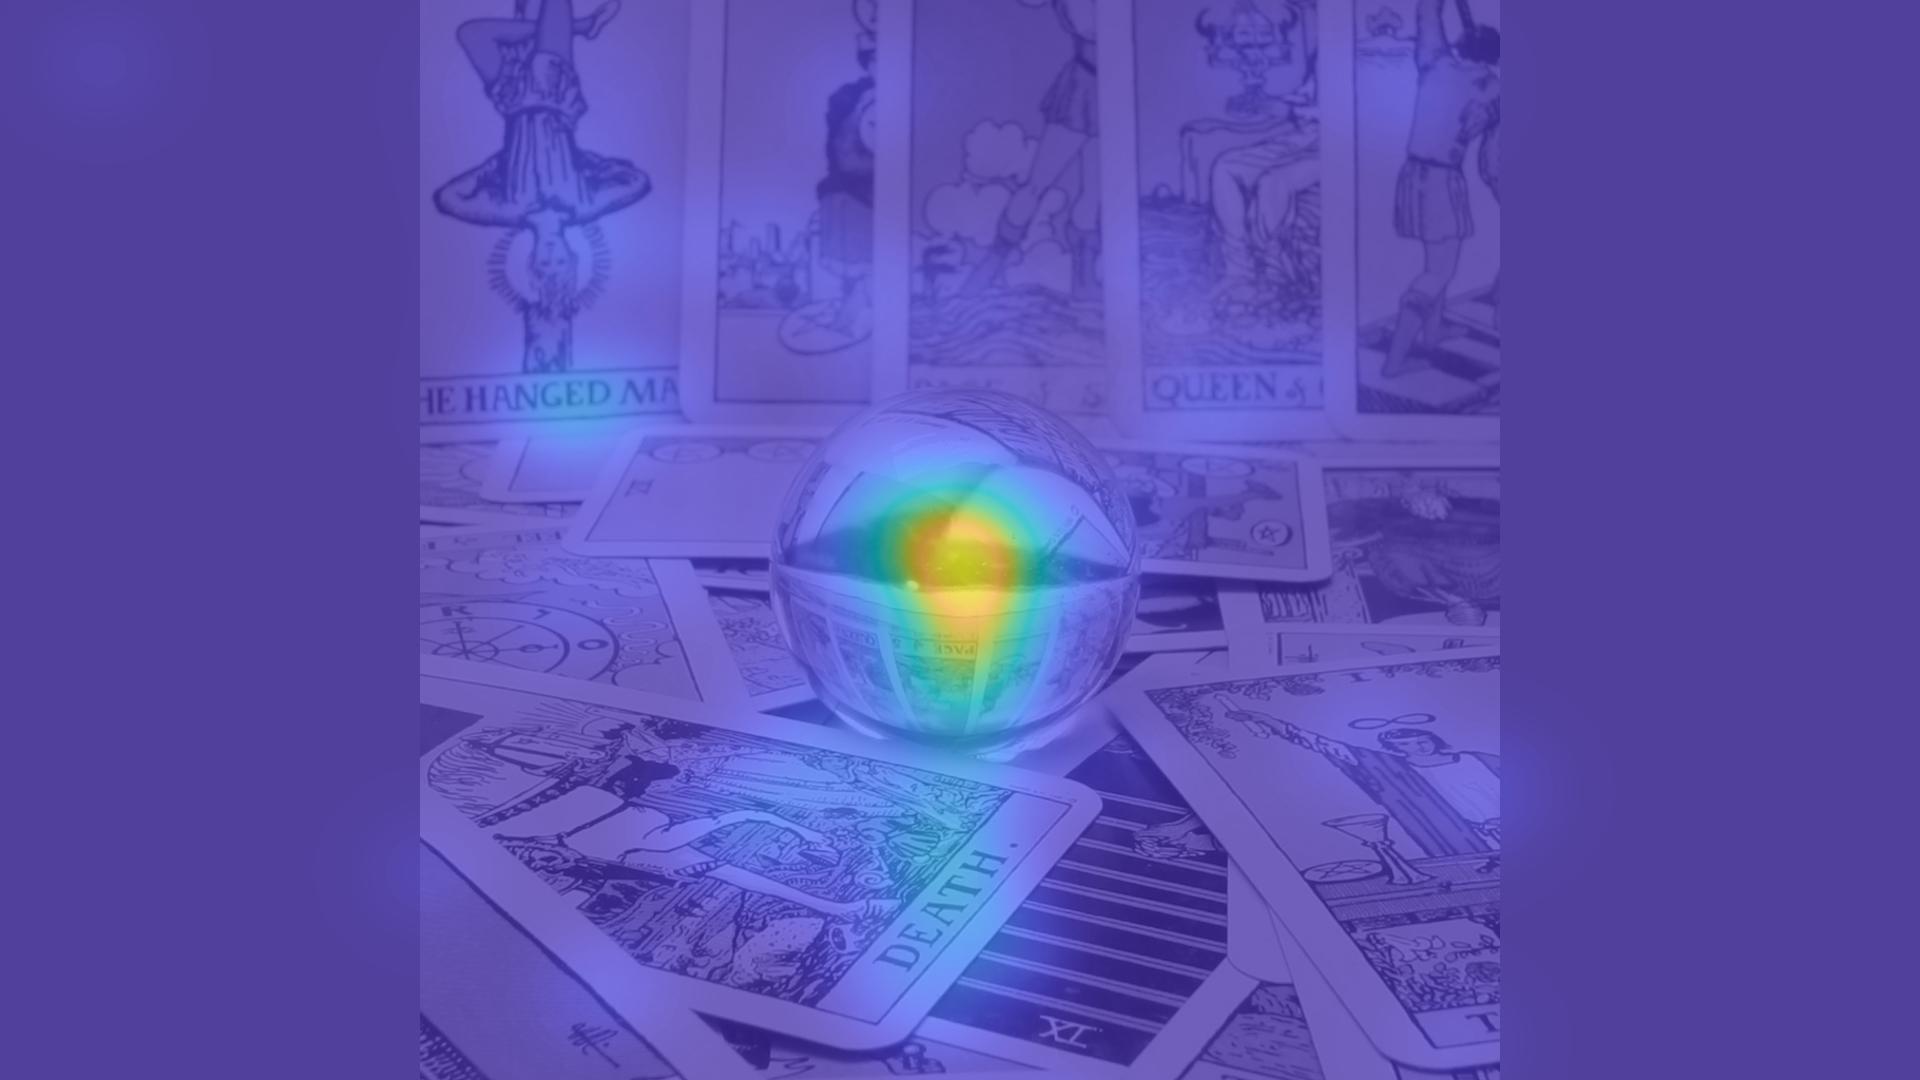
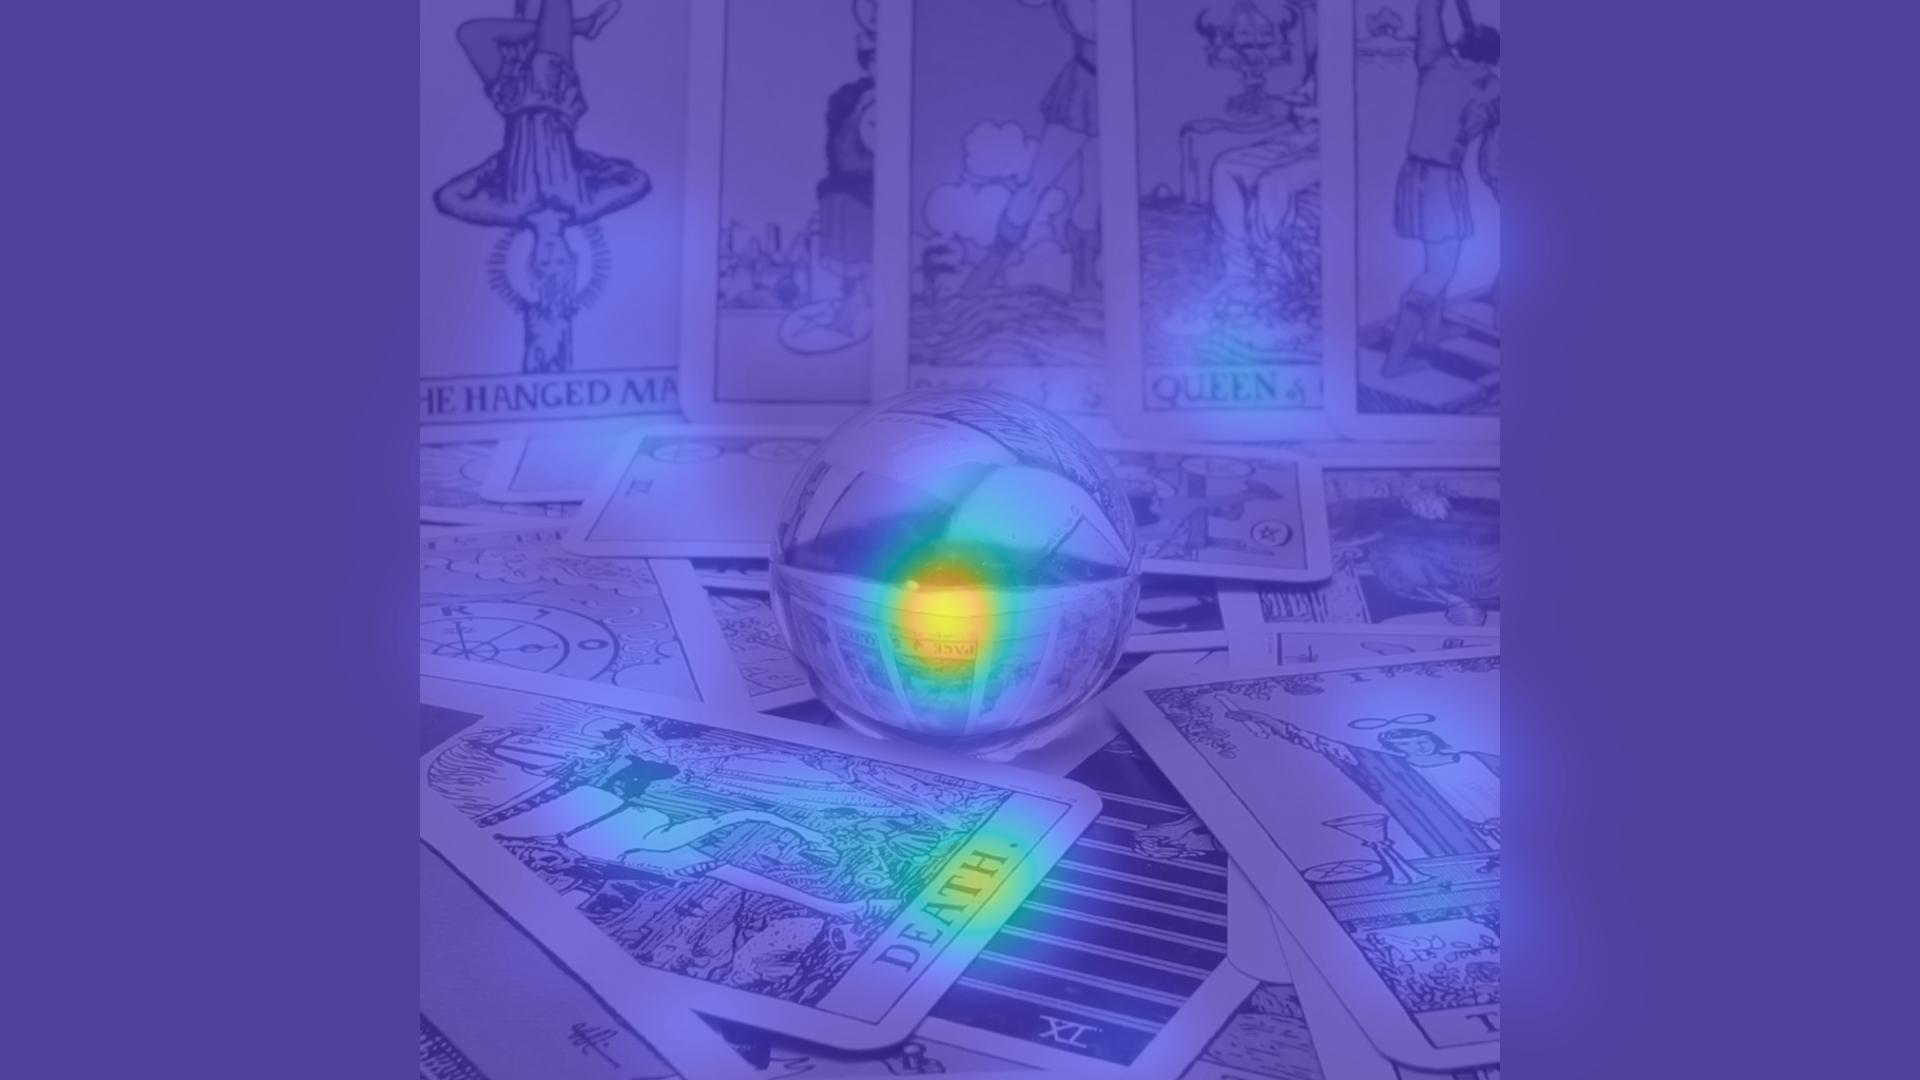
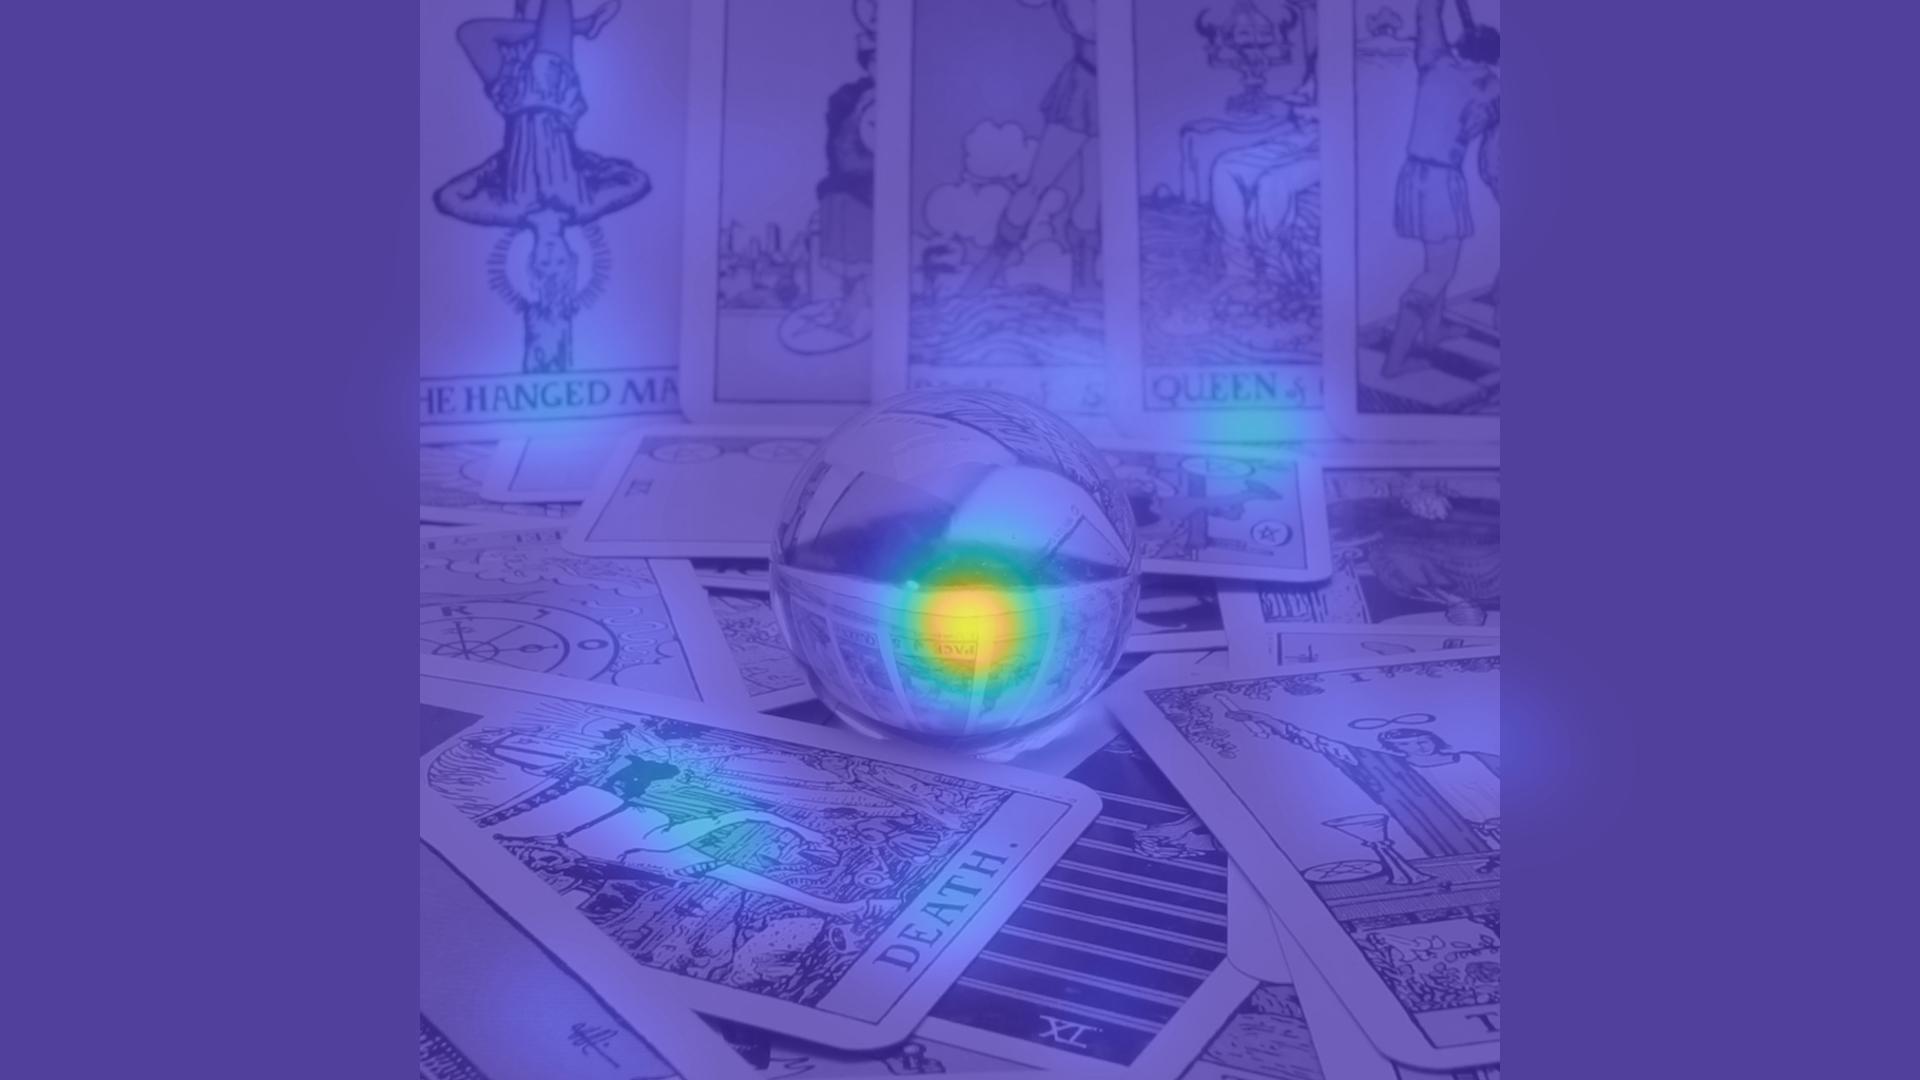
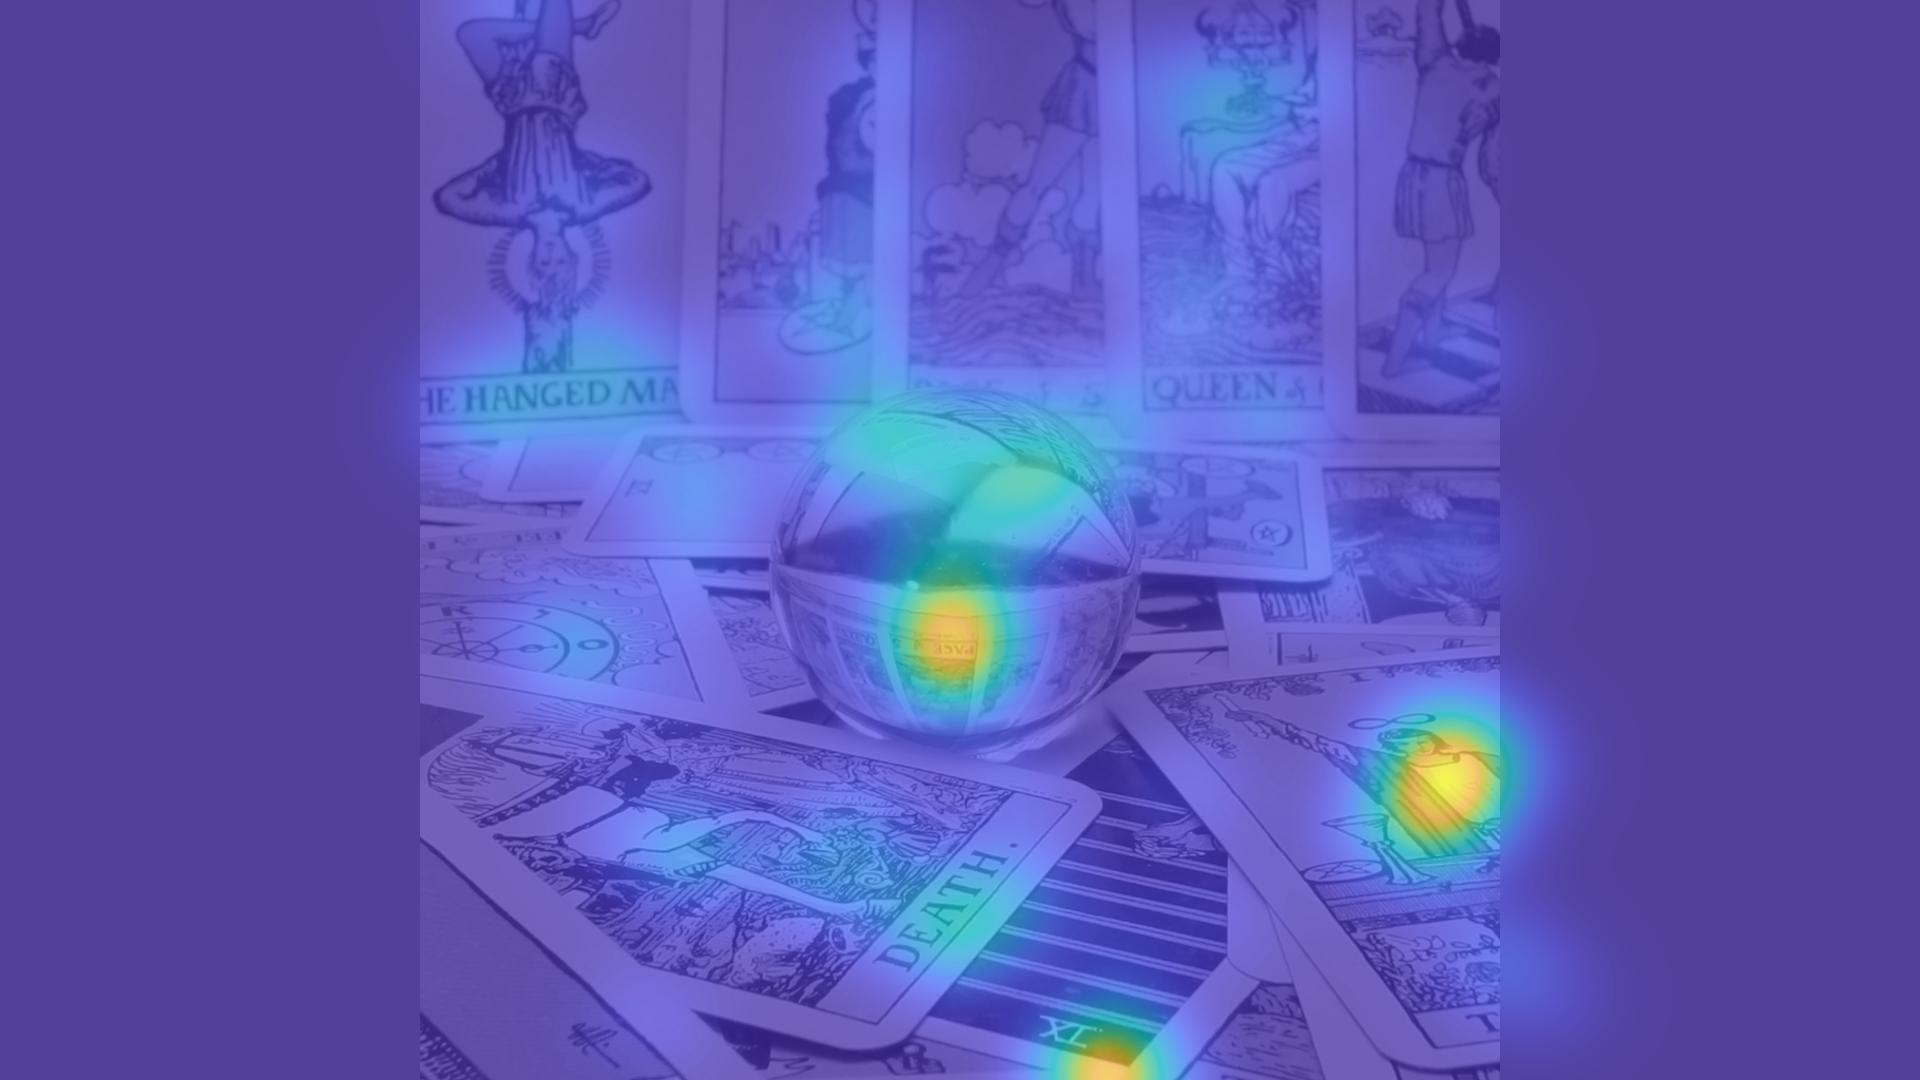
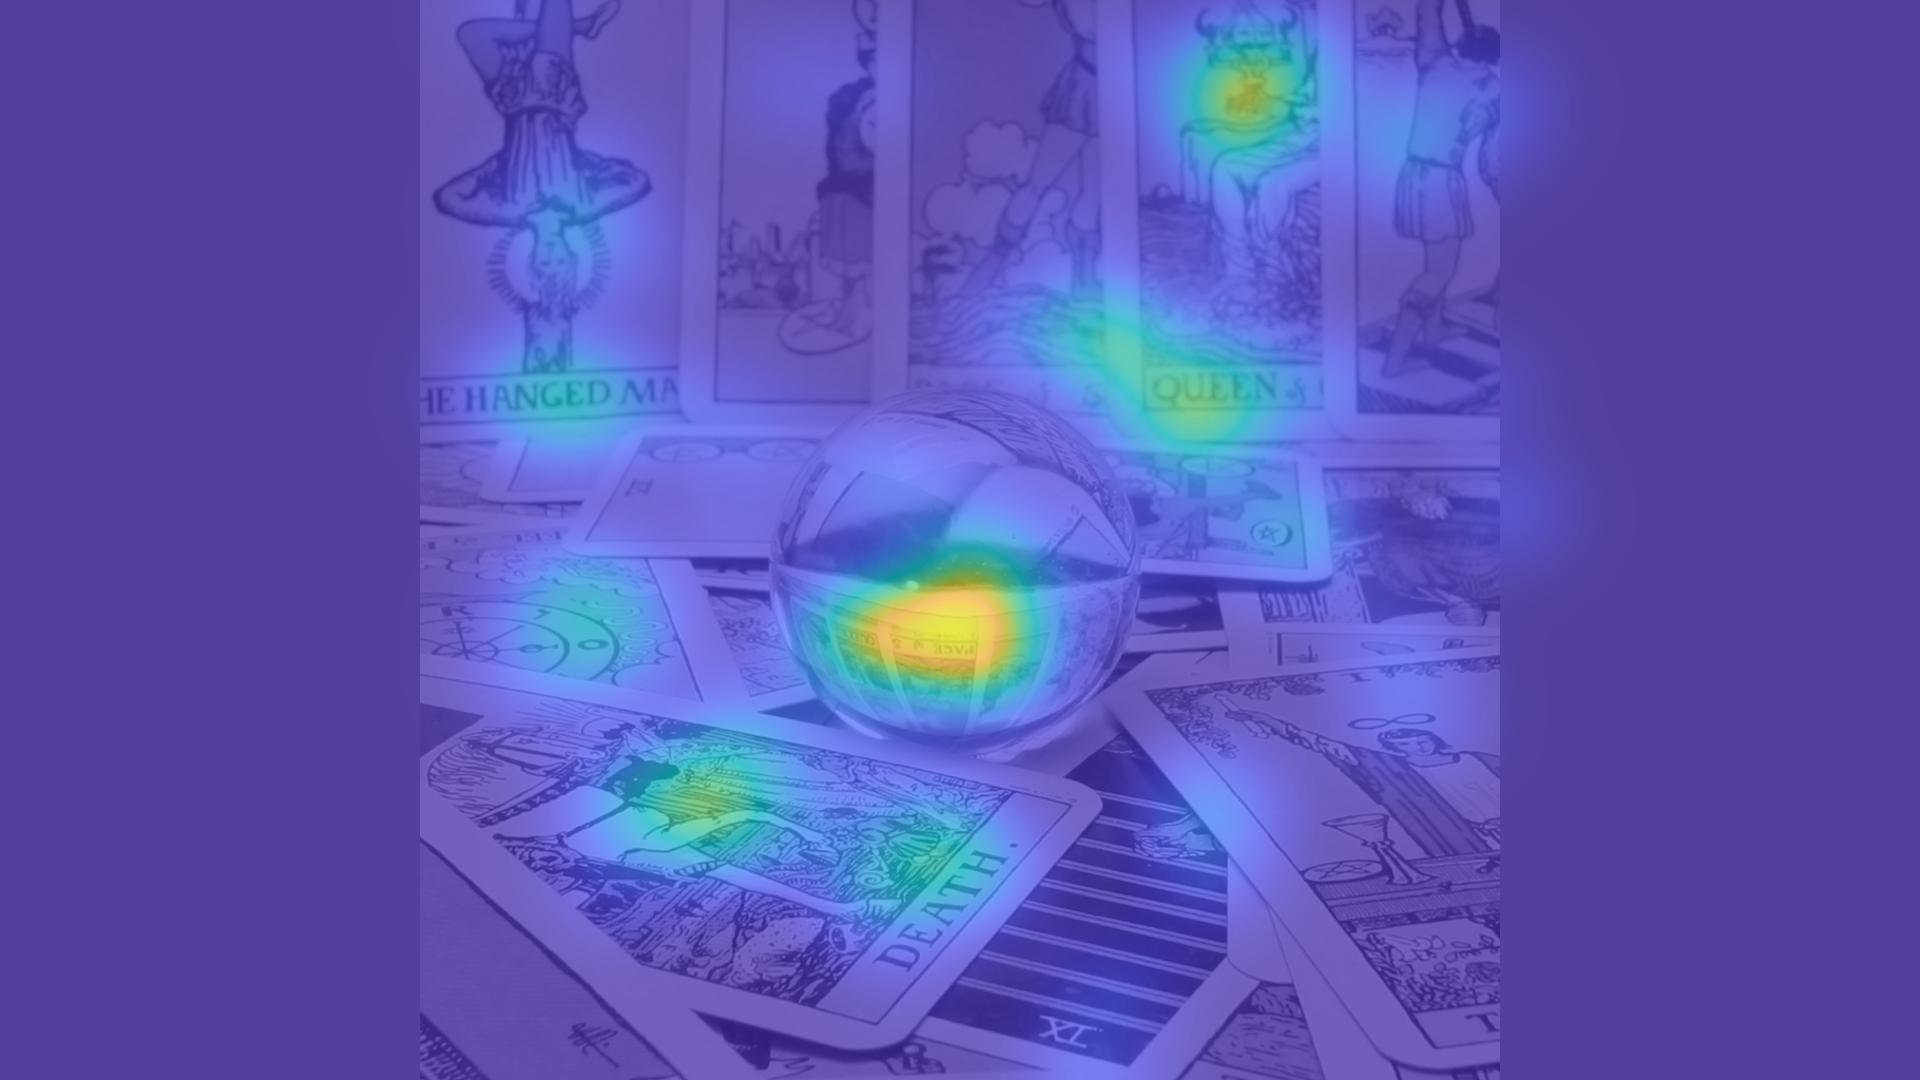
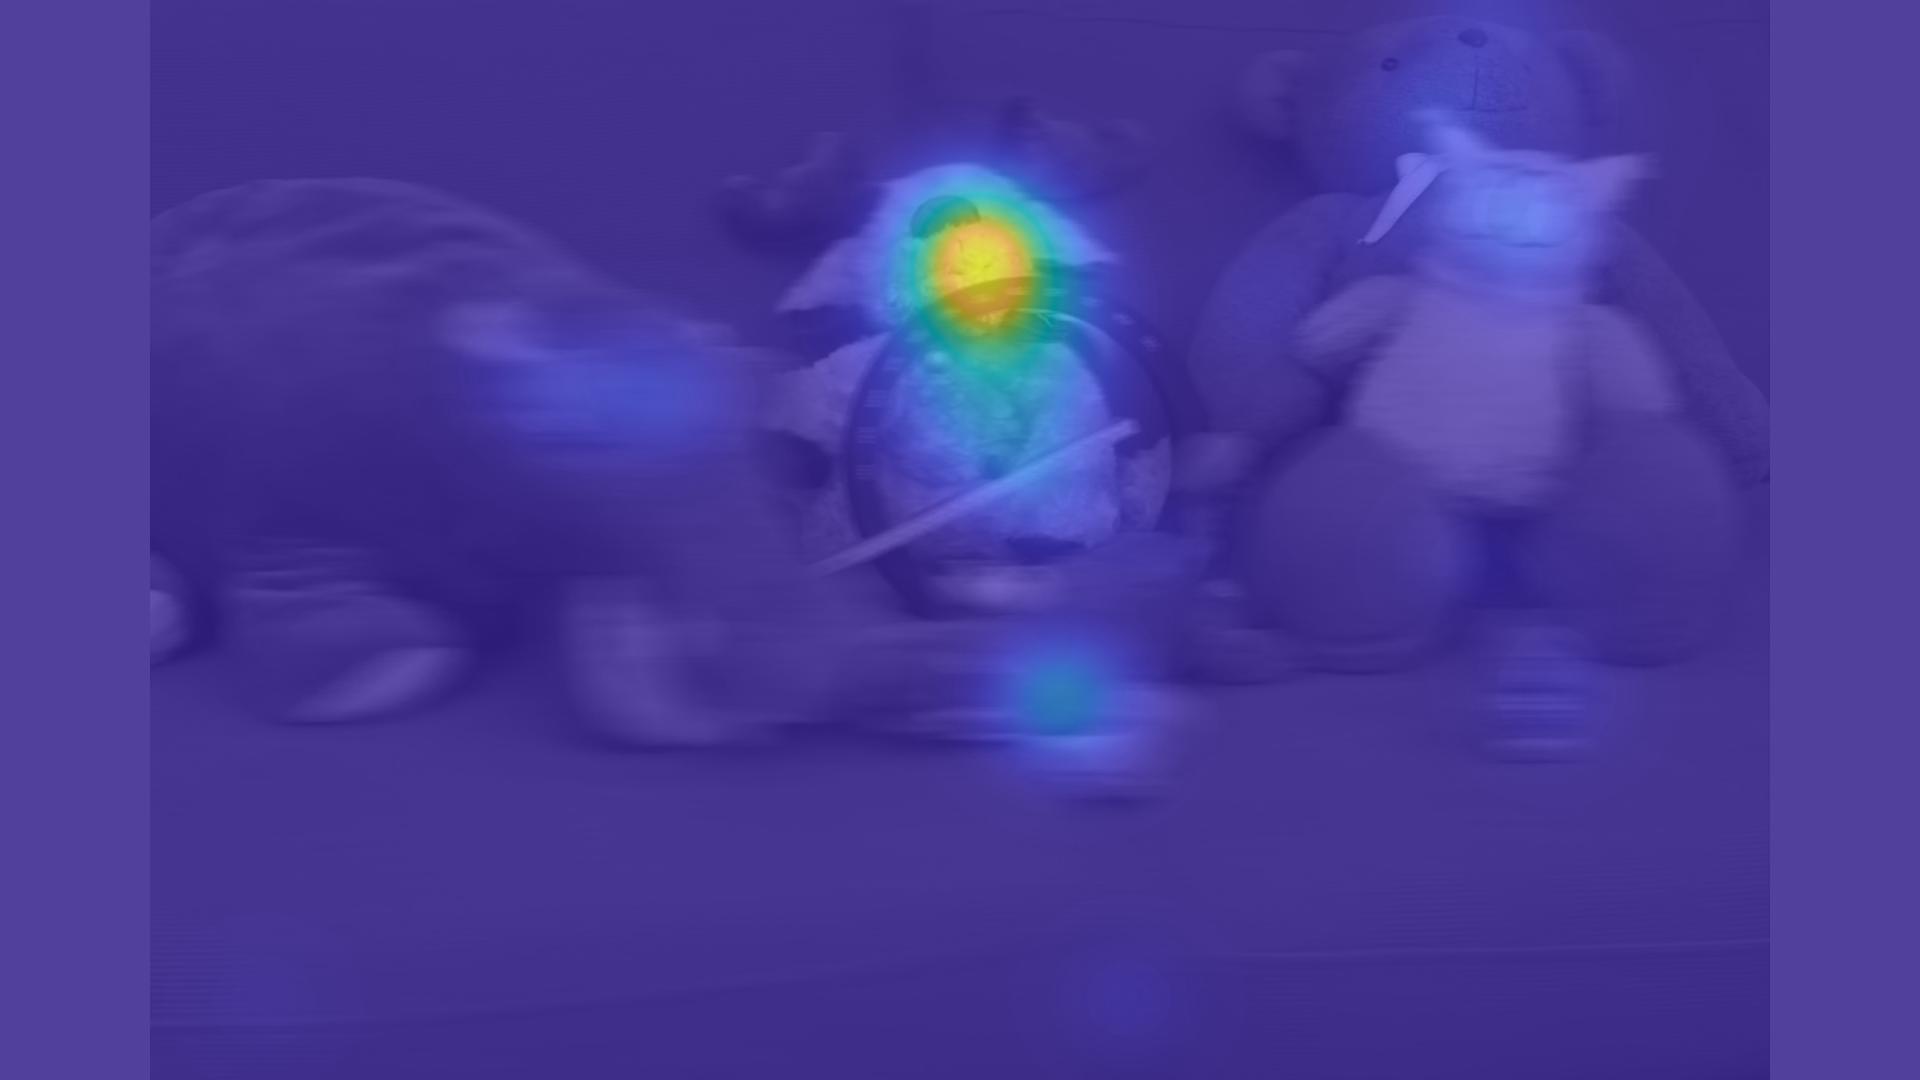
There are other cases where there are objects in a scene that have a higher level of saliency in the all-in-focus rendering and they pull the viewers attention away from the region of focus in other renderings. For example, observe the region-in-focus rendering of the Tarot-S light field in Fig. 3 (c). Although the focus is in the foreground, the saliency map is also concentrated on the centre ball. As the centre ball has a high saliency in the all-in-focus rendering Fig. 3 (d), we can deduce that it is salient independent of its level of focus.
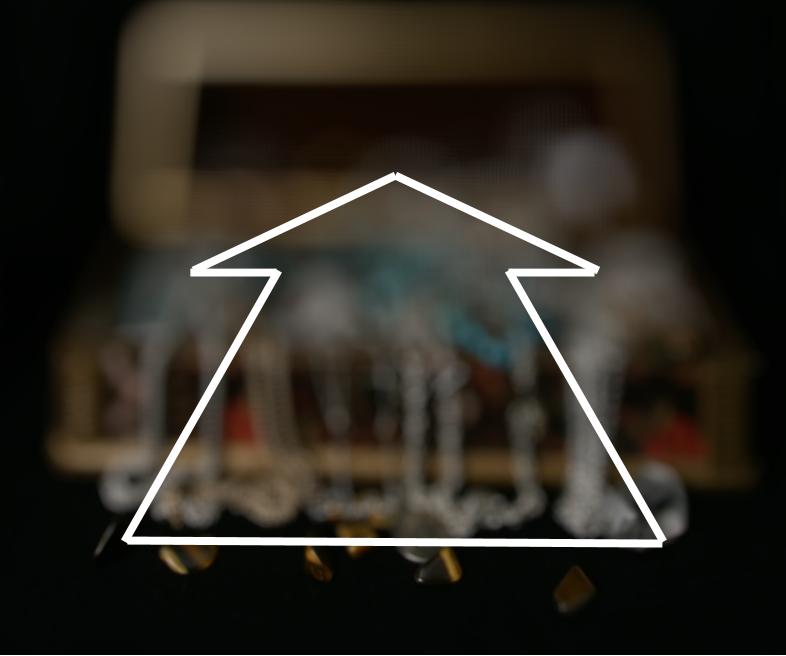
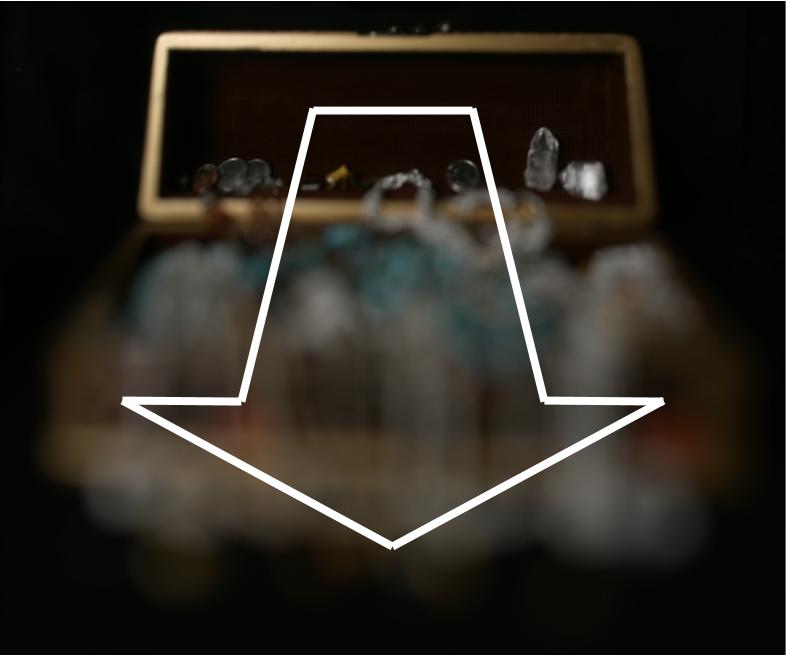
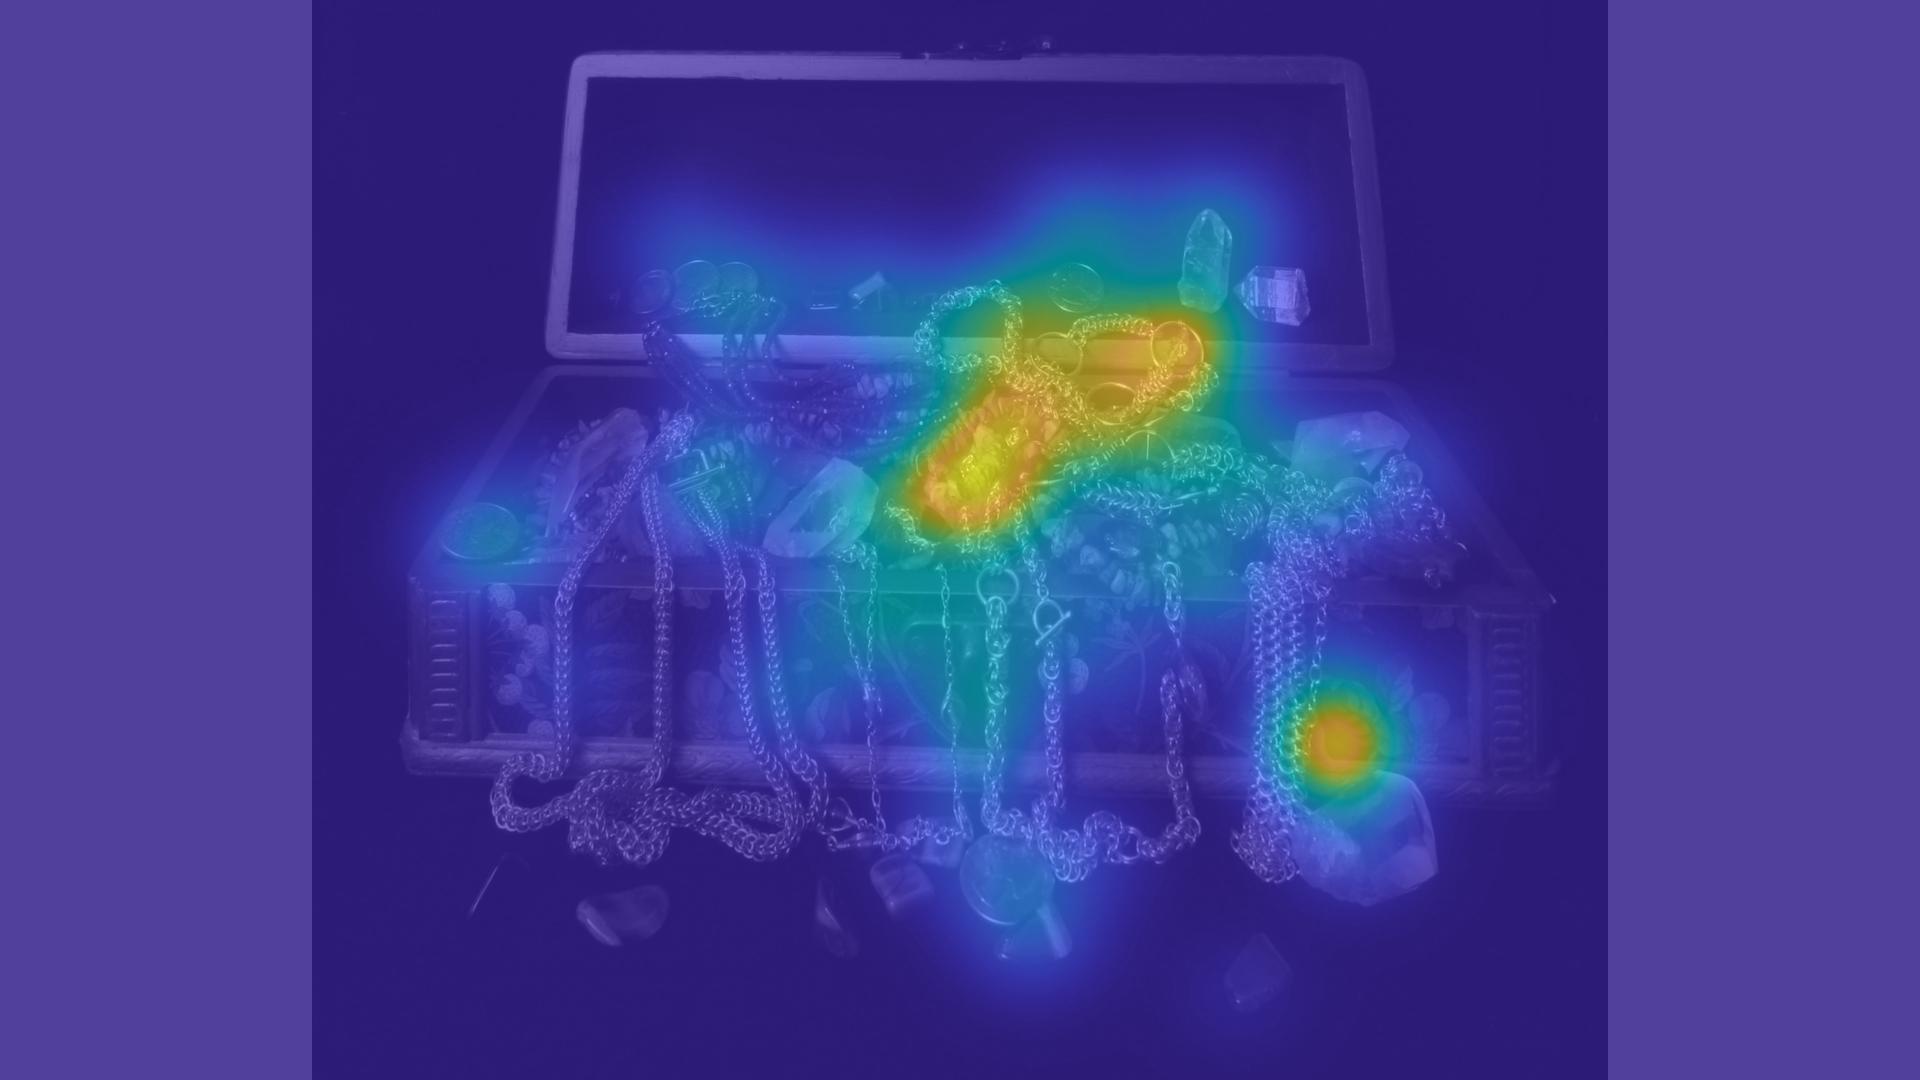
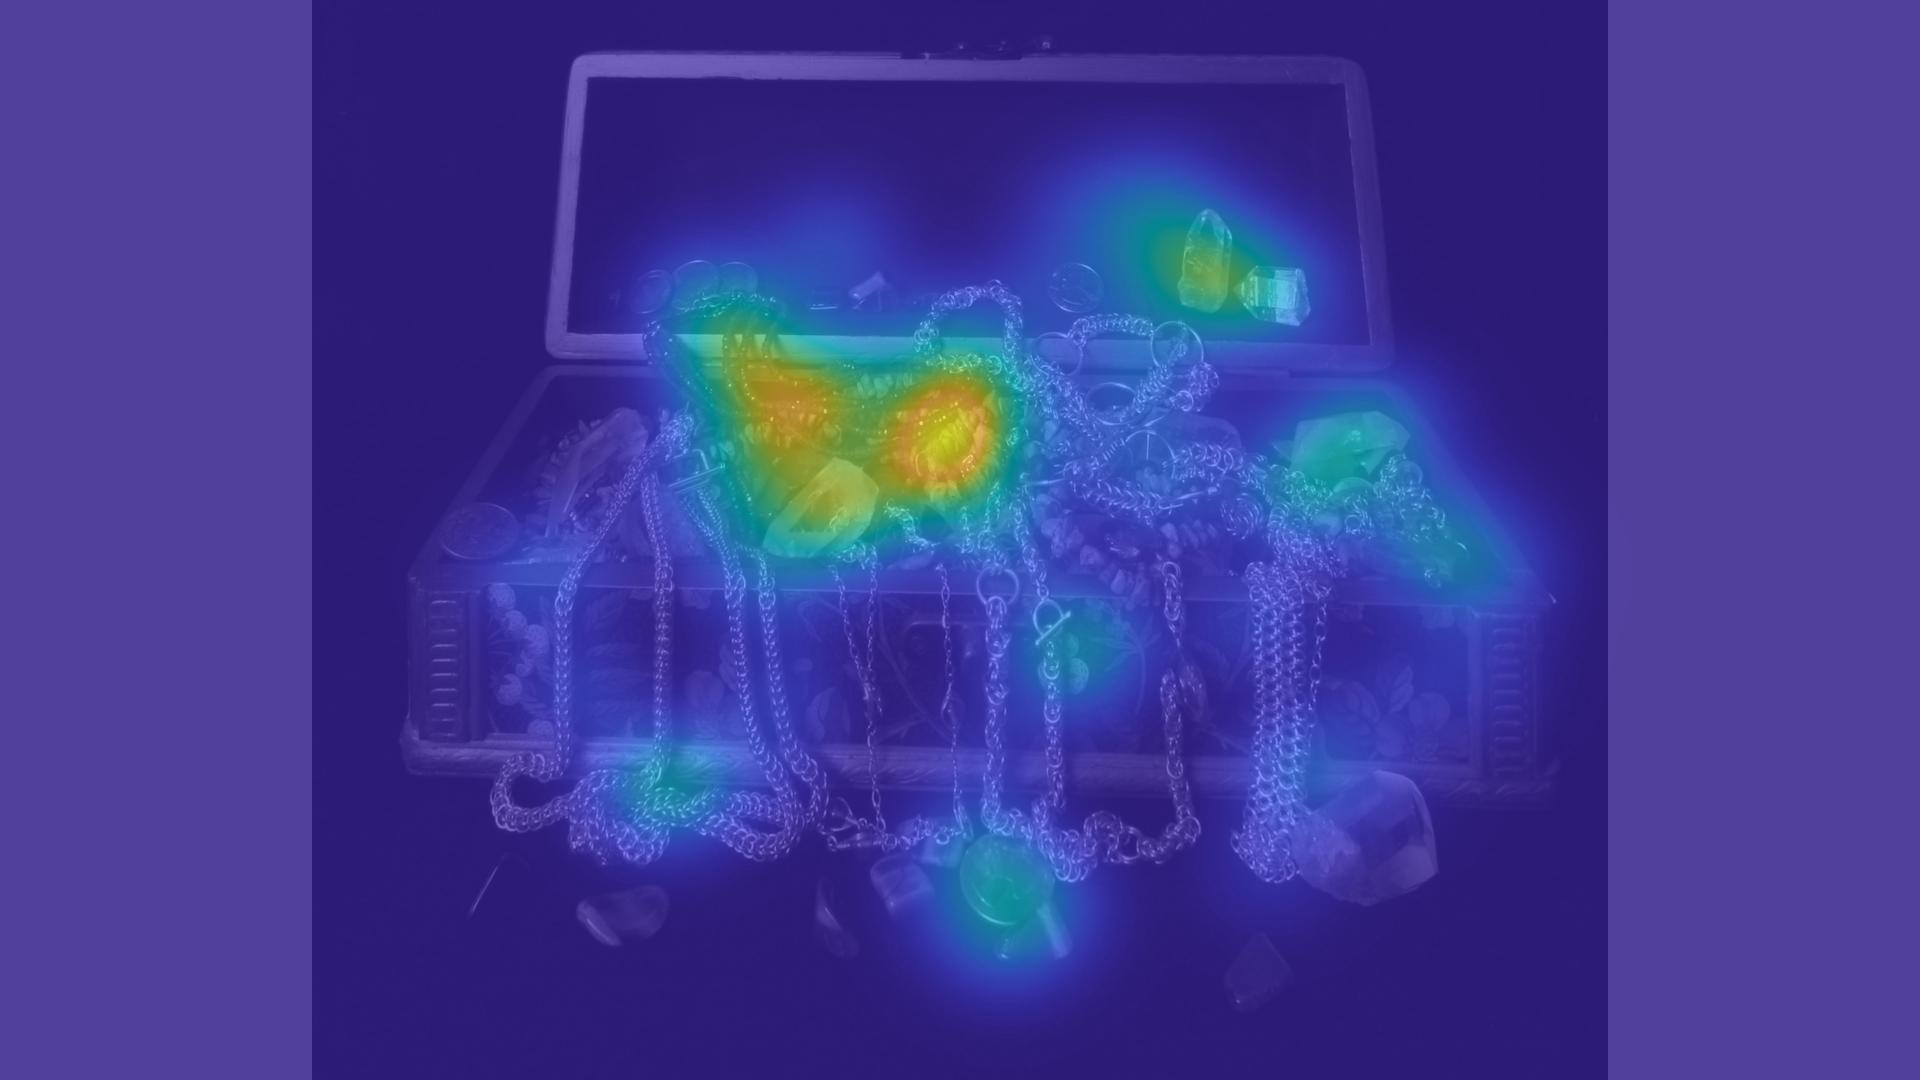
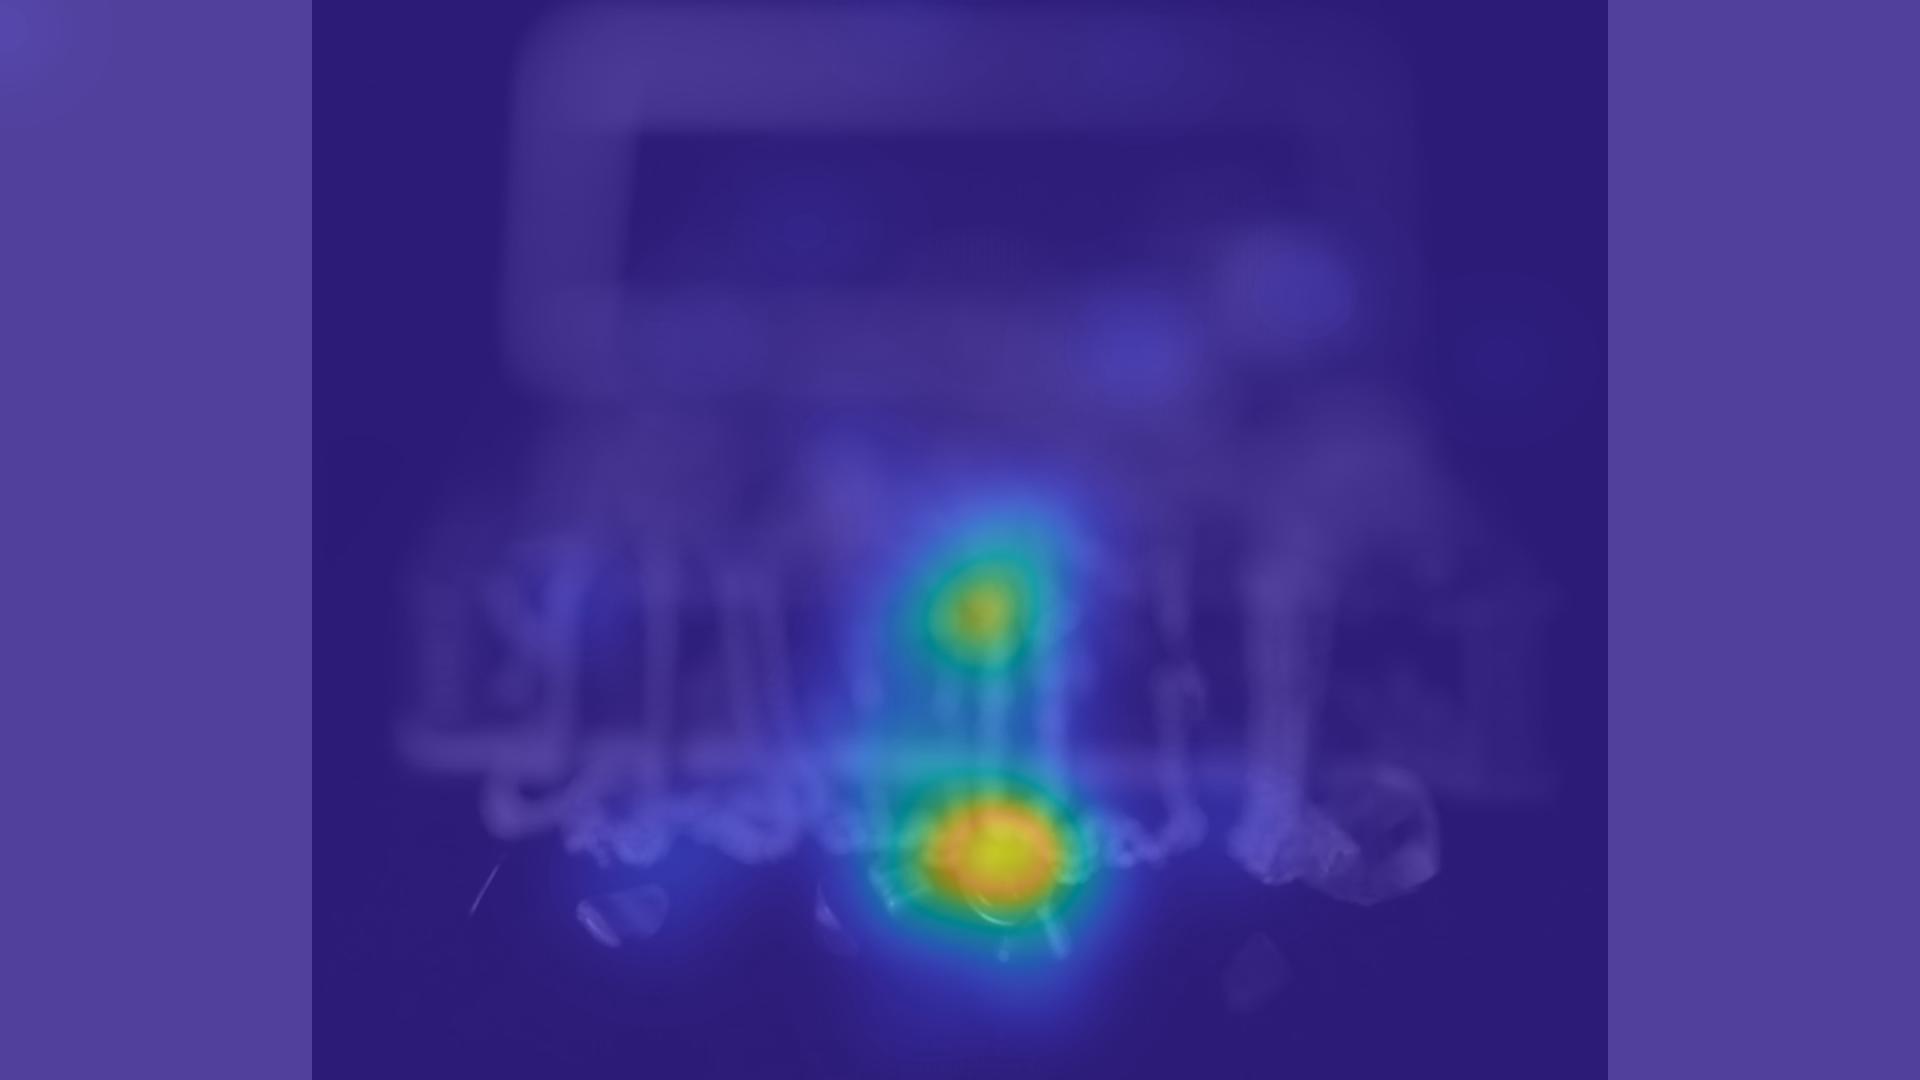
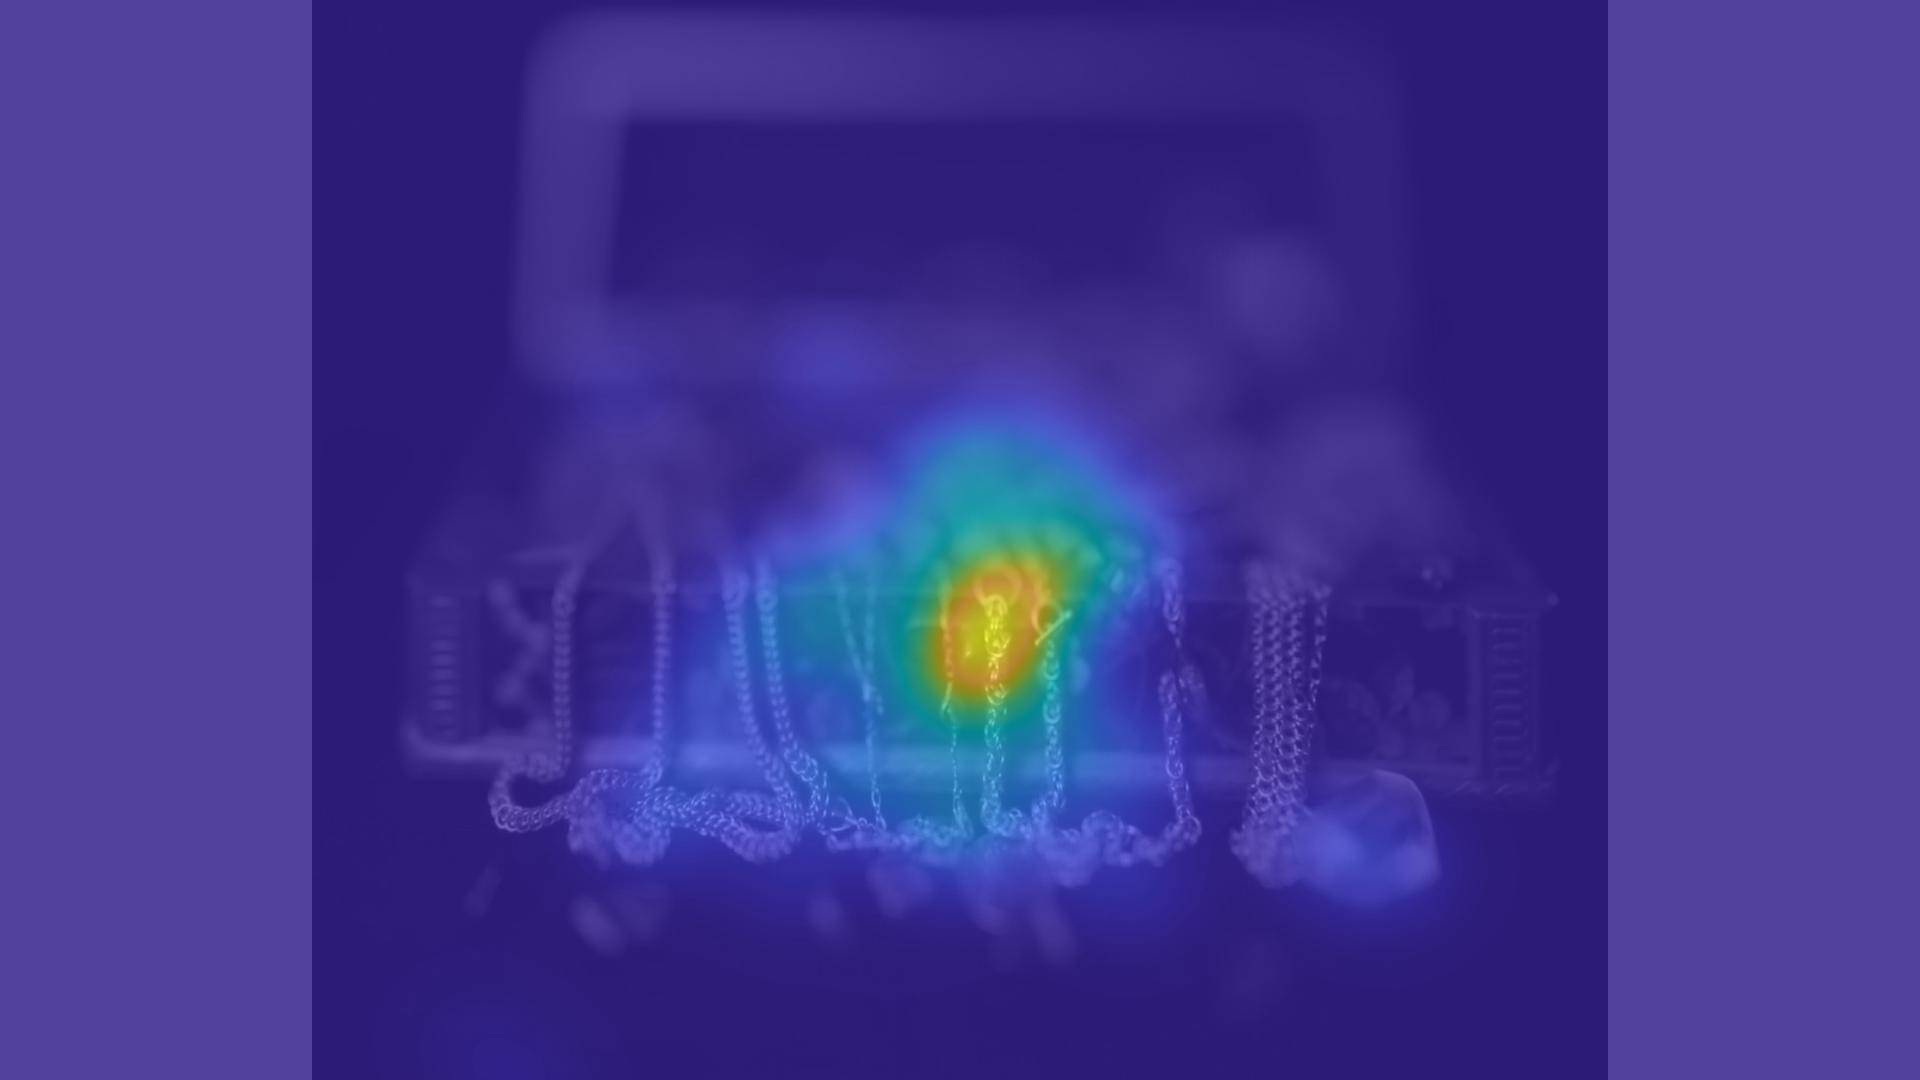
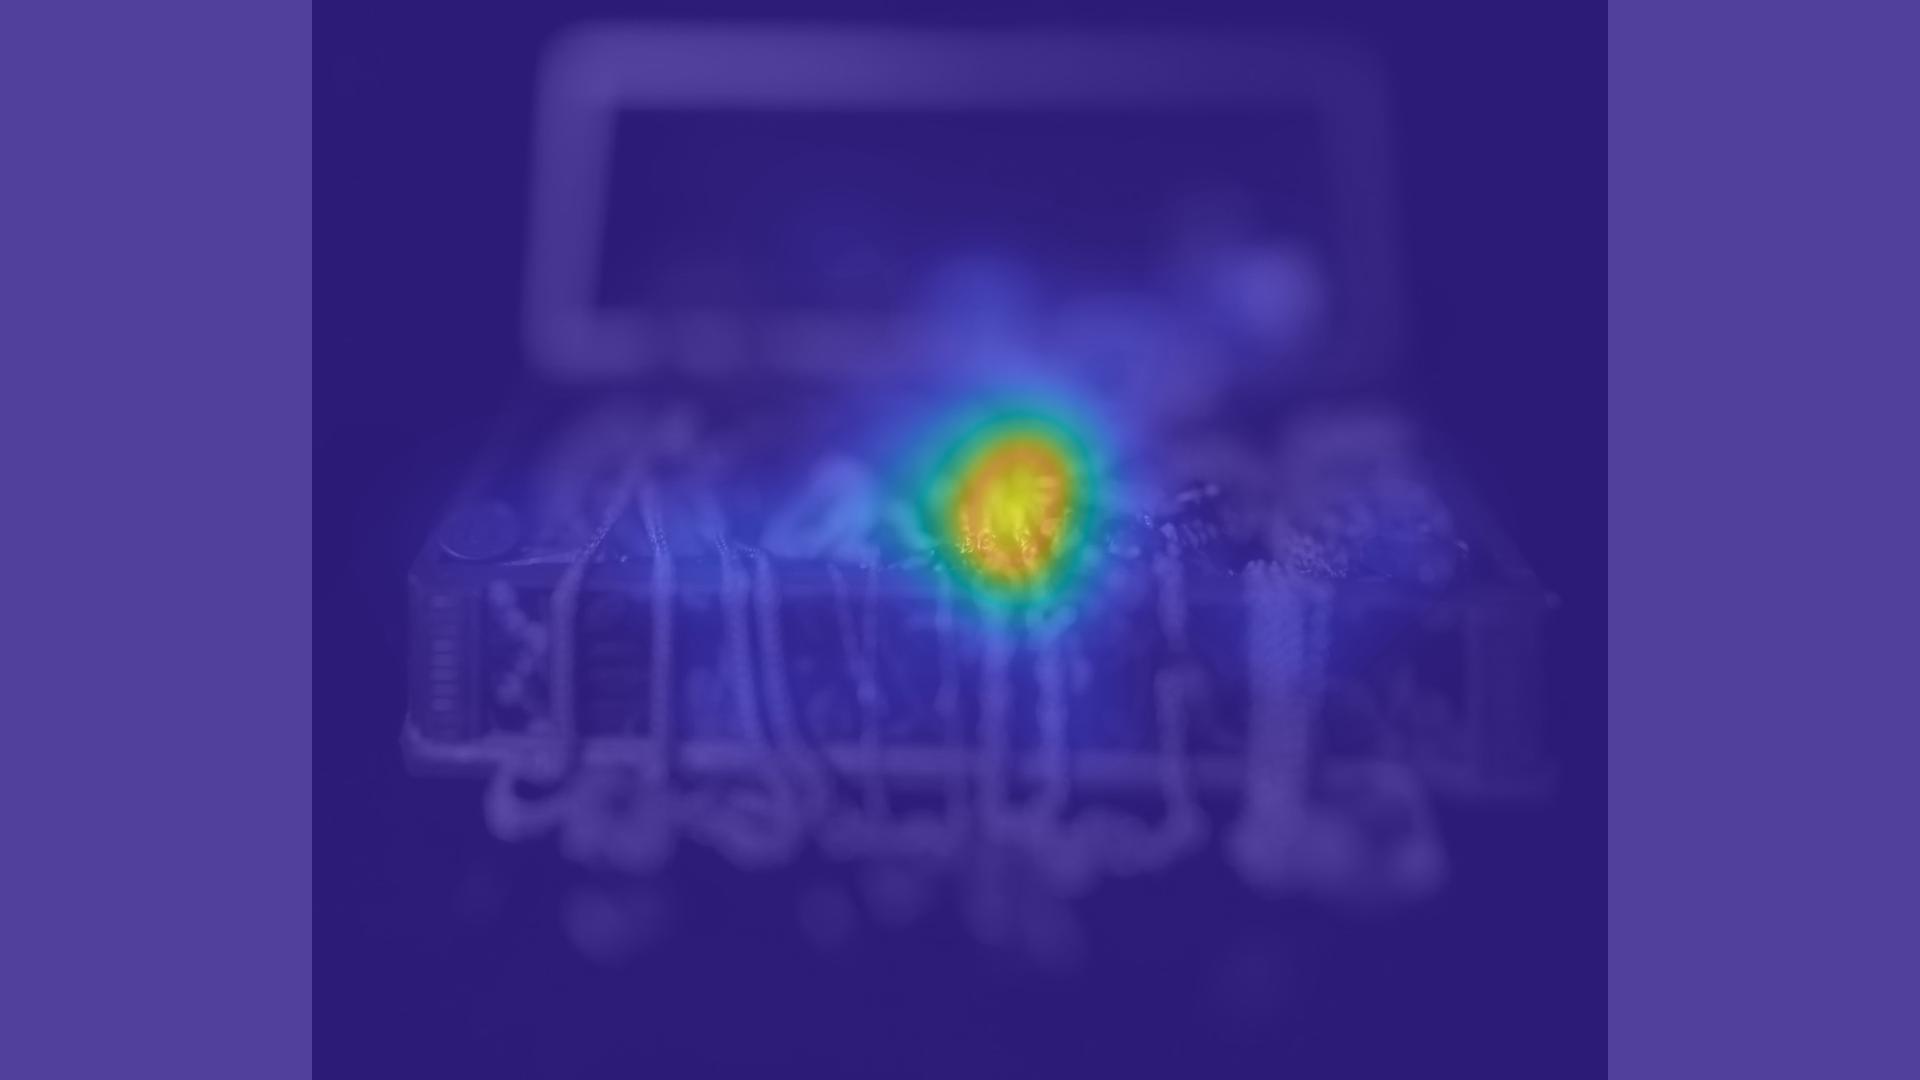
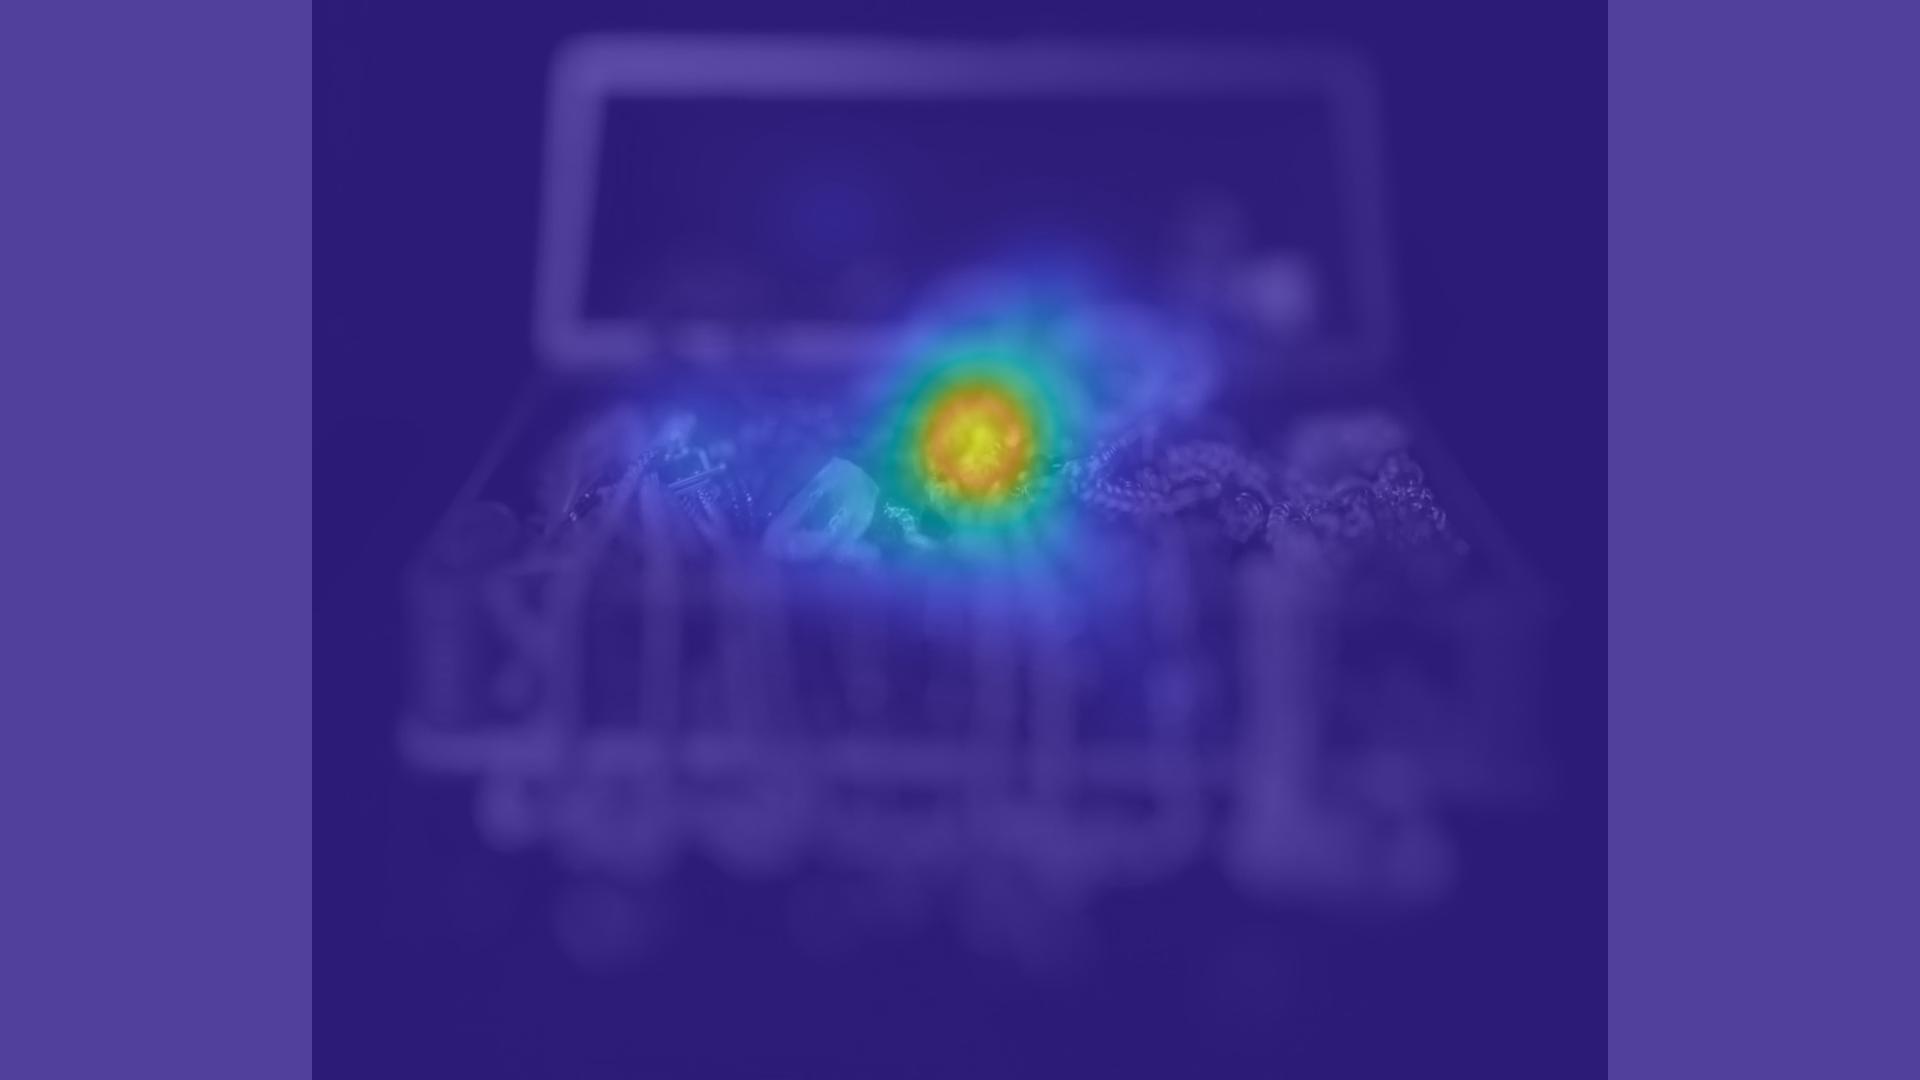
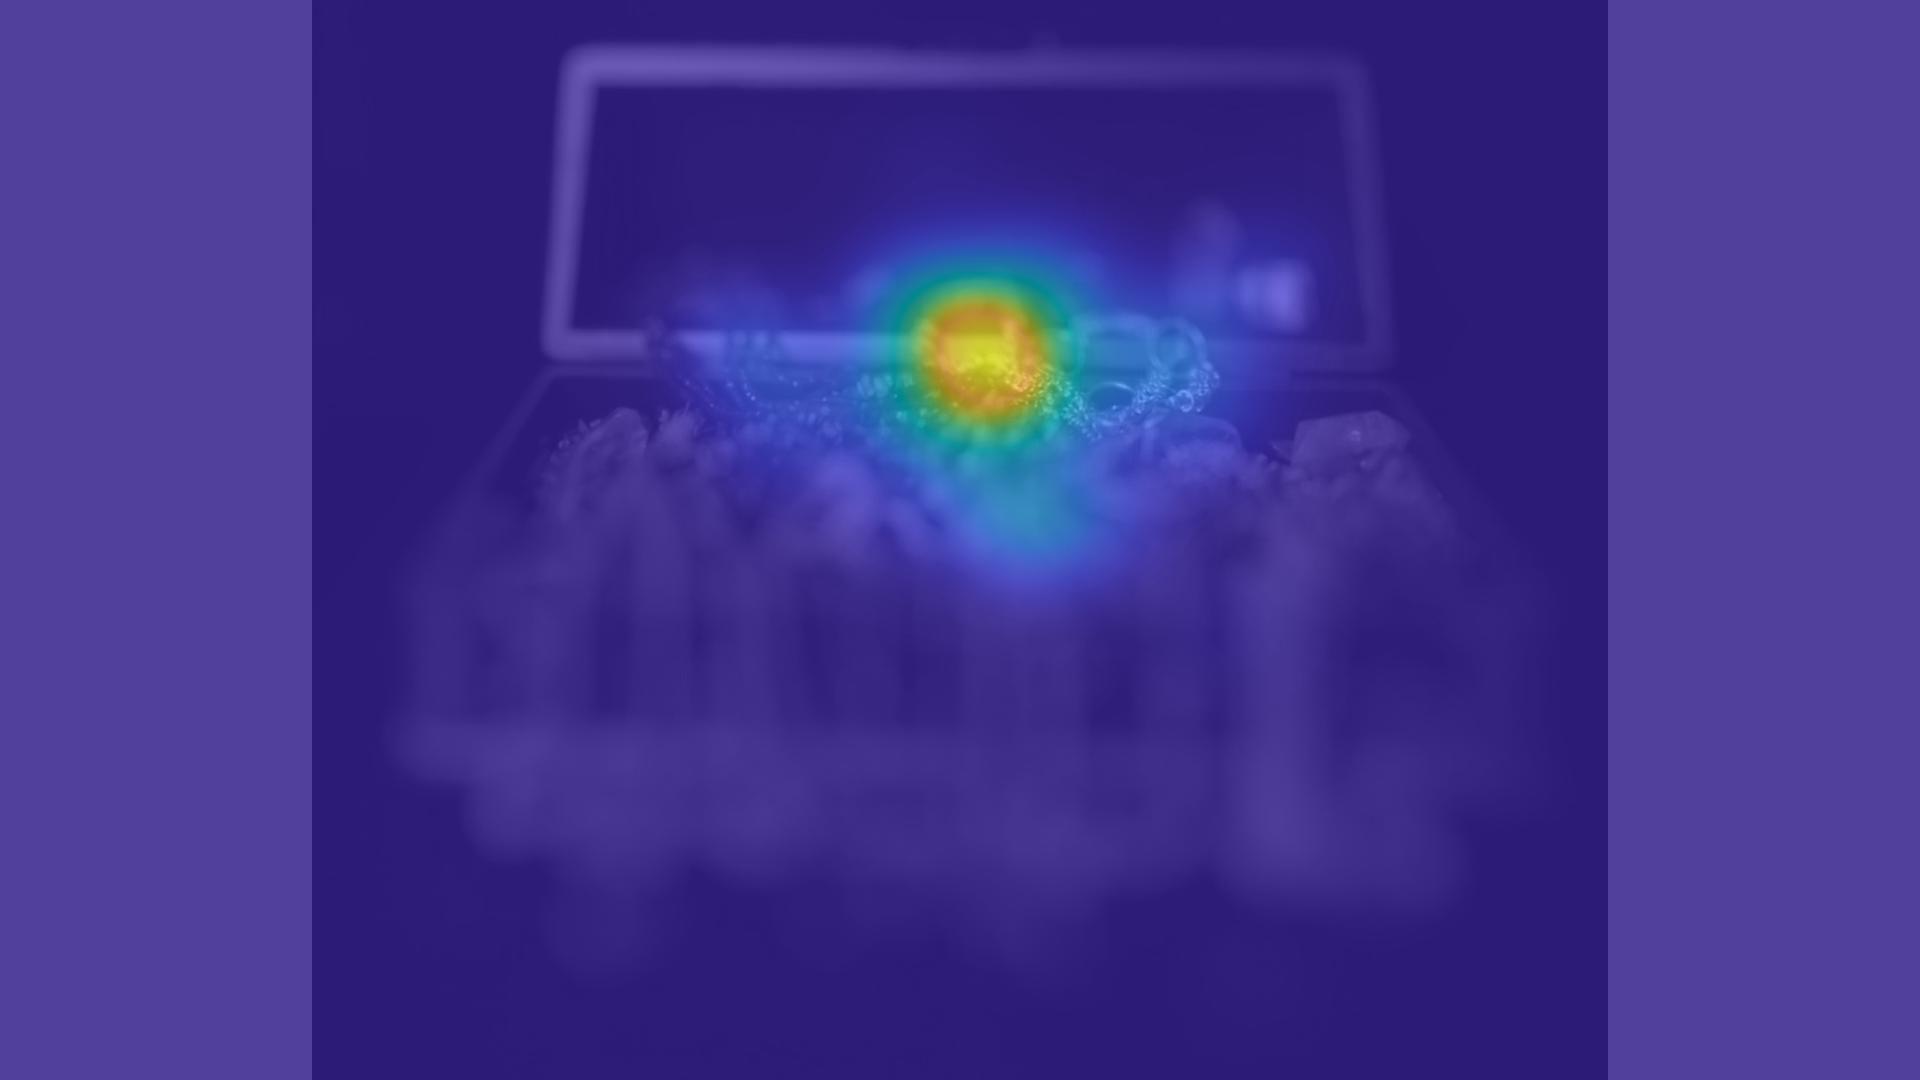
Some scenes do not depict a specific object/ exhibit a region of high saliency. These tend to produce highly dispersed saliency maps. This is demonstrated in the Treasure light field in Fig. 3 (e). The saliency dispersion in the all-in-focus rendering suggests that the viewer is likely to follow the region of focus almost exclusively in other renderings as seen in Fig. 3 (f).
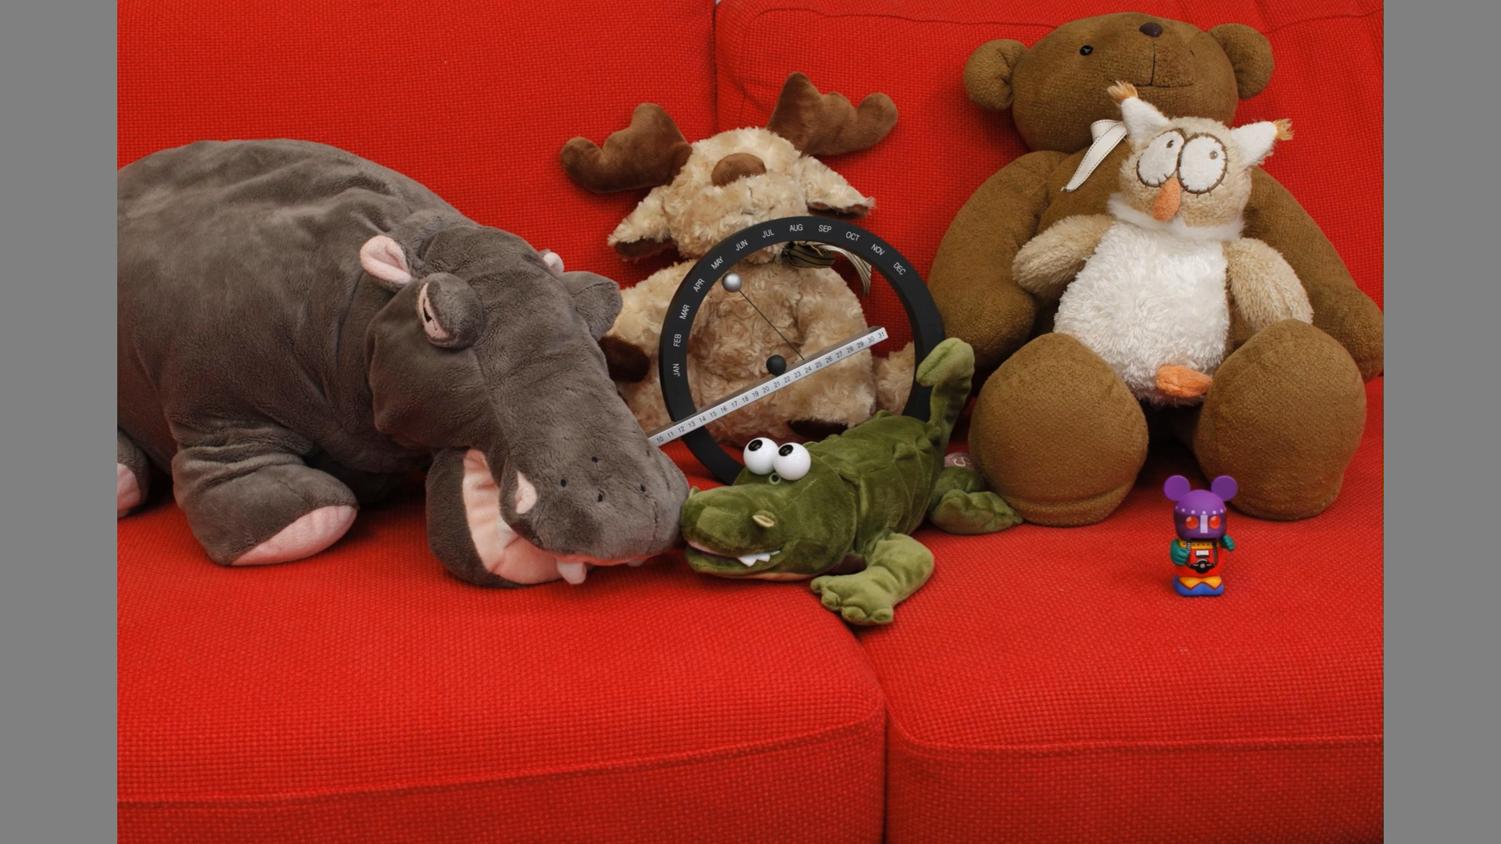
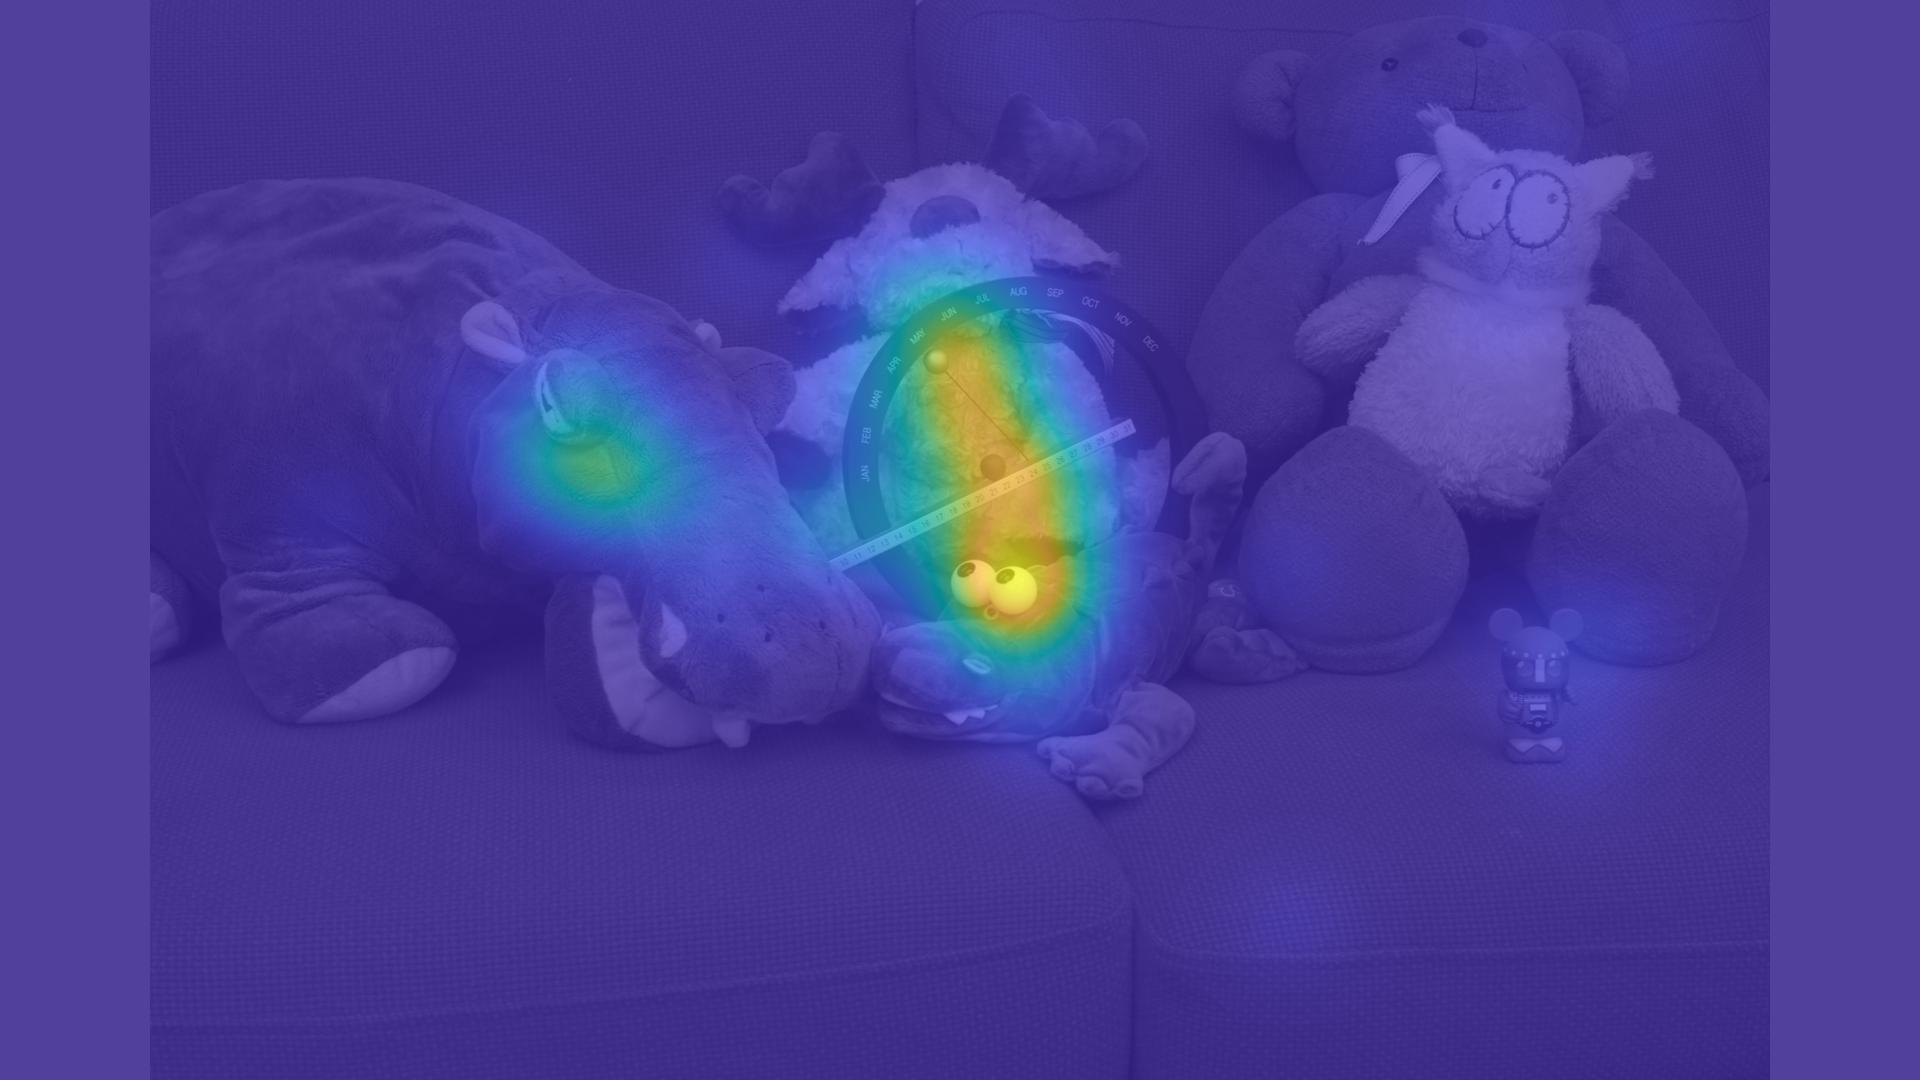
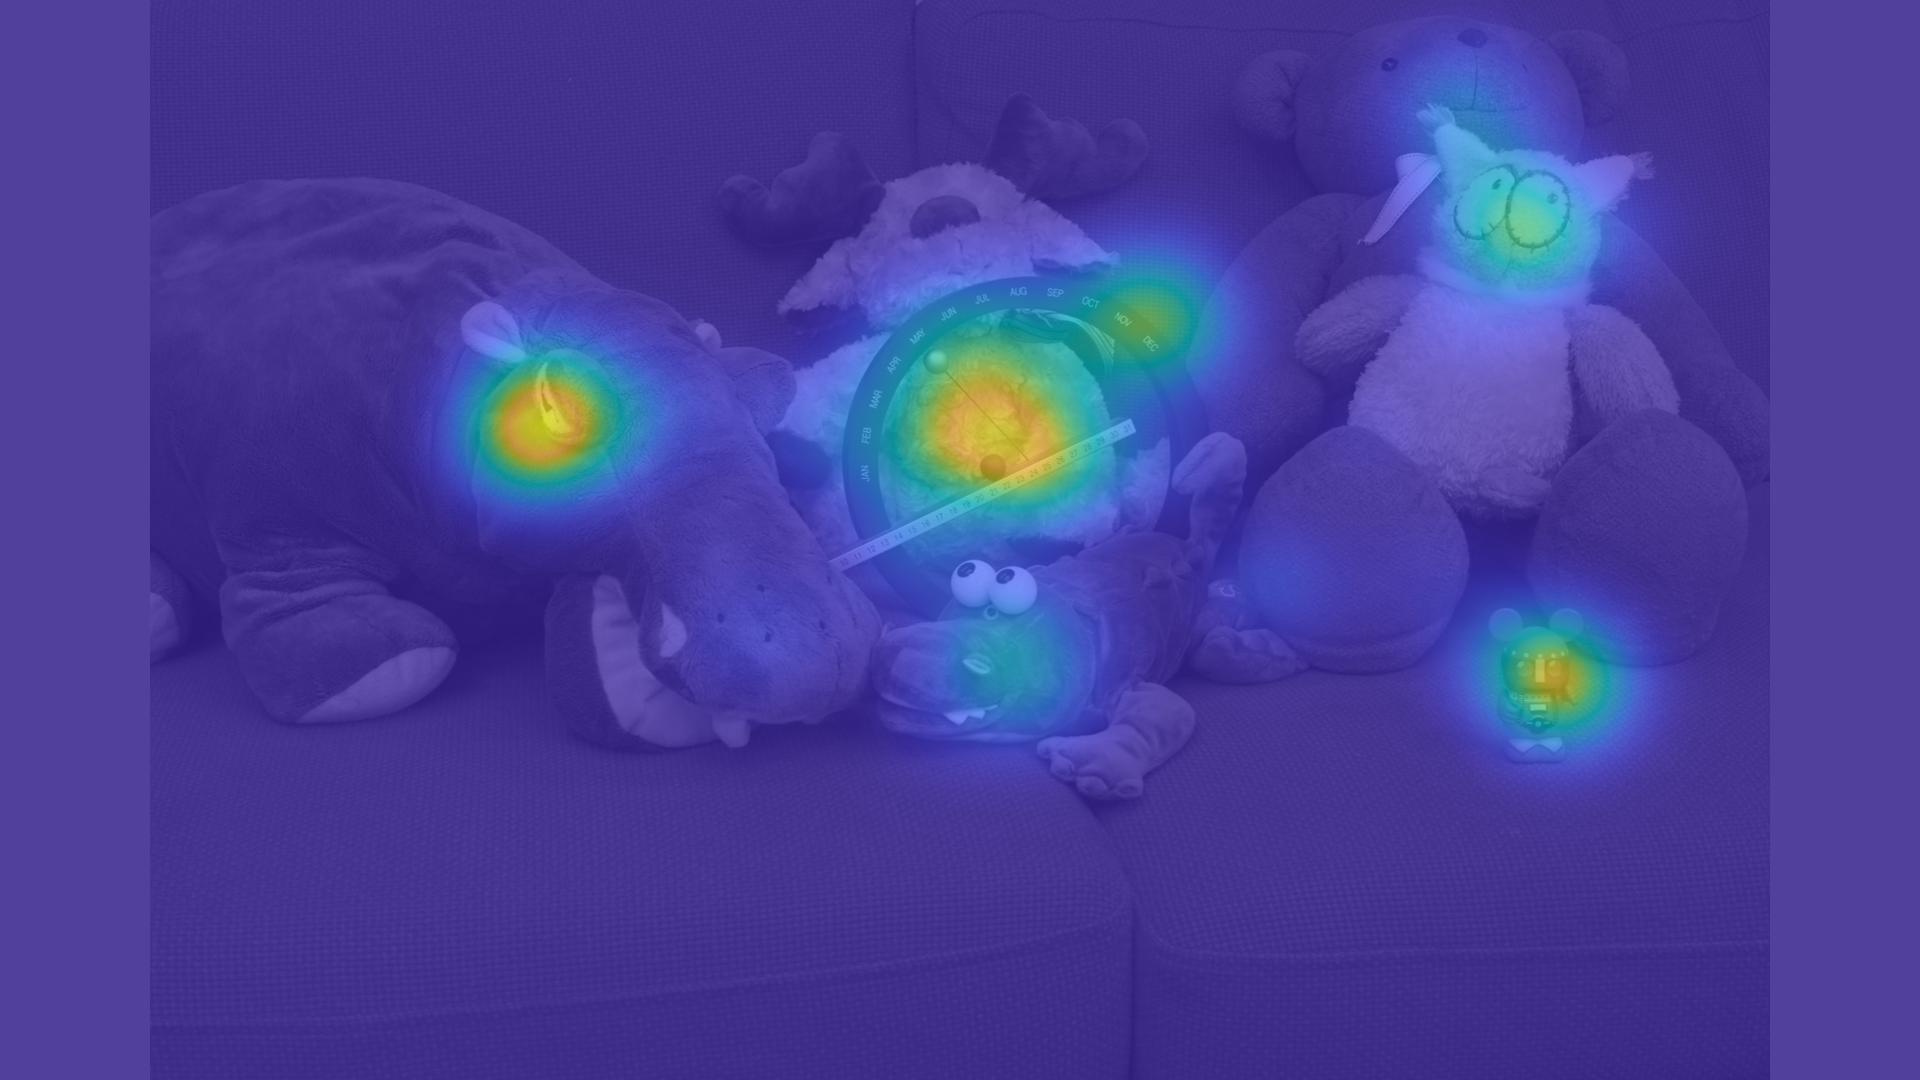
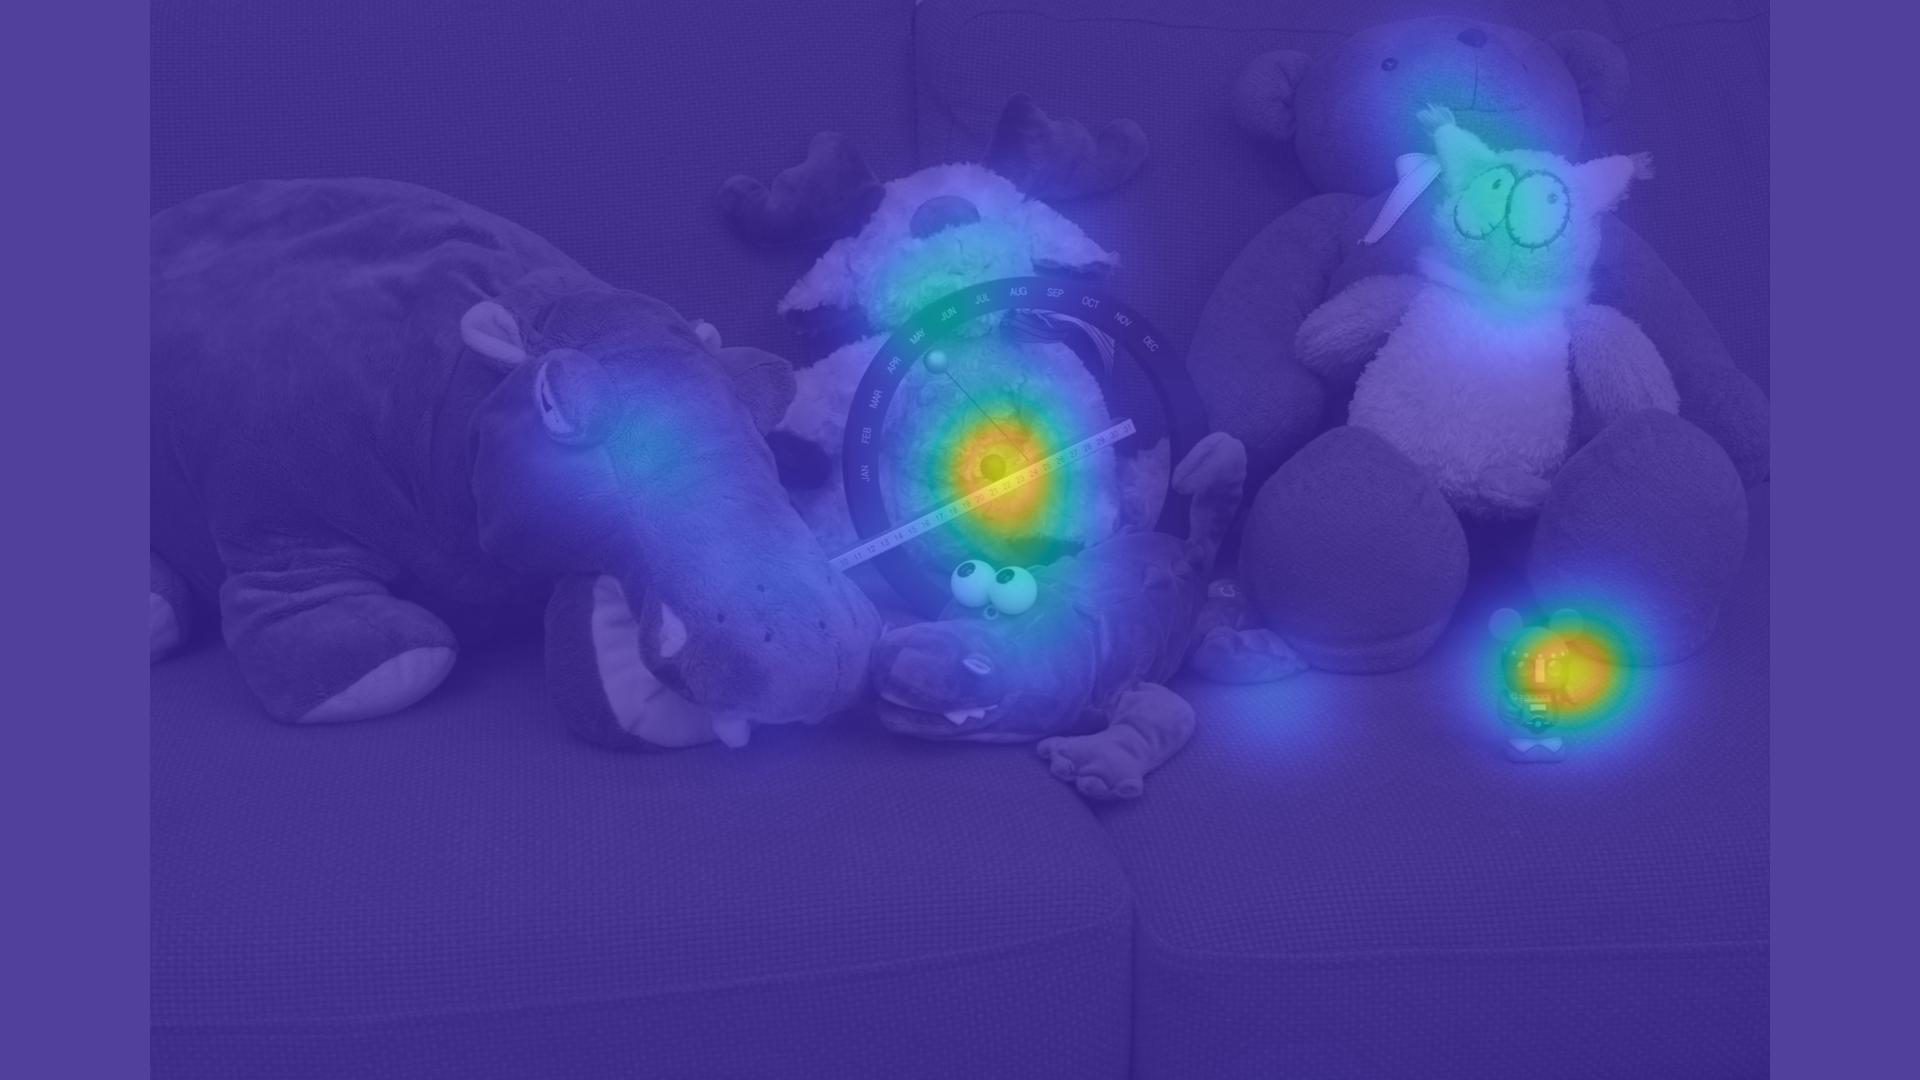
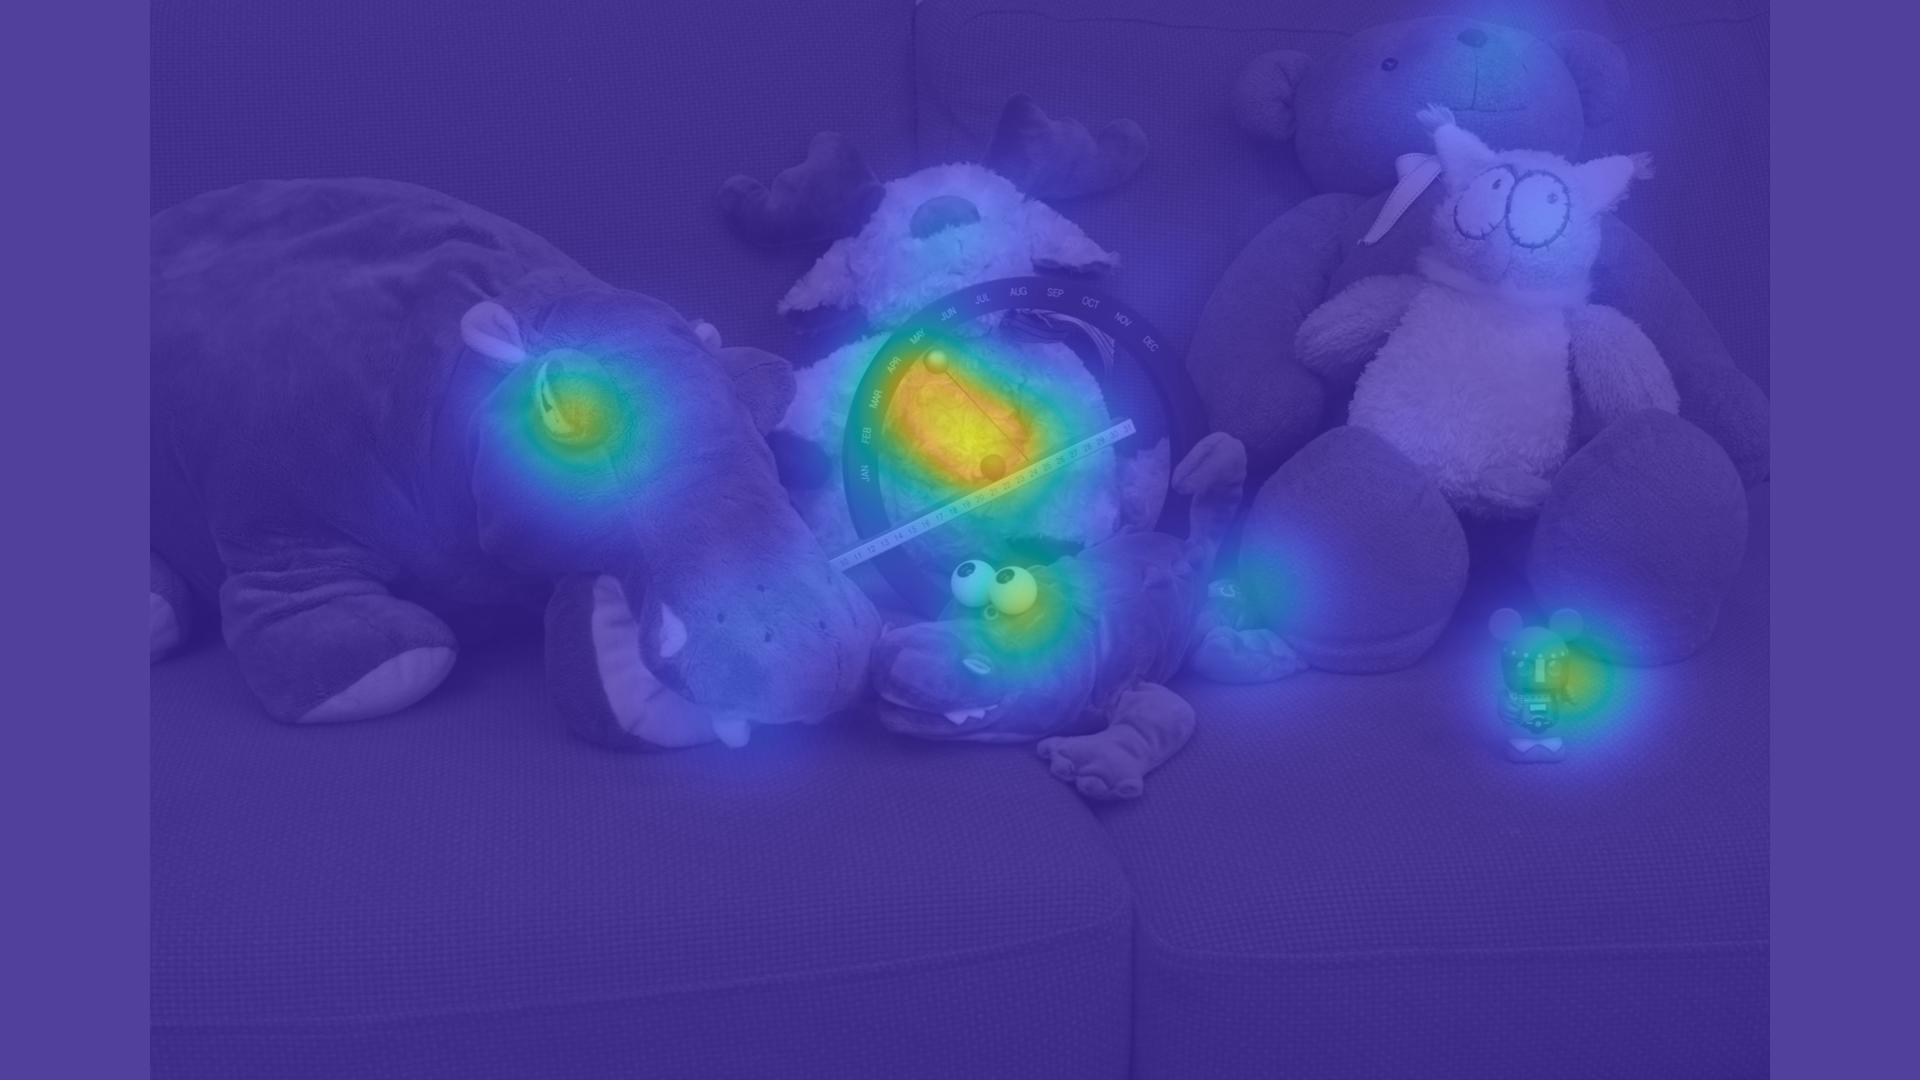
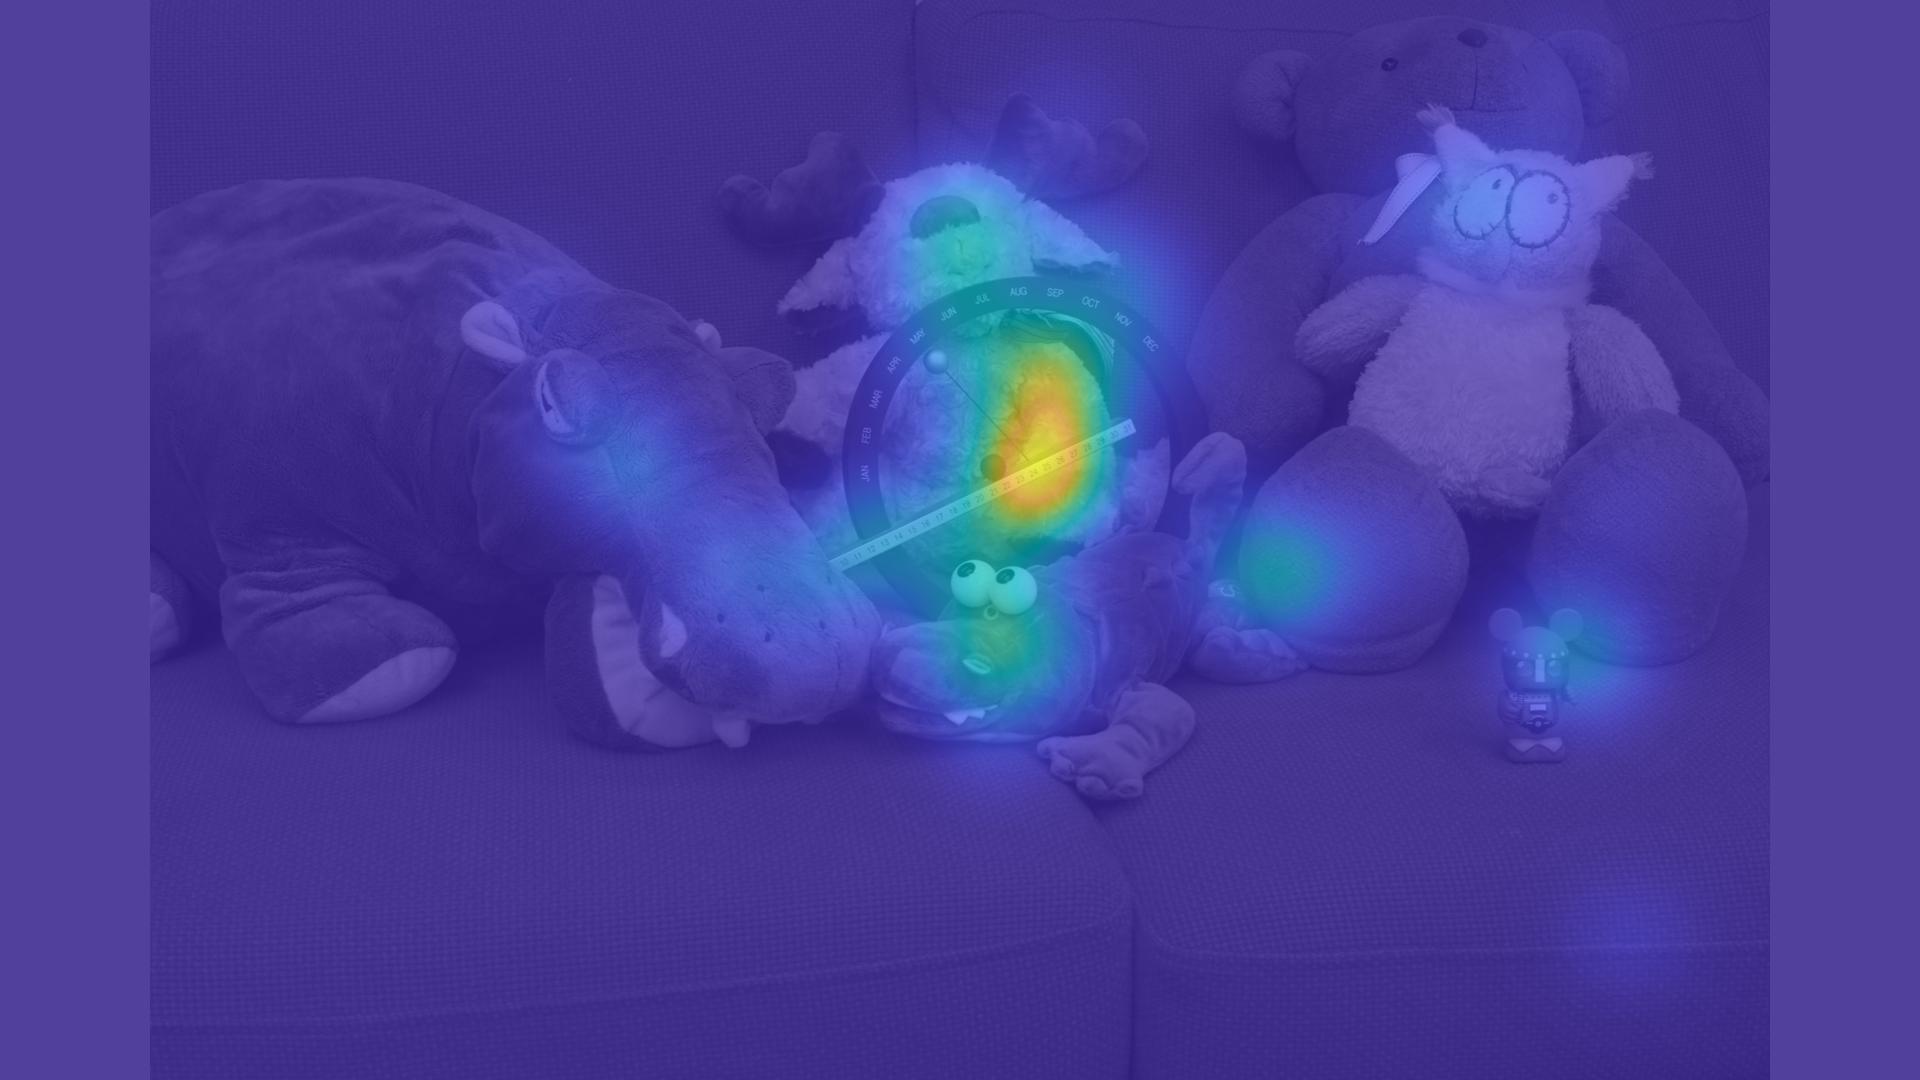
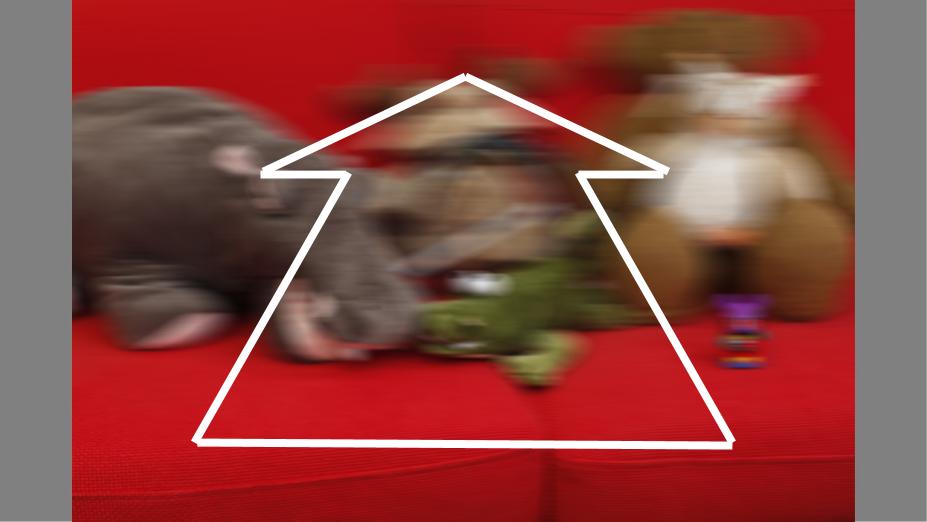
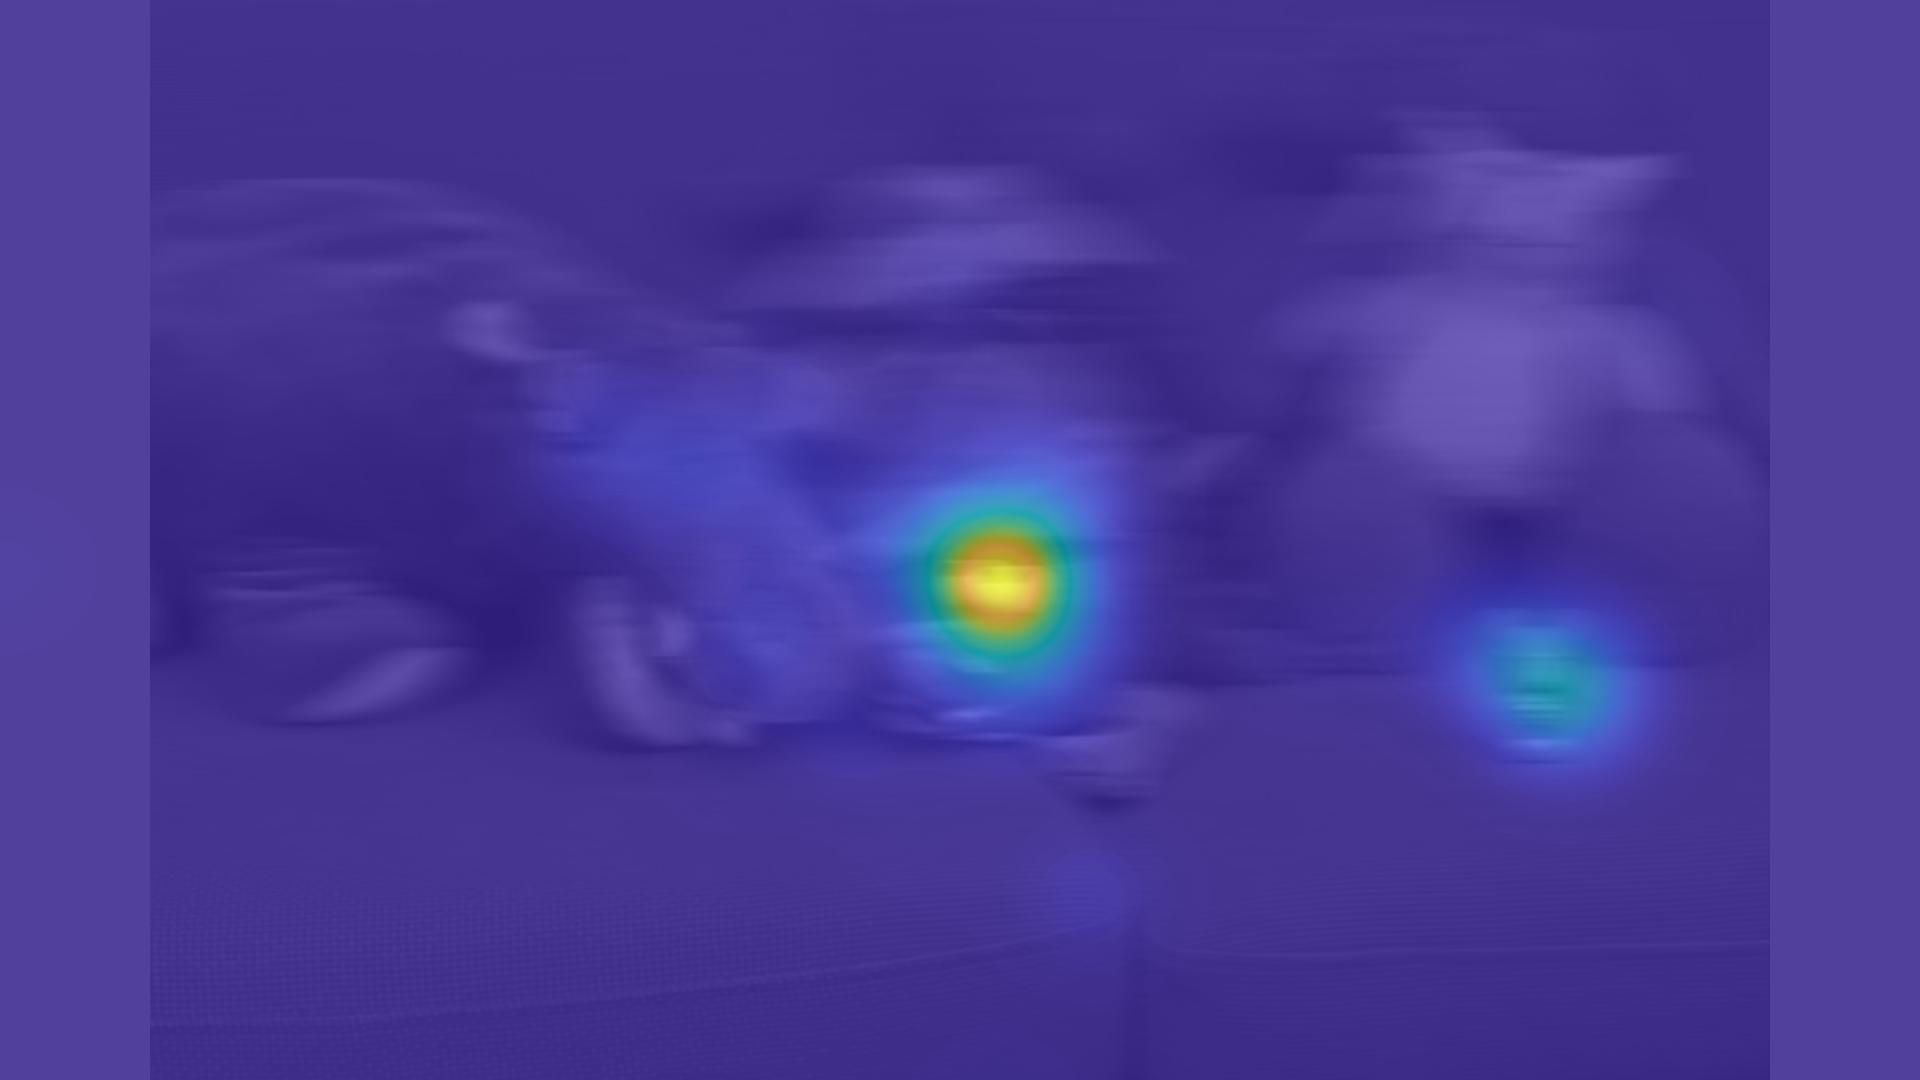
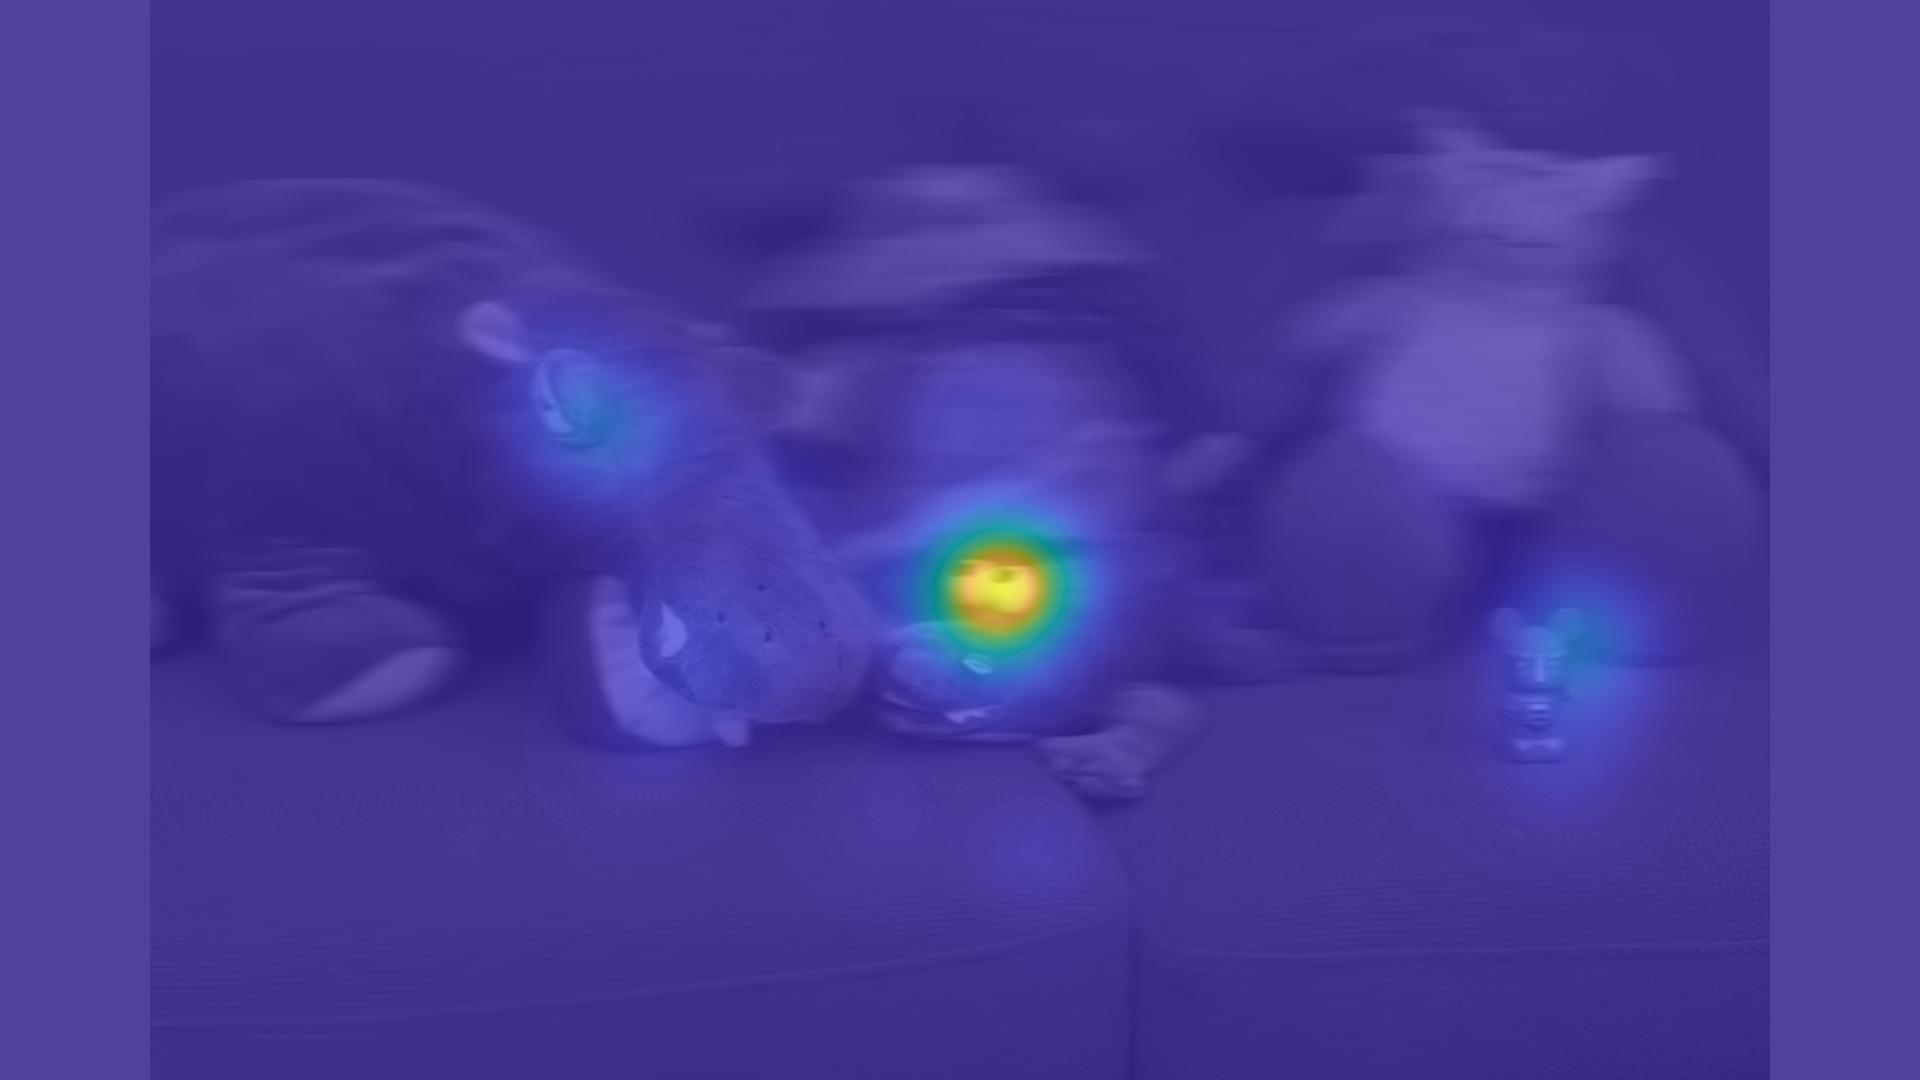
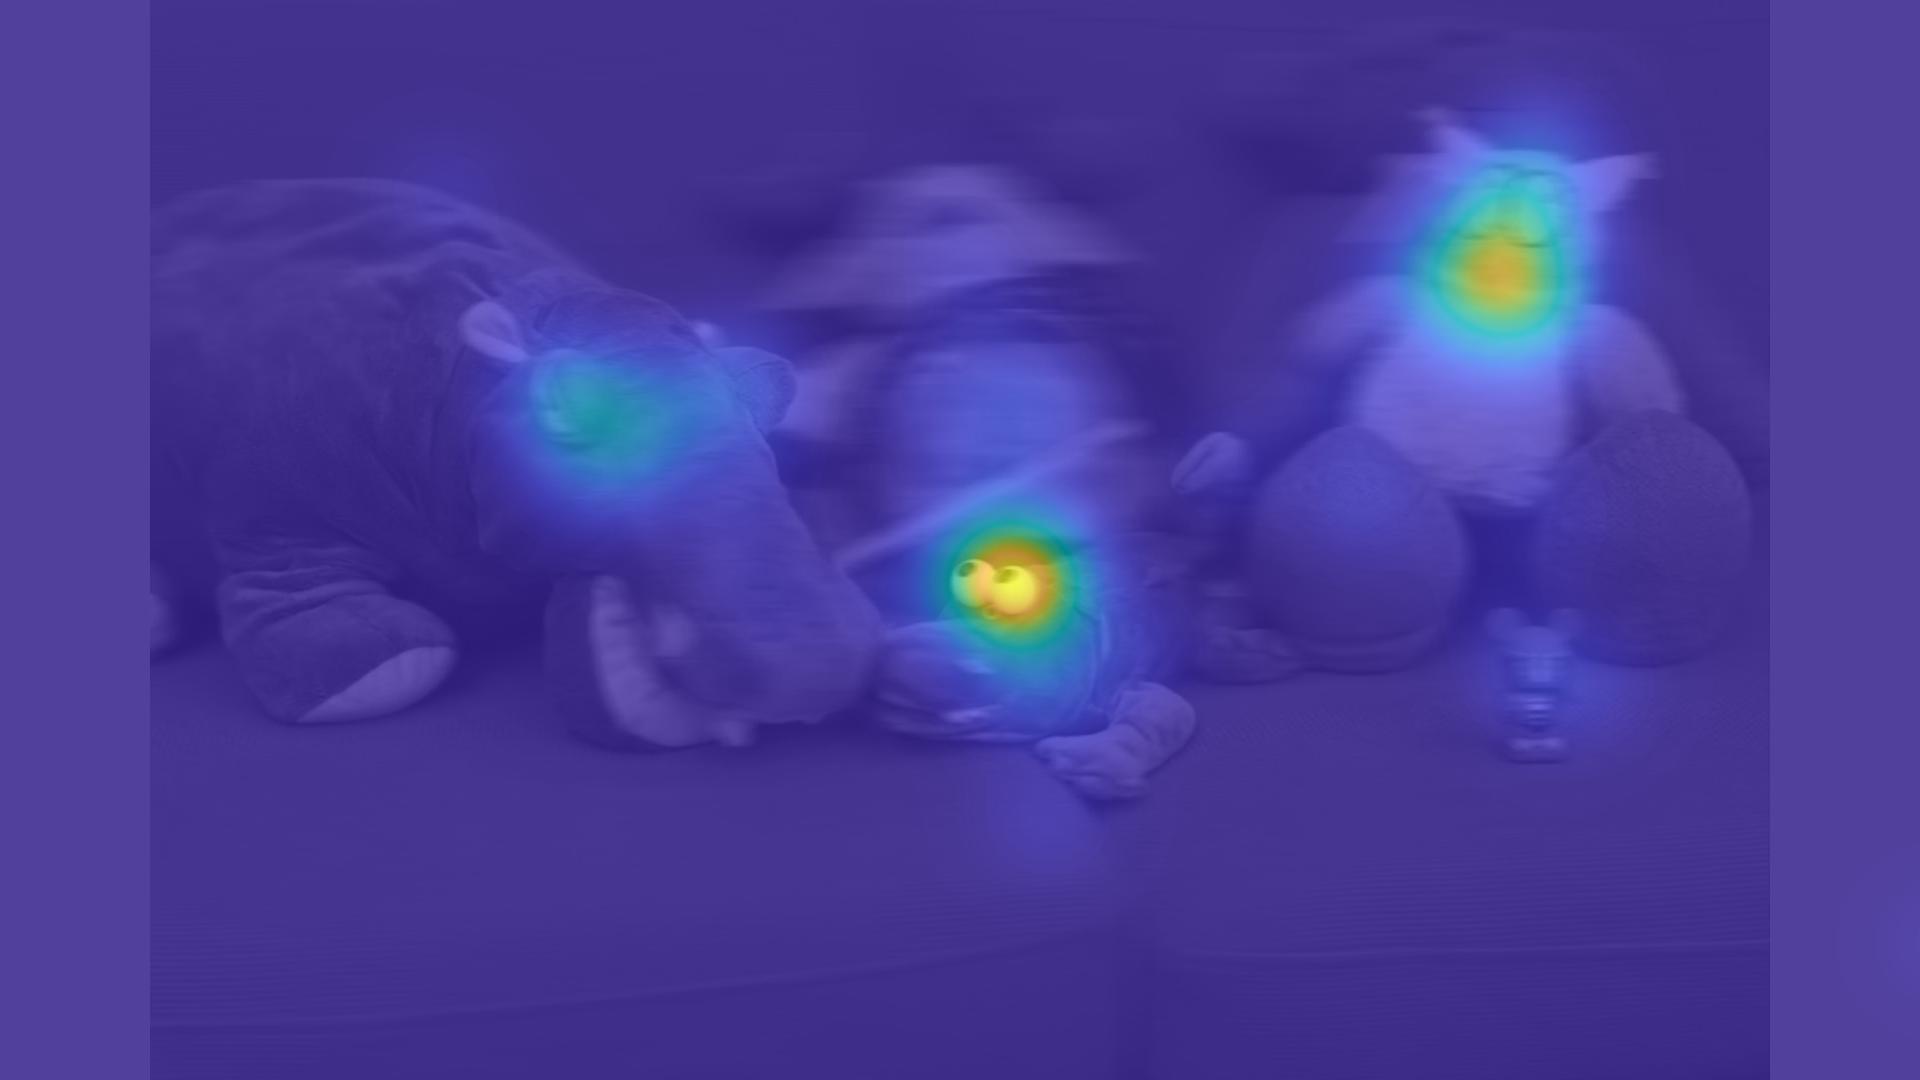
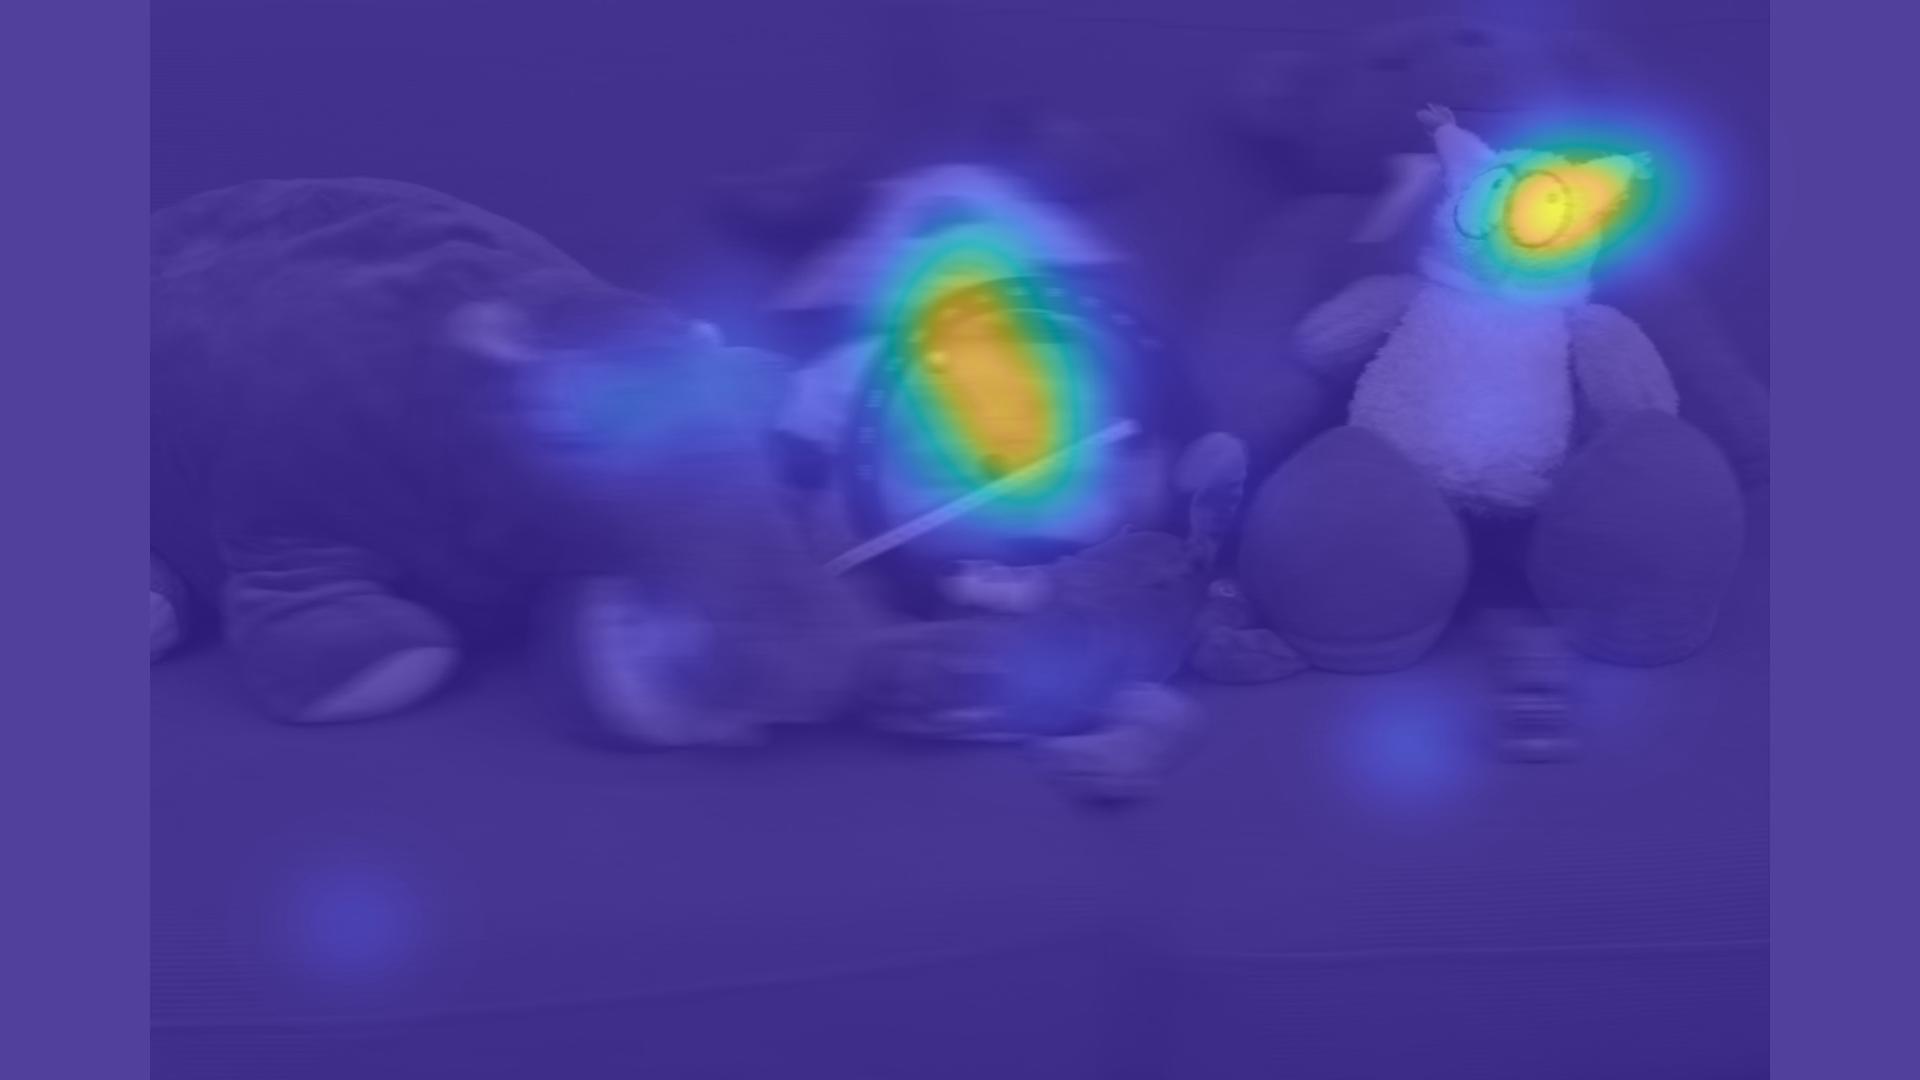
This trend of following gaze is also evident when there are a few objects with similar levels of saliency in the all-in-focus rendering. This is seen in the animal heads and the central object in the Couch light field Fig. 3 (g). In the focal-sweep Fig. 3 (h), we can see the viewers gaze following the path of focus as above but not as smoothly, rather jumping between the salient objects that are in focus in each segment.
(a)
Sideboard
RiF1


(b)
Sideboard
AiF

(c) Tarot-S RiF2
(d)
Tarot-S
AiF


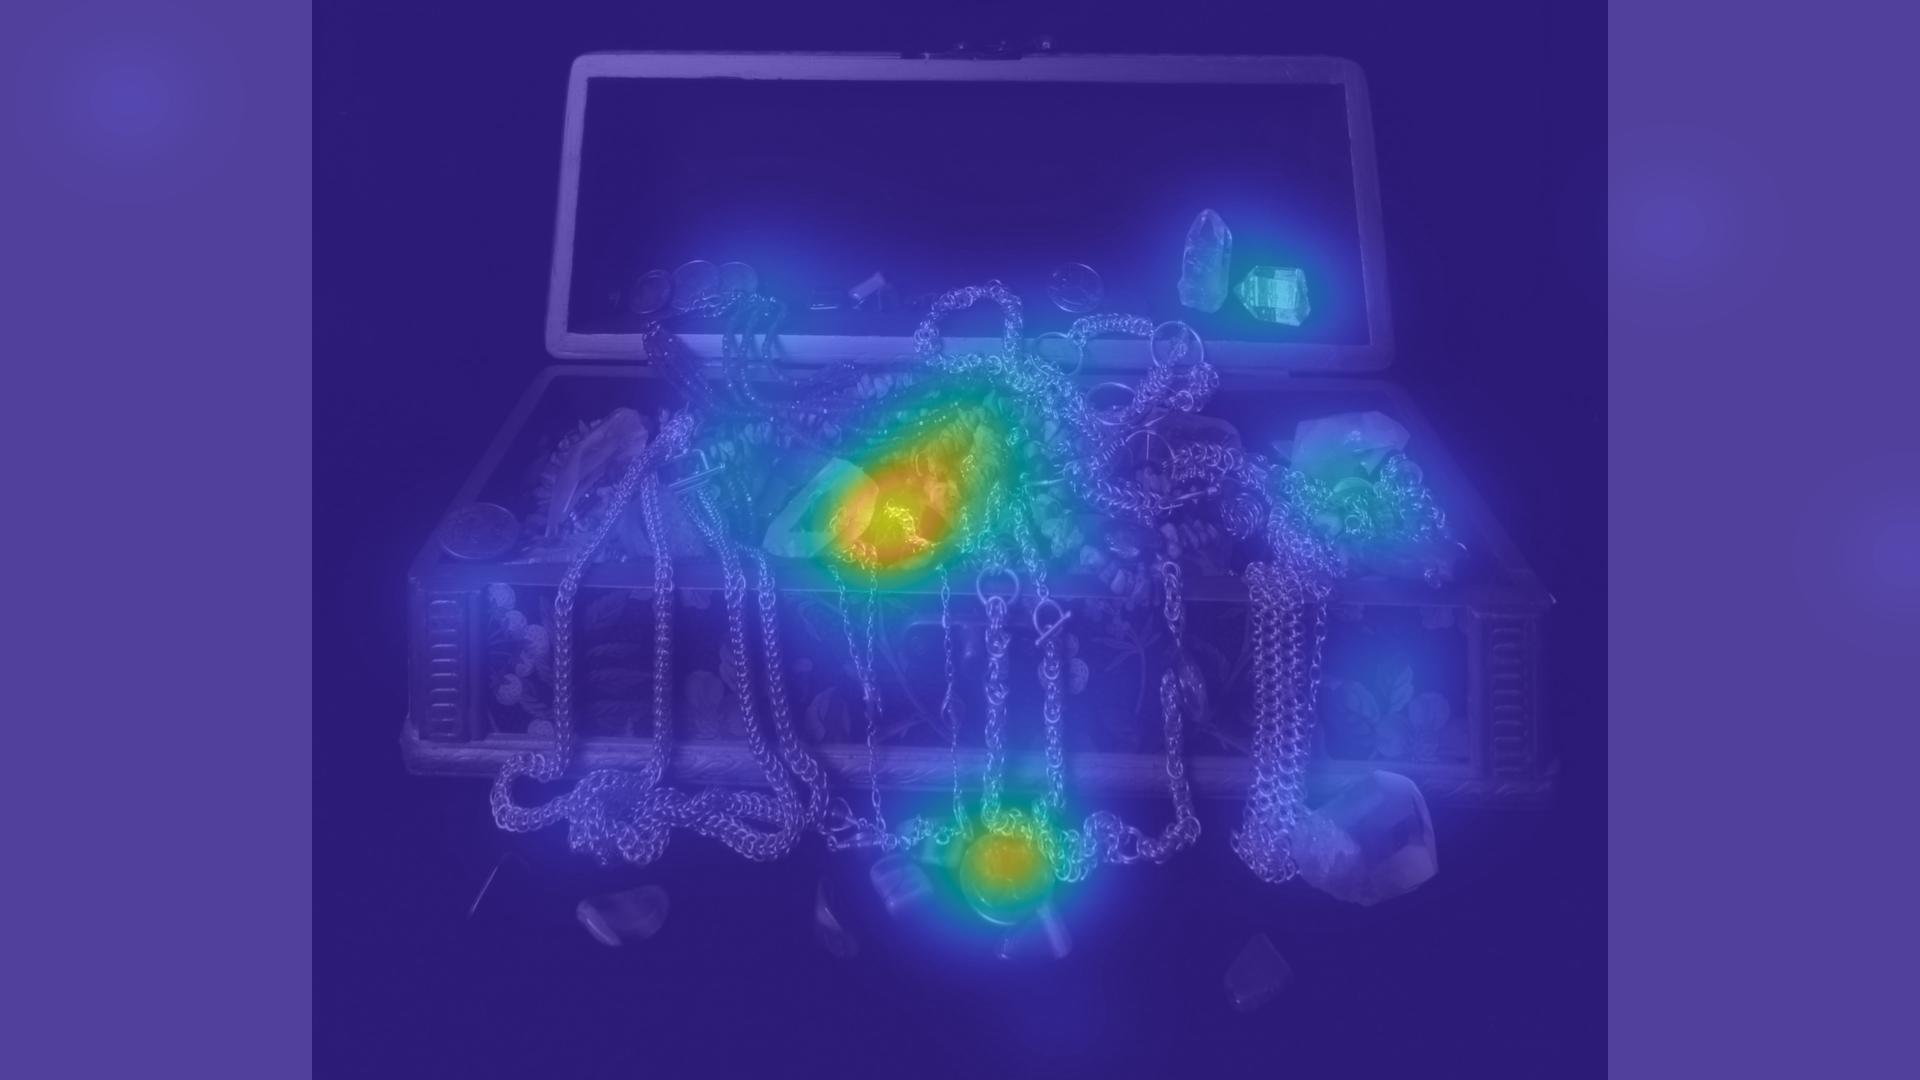
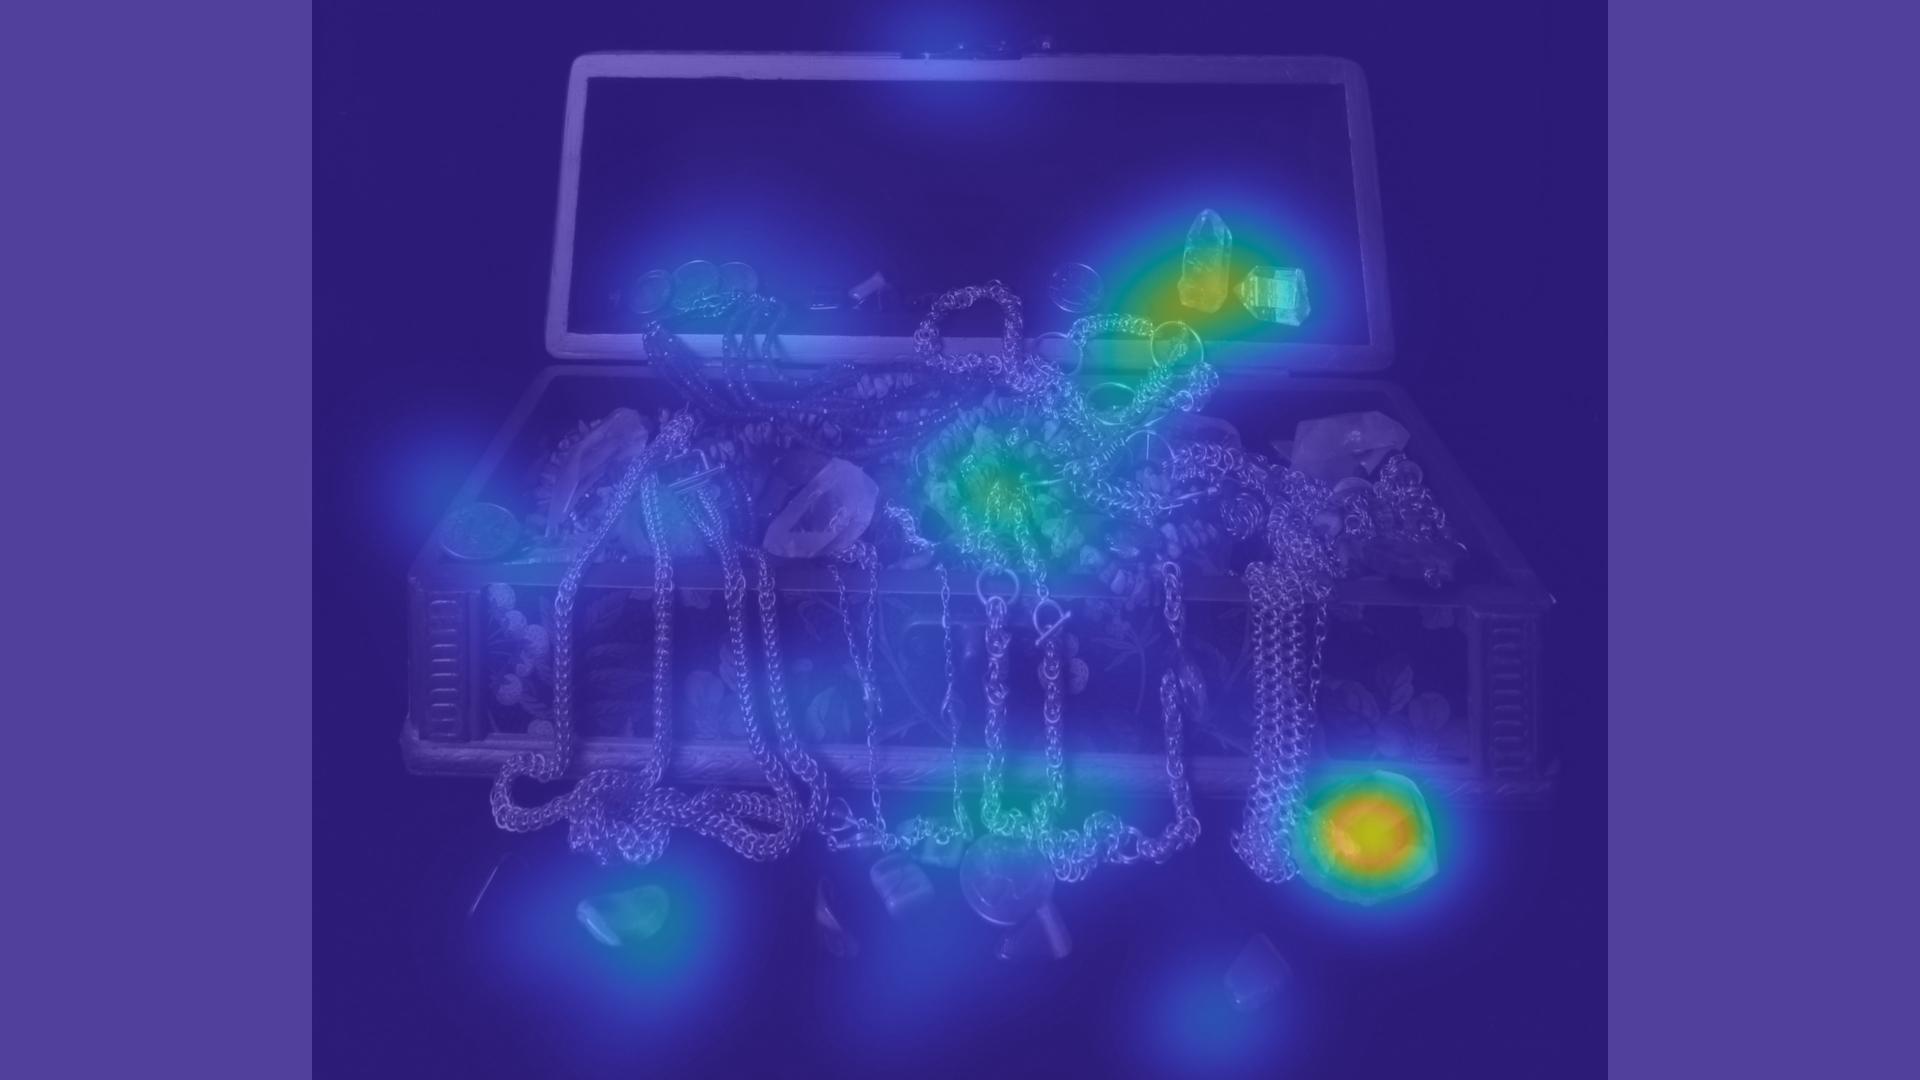
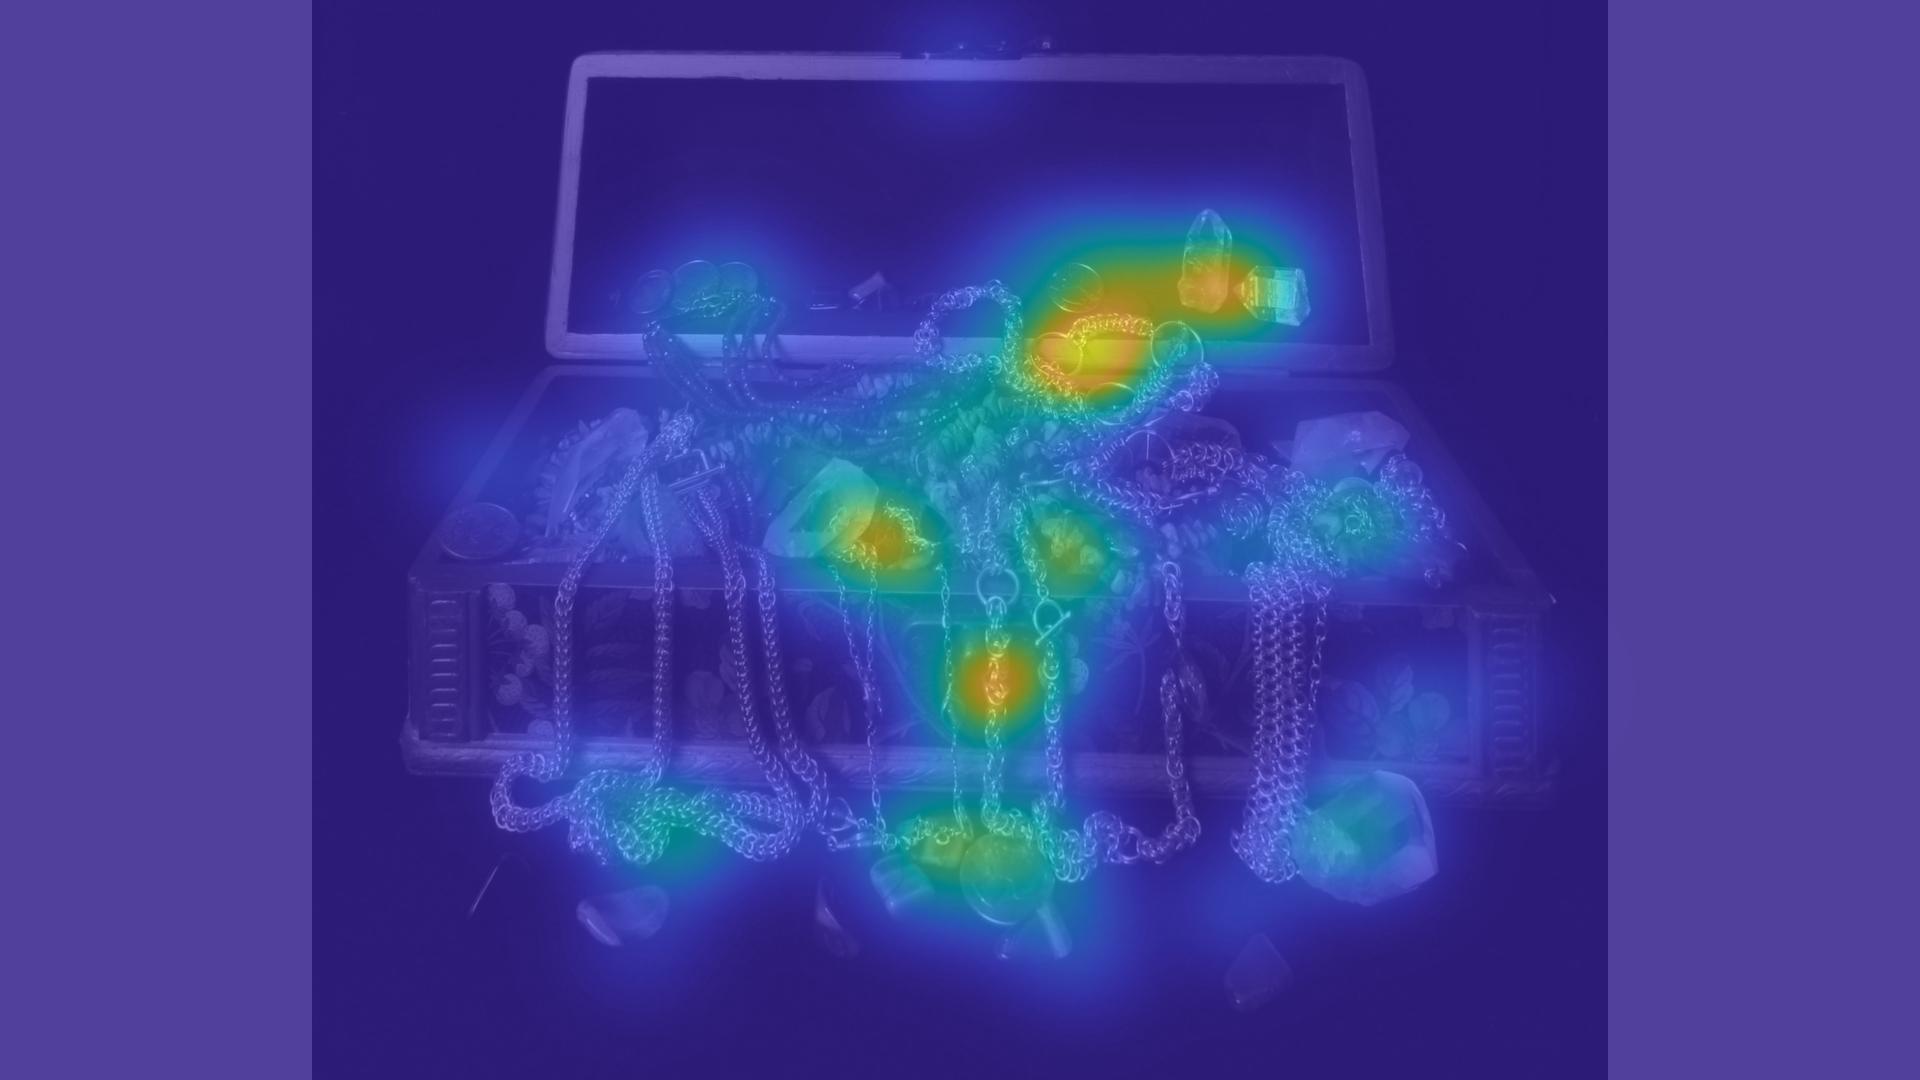
(e) Treasure AiF
(f) Treasure F2B
(g) Couch AiF
(h)
Couch
F2B
5.2 Quantitative Analysis
In this subsection, we provide a quantitative analysis to understand the relationship between human visual perception and light field rendering.
| Light fields | AiF | RiF1 | RiF2 | B2F | F2B |
|---|---|---|---|---|---|
| Boardgames | 4.06 | 3.87 | 3.81 | 3.96 | 3.82 |
| Church | 4.12 | 3.46 | 3.64 | 3.48 | 3.41 |
| Couch | 4.27 | 4.04 | 3.82 | 3.64 | 3.52 |
| Dino | 3.92 | 3.82 | 3.61 | 3.82 | 3.67 |
| Dishes | 4.19 | 4.06 | 3.26 | 3.48 | 3.50 |
| Friends | 4.55 | 4.49 | 4.45 | 4.25 | 4.45 |
| LegoKnights | 4.02 | 3.45 | 3.62 | 3.27 | 3.34 |
| Mansion | 4.12 | 4.04 | 3.67 | 3.48 | 3.24 |
| Medieval | 4.02 | 3.71 | 3.83 | 3.65 | 3.76 |
| Pens | 3.91 | 3.68 | 3.79 | 3.84 | 3.80 |
| Platonic | 3.79 | 3.40 | 3.14 | 3.53 | 3.55 |
| Sideboard | 3.79 | 3.75 | 3.81 | 3.98 | 3.90 |
| Table | 3.85 | 3.47 | 3.85 | 3.76 | 3.65 |
| Tarot-L | 4.92 | 3.46 | 4.39 | 3.44 | 3.73 |
| Tarot-S | 4.62 | 3.85 | 3.80 | 3.91 | 4.16 |
| Tower | 3.77 | 3.72 | 3.84 | 3.63 | 3.42 |
| Town | 4.02 | 4.03 | 4.06 | 4.02 | 4.02 |
| Treasure | 4.01 | 3.47 | 3.66 | 3.54 | 3.46 |
| Vespa | 3.81 | 3.84 | 3.78 | 3.45 | 3.82 |
| Vinyl | 4.18 | 3.60 | 3.87 | 4.16 | 3.77 |
| Average | 4.10 | 3.76 | 3.78 | 3.71 | 3.70 |
We infer from our qualitative analysis that viewers are likely to fixate on and follow regions in focus and that fixations of all-in-focus renderings were more dispersed. To further examine these observations, we used the calculated entropy of fixations recorded by the eye tracker to determine if participants’ fixations varied more or less for each rendering per light field.
To calculate entropy, we first created a fixation map with the same spatial resolution as the stimuli (i.e., ), which was populated with the fixations from all the users for a specific case, using Eqn. 1:
| (1) |
where is the fixation map, and are the row and column pixels, is the image stimulus, and denotes the rendering. This yields a fixation map which is sparse. The entropy values were generated for each of the five cases and reported in Table 1 using Matlab’s entropy() function, computing the probability of 1s occuring in .
The results show that all-in-focus renderings have higher entropy values on average compared to region-in-focus and focal-sweep ones, which suggests participants were more focused on average in the focal-sweep and region-in-focus cases, compared to the all-in-focus case. A two-tailed t-test confirmed that all-in-focus was significantly different than others (). The differences among the other cases were not statistically significant.
6 Conclusion
In this paper, we outline our investigation into how attention is affected by changes in focus to verify whether characteristics specific to light fields influence visual attention. From analysis of the scanpaths of light fields, we conclude that there is a difference in visual attention of static renderings of light fields when compared to focally-varying renderings. This was reinforced by examining the saliency maps of the different rendering types. We found that visual attention was often guided by focus and objects/regions at the focal plane by observing saliency maps computed on segments of the renderings over time.
The ground truth data of previous light field saliency works are segmented objects of all-in-focus renderings. We found that these do not fully capture the visual attention of light fields. Salient information not present in the all-in-focus planar rendering is often revealed by saliency maps of focal-sweep renderings. It is also apparent in saliency maps that viewers did not only fixate on objects. Furthermore, the saliency maps of segmented all-in-focus renderings were more dispersed than those of other renderings. This observation was supported by analysis of the entropy of the fixation data for each rendering where we found that all-in-focus data had highest entropy which suggested greater randomness in the data. This variation in the visual attention of different renderings shows the limitations in the use of a saliency map of only one rendering type as ground truth.
We plan to use our saliency maps as ground truth data in future work for eye fixation prediction for light fields. As they depict the likelihood of eye fixation at every point of a light field capture they have applications in this field among others such as light field rendering and compression.
References
- [Alain et al., 2019] Alain, M., Ozcinar, C., and Smolic, A. (2019). A study of light field streaming for an interactive refocusing application. In 2019 IEEE International Conference on Image Processing (ICIP), pages 3761–3765.
- [Broxton et al., 2019] Broxton, M., Busch, J., Dourgarian, J., DuVall, M., Erickson, D., Evangelakos, D., Flynn, J., Overbeck, R., Whalen, M., and Debevec, P. (2019). A low cost multi-camera array for panoramic light field video capture. In SIGGRAPH Asia 2019 Posters, SA ’19, New York, NY, USA. Association for Computing Machinery.
- [Buswell, 1935] Buswell, G. T. (1935). How people look at pictures: a study of the psychology and perception in art. Univ. Chicago Press.
- [Gortler et al., 1996] Gortler, S. J., Grzeszczuk, R., Szeliski, R., and Cohen, M. F. (1996). The lumigraph. In Proceedings of the 23rd Annual Conference on Computer Graphics and Interactive Techniques, SIGGRAPH ’96, page 43–54, New York, NY, USA. Association for Computing Machinery.
- [Greenwald, 1976] Greenwald, A. G. (1976). Within-subjects designs: To use or not to use? Psychological Bulletin, 83(2):314.
- [Honauer et al., 2016] Honauer, K., Johannsen, O., Kondermann, D., and Goldluecke, B. (2016). A dataset and evaluation methodology for depth estimation on 4D light fields. In Asian Conference on Computer Vision, pages 19–34. Springer.
- [Itti, 2005] Itti, L. (2005). Quantifying the contribution of low-level saliency to human eye movements in dynamic scenes. Visual Cognition, 12(6):1093–1123.
- [Itti et al., 1998] Itti, L., Koch, C., and Niebur, E. (1998). A model of saliency-based visual attention for rapid scene analysis. IEEE Transactions on Pattern Analysis and Machine Intelligence, 20(11):1254–1259.
- [Jones et al., 2007] Jones, A., McDowall, I., Yamada, H., Bolas, M., and Debevec, P. (2007). Rendering for an interactive 360 light field display. ACM Transactions on Graphics (TOG), 26(3):40.
- [Judd et al., 2009] Judd, T., Ehinger, K., Durand, F., and Torralba, A. (2009). Learning to predict where humans look. In IEEE International Conference on Computer Vision (ICCV).
- [Kim et al., 2013] Kim, C., Zimmer, H., Pritch, Y., Sorkine-Hornung, A., and Gross, M. H. (2013). Scene reconstruction from high spatio-angular resolution light fields. ACM Trans. Graph., 32(4):73–1.
- [Kleiner et al., 2007] Kleiner, M., Brainard, D., Pelli, D., Ingling, A., Murray, R., Broussard, C., et al. (2007). What’s new in Psychtoolbox-3. Perception, 36(S).
- [Koch and Ullman, 1987] Koch, C. and Ullman, S. (1987). Shifts in selective visual attention: towards the underlying neural circuitry. In Matters of intelligence, pages 115–141. Springer.
- [Lanman et al., 2011] Lanman, D., Wetzstein, G., Hirsch, M., Heidrich, W., and Raskar, R. (2011). Polarization fields: Dynamic light field display using multi-layer lcds. ACM Trans. Graph., 30(6):1–10.
- [Le Meur and Baccino, 2013] Le Meur, O. and Baccino, T. (2013). Methods for comparing scanpaths and saliency maps: strengths and weaknesses. Behavior research methods, 45(1):251–266.
- [Le Pendu et al., 2019] Le Pendu, M., Guillemot, C., and Smolic, A. (2019). A fourier disparity layer representation for light fields. IEEE Transactions on Image Processing, 28(11):5740–5753.
- [Lee et al., 2016] Lee, S., Jang, C., Moon, S., Cho, J., and Lee, B. (2016). Additive light field displays: Realization of augmented reality with holographic optical elements. ACM Trans. Graph., 35(4).
- [Levoy and Hanrahan, 1996] Levoy, M. and Hanrahan, P. (1996). Light field rendering. In Proceedings of the 23rd Annual Conference on Computer Graphics and Interactive Techniques, SIGGRAPH ’96, pages 31–42, New York, NY, USA. ACM.
- [Li et al., 2016] Li, N., Ye, J., Ji, Y., Ling, H., and Yu, J. (2016). Saliency detection on light field. IEEE Transactions on Pattern Analysis and Machine Intelligence, 39(8):1605–1616.
- [Matysiak et al., 2020] Matysiak, P., Grogan, M., Le Pendu, M., Alain, M., Zerman, E., and Smolic, A. (2020). High quality light field extraction and post-processing for raw plenoptic data. IEEE Transactions on Image Processing.
- [Ng et al., 2005] Ng, R., Levoy, M., Brédif, M., Duval, G., Horowitz, M., Hanrahan, P., et al. (2005). Light field photography with a hand-held plenoptic camera. Computer Science Technical Report CSTR, 2(11):1–11.
- [Overbeck et al., 2018] Overbeck, R. S., Erickson, D., Evangelakos, D., and Debevec, P. (2018). Welcome to light fields. In ACM SIGGRAPH 2018 Virtual, Augmented, and Mixed Reality, SIGGRAPH ’18, New York, NY, USA. Association for Computing Machinery.
- [Parkhurst et al., 2002] Parkhurst, D., Law, K., and Niebur, E. (2002). Modeling the role of salience in the allocation of overt visual attention. Vision research, 42(1):107–123.
- [Reinagel and Zador, 1999] Reinagel, P. and Zador, A. M. (1999). Natural scene statistics at the centre of gaze. Network: Computation in Neural Systems, 10(4):341–350.
- [Rerabek and Ebrahimi, 2016] Rerabek, M. and Ebrahimi, T. (2016). New light field image dataset. In 8th International Conference on Quality of Multimedia Experience (QoMEX).
- [Sheng et al., 2016] Sheng, H., Zhang, S., Liu, X., and Xiong, Z. (2016). Relative location for light field saliency detection. In 2016 IEEE International Conference on Acoustics, Speech and Signal Processing (ICASSP), pages 1631–1635. IEEE.
- [SR Research, 2016] SR Research (2016). Eyelink 1000. http://www.sr-research.com/eyelink1000.html. [online].
- [Vaish and Adams, 2008] Vaish, V. and Adams, A. (2008). The (new) stanford light field archive. http://lightfield.stanford.edu. [online].
- [Wang et al., 2019] Wang, T., Piao, Y., Li, X., Zhang, L., and Lu, H. (2019). Deep learning for light field saliency detection. In Proceedings of the IEEE International Conference on Computer Vision, pages 8838–8848.
- [Yarbus, 2013] Yarbus, A. L. (2013). Eye movements and vision. Springer.
- [Zhang et al., 2020] Zhang, J., Liu, Y., Zhang, S., Poppe, R., and Wang, M. (2020). Light field saliency detection with deep convolutional networks. IEEE Transactions on Image Processing, 29:4421–4434.
- [Zhang et al., 2015] Zhang, J., Wang, M., Gao, J., Wang, Y., Zhang, X., and Wu, X. (2015). Saliency detection with a deeper investigation of light field. In IJCAI, pages 2212–2218.
- [Zhang et al., 2017] Zhang, J., Wang, M., Lin, L., Yang, X., Gao, J., and Rui, Y. (2017). Saliency detection on light field: A multi-cue approach. ACM Transactions on Multimedia Computing, Communications, and Applications (TOMM), 13(3):1–22.