Investigating Coordinated ‘Social’ Targeting of High-Profile Twitter Accounts
Abstract
Following the 2016 US presidential election, there has been an increased focus on politically-motivated manipulation of mass-user behavior on social media platforms. Since a large volume of political discussion occurs on these platforms, identifying malicious activity and coordinated campaigns is essential to ensuring a robust democratic environment. Twitter has become a critical communication channel for politicians and other public figures, enabling them to maintain a direct relationship with supporters. However, the platform has been fertile ground for large-scale malicious activity. As the 2020 U.S. presidential election approaches, we have developed tools to monitor follower dynamics of some of the most prominent Twitter users, including U.S. presidential candidates. We investigate numerous, strange phenomena, such as dramatic spike and saw-tooth waveforms on follower-count charts; cohorts of user accounts which ‘circulate’, i.e., re-follow high profile accounts numerous times; and other ‘resurrected’ accounts, which have recently re-engaged on Twitter after years of non-activity. So through various analyses in these contexts, we reveal multiple, coordinated ‘social’ targeting campaigns aimed at affecting the outcomes of socially critical events through the use of networks of social automations (bots), often optimizing their social capital through ‘compromised’ accounts, which have—unbeknownst to the greater world—been hijacked.
1 Introduction
The notion of “social bots,” socio-technical systems designed to interface with social media platforms and interact with humans, is not a new one. However, as systems become more advanced, there is increased need for tools that can automatically detect these automatons as they can have very real impacts on society in the form of manipulating democracies, inciting panic during emergencies, and influencing major stock markets [1].
While a lone automaton might have a marginal effect on a social media platform, there is danger in coordinated bot accounts (bot networks or botnets), particularly if those networks are heavily embedded in public discourse. For example, a covert botnet deeply embedded in public discourse could be well positioned to direct and propagate misinformation [2]. In order to prevent such situations, it becomes increasingly important to develop tools so that, at the very least, humans and bots are able to recognize one another as they interact online.
Several works have pursued the study and identification of botnets on social media. Per the taxonomy introduced in [1], typical approaches follow network-based [3, 4, 5, 6], crowd sourcing [7], or feature-based [8, 9, 10] methods. Fully coordinated botnets have previously been found, like that of the discovery of the ‘Star Wars’ Twitter botnet [11], which demonstrated the existence and behavior patterns of systematically created bot accounts. Additionally, it is known that bot accounts are bought and sold in dark markets, presenting interesting insights into how bot accounts occasionally trade hands during their lifetimes [12].
By monitoring statistics about users’ accounts on Twitter, we have identified preliminary evidence which appear to exhibit systematic and coordinated manipulation of follower counts. This includes behavior that appears to “buff” (enhance) or “nerf” (diminish) the follower growth of accounts through superposition of both sharp, sub-second, delta-function spikes and longer ranging, sawtooth waves.
We are presently engaged in investigating these phenomena further and the hypothesis that we are witnessing “botnets” in action—realized as weaponized collections of user accounts, with activity designed to either help or hurt specific individuals’ statuses on the Twitter platform. Network approaches have been demonstrated on a case-by-case basis to be effective in identifying coordinated accounts in a recent study [13]. We can construct and analyze the relationships between groups of suspicious accounts by sampling follower lists, subsequently identifying discrete and possibly interconnected botnets.
| Username | Followers (millions) | Spikes/Day | Avg. Spike Effect | Net Spike Effect | Sawteeth/Day | Avg. Sawtooth Effect | Net Sawtooth Effect |
|---|---|---|---|---|---|---|---|
| Presidential Candidates | |||||||
| realDonaldTrump | 75.73 | 608 | 7,422 | 481,740,537 | 25 | -7,907 | -22,915,819 |
| BernieSanders | 11.41 | 411 | 98 | 3,044,831 | 147 | -361 | -5,699,337 |
| JoeBiden | 4.70 | 361 | -70 | -2,511,603 | 48 | -123 | -650,322 |
| amyklobuchar | 1.01 | 108 | -38 | -392,359 | 12 | -28 | -67,696 |
| GovBillWeld | 0.09 | 46 | -18 | -43,303 | 11 | -113 | -479,920 |
| Individuals | |||||||
| elonmusk | 32.63 | 574 | -924 | -58,088,500 | 32 | -1,053 | -3,205,884 |
| Cristiano | 83.51 | 527 | -1,156 | -63,668,866 | 25 | -1,460 | -3,229,595 |
| ArianaGrande | 72.29 | 526 | -456 | -26,673,829 | 39 | -1,619 | -4,826,954 |
| narendramodi | 54.63 | 506 | -4,679 | -95,641,313 | 26 | -5,434 | -8,564,685 |
| justinbieber | 110.71 | 492 | -144 | -8,839,477 | 47 | -2,032 | -7,782,180 |
| Organizations | |||||||
| NASA | 35.91 | 505 | -387 | -22,288,451 | 38 | -806 | -4,123,770 |
| WhiteHouse | 21.12 | 502 | -253 | -13,426,879 | 25 | -512 | -1,385,918 |
| BBCBreaking | 42.37 | 493 | -564 | -29,563,485 | 21 | -861 | -1,871,289 |
| CNN | 46.43 | 459 | -1,037 | -16,622,269 | 42 | -1,217 | -2,341,954 |
| nytimes | 45.83 | 449 | -13 | 1,183,160 | 39 | -746 | -3,399,156 |
Our observations lead us to ask about the objectives of any potentially implicated botnet’s actions. At a high level, impacts must directly target human perceptions of these accounts, or some automated aspect of Twitter’s platform, which thus might indirectly target these perceptions. However, given the short-range timescales of our observations, we focus on the hypothesis that the intended direct targets are Twitter’s platform, particularly its user-search ranking utility as well as the recommender system for suggested accounts to follow.
2 Experiments
Largely, this work falls under the umbrella of the emerging sub-field of machine behavior [2]. Operating under the hypothesis that these observations indicate coordinated action, potentially due to activities of automata, this work describes several on-going experiments to better understand the phenomena observed. This work is primarily concerned with the generative mechanisms behind theses phenomena, and thus these experiments are designed to serve as a basis to reason about such mechanisms as well as their functions.
2.1 Coordinated (Un-)Following (E1)
Initially, this work began in an attempt to measure microdynamics of Twitter-user interest in the political candidates participating in debate discourse. To observe this phenomena, a watchlist of 2020 U.S. Presidential election candidates’ Twitter accounts was constructed to monitor through Twitter’s API. Having observed striking features in these high-resolution, temporal data (shown in Fig. 1), the watchlist was maximally extended (on a free-tier set of Twitter API credentials) to encompass a breadth of high-profile accounts that are known to contribute to political discourse or otherwise have grown exceptional social followings on the platform.
2.1.1 Methods
To observe changes in high profile accounts, a cycling script was created to monitor shifts in user profiles, e.g., followers or friends. Due to API rate limitations, this script samples users approximately once per second.
2.1.2 Observations
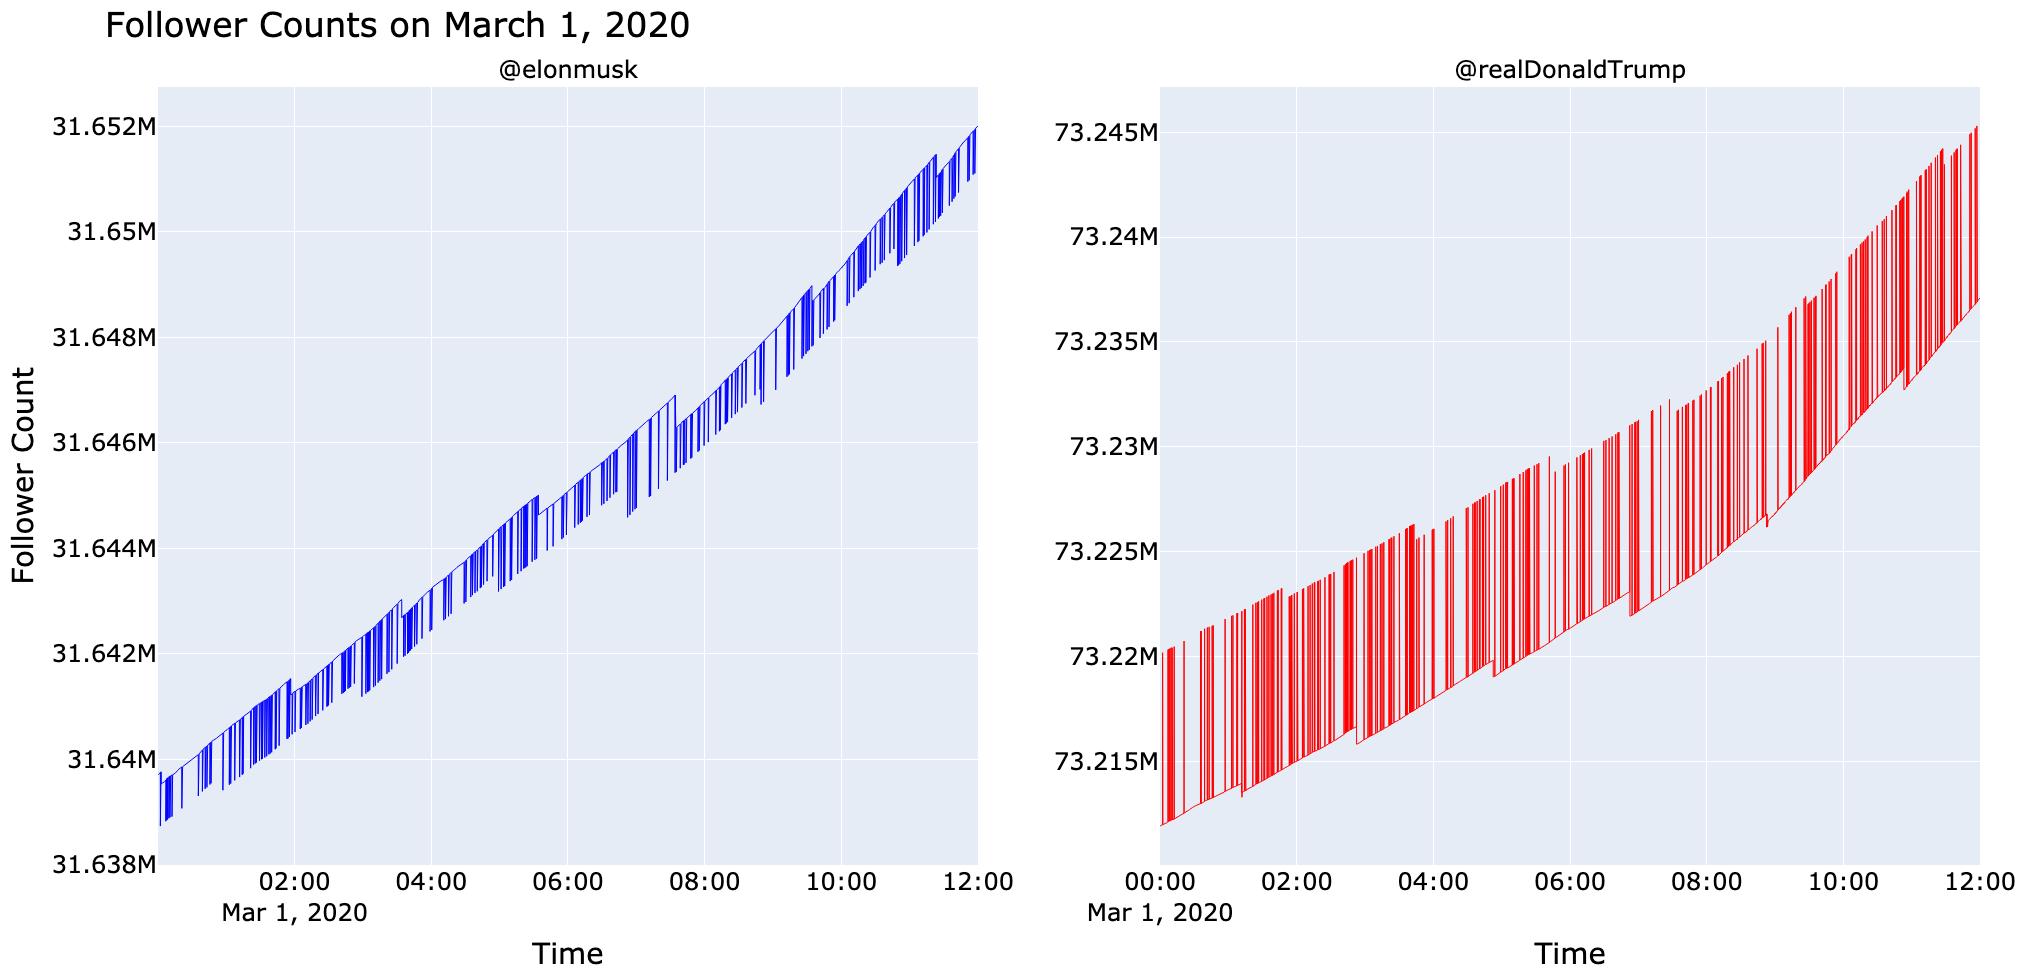
Mass-following/un-following events: Monitoring user watchlists exposes surprising dynamics on high-profile accounts. Fig. 1, exhibits follower-count data in raw form for two prominent users (@realDonaldTrump and @elonmusk). These line charts exhibit the numbers of each users’ followers at a 1-second sampling rate. In particular, Fig. 1 illustrates two elementary shapes:
-
•
Spikes: Sharp follower count increases and decreases that immediately disappear, i.e. the follower count returns to the pre-spike level.
- •
-
•
Sawteeth: Sharp follower count decreases that do not return the follower count to previous levels, i.e. a more permanent change compared to spikes.
Repeated occurrences of both of these patterns strongly suggest automated behavior, since organic follower growth or loss is unlikely to occur in such a discrete manner. For a broader cross-section of high profile users, Table 1 characterizes the quantity, size, and computed effect to users grouped by broad account types.
This high sampling rate casts question—is it possible the spikes and saw-tooth features are algorithmic in nature? Or, perhaps this is a platform side-effect caused by Twitter mass-deletions, as has been suggested in the context of deleted tweets, likes, re-tweets, and comments [14]. Unfortunately, the 1-second sampling rate was the limit of our standard-API capacity for resolution. All initial attempts to further resolve these spike and saw features by refining the sampling rate appeared to have no effect on our ability to observe any smoothness, imploring further investigation.
2.2 Circulating Accounts (E2)
Operating under the assumption that the majority of effects of the patterns observed in E1 are inorganic, one or more automated network or networks of Twitter accounts in the 106 scale, at least, must exist. These groups of accounts must also be exhibiting a specific type of behavior: repeatedly following and un-following high-profile accounts. These circulating accounts are key to understanding the phenomena of spikes and sawteeth.
2.2.1 Methods
A cycling download of the most recent 10,000 followers for each tracked account was initiated and maintained. API rate limitations resulted in an approximately 3-hour period between downloads for each user.
| Username | Circulating Followers | Circulations | Circulations/Day |
|---|---|---|---|
| Presidential Candidates | |||
| realDonaldTrump | 574,617 | 588,517 | 5,350 |
| BernieSanders | 1,725,767 | 4,938,692 | 44,897 |
| JoeBiden | 1,393,163 | 4,673,670 | 42,487 |
| amyklobuchar | 239,093 | 3,917,608 | 35,614 |
| GovBillWeld | 13,496 | 2,358,950 | 21,641 |
| Individuals | |||
| elonmusk | 1,962,410 | 2,732,585 | 24,841 |
| Cristiano | 2,460,784 | 3,905,542 | 35,504 |
| ArianaGrande | 1,757,980 | 1,968,667 | 17,896 |
| narendramodi | 1,381,224 | 2,653,892 | 24,126 |
| justinbieber | 2,223,687 | 2,855,490 | 25,959 |
| Organizations | |||
| NASA | 2,263,533 | 4,423,285 | 40,211 |
| WhiteHouse | 2,118,902 | 3,966,168 | 36,056 |
| BBCBreaking | 2,218,925 | 4,469,857 | 40,635 |
| CNN | 2,136,211 | 3,233,881 | 29,398 |
| nytimes | 2,087,851 | 4,673,142 | 42,483 |
2.2.2 Observations
Limitations of Sampling: For many accounts, the number of circulating followers found were in the 106 range, as shown in Table 2. Critically, when follower growth rates are so high that significantly more followers than 10,000 are acquired within the 3-hour window, this method fails to capture the most recent, short-period circulation activity. The much lower-than-expected circulation numbers for @realDonaldTrump are potentially a result of this limitation.
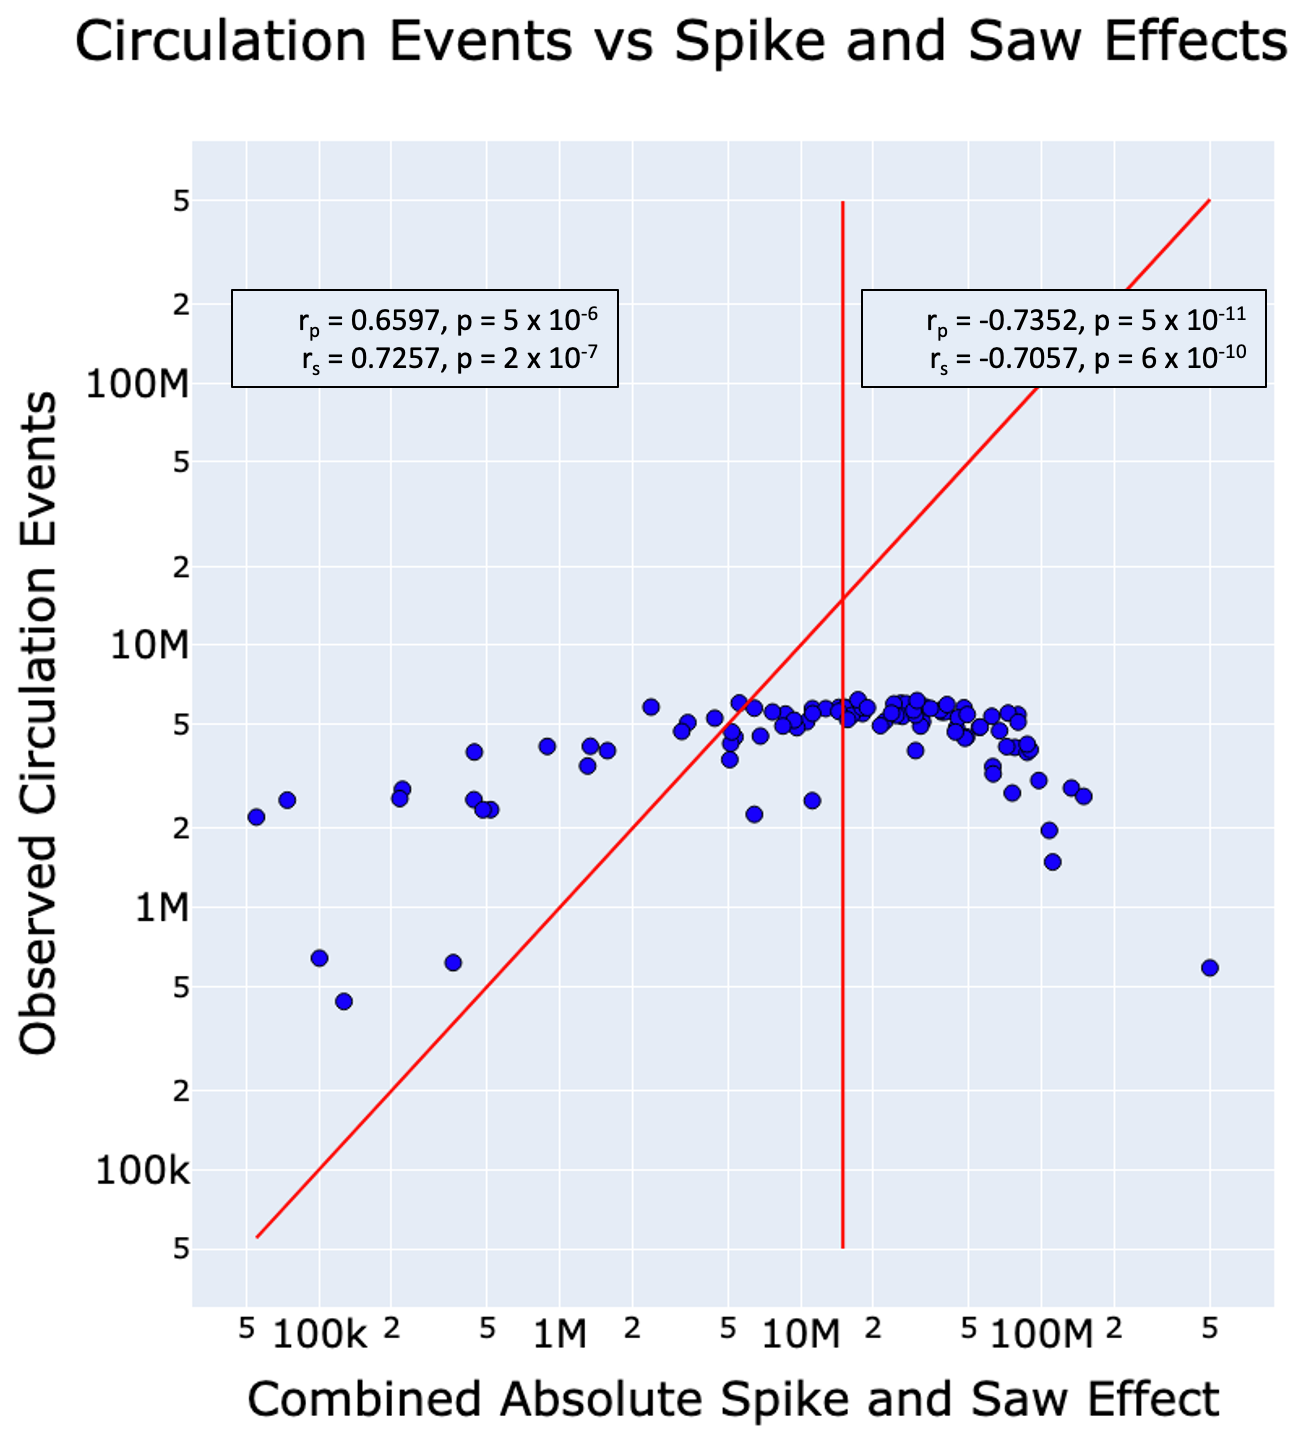
Spikes, Saws, & Circulations: Figure 3 plots observed circulation events against observed spike and saw effects, demonstrating through correlation a seemingly (concave down) functional relationship between the two. Thus, these two entirely-separately measured effects are related. The non-monotonic behavior exhibited here can potentially be interpreted as follows: for accounts with high spike and saw effects, capturing all circulations becomes a challenge (because of rapid burying rates). This is evidenced by the under-estimation which gets ‘worse’ as a falling trend in figure 3. At the other end, non-zero veracity in the ordering of follower lists (by follow time) ‘bakes in’ some over-estimation for all, but is only observable for small spike-saw effect accounts who generally receive too-few new followers to drown out this relatively marginal (by orders of magnitude) over-estimation. @realDonaldTrump is the extreme outlier at bottom right.
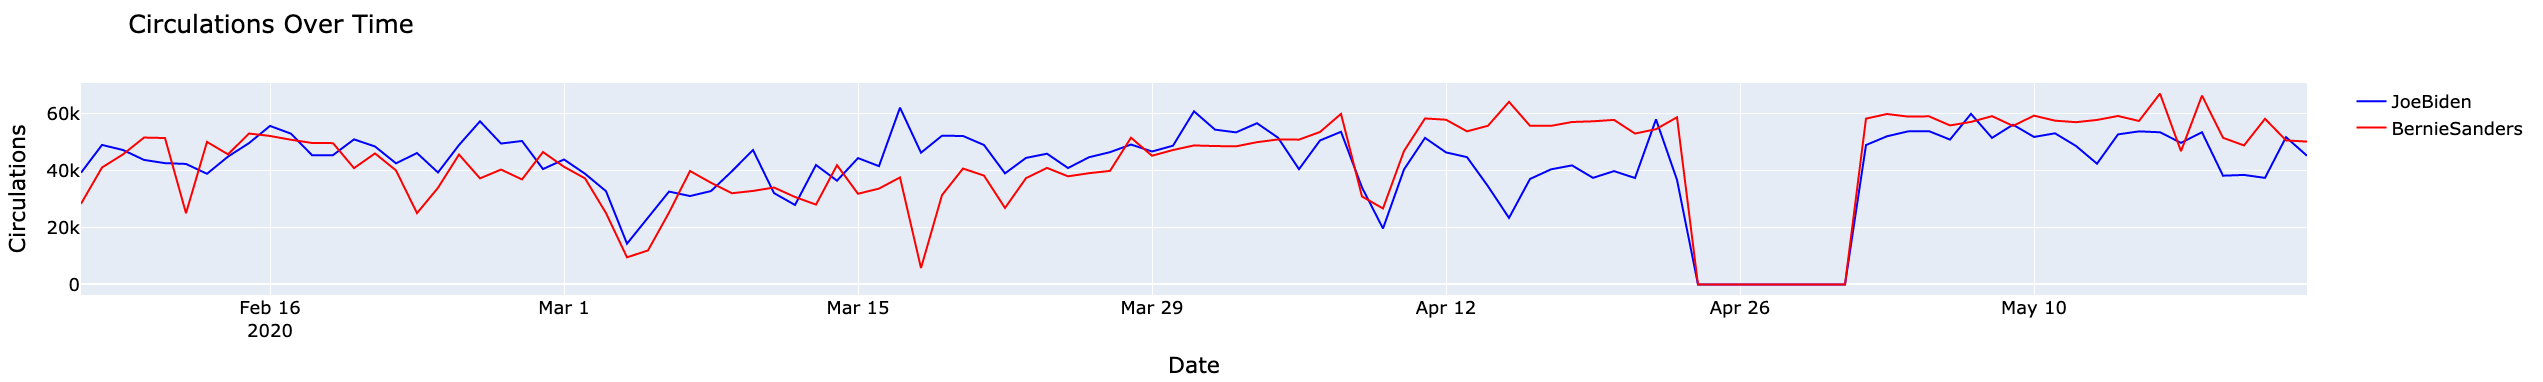
Figure 2 illustrates observed circulation activity on the final two Democratic candidates’ accounts. Despite having half the followers of @BernieSanders, circulation activity on @JoeBiden often matched or exceeded @BernieSanders’.
Inspecting follower lists revealed a further unexpected phenomenon: the abnormal abundance of “ancient” Twitter accounts among recent followers, especially among recent followers of @realDonaldTrump.
2.3 Ancient Accounts (E3)
When analyzing follower samples of high-profile accounts (see E2), a surprising proportion of the samples were of older accounts. When a Twitter users creates an account, they are assigned a unique user id (UID). UIDs have a variable number of digits, currently ranging from 2 to 19 digits, that corresponds to when an account was created. Older accounts have smaller UIDs (and thus fewer digits), whereas an account created in July 2020 will have been assigned a 19-digit UID.
Accounts with 8-or-fewer digit UIDs correspond to accounts created on or before December 2009. The fact that we are sampling follower lists of high-profile accounts—accounts that already have significant followings—it is surprising that a number of “ancient accounts” would appear at the top of these samples, thus indicating a recent following time. This has lead us to question why these “ancient accounts” are so active in recent follower samples, and what general dynamics Twitter’s oldest users exhibit.
2.3.1 Methods
In order to better understand and characterize the behaviors and dynamics of ancient accounts, a list is maintained of all ancient accounts encountered during E2’s samples. Through another sampling script, these ancient accounts are cycled over, monitoring their user timelines.
2.3.2 Observations
Magnitude of Occurrence Since beginning observation, around 2 million unique ancient accounts have appeared in the most recent 10,000 follower samples from E2. By our estimates, this is at least 2% of all of Twitter that was created prior to December 2009, and is around 6.5% of the monthly active users (MAUs) present on the platform in 2010111 https://www.statista.com/statistics/282087/number-of-monthly-active-twitter-users/, accessed August 4th, 2020. .
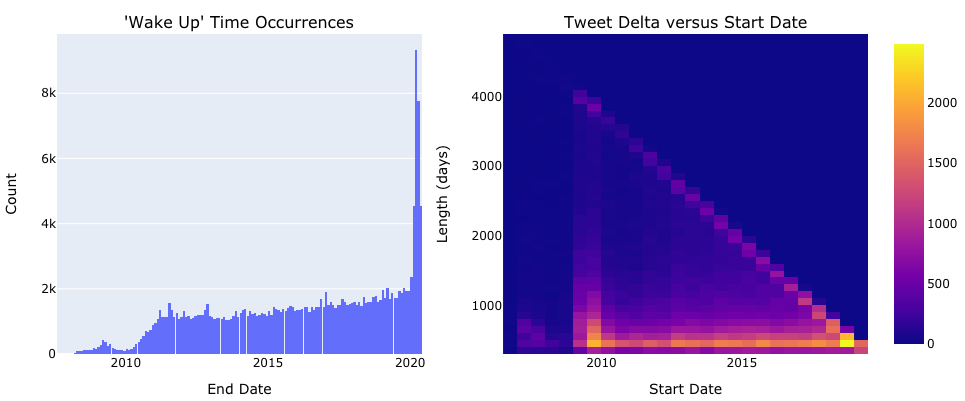
Large Gaps in Timelines To better understand the nature of the ancient accounts observed, timelines are currently monitored for all accounts with 7 or fewer digits and all 8-digit accounts following @realDonaldTrump (by-and-large one of the most dynamic user followings, as seen in E2). Of those with tweet gaps a year, many appear to have recently “re-awoken” as seen in Fig. 4.
We are compelled to ask: why did so many of these accounts recently end their multi-year gaps in their timelines? Could it be a side-effect of real-world events, perhaps of the progressing U.S. presidential primaries or the start of COVID-19 lockdown procedures? Are these numbers inorganically inflated through activated automata? It has previously been shown that some merchants that sell Twitter accounts create and hold these accounts prior to sale—sometimes upto a year even—giving accounts more credibility simply because they have been around on the platform longer [12].
2.4 High-Profile Tunneling (E4)
In light of the surprising dynamics observed in follower lists (see E2 & E3), a series of experiments were constructed to characterize what a full follower list looks like for high-profile users.
2.4.1 Methods
A recursive sampling script was constructed to “tunnel” out each follower list on our watchlist. After this process, the UIDs were gathered and hydrated into full user objects to gain more user-specific information (e.g. privacy or verification status).
2.4.2 Observations
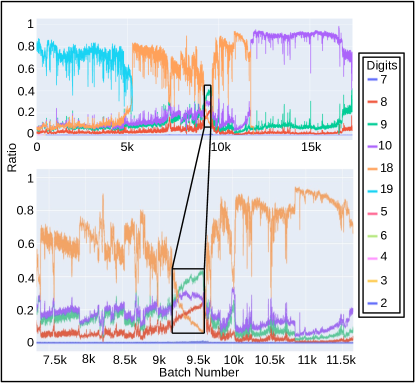
Tunnel Dynamics: Full follower lists paint an interesting portrait of the history of an account—much like rock strata in an excavation. In Fig. 5 we present what @BarackObama’s follower list looks like when followers are grouped based on the digits in their UID. By grouping followers based on a given property, one can ask questions about disproportionately concentrated cohorts of users. For us, the number of digits in a UID coarsely approximates the account’s creation date.
For example, Fig. 5 shows an odd region of @BarackObama’s following list. In a region dominated by 18-digit account creation, the dynamics briefly invert deep mid-region, with 9- and 10-digit users becoming the dominating groups. This continues for about 500 batches of 5,000 followers (around 2.5 million followers), before returning back to the average 18-digit ratio between 0.6 and 0.8.
Here we are compelled to ask: what happened to @BarackObama’s followers that caused a mass exodus of 18-digit accounts? Or did an abnormally high number of older accounts follow @BarackObama during this window? One could imagine scenarios where such an occurrence is, in fact, inorganic in nature. Perhaps a network of bot accounts embed themselves deeply on a user account’s following, for use at a later date—say, to spike back on the account or to influence long term saw-waveforms. So while we have not experimentally qualified this though any temporal, following/unfollowing associations, such a reservoir is consistent with the observation of sawteeth. Further experimentation is needed to better refine which hypotheses are more likely, and whether or not this observation is organic or inorganic in nature.
3 Discussion and Open Questions
The experiments detailed in this work are a part of a larger set of diagnostic tools actively being developed to identify anomalous and coordinated behaviors on Twitter, with an emphasis on uncovering behaviors that may be targeting high-profile, and often political, users.
Many of theses behaviors are odd. Sub-second spikes and saw-tooth follower distortions, disproportionate groupings of accounts on high-profile users, and seemingly ancient accounts that have “re-awoken” after years of inactivity are a subset of these behaviors that this work highlights to raise awareness as we gather additional observations to better disambiguate the how and the why of the behaviors recorded.
Here, we highlight some of the open questions we are actively considering:
-
1.
How can we utilize network-based methods to further pin down coordination? Previous methods have shown success in both network-based and feature-based approaches, as highlighted above. Through both friend and follower list connections, as well as the lesser known, general Twitter list connections, we seek to investigate how we may apply and develop new, similar methodologies to highlight coordination.
-
2.
What is the underlying mechanism behind the behaviors observed, particularly the spike and saw-tooth behaviors? Through both E1 and E2, there is strong evidence that some of this behavior is a result of circulating accounts. However, the exact mechanism as well as the underlying intent of this phenomenon is still an open question.
-
3.
How do these behaviors—particularly if inorganic—shape public discourse on Twitter and what effect do such behaviors have on international democracies? Questions on how algorithms affect public discourse and democracy are not new [1, 2], and this work is very interested in providing more insights into this question. In particular, we seek to engage in semantic analyses at-scale to better characterize the “chatter” suspicious accounts are engaged in, especially with the U.S. 2020 presidential election looming on the horizon.
Acknowledgments
This document is based upon work supported by the National Science Foundation under grant no. #1850014.
References
- [1] Ferrara, E., Varol, O., Davis, C., Menczer, F., and Flammini, A., 2016. “The rise of social bots”. Communications of the ACM, 59(7), pp. 96–104.
- [2] Rahwan, I., Cebrian, M., Obradovich, N., Bongard, J., Bonnefon, J.-F., Breazeal, C., Crandall, J. W., Christakis, N. A., Couzin, I. D., Jackson, M. O., Jennings, N. R., Kamar, E., Kloumann, I. M., Larochelle, H., Lazer, D., McElreath, R., Mislove, A., Parkes, D. C., Pentland, A. S., Roberts, M. E., Shariff, A., Tenenbaum, J. B., and Wellman, M., 2019. “Machine behaviour”. Nature, 568(7753), pp. 477–486.
- [3] Stein, T., Chen, E., and Mangla, K., 2011. “Facebook immune system”. In Proceedings of the 4th workshop on social network systems, pp. 1–8.
- [4] Cao, Q., Sirivianos, M., Yang, X., and Pregueiro, T., 2012. “Aiding the detection of fake accounts in large scale social online services”. In Presented as part of the 9th USENIX Symposium on Networked Systems Design and Implementation (NSDI 12), pp. 197–210.
- [5] Paradise, A., Puzis, R., and Shabtai, A., 2014. “Anti-reconnaissance tools: Detecting targeted socialbots”. IEEE Internet Computing, 18(5), pp. 11–19.
- [6] Xie, Y., Yu, F., Ke, Q., Abadi, M., Gillum, E., Vitaldevaria, K., Walter, J., Huang, J., and Mao, Z. M., 2012. “Innocent by association: early recognition of legitimate users”. In Proceedings of the 2012 ACM conference on Computer and communications security, pp. 353–364.
- [7] Wang, G., Mohanlal, M., Wilson, C., Wang, X., Metzger, M., Zheng, H., and Zhao, B. Y., 2012. “Social turing tests: Crowdsourcing sybil detection”. arXiv preprint arXiv:1205.3856.
- [8] Ratkiewicz, J., Conover, M., Meiss, M., Gonçalves, B., Patil, S., Flammini, A., and Menczer, F., 2011. “Truthy: mapping the spread of astroturf in microblog streams”. In Proceedings of the 20th international conference companion on World wide web, pp. 249–252.
- [9] Davis, C. A., Varol, O., Ferrara, E., Flammini, A., and Menczer, F., 2016. “Botornot: A system to evaluate social bots”. In Proceedings of the 25th international conference companion on world wide web, pp. 273–274.
- [10] Santia, G. C., Mujib, M. I., and Williams, J. R., 2019. “Detecting social bots on facebook in an information veracity context”. In Proceedings of the International AAAI Conference on Web and Social Media, Vol. 13, pp. 463–472.
- [11] Echeverria, J., and Zhou, S., 2017. “Discovery, retrieval, and analysis of the ‘Star Wars’ botnet in Twitter”. In Proceedings of the 2017 IEEE/ACM international conference on advances in social networks analysis and mining 2017, pp. 1–8.
- [12] Thomas, K., McCoy, D., Grier, C., Kolcz, A., and Paxson, V., 2013. “Trafficking fraudulent accounts: The role of the underground market in twitter spam and abuse”. In 22nd USENIX Security Symposium (USENIX Security 13), pp. 195–210.
- [13] Pacheco, D., Hui, P.-M., Torres-Lugo, C., Truong, B. T., Flammini, A., and Menczer, F., 2020. “Uncovering coordinated networks on social media”. arXiv preprint arXiv:2001.05658.
- [14] Minot, J. R., Arnold, M. V., Alshaabi, T., Danforth, C. M., and Dodds, P. S., 2020. “Ratioing the president: An exploration of public engagement with obama and trump on twitter”. arXiv preprint arXiv:2006.03526.