Dimensional crossover and enhanced thermoelectric efficiency
due to broken symmetry in graphene antidot lattices
Abstract
Graphene antidot lattices (GALs) are two-dimensional (2D) monolayers with periodically placed holes in otherwise pristine graphene. We investigate the electronic properties of symmetric and asymmetric GAL structures having hexagonal holes, and show that anisotropic 2D GALs can display a dimensional crossover such that effectively one-dimensional (1D) electronic structures can be realized in two-dimensions around the charge neutrality point. We investigate the transport and thermoelectric properties of these 2D GALs by using nonequilibrium Green function (NEGF) method. Dimensional crossover manifests itself as transmission plateaus, a characteristic feature of 1D systems, and enhancement of thermoelectric efficiency, where thermoelectric figure of merit, , can be as high as 0.9 at room temperature. We also study the transport properties in the presence of Anderson disorder and find that mean free paths of effectively 1D electrons of anisotropic configuration are much longer than their isotropic counterparts. We further argue that dimensional crossover due to broken symmetry and enhancement of thermoelectric efficiency can be nanostructuring strategy virtually for all 2D materials.
I INTRODUCTION
Graphene and related two-dimensional materials have revolutionized condensed-matter physics not only with the exceptional physical properties they possess, but also with the existence of seemingly infinite possibilities to tailor these physical properties through nanostructuring [1, 2, 3, 4, 5, 6, 7]. Cutting two-dimensional materials into ribbons alters their properties drastically. Unlike semimetallic 2D graphene, one-dimensional graphene ribbons are semiconducting [8, 9, 10, 11] and can have substantially enhanced thermoelectric (TE) efficiencies [12, 13, 14, 15]. Another scheme for nanostructuring is creating holes. GALs are 2D structures with periodic arrays of holes [16, 17, 5, 18]. They have a nonzero band gap, which is tunable with the geometrical parameters. Their thermal conductivity is also suppressed significantly [16, 17, 19, 20, 21, 22, 23, 24].
Enhancement of TE efficiency is an intricate problem because an efficient TE material requires to have a large Seebeck coefficient like in an insulator, high electrical conductivity like in a metal and poor thermal conduction like in a glass [25]. 2D materials have been subject of intense research in the last decade for thermoelectric applications [26, 27, 28, 29, 30, 31]. The main motivation is the fact that reduced dimensionality enhances TE efficiency [32, 33]. Another reason is the richness and power of nanostructuring possibilities. Graphene is the most impressive example. Pristine graphene’s electronic structure acquire zero band gap and electron-hole symmetry while its phononic structure yields the record thermal-conductivity value [34, 35]. A material with such properties is among the least likely ones to have good TE efficiency. Still a number of nanostructuring schemes have proven that graphene could acquire extraordinary TE efficiencies [23, 13, 19, 20, 14, 36, 37, 38, 39, 40, 41].
GALs can have high TE efficiencies [23, 19, 20, 36, 42]. It was shown that a few repetitions of the GAL unit cell are enough to open a band gap and enhance significantly in two-dimensional graphene [19]. In one-dimensional zigzag graphene nanoribbons, was predicted to have very large values due to perforation with nanopores, where the electronic quality at the edges were preserved [20, 36, 42, 21].
In this letter, we consider three different GAL structures with symmetric and asymmetric geometries and show that breaking of symmetry in 2D GAL geometry gives rise to a dimensional crossover in their electronic structure. The dimensional crossover is characterized with nondispersive bands in the transverse direction, which is associated with a plateau in the transmission spectrum. Namely, asymmetric GALs form an array of one-dimensional electron systems placed parallel to each other and show stepwise transmission spectrum for low energy carriers. As a result, thermopower, power factor and are enhanced considerably.
II SYSTEMS AND METHODS
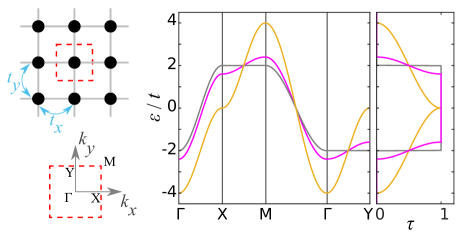
In this work, we consider hexagonal antidots and rectangular unit cells without loss of generality. The parameters defining the GALs are shown in Fig. LABEL:fig:structurea. A unit cell contains two antidots. and are the unit cell parameters (measured in terms of the carbon-carbon distance). The origin is chosen at the center of an antidot, the other antidot having distances and from the origin. The antidot size is . We consider three sizes for the unit cells (to be denoted as , and ) with symmetric and asymmetric configurations. (i.e. , , etc.) Parameters for the considered structures are tabulated in Table 1.
We use first nearest neighbor tight-binding approximation, which accurately describes the GAL structures, agreeing well with density functional theory in electronic band structures around Fermi level [17],
| (1) |
Here () is electron annihilation (creation) operator for the orbital of the th atom, is the onsite energy, eV is the electron hopping energy, and denotes the nearest neighbor atoms. for ballistic calculations and picks random values when Anderson disorder is introduced.
Transmission spectra are calculated using the nonequilibrium Green function (NEGF) methodology [43, 44]. The system is partitioned as the left electrode, the central region and the right electrode (, and ). Hence, with . For disordered systems, is nonzero only in the central region. Periodic boundary conditions are employed in the transverse direction, and the wave-vector in the transverse direction is denoted as . The retarded Green function for the central region is defined as , where is an infinitesimal positive number, and the self energy term contains contributions from the reservoirs, . The self energy due to a reservoir is obtained using , where is the free Green function for the reservoir. Tranmission spectra are obtained using the Green functions as
| (2) |
with being broadening matrices. The -space integration is carried out using 20 -points.
| 39 | 23 | 19 | 7.5 | 9.5 | |
| 39 | 23 | 19 | 11.5 | 9.5 | |
| 48 | 27 | 24 | 10 | 12.5 | |
| 48 | 27 | 24 | 13.5 | 12.5 | |
| 30 | 19 | 15 | 11 | 10 | |
| 30 | 19 | 15 | 9.5 | 10 |
Thermoelectric figure of merit is defined as
| (3) |
where is the Seebeck coefficient, is electrical conductance, () is the electronic (phononic) contribution to thermal conductance, and is temperature. The electronic coefficients are calculated using the integrals [45]
| (4) |
as , , and , where is the Fermi-Dirac distribution function and is the chemical potential. Phononic contribution to thermal conductance is obtained using Green functions as [46, 47]
| (5) |
being the Bose-Einstein distribution function, and stands for the phonon transmission spectrum. Fourth-nearest-neighbor force constant approximation is used for constructing the dynamical matrices [48, 49].
III RESULTS AND DISCUSSION
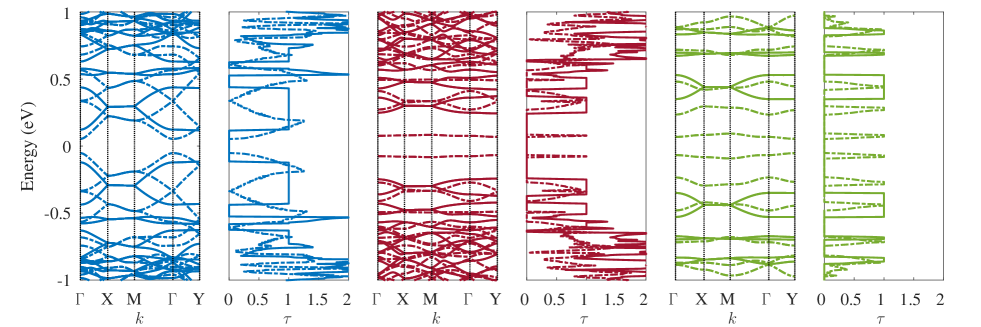
We first calculate the electronic structures and plot the band structures of symmetric and asymmetric systems for comparison. (see Fig. 2-left panels) For -GALs, the band dispersions are similar along X and XM directions around the charge neutrality point (CNP). Low energy bands are dispersive along M for both and structures. However structure has nondispersive bands along Y unlike . Such flat bands appear along Y in and structures too. Symmetric structures and have flat valence and conduction bands, which are dispersionless not only along Y but in the entire Brillouin zone. Plotting the modulus square of their wave-functions at the point, , we observe that these flat band states in and are localized states around the antidots due to dangling bonds and are not in the main focus of this study. In asymmetric GAL structures, transmission spectra show plateaus with integer values. (Fig. 2) The flat portions of the bands and transmission plateaus are related such that separation of flat bands along the Y direction is the same with the widths of plateaus for all , and structures.
The flat bands and the transmission plateaus stem from the symmetry breaking. In order to explore this feature, we consider a toy model consisting of a square lattice in the first nearest neighbor approximation, with lattice constant , and compare isotropic, anistropic (effectively 1D) and truly one-dimensional lattices. (see Fig. 3) The band dispersion for such a system is , where and are the hopping parameters in longitudinal and transverse directions, respectively. Width normalized ballistic transmission along the direction can be obtained analytically as . For the symmetric case (), the square lattice has the well-known electronic band structure and (with ). That is, is a smoothly varying function except at , where it is maximized. For the asymmetric case (), the band lies within . It is as dispersive as the symmetric one along X, but the dispersions along Y (and XM) are limited to 4. As asymmetry increases (i.e. for smaller ) we have flatter bands in the transverse direction. Correspondingly, transmission is altered with . The argument only within , and at the mid-band energies. Hence there appears a transmission plateau, , for as shown with the magenta curve in Fig. 3, where is chosen. Anisotropic transmission spectrum with the plateau is a signature of dimensional crossover. As , the square lattice is transformed to independent parallel linear chains, the band dispersion along Y and XM vanishes, and inside to yield a stepwise transmission, a characteristic of one-dimensional systems. (gray curve in Fig. 3) In strictly 1D structures, stepwise transmission is a consequence of the fact that there is no transverse direction in which the energy disperses to give rise to changes in transmission values. In effectively effectively 1D structures, on the other hand, the energy dispersion is the transverse direction is very small, if not zero, as a result the transmission is not affected from the transverse component of the wave vector and the transmission is stepwise.
The anisotropic square lattice model reveals the origins of nondispersive bands along the Y direction of asymmetric GALs and the corresponding abrupt (or sometimes stepwise) changes in the transmission spectrum, namely the effective 1D character. We note that not all the electronic bands of asymmetric GALs display an effective 1D behavior. In , and structures, the highest valence band (the lowest conduction band) is effectively 1D, whereas there exist lower (higher) valence (conduction) bands that are dispersive. We also note that, depending on the structural parameters, asymmetric GALs can also have dispersive frontier bands as well as 1D deep bands.
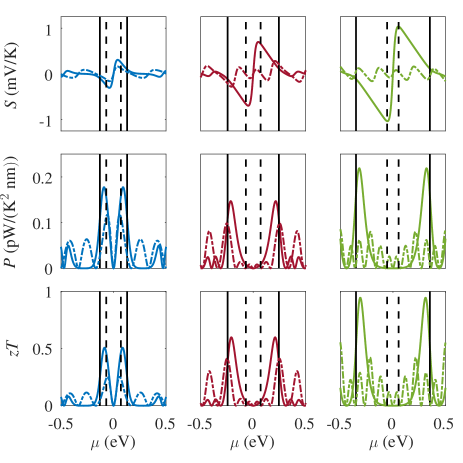
Next, we investigate the thermoelectric properties. Fig. 4 shows the Seebeck coefficient, power factor () and calculated at K. Dimensional crossover in asymmetric structures enhance the Seebeck coefficient substantially. This can be understood from the low temperature approximation [50],
| (6) |
which shows that abrupt changes in the transmission spectrum maximize . In the first row of Fig. 4, one observes that is maximized inside the band gaps, where is exponentially small. Therefore it is more convenient to compare the power factors. Fig. 4 shows that the maximum power factors are of the order , which are comparable to the efficient thermoelectric graphene based devices in literature [7]. It is also observed that asymmetric structures have significantly larger , compared to their symmetric counterparts. is maximized for close to the band edges and the maximum values are substantially larger for the asymmetric structures. The maximum values achieved at the frontier band edges are 0.5, 0.6 and 0.95 (0.2, 0.4 and 0.4) at K for , and (, and ), respectively. We should emphasize that, for asymmetric structures the maximum values are achieved at chemical potentials close to the valence and conduction band edges, whereas they are obtained at second or deeper bands for and geometries.
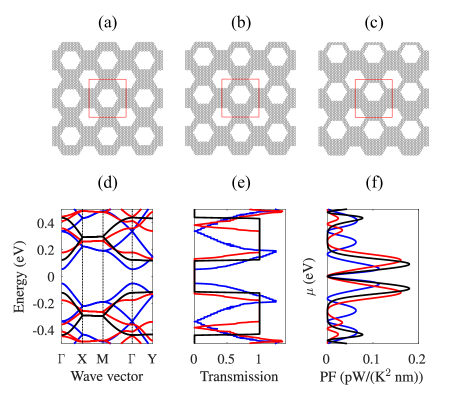
The crossover from 2D to effective 1D can be demonstrated by examining three variations of the -structure, including and . In Fig. 5a, the structures change from the symmetric configuration (Fig. 5a) as the antidot in the middle of the unit cell is shifted upwards. The amount of shift is one benzene ring in each case (Fig. 5b and 5c). When asymmetry is introduced, crossover to effective 1D behavior starts. The bands along the Y direction become less dispersive, accordingly a tranmission plateau occurs. When asymeetry increases, i.e. , the frontier bands become totally flat along Y and transmission becomes stepwise. Correspondingly, the Seebeck coefficient and hence the power factor () increases with asymmetry. (see Eqn. 6)
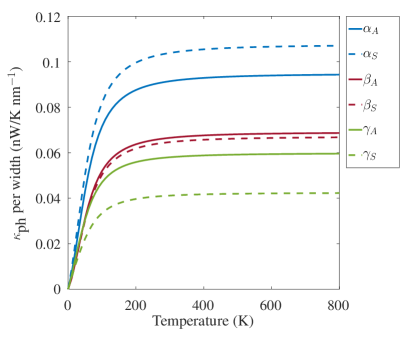
A major factor that determines is the phonon contribution the thermal conductance, which is highest for and lowest for geometries (Fig. 6). This order is in agreement with the ordering of geometries with respect to the ratio between area of antidot to that of the unit cell. Namely, the areal density of the structure is the key ingredient for determining its phonon thermal conductance. This finding is in agreement with previous studies [19]. Asymmetry affects phonon transmission, as well. There appears transmission plateaus in asymmetric structures but their effect on heat transport is less decisive compared to electrons, which is a result of bosonic statistics. The weight factor (cf. Eqn. 5) incorporates all frequencies equally at high temperatures, therefore swaps away the fine details of the phonon transmission spectrum. As a result, asymmetry reduces significantly, for , giving rise to better enhancement of TE efficiency, but of geometries are almost insensitive to symmetry breaking. On the other hand, of is lower than that of . When temperature increases from 300 K to 500 K, of asymmetric structures increase, whereas those of symmetric ones decrease. (see Table 2) This is due to narrower band gaps of symmetric structures, at which electron and hole contributions start to cancel each other for . When is further increased to 800 K, only has increased , which has the widest band gap, and reaches the value of 1.76.
| 300 K | 0.25 | 0.51 | 0.41 | 0.60 | 0.58 | 0.94 |
| 500 K | 0.16 | 0.47 | 0.41 | 0.83 | 0.25 | 1.40 |
| 800 K | 0.08 | 0.22 | 0.28 | 0.79 | 0.17 | 1.76 |
We further investigate electronic transmission in presence of Anderson type disorder with a uniform distribution of random onsite energies within , where meV ( K) is used for ensembles consisting of 100 samples. The mean free path can be obtained by using transmission spectra of an ensemble of disordered systems, where
| (7) |
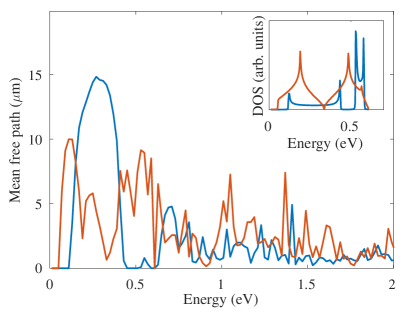
with being ensemble averaged transmission, the pristine transmission, the length of the sample, the mean free path and a constant depending on the dimensionality. Here, () is used for (), which correspond to two-dimensional isotropic (strictly one-dimensional) systems [51]. Fig. 7 shows that the mean free paths of effectvely 1D electrons at the transmission plateau are much longer than those of the symmetric configuration. This is another consequence of dimensional crossover. The distribution of mean free path of effectively 1D electrons (blue curve within the interval 0.1 eV to 0.4 eV) is very similar to the typical strictly one-dimensional systems like carbon nanotubes. (see e.g. Ref. 52) The longer mean free paths are because of the flattened density of states of effectively 1D electrons. According to Fermi’s golden rule, the inverse scattering rate is proportional with the density of states. For , DOS is much higher than that of . The 2D DOS of has a peak at around 0.2 eV, giving rise to a dip in the mean free path. The effectively 1D DOS has van Hove singularities at the band edges, a signature of one-dimensional systems, and a lower DOS value inside the transmission plateau. We calculate TE coefficients in the presence of disorder using the ensemble averaged transmission values. Using the pristine phonon transmission values, we find a value of 0.35 for a 5 m long structure at K. This value is still larger than that of the pristine symmetric structure.
IV CONCLUSIONS
We have shown that symmetry breaking can induce dimensional crossover in graphene antidot lattices and that it is possible to create parallel one-dimensional electron channels in series on a two-dimensional structure. Although it is difficult to fabricate such symmetric or asymmetric GAL structures using top-down approaches, bottom-up fabrication techniques similar to those in Ref. 6 can make it possible to realize such geometries. Dimensional crossover causes transmission plateaus, at whose edges thermopower is strongly enhanced, and is increased. Also, effectively one-dimensional electrons have much longer mean free paths than those which extend at two-dimensions. Lastly, the strategy is not limited to graphene but should be possible to use in different 2D materials as well.
ACKNOWLEDGEMENTS
We acknowledge financial support from the Flag-Era JTC 2017 project ’MECHANIC’ (funded by TÜBİTAK under Grant No. 117F480).
References
- Geim and Novoselov [2007] A. K. Geim and K. S. Novoselov, The rise of graphene, Nature Materials 6, 183 (2007).
- Wu et al. [2010] Y. H. Wu, T. Yu, and Z. X. Shen, Two-dimensional carbon nanostructures: Fundamental properties, synthesis, characterization, and potential applications, Journal of Applied Physics 108, 071301 (2010).
- Meunier et al. [2016] V. Meunier, A. G. Souza Filho, E. B. Barros, and M. S. Dresselhaus, Physical properties of low-dimensional -based carbon nanostructures, Rev. Mod. Phys. 88, 025005 (2016).
- Das et al. [2014] S. Das, M. Kim, J. won Lee, and W. Choi, Synthesis, properties, and applications of 2-d materials: A comprehensive review, Critical Reviews in Solid State and Materials Sciences 39, 231 (2014).
- Bai et al. [2010] J. Bai, X. Zhong, S. Jiang, Y. Huang, and X. Duan, Graphene nanomesh, Nature Nanotechnology 5, 190 (2010).
- Moreno et al. [2018] C. Moreno, M. Vilas-Varela, B. Kretz, A. Garcia-Lekue, M. V. Costache, M. Paradinas, M. Panighel, G. Ceballos, S. O. Valenzuela, D. Peña, and A. Mugarza, Bottom-up synthesis of multifunctional nanoporous graphene, Science 360, 199 (2018).
- Zong et al. [2020] P.-a. Zong, J. Liang, P. Zhang, C. Wan, Y. Wang, and K. Koumoto, Graphene-based thermoelectrics, ACS Applied Energy Materials 3, 2224 (2020).
- Fujita et al. [1996] M. Fujita, K. Wakabayashi, K. Nakada, and K. Kusakabe, Peculiar localized state at zigzag graphite edge, Journal of the Physical Society of Japan 65, 1920 (1996).
- Wakabayashi et al. [1999] K. Wakabayashi, M. Fujita, H. Ajiki, and M. Sigrist, Electronic and magnetic properties of nanographite ribbons, Phys. Rev. B 59, 8271 (1999).
- Son et al. [2006] Y.-W. Son, M. L. Cohen, and S. G. Louie, Energy gaps in graphene nanoribbons, Phys. Rev. Lett. 97, 216803 (2006).
- Yang et al. [2007] L. Yang, C.-H. Park, Y.-W. Son, M. L. Cohen, and S. G. Louie, Quasiparticle energies and band gaps in graphene nanoribbons, Phys. Rev. Lett. 99, 186801 (2007).
- Chen et al. [2010] Y. Chen, T. Jayasekera, A. Calzolari, K. W. Kim, and M. B. Nardelli, Thermoelectric properties of graphene nanoribbons, junctions and superlattices, Journal of Physics: Condensed Matter 22, 372202 (2010).
- Sevinçli and Cuniberti [2010] H. Sevinçli and G. Cuniberti, Enhanced thermoelectric figure of merit in edge-disordered zigzag graphene nanoribbons, Phys. Rev. B 81, 113401 (2010).
- Sevinçli et al. [2013] H. Sevinçli, C. Sevik, T. Çagin, and G. Cuniberti, A bottom-up route to enhance thermoelectric figures of merit in graphene nanoribbons, Scientific Reports 3, 1228 EP (2013), article.
- Xiao et al. [2018] H. Xiao, W. Cao, T. Ouyang, X. Xu, Y. Ding, and J. Zhong, Thermoelectric properties of graphene nanoribbons with surface roughness, Applied Physics Letters 112, 233107 (2018).
- Pedersen et al. [2008] T. G. Pedersen, C. Flindt, J. Pedersen, N. A. Mortensen, A.-P. Jauho, and K. Pedersen, Graphene antidot lattices: Designed defects and spin qubits, Phys. Rev. Lett. 100, 136804 (2008).
- Fürst et al. [2009] J. A. Fürst, J. G. Pedersen, C. Flindt, N. A. Mortensen, M. Brandbyge, T. G. Pedersen, and A.-P. Jauho, Electronic properties of graphene antidot lattices, New Journal of Physics 11, 095020 (2009).
- Sandner et al. [2015] A. Sandner, T. Preis, C. Schell, P. Giudici, K. Watanabe, T. Taniguchi, D. Weiss, and J. Eroms, Ballistic Transport in Graphene Antidot Lattices, Nano Letters 15, 8402 (2015).
- Gunst et al. [2011] T. Gunst, T. Markussen, A.-P. Jauho, and M. Brandbyge, Thermoelectric properties of finite graphene antidot lattices, Phys. Rev. B 84, 155449 (2011).
- Chang and Nikolić [2012] P.-H. Chang and B. K. Nikolić, Edge currents and nanopore arrays in zigzag and chiral graphene nanoribbons as a route toward high- thermoelectrics, Physical Review B 86, 041406 (2012).
- Yan et al. [2012] Y. Yan, Q.-F. Liang, H. Zhao, C.-Q. Wu, and B. Li, Thermoelectric properties of one-dimensional graphene antidot arrays, Physics Letters A 376, 2425 (2012).
- Mazzamuto et al. [2012] F. Mazzamuto, J. Saint-Martin, V. H. Nguyen, C. Chassat, and P. Dollfus, Thermoelectric performance of disordered and nanostructured graphene ribbons using green’s function method, Journal of Computational Electronics 11, 67 (2012).
- Karamitaheri et al. [2011] H. Karamitaheri, M. Pourfath, R. Faez, and H. Kosina, Geometrical effects on the thermoelectric properties of ballistic graphene antidot lattices, Journal of Applied Physics 110, 054506 (2011).
- Sharafat Hossain et al. [2015] M. Sharafat Hossain, F. Al-Dirini, F. M. Hossain, and E. Skafidas, High performance graphene nano-ribbon thermoelectric devices by incorporation and dimensional tuning of nanopores, Scientific Reports 5, 11297 EP (2015), article.
- Slack [1995] G. A. Slack, in CRC Handbook of Thermoelectrics, edited by D. M. Rowe (CRC Press, Boca Raton, 1995).
- Dollfus et al. [2015a] P. Dollfus, V. H. Nguyen, and J. Saint-Martin, Thermoelectric effects in graphene nanostructures, Journal of Physics: Condensed Matter 27, 133204 (2015a).
- Chen et al. [2015] K.-X. Chen, X.-M. Wang, D.-C. Mo, and S.-S. Lyu, Thermoelectric properties of transition metal dichalcogenides: From monolayers to nanotubes, The Journal of Physical Chemistry C 119, 26706 (2015).
- Adessi et al. [2017] C. Adessi, S. Thebaud, R. Bouzerar, and G. Bouzerar, First principle investigation on thermoelectric properties of transition metal dichalcogenides: Beyond the rigid band model, The Journal of Physical Chemistry C 121, 12577 (2017).
- Özbal et al. [2019] G. Özbal, R. T. Senger, C. Sevik, and H. Sevinçli, Ballistic thermoelectric properties of monolayer semiconducting transition metal dichalcogenides and oxides, Physical Review B 100, 085415 (2019).
- Li et al. [2020] D. Li, Y. Gong, Y. Chen, J. Lin, Q. Khan, Y. Zhang, Y. Li, H. Zhang, and H. Xie, Recent progress of two-dimensional thermoelectric materials, Nano-Micro Letters 12, 36 (2020).
- Kanahashi et al. [2020] K. Kanahashi, J. Pu, and T. Takenobu, 2d materials for large-area flexible thermoelectric devices, Advanced Energy Materials 10, 1902842 (2020).
- Hicks and Dresselhaus [1993a] L. D. Hicks and M. S. Dresselhaus, Effect of quantum-well structures on the thermoelectric figure of merit, Physical Review B 47, 12727 (1993a).
- Hicks and Dresselhaus [1993b] L. D. Hicks and M. S. Dresselhaus, Thermoelectric figure of merit of a one-dimensional conductor, Physical Review B 47, 16631 (1993b).
- Castro Neto et al. [2009] A. H. Castro Neto, F. Guinea, N. M. R. Peres, K. S. Novoselov, and A. K. Geim, The electronic properties of graphene, Rev. Mod. Phys. 81, 109 (2009).
- Balandin et al. [2008] A. A. Balandin, S. Ghosh, W. Bao, I. Calizo, D. Teweldebrhan, F. Miao, and C. N. Lau, Superior thermal conductivity of single-layer graphene, Nano Letters 8, 902 (2008).
- Chang et al. [2014] P.-H. Chang, M. S. Bahramy, N. Nagaosa, and B. K. Nikolic, Giant thermoelectric effect in graphene-based topological insulators with heavy adatoms and nanopores, Nano Letters 14, 3779 (2014).
- Hung Nguyen et al. [2014] V. Hung Nguyen, M. C. Nguyen, H.-V. Nguyen, J. Saint-Martin, and P. Dollfus, Enhanced thermoelectric figure of merit in vertical graphene junctions, Applied Physics Letters 105, 133105 (2014).
- Dollfus et al. [2015b] P. Dollfus, V. Hung Nguyen, and J. Saint-Martin, Thermoelectric effects in graphene nanostructures, Journal of Physics: Condensed Matter 27, 133204 (2015b).
- Rocha et al. [2011] C. G. Rocha, M. H. Rümmeli, I. Ibrahim, H. Sevincli, F. Börrnert, J. Kunstmann, A. Bachmatiuk, M. Pötschke, W. Li, S. A. M. Makharza, S. Roche, B. Büchner, and G. Cuniberti, Tailoring the physical properties of graphene, in Graphene Synthesis and Applications (CRC Press: Boca Raton, FL, USA, 2011) pp. 1–26.
- Xu et al. [2014] Y. Xu, Z. Li, and W. Duan, Thermal and Thermoelectric Properties of Graphene, Small 10, 2182 (2014).
- Tran et al. [2017] V.-T. Tran, J. Saint-Martin, P. Dollfus, and S. Volz, Optimizing the thermoelectric performance of graphene nano-ribbons without degrading the electronic properties, Scientific Reports 7, 2313 (2017).
- Sadeghi et al. [2015] H. Sadeghi, S. Sangtarash, and C. J. Lambert, Enhancing the thermoelectric figure of merit in engineered graphene nanoribbons, Beilstein Journal of Nanotechnology 6, 1176 (2015).
- Datta [1997] S. Datta, Electronic Transport in Mesoscopic Systems (Cambridge University Press, Cambridge, UK; New York, 1997).
- Ryndyk [2015] D. Ryndyk, Theory of Quantum Transport at Nanoscale: An Introduction (Springer, 2015).
- Sivan and Imry [1986] U. Sivan and Y. Imry, Multichannel Landauer formula for thermoelectric transport with application to thermopower near the mobility edge, Physical Review B 33, 551 (1986).
- Rego and Kirczenow [1998] L. G. C. Rego and G. Kirczenow, Quantized thermal conductance of dielectric quantum wires, Phys. Rev. Lett. 81, 232 (1998).
- Sevinçli et al. [2019] H. Sevinçli, S. Roche, G. Cuniberti, M. Brandbyge, R. Gutierrez, and L. M. Sandonas, Green function, quasi-classical langevin and kubo–greenwood methods in quantum thermal transport, Journal of Physics: Condensed Matter 31, 273003 (2019).
- Saito et al. [1998] R. Saito, G. Dresselhaus, and M. S. Dresselhaus, Physical Properties of Carbon Nanotubes (Imperial College Press, London, 1998).
- Zimmermann et al. [2008] J. Zimmermann, P. Pavone, and G. Cuniberti, Vibrational modes and low-temperature thermal properties of graphene and carbon nanotubes: Minimal force-constant model, Phys. Rev. B 78, 045410 (2008).
- Cutler and Mott [1969] M. Cutler and N. F. Mott, Observation of anderson localization in an electron gas, Phys. Rev. 181, 1336 (1969).
- Jeong et al. [2010] C. Jeong, R. Kim, M. Luisier, S. Datta, and M. Lundstrom, On landauer versus boltzmann and full band versus effective mass evaluation of thermoelectric transport coefficients, Journal of Applied Physics 107, 023707 (2010).
- Triozon et al. [2004] F. Triozon, S. Roche, A. Rubio, and D. Mayou, Electrical transport in carbon nanotubes: Role of disorder and helical symmetries, Phys. Rev. B 69, 121410 (2004).