Quenching timescales of dwarf satellites around Milky Way-mass hosts
Abstract
Observations of the low-mass satellites in the Local Group have shown high fractions of gas-poor, quiescent galaxies relative to isolated dwarfs, implying that the host halo environment plays an important role in the quenching of dwarf galaxies. In this work, we present measurements of the quenched fractions and quenching timescales of dwarf satellite galaxies in the DC Justice League suite of 4 high-resolution cosmological zoom-in simulations of Milky Way-mass halos. We show that these simulations accurately reproduce the satellite luminosity functions of observed nearby galaxies, as well as the variation in satellite quenched fractions from to . We then trace the histories of satellite galaxies back to , and find that many satellites with quench within Gyr of infall into the host halo, while others in the same mass range remain star-forming for as long as Gyr. We show that this scatter can be explained by the satellite’s gas mass and the ram pressure it feels at infall. Finally, we identify a characteristic stellar mass scale of above which infalling satellites are largely resistant to rapid environmental quenching.
1 Introduction
The shallow potentials of dwarf galaxies make them uniquely sensitive laboratories for understanding the physics of galaxy formation. In particular, their sensitivity to their environment makes dwarfs useful in studying the quenching of star formation. Observations show that nearly all Local Group (LG) satellites with are quenched (Wetzel et al., 2015b; Weisz et al., 2015), while isolated dwarfs are not (Geha et al., 2012). This dichotomy is supported by observations of the gas content of LG dwarfs, with atomic hydrogen (HI) undetected in all satellites within of their host (Grcevich & Putman, 2009; Spekkens et al., 2014). While quenching may act differently outside of the LG (see Geha et al., 2017), these observations firmly establish that the halo environment of a massive LG galaxy can greatly alter the star-formation of its dwarf satellites.
The rapid removal of cold disk gas by ram pressure has traditionally been seen as the dominant quenching mechanism, and has been shown to quench infalling satellites in many simulations (e.g. Murakami & Babul, 1999; Mayer et al., 2006; Slater & Bell, 2014; Bahé & McCarthy, 2015; Kazantzidis et al., 2017; Simpson et al., 2018). Stellar feedback may contribute to this process, both by increasing the efficiency of stripping by expelling and heating central gas (Bahé & McCarthy, 2015; Kazantzidis et al., 2017) and by reducing the central satellite mass and therefore reducing its potential (Zolotov et al., 2012). Tidal stripping provides another mechanism by which the satellite potential may be reduced, in addition to driving gas loss (Mayer et al., 2006). Additionally, at higher satellite masses, the suppressed gas accretion from cosmological inflows due to the presence of a massive halo may be the dominant mechanism quenching satellites (McGee et al., 2014; Wheeler et al., 2014), though on longer timescales. While the effects of these individual processes are well documented, it remains unclear how they conspire to quench dwarf satellites across different mass scales and environments.
A fruitful metric for disentangling the roles of these various quenching processes is the timescale on which quenching occurs. Therefore, many authors have estimated the quenching timescales necessary to reproduce the high quenched fractions observed in the LG. The simplest statistical models assume that quenching occurs some “delay time” after the satellite’s accretion into the virialized volume of host halo. For low-mass satellites (), the LG quenched fractions are high (), and can only be reproduced if these delay times are small, on the order of – Gyr (Slater & Bell, 2014; Fillingham et al., 2015; Wetzel et al., 2015b). Expanding these models, Weisz et al. (2015) have used HST imaging to derive star formation histories (SFHs) and quenching times for 38 LG dwarfs. Combining these results with estimates of infall times determined via abundance-matching with simulations, the authors found that many low-mass LG satellites quench prior to infall. More recently, Fillingham et al. (2019) have combined these SFHs with infall times determined from Gaia proper motions, and found results for low-mass satellites () generally consistent with the – Gyr timescales inferred from the quenched fractions.
The rapid, – Gyr quenching timescales for low-mass satellites suggest the removal of satellite gas by ram-pressure and tidal stripping, rather than simply by gas consumption in the absence of accretion. In the latter case, quenching is expected to occur on the cold gas depletion timescale, which is typically much longer than Gyr for star-forming dwarf galaxies (Huang et al., 2012; Fillingham et al., 2015). The rapid quenching timescales for low-mass satellites have been reproduced in the Auriga suite of cosmological simulations, and ram pressure appears to be the dominant quenching mechanism in these cases (Simpson et al., 2018). However, ram pressure alone may not be able to quench satellites on these rapid timescales (Emerick et al., 2016), and may require the aid of stellar feedback, outflows, and continued gas consumption due to star formation. For more massive satellites, in which ram pressure is likely inefficient at removing gas, observational estimates suggest much longer quenching timescales (), more consistent with the gas depletion timescales expected for quenching driven primarily by a lack of accretion (Wetzel et al., 2013; Wheeler et al., 2014; Phillips et al., 2015). However, even at these higher masses, satellite quenching may still be affected by ram-pressure stripping (Bahé & McCarthy, 2015) and stellar feedback-driven outflows (McGee et al., 2014). Therefore, while the quenching timescales for LG satellites are a key constraint on quenching processes, determining the relative roles of different quenching processes requires combining timescale data with further analysis of the satellites.
At present, most studies of the quenching timescale are observational in nature, and they use simulations and abundance-matching techniques only to constrain the infall times of LG dwarfs (e.g. Wheeler et al., 2014; Weisz et al., 2015; Fillingham et al., 2019). Such observations are limited by uncertainties in quenching and infall times, the number of observable satellites, and an inability to observe the galaxy at the time of infall. Full hydrodynamic simulations can aid in the interpretation of observations by allowing for more precise measurements of quenching and infall times and the direct measurement of various satellite properties during their accretion, such as ram-pressure stripping (Simpson et al., 2018) and morphological transformation (Kazantzidis et al., 2017). Such work can also be combined with a broader analysis of satellite properties in simulated galaxies, such as their SFHs (Wetzel et al., 2016; Garrison-Kimmel et al., 2019; Digby et al., 2019), radial distribution (Garrison-Kimmel et al., 2017; Richings et al., 2020; Samuel et al., 2020), velocity alignment (Riley et al., 2019), velocity dispersion (Buck et al., 2019), and kinematics (Brooks & Zolotov, 2014) to produce a more complete picture of host-satellite interaction. Together, these results paint a picture in which interactions between the satellite and the host galaxy’s circumgalactic medium and gravitational potential are responsible for not only shaping the satellite’s SFH but also their structure, even to the point of disruption. Nevertheless, many of the simulations that have been used to analyze satellite quenching achieve high resolution only by focusing on individual satellites (e.g. Mayer et al., 2006; Emerick et al., 2016; Kazantzidis et al., 2017), and others that simulate larger cosmological volumes must do so at the cost of resolution (e.g. Bahé & McCarthy, 2015).
| Simulation | (AB mag) | aaStellar mass derived from the Johnson-Cousins -band assuming a mass-to-light ratio of 1. | bbStellar mass calculated directly from the simulation. | sSFR (yr-1)ccAverage rate of star formation over the past 100 Myr divided by the actual stellar mass of the galaxy. | |||
|---|---|---|---|---|---|---|---|
| Sandra | 2.7 ×10^12 | 432 | 1.4 ×10^10 | -23.1 | 1.2 ×10^11 | 1.9 ×10^11 | 8.3×10^-11 |
| Ruth | 1.3 ×10^12 | 340 | 1.9 ×10^10 | -22.2 | 5.3 ×10^10 | 1.0×10^11 | 5.3×10^-11 |
| Sonia | 1.2 ×10^12 | 333 | 2.2 ×10^10 | -21.9 | 3.8 ×10^10 | 9.0×10^10 | 3.1×10^-11 |
| Elena | 8.3 ×10^11 | 293 | 4.6 ×10^8 | -22.2 | 5.2 ×10^10 | 9.0 ×10^10 | 6.4×10^-11 |
Simulating satellites within the larger host environment is critical for facilitating comparisons to observations, and high resolution is important for modeling quenching across the full range of dwarf satellite masses. Therefore, we analyze here the DC Justice League suite of simulations: four cosmological zoom-in simulations of Milky Way-mass galaxies, run at sufficiently high resolution that all classical dwarf galaxies are resolved with at least 50 star particles. This “near-mint” resolution is comparable to that of the NIHAO ultra high-resolution simulations (Buck et al., 2019), and the central halos contain over a million dark matter particles and between 34 and 94 million total particles. Simpson et al. (2018) similarly measured the quenching timescales of dwarf satellites around Milky Way-mass galaxies. They found a strong trend in the quenched fraction versus stellar mass, with a transition threshold between primarily quenched to primarily star-forming of . Below this mass threshold, most galaxies quenched on timescales Gyr and ram-pressure stripping was ubiquitous. While Simpson et al. (2018) includes a larger sample of host galaxies than that presented here, we provide higher resolution (we note, however, that Simpson et al. (2018) does show convergence of the quenched fraction vs. stellar mass to resolutions similar to ours.). Unlike the smoothed particle hydrodynamic code here, that paper uses a moving-mesh code, AREPO (Springel, 2010), designed to model shocks and hydrodynamic instabilities with high fidelity. We also model stellar feedback through the locally-dependent subgrid blastwave prescription as opposed to a phenomenological wind model, and we allow for the natural formation of a multiphase ISM, rather than employ a two-phase subgrid model for the ISM. The latter is particularly important for reproducing the resistance of the cold molecular ISM to ram-pressure stripping (Tonnesen & Bryan, 2009).
In this paper, we compare the satellite quenched fraction as a function of stellar mass to observations of the LG and beyond, and we determine the quenching timescales for individual dwarf satellites as a function of their mass. By analyzing the properties of the satellites at their time of accretion in relation to their quenching timescales, we infer the mass regimes over which different quenching processes likely dominate. The structure of the paper is as follows. In §2 we present the suite of simulations. In §3 we validate the simulations with comparisons to observations and discuss differences. In §4 we present the quenching and infall times of our dwarf satellites and discuss the roles of different quenching processes. We summarize our conclusions in §5.
2 Methods
We conduct our analysis on the DC Justice League suite of 4 “near-mint”-resolution, cosmological zoom-in, smooth particle hydrodynamics (SPH) simulations of Milky Way-mass disk galaxies and their surroundings. The properties of the host halos in the Justice League simulations are shown in Table 1. These simulations were previously introduced in Bellovary et al. (2019). Here we discuss the simulation code and the post-processing analysis conducted on the simulation output.
2.1 Simulations
All simulations were generated using the tree+SPH code ChaNGa (Menon et al., 2015), which scales efficiently up to 100,000 cores. ChaNGa is the successor to the N-body gravity-tree code PKDGRAV (Stadel, 2001) and SPH code gasoline (Wadsley et al., 2004, 2017). ChaNGa models Kelvin-Helmholtz instabilities in shearing flows by using the geometric mean density in the SPH force expression (Ritchie & Thomas, 2001; Keller et al., 2014). This method generally minimises numerical surface tension associated with density discontinuities, including those found in Kelvin-Helmholtz instabilities. Correctly modeling the instabilities and shocks of the satellite halo gas as it passes through the host galaxy CGM is key to correctly modeling the gas loss rates due to ram pressure stripping (Quilis et al., 2000). ChaNGa also allows for thermal diffusion across gas particles with a thermal diffusion coefficient of 0.03 (Shen et al., 2010).
The simulations were integrated from to in a fully cosmological context assuming Planck 2015 cosmological parameters (, , , , ; Planck Collaboration et al., 2016). In order to achieve high resolution while maintaining the effects of the large-scale environment, the initial conditions were generated using the “zoom-in” volume renormalization technique (Katz & White, 1993). The four main halos were selected from dark matter-only volumes to be a representative sample of the range of masses, halo spins and local densities considered to be representative of our Milky Way local environment. Halos that had major mergers at or were in the infall zone of group and clusters were avoided and no requirement for a nearby similar mass companion was imposed. The highest-resolution region extends to times the virial radius of the main halo. The simulations have a force softening resolution of pc. Dark matter particle masses are , gas particle masses are , and star particles form with masses of .
ChaNGa follows non-equilibrium abundances of H (including H2) and He species. The integration of these chemical species and the associated heating and cooling is described in Christensen et al. (2012) and references therein. Photoionization and heating rates are implemented using a uniform, time-dependent cosmic UV background adapted from Haardt & Madau (2012). In this model, cosmological HII regions overlap at (13 Gyr ago), indicating the completion of reionization. We note that this model is known to ionize and heat the intergalactic medium too early, which primarily affects gas thermodynamics for (Oñorbe et al., 2017). Cooling beyond that from hydrogen and helium is provided by metal lines assuming photoionization equilibrium (Shen et al., 2010). Oxygen and iron are tracked independently, and metals are diffused across particles based on a subgrid turbulent mixing model (Shen et al., 2010) with a metal diffusion constant of 0.03.
Star particles represent simple stellar populations with a Kroupa (2002) initial mass function. Star formation in ChaNGa is implemented probabilistically according to local H2 abundance, gas density, and gas temperature, as described in Christensen et al. (2012). Briefly, the star formation efficiency factor is given by , where and are the mass fraction of atomic and molecular hydrogen, respectively. Star formation is only allowed for particles with temperatures K and densities amu cm-3, although these constraints are largely superseded by the dependency of on H2, and most stars form at densities amu cm-3.
Energy from Type II supernovae (SNe II) is distributed as thermal energy to surrounding gas particles according to the “blastwave” model (Stinson et al., 2006), assuming ergs released per SN. Cooling of the affected gas particles is temporarily disabled to match the theoretical timescale of the “snowplow” phase of the supernova (McKee & Ostriker, 1977), avoiding the rapid radiative cooling that would render feedback negligible. This SNe feedback model provides the entirety of stellar feedback as radiative pressure (e.g. Stinson et al., 2012; Hopkins et al., 2014) and other forms of early stellar feedback are not separately included. This stellar feedback model relies entirely on the local properties of the gas, rather than the overall halo potential, but still produces mass-loading factors consistent with energy-driven winds (Christensen et al., 2016). It has been critical for reproducing the observed properties of dwarf galaxies, including cored dark matter profiles (Governato et al., 2010), and reconciling the Too Big To Fail problem (Brooks & Zolotov, 2014). Energy and metals from SNe Ia are also deposited in gas particles within a smoothing kernel, but cooling is not disabled. Stellar winds also return mass, at the metallicity of the star particles, to gas particles within the smoothing kernel assuming the mass loss rates from (Weidemann, 1987).
This version of ChaNGa also includes supermassive black hole formation (Bellovary et al., 2011), growth, mergers, and feedback (Tremmel et al., 2017). However, none of the black holes accrete at high enough rates during their history for black holes to play a critical role in the quenching of star formation (Bellovary et al., 2019).
2.2 Post-processing Analysis
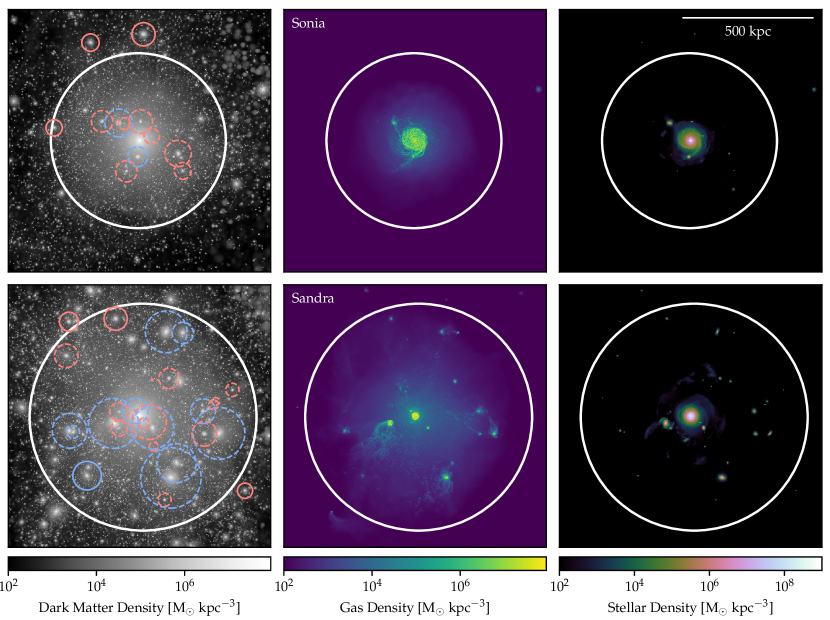
In order to select individual galaxies from simulation snapshots, we use amiga’s halo finder (Knollmann & Knebe, 2009), which identifies regions of over-density and assigns halo ownership to gravitationally bound particles. We compute the virial radius () of each halo as the radius at which the enclosed density drops below 200 times the background density, = . Galaxy properties are calculated from all particles within the virial radius, excluding subhalos. Table 1 shows basic properties of the host galaxies in the 4 Justice League simulations, which are named Sandra, Ruth, Sonia, and Elena. All four galaxies have disk morphology at z = 0 but have different masses and merger histories. Most dramatically, Elena experienced a merger at , which led to its low HI mass, although it retains a low-surface brightness disk. Figure 1 shows line-of-sight averaged density plots of the dark matter, gas, and stars in Sandra and Sonia.
For each Justice League simulation, we use the database-generation software tangos (Pontzen & Tremmel, 2018) to track particles across snapshots and generate merger trees for all halos containing stars at . For each halo, we determine the major progenitor, defined as the halo which contains the majority of dark matter particles from the corresponding halo in the subsequent snapshot, back to . We limit the merger tree to progenitor halos with dark matter particles, corresponding to a halo mass of , approximately the resolution limit of our simulations. All further analysis is conducted in Python using the pynbody package (Pontzen et al., 2013).
3 Observational Comparisons
3.1 Satellite Luminosity Functions
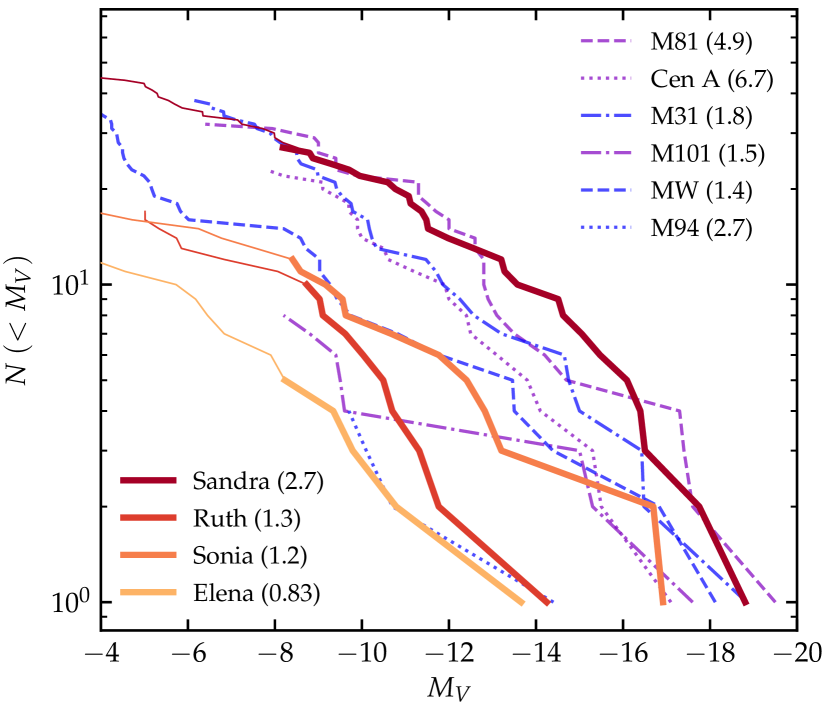
Figure 2 shows the cumulative satellite luminosity functions (LFs) of our four Justice League simulations, alongside observed LFs for nearby host-satellite systems. While we show the LFs down to , we focus our analysis on satellites above our resolution limit, which encompasses the “classical dwarfs” ( brighter than ). LFs derived from the recently-completed “mint”-resolution runs of these same simulations, with roughly eight-times-higher mass resolution, match these down to (Applebaum et al., 2021). To aid in the comparison to observations, we list the stellar masses of the simulated galaxies as they would be calculated from assuming a mass-to-light ratio of 1. The actual stellar masses of the simulated galaxies may be found in Table 1.
Although the LFs of our simulations vary widely (from to satellites brighter than ), they are consistent with the range of observed LFs for MW-analog hosts. The LFs of our simulated sample are roughly ordered by host halo mass, with the more massive halos generally hosting more satellites with a magnitude of or brighter, as expected (Trentham & Tully, 2009; Nickerson et al., 2013; Carlsten et al., 2020). Additionally, our simulations are not susceptible to the missing satellite problem (Klypin et al., 1999), as we do not see systematic overproduction of luminous satellites. While each galaxy hosts on the order of 10-50 dark matter subhalos with , the occupation fraction for the least massive halos () is low, with of halos hosting star particles. This low occupation fraction is a result of the inclusion of baryonic physics in the simulation, which has been shown to reduce the number of luminous satellites (Brooks et al., 2013) by core-creation and/or tidal stripping.
The most populous system, Sandra, is consistent with the LFs of the most massive galaxies: the star-forming disk galaxies M31 (McConnachie, 2012) and M81 (Chiboucas et al., 2013), and the elliptical radio galaxy, Centaurus A (Crnojević et al., 2019). As a star-forming disk galaxy with a strong central bar, Sandra is more similar in morphology to M31 and M81 than Centaurus A. Its virial mass is also closer to the orbital masses of M31 and M81 ( and , respectively) than that of Centaurus A (; Karachentsev & Kudrya, 2014). The moderate mass hosts, Ruth and Sonia, have LFs most consistent with the MW (McConnachie, 2012) and M101 (Bennet et al., 2019), and their spiral morphologies and virial masses are likewise similar to those of the MW (; Karachentsev & Kudrya, 2014) and M101 (; Karachentsev & Kudrya, 2014). The least massive host, Elena, has a LF consistent with the unique and sparsely populated M94 system (Smercina et al., 2018). However, it differs both in its virial mass, which is less than a third of the orbital mass measured for M94 (Karachentsev & Kudrya, 2014), and its morphology. Unlike the other hosts in our sample, Elena is undergoing quenching due to a merger at and now contains an extended low surface brightness disk. Therefore, a larger sample of lower stellar mass satellite hosts may be necessary to identify a better analogue for Elena.
3.2 Quenched Fractions
To further ensure that our star-formation model accurately reproduces observed quenching in dwarf galaxies, we also measure the mass trend in the fraction of quenched satellites. Here, and throughout this paper, we define a “quenched” galaxy as one with a specific star-formation rate () of , where we define the SFR as the average rate of star formation within the Amiga-identified halo over the past 100 Myr. Analysis of the star formation histories indicates that while it is possible for satellites to drop below this threshold only temporarily, in almost all cases it indicates a genuine period of quiescence with for 1 Gyr. This choice of threshold has been adopted by many other studies using simulations (e.g. Bahé & McCarthy, 2015; Pallero et al., 2019), and some observational studies use this threshold with spectroscopically derived measures of the sSFR (e.g. Wetzel et al., 2013). Other observational studies define quenching directly from spectroscopic parameters, specifically H emission and the D index (e.g. Geha et al., 2012, 2017). Alternatively, spectroscopic information may be used to estimate the atomic hydrogen richness in dwarfs, a useful indicator of star formation (e.g. Grcevich & Putman, 2009; Spekkens et al., 2014; Wetzel et al., 2015b). To facilitate observational comparisons, we computed the best-fit power-law relationship between the sSFR and atomic hydrogen richness in our simulations and found that our sSFR threshold corresponds to .
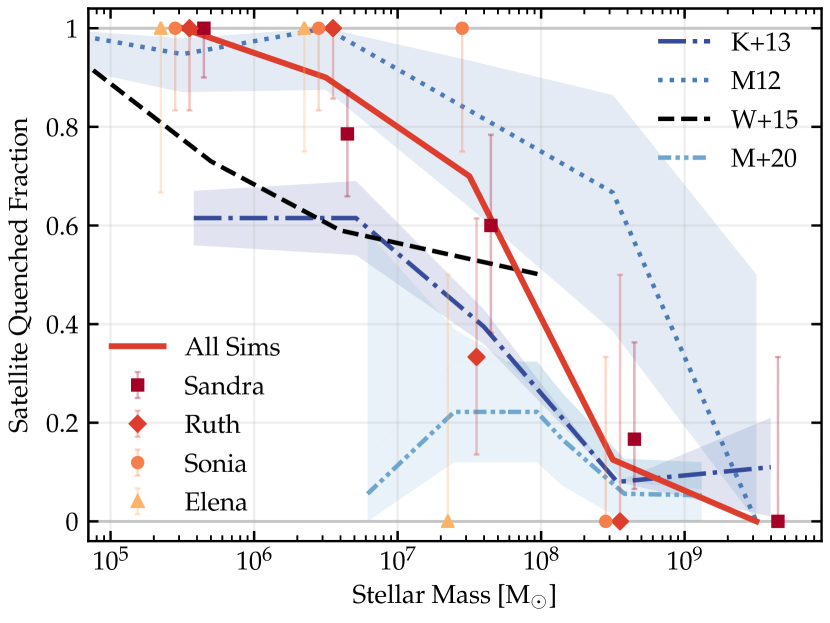
Figure 3 shows the fraction of quenched satellites in each of the Justice League simulations, in 1 dex bins of stellar mass. In order to avoid sample contamination by galaxies far from the central host, we restrict our study to galaxies within the virial radius of their host halo. While we note that the virial radii of our hosts are generally larger than the kpc estimate typically used for the MW, our results are not sensitive to this choice as we find few satellites at large radial distances. Actual satellite stellar masses from the simulations are reported on this plot.
Observational data from McConnachie (2012), Karachentsev et al. (2013), Weisz et al. (2015), and Mao et al. (2020) are shown for comparison. These studies cover different samples of satellite populations: while McConnachie (2012) and Weisz et al. (2015) sample LG satellites, the Nearby Galaxy Catalog (Karachentsev et al., 2013) includes satellites of hosts out to 11 Mpc and the Satellites Around Galactic Analogs (SAGA) survey (Geha et al., 2017; Mao et al., 2020) includes satellites of hosts between 20 and 40 Mpc away. For the McConnachie (2012) LG sample, we define the quenched fraction as the fraction of satellites within 300 kpc of their host and with , the HI threshold that best corresponds to our sSFR threshold. We note that this threshold produces identical quenched fractions as the threshold of adopted by Fillingham et al. (2015) and Wetzel et al. (2015b). Weisz et al. (2015) also use a 300 kpc radius to classify satellites in the LG, and use the absence of detected HI to define a satellite as quenched. Data from the Nearby Galaxy catalog (Karachentsev et al., 2013) is also compiled in Weisz et al. (2015). Quenching for this sample is based on galaxy morphological type (a numerical code according to classification by de Vaucouleurs et al., 1991). Galaxies with (largely dSph) are classified as quenched, whereas galaxies with are not. For some dwarfs with transitioning morphological types (dTrans), this definition becomes ambiguous. As such, the upper/lower bounds for the Karachentsev et al. (2013) line in Figure 3 represent quenched fractions with all/none of the dTrans galaxies classified as quenched. Finally, Mao et al. (2020) define a satellite as quenched if its spectrum shows no H emission. We have verified using the radiative transfer code Sunrise (Jonsson et al., 2010) that, in all cases but one, our star forming galaxies above the SAGA completeness limit of also have detectable H emission and our quenched galaxies do not.
Figure 3 shows generally good agreement between quenched fractions in the Justice League simulations and nearby galaxy observations. Our simulations fall within the range of observations, fitting the data from McConnachie (2012) well at low masses and Weisz et al. (2015) and Karachentsev et al. (2013) better at higher masses. Given the widely varying samples of satellites in these observations, it is startling that our results agree as well as they do, and suggest that morphology and HI content are well correlated with star-formation rates. Our results are also remarkably consistent with the simulations presented in Simpson et al. (2018), despite substantial differences in physical prescriptions used. Specifically, allowing the formation of a multi-phase ISM using non-equilibrium chemistry models, as we do here, does not appear to have significantly changed the quenched fractions compared to their use of a sub-grid two-phase, pressure-equilibrium model for the ISM.
Figure 3 also highlights variation between the individual Justice League simulations. The quenched fractions of satellites around the individual hosts vary widely, particularly at stellar masses of . This halo-to-halo scatter is consistent with observed variations across the MW and M31, where we see drastic differences in quenched fractions. At , all M31 satellites (M32 & NGC 205) are quenched, while all MW satellites (the Magellanic clouds) are star-forming (McConnachie, 2012).
3.3 Comparisons to the SAGA Survey
While the quenched fractions of satellites of different stellar masses in our simulations are consistent with observations of the LG and other nearby galaxies, there is tension with the results of the SAGA survey (Geha et al., 2017; Mao et al., 2020). Although individual simulated halos such as Elena (and, potentially, Ruth) are consistent with the quenched fractions of the SAGA survey, our sample as a whole contains more quenched galaxies with than SAGA thus far (Figure 3). While a full analysis must wait until the complete SAGA results, we discuss possible explanations for the differing quenched fractions here.
In order to produce a more detailed and fair comparison to SAGA, we estimate SDSS -band magnitudes for the simulated satellites using PARSEC (Bressan et al., 2012) isochrones and calculate the H emission (the star formation tracer SAGA uses) with the radiative transfer code Sunrise (Jonsson et al., 2010, though we caution that different assumptions about stellar population and radiative transfer models may produce slightly different results). SAGA has a completeness limit of , which corresponds to for star-forming galaxies and for quenched galaxies. Of the 123 satellites observed by SAGA brighter than this limit, 105 are actively star-forming. Our simulated sample includes 26 satellites with , 19 of which are star-forming and 18 of which are predicted to have H emission. This difference in quenched fraction is concentrated at the faint-end, and our brightest quenched satellite has an .
Differences between SAGA hosts, the LG, and the host galaxies in our sample may explain some or all of this discrepancy in the satellite quenched fraction. First, host virial masses are difficult to constrain observationally, and it is possible that the SAGA sample may emphasize a lower range of halo masses than the LG or our simulated sample. Lower-mass host galaxies are known to have lower fractions of quenched satellites (Wetzel et al., 2012; Phillips et al., 2015; Bahé & McCarthy, 2015), which may help explain the lack of quenching among SAGA satellites. Indeed, our least-massive Milky Way analog, Elena (), has no quenched satellites with –, similar to what is observed for SAGA galaxies. In the particular case of Elena, the lack of quenched satellites is driven largely by the low total number of satellites and the lower ram pressure they experience from the low-density CGM, both a product of the lower halo mass.
Second, the host halo’s environment may affect its fraction of quenched satellites through group preprocessing (Wetzel et al., 2015a), which may be more prevalent around higher-mass hosts (Jung et al., 2018). The Milky Way-Andromeda system is somewhat uniquely situated as a close pair. In contrast, while not explicitly disbarring a Milky Way-Andromeda like system, the selection criteria for SAGA hosts emphasizes relative isolation in order to reduce uncertainty in identifying satellites. Specifically, no galaxy brighter than + 1 of the host galaxy magnitude could be within 1∘ of the host. Nor could a massive () galaxy be within two virial radii of the SAGA hosts. Our simulated sample of host galaxies are more isolated than the LG: none are in a close pair and the distances to the closest galaxies with are 1.68 Mpc (Sandra), 2.37 Mpc (Ruth), 2.55 Mpc (Sonia), and 6.14 Mpc (Elena). While our higher-mass hosts may be in richer environments than the SAGA galaxies, more consistent with the LG, the particular isolation of Elena is more consistent with SAGA. This is similar to the isolated, sparsely-populated systems M94 and M101, which have quenched fractions consistent with SAGA hosts (Bennet et al., 2019). This result suggests a relationship between host halo mass, environment, number of satellites, and satellite quenched fraction that may help to explain the SAGA results.
Finally, we stress that the completeness limit of the SAGA survey likely precludes detection of fainter quenched satellites. Our simulations, in agreement with data from the LG, suggest that satellites of MW-analog hosts transition from primarily star-forming to primarily quenched at lower masses. While the precise mass at which this transition occurs may be different in the SAGA hosts, it likely lies near the completeness limit for quenched galaxies. Furthermore, the satellite luminosity functions of the SAGA hosts generally show fewer faint () satellites than recent observations of the Local Volume (Carlsten et al., 2020). This, combined with the fact that the discrepancy between our results and those of SAGA is concentrated at , suggests that the SAGA results may be missing quenched satellites near their completeness limit. Indeed, the incompleteness correction provided by Mao et al. (2020) (shown in our Figure 3), which assumes that all potential undiscovered satellites are quenched, is more inline with our simulations. We predict that more complete observations in this transition range, and deeper observations fainter than , will uncover a trove of quenched satellites. The complete SAGA survey of hosts will provide valuable observational data for understanding the efficiency of quenching outside of the LG.
4 Quenching Timescales
In this section, we present the relative times of quenching and infall for the Justice League satellites discussed above. The quenching timescale, commonly defined as the time a satellite remains star-forming after infall, measures the efficiency of environmental quenching and may hint at the underlying quenching processes.
4.1 Timescale Definitions
We define the quenching time () as the lookback time at which a galaxy’s sSFR last crossed below . To determine , we compute each galaxy’s star formation history as the instantaneous sSFR of the main progenitor over time. Uncertainties in are computed from the quenching times with different choices of sSFR threshold, namely 0 yr-1 and . This is intended to flag those galaxies that undergo particularly slow quenching, for which the exact quenching epoch is difficult to constrain.
Using a sSFR threshold to define quenching follows the methodology used in §3 to determine the fraction of satellites that are quenched, and we have demonstrated that this definition yields results in agreement with observations. However, it is difficult to determine the historical values of sSFR through observations; instead, many observers define the quenching time as , the lookback time at which a galaxy formed 90% of its present-day stellar mass (e.g. Weisz et al., 2015; Fillingham et al., 2019). As a check, we also compute for our satellites. Though not shown, adopting this definition does not qualitatively change our results, as the values are on average Gyr earlier than .
We define the infall time () as the lookback time to the subhalo’s first crossing of its host’s virial radius (). While many galaxies fall within 1 multiple times, we use the first crossing as the traditional picture of stripping-dominated quenching attributes the majority of gas removal to the first pericentric passage (Slater & Bell, 2013). As with , uncertainties are computed by varying the choice of threshold, namely from 0.9 to 1.1 . For both infall and quenching times, these uncertainties are added in quadrature with the systematic uncertainty from the mean difference in snapshot times.
4.2 Results
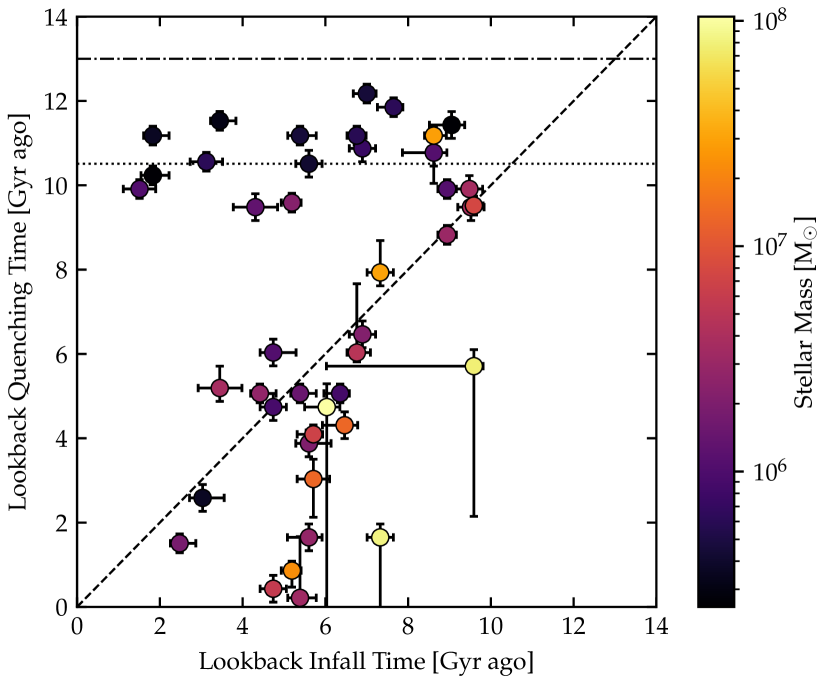
Figure 4 shows vs. for all quenched satellites surviving to in the Justice League simulations. Galaxies falling to the right of the diagonal line on this plot were quenched after infall, while those to the left were quenched prior to infall. We see that many of the lowest-mass galaxies quench early on ( Gyr), but with little correlation to infall time, indicating that quenching occurred independently of the larger halo (Rodriguez Wimberly et al., 2019). This may be a direct result of cosmic reionization (as in Brown et al., 2014), though the time delay suggests a more indirect process. One possibility is that reionization suppresses gas accretion and the remaining gas is subsequently expelled by stellar feedback (Benítez-Llambay et al., 2015) or self-shielded and consumed in star-formation (Katz et al., 2020). Another possibility is heating from the UV background, which peaked in our model around (Haardt & Madau, 2012). Though not the primary subject of this work, these low-mass, early quenching galaxies are discussed in Applebaum et al. (2021) and will be analyzed further in future work. The lone high-mass () galaxy that quenches this early experienced a period of intense starburst early in the Universe, reaching a peak SFR of and likely consuming the bulk of its gas. Importantly, we also see a population of predominantly higher-mass galaxies that quench after infall into the host halo (along and to the right of the diagonal line), to be discussed later.
Figure 4 also shows a few satellites that quench shortly before infall into their host halo (just to the left of the diagonal line and with Gyr). The lowest-mass galaxy of these four () is a reionization fossil that experienced momentary reignition prior to infall, but all seem to feel the effects of environment beyond . This extended environmental effect likely comes from some combination of group preprocessing (Wetzel et al., 2015a), unique elliptical orbital trajectories (Simpson et al., 2018), and direct ram-pressure stripping from gas filaments (Bahé et al., 2013), and may be able to reignite quenched satellites in addition to quenching star-forming ones (Wright et al., 2019).
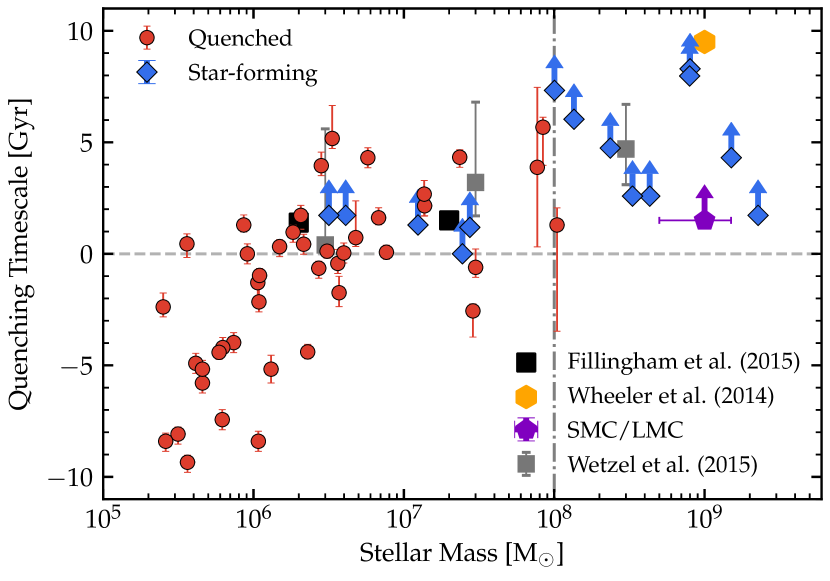
While some galaxies certainly do quench prior to infall, higher-mass galaxies typically quench shortly after. These quenching times correspond to a median satellite distance at of , consistent with the stripping model of Fillingham et al. (2015). This mass dependence is more readily apparent in Figure 5, which shows the quenching timescale vs. stellar mass. Galaxies which have become satellites but remain star-forming at are shown on this plot, as their lookback infall time can be interpreted as a lower limit on the potential quenching timescale. Many of the lowest-mass satellites () quench long before infall, likely due to cosmic reionization in the early universe (Brown et al., 2014; Weisz et al., 2014; Rodriguez Wimberly et al., 2019).
A second stellar mass threshold of is apparent in Figure 5, above which satellites can remain star-forming for as much as Gyr after infall. The implied lower limits on the quenching timescales are consistent with the unquenched Magellanic clouds, which experienced infall Gyr ago (Kallivayalil et al., 2013, their Figure 11). Additionally, these lower limits are consistent with observations of higher-mass dwarfs from the NSA/SDSS catalog, which show long timescales and inefficient environmental quenching (Wheeler et al., 2014). It is true that satellites that remain star-forming after infall can continue to build up stellar mass and will consequently have higher stellar masses than those that quench. However, this stellar mass threshold appears to be primarily based on the properties of the galaxies at infall, rather than being a side-effect of star formation histories after infall. As we show and discuss in §4.3, the galaxies that remain star-forming to typically have higher gas fractions and halo masses at infall. Only two of our satellites with have , and these are the two lowest-mass satellites above our threshold. The remaining high-mass satellites all form % of their stellar mass in the time since infall.
In contrast, for intermediate-mass satellites (), we predominantly see rapid quenching timescales of Gyr. This is consistent with observational estimates of LG timescales from Wetzel et al. (2015b) and Fillingham et al. (2015, 2019) and the simulations of Simpson et al. (2018). Wetzel et al. (2015b) and Fillingham et al. (2015) use LG quenched fractions and semi-analytical models of quenching to infer the quenching times of LG satellites. They combine these inferred quenching times with infall times estimated from the ELVIS (Garrison-Kimmel et al., 2014) simulations to determine the timescales reported on Figure 5. Our results broadly agree with the averages provided by Wetzel et al. (2015b) and Fillingham et al. (2015).
Though the rapid quenching timescales we see in the Justice League simulations reaffirm LG observations, it is important to recognize the spread in the timescale at a given stellar mass. Figure 5 also shows several intermediate-mass satellites that take more than Gyr to quench. These galaxies, despite being relatively low in mass () are able to maintain high sSFRs for as much as Gyr after infall. These quenching timescales are generally within the uncertainty range provided by Wetzel et al. (2015b). We note that one of these satellites experiences some ongoing, but bursty star formation in the 4 Gyr since infall, and could be considered to have quenched earlier (see §4.3). The few unquenched intermediate-mass satellites, which have no LG analog, accreted recently ( Gyr ago), and the lower limits on their quenching timescales are largely consistent with the timescales estimated for this mass range by Fillingham et al. (2015).
The threshold seems to indicate a characteristic mass scale at which the efficiency of the dominant quenching process changes. As we discuss in the following section, some gas removal process (likely ram-pressure stripping) dominates the quenching of galaxies with . For higher mass galaxies, we argue that this process becomes much less efficient at removing gas, allowing for extended star formation following the satellite’s accretion.
4.3 Quenching Processes
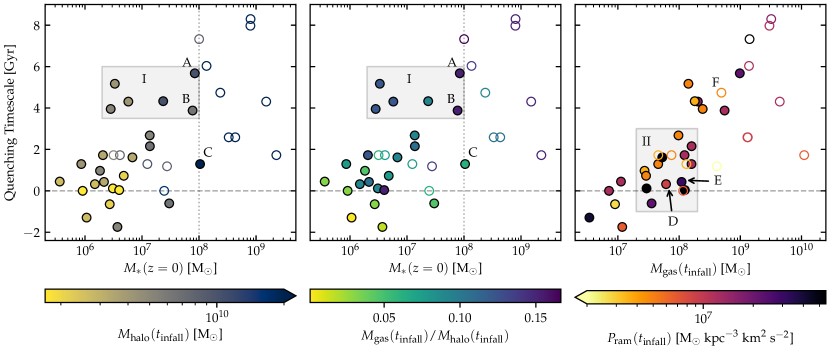
The quenching timescales of the Justice League satellites are generally consistent with those of LG satellites and can thus provide insight into the quenching processes at play. Timescales of Gyr for intermediate-mass satellites () imply the role of an efficient environmental quenching process at this mass range. A likely candidate for this process is ram-pressure stripping, which has been shown to rapidly remove gas from infalling satellites (Slater & Bell, 2014; Wheeler et al., 2014; Wetzel et al., 2015b) and is particularly efficient in combination with SNe feedback (Caproni et al., 2015; Bahé & McCarthy, 2015; Kazantzidis et al., 2017). However, our results do not show universally rapid timescales: several satellites in this same mass range take Gyr to quench. To help explain this scatter in the context of quenching processes, we introduce Figure 6, which shows the quenching timescale as it relates to halo mass, gas mass, and ram pressure at infall. In this plot, we show only those satellites that quench environmentally, defined as having Gyr ago and a quenching timescale Gyr. In each panel, open circles show star-forming satellites whose quenching timescales are lower limits.
The left panel shows the quenching timescale vs. stellar mass, with points colored by the satellite’s halo mass at infall. The center panel also shows the quenching timescale vs. stellar mass, this time with points colored by the “gas fraction,” defined as the ratio of gas mass to halo mass, at infall, where gas mass is computed including all gas within (excluding subhalos). These two panels differentiate between two factors that likely affect a satellite’s quenching timescale: its ability to hold onto its gas (related to the halo mass) and the relative size of its gas reservoir (related to the gas fraction).
We see that at a given stellar mass, those satellites that take Gyr to quench (points in the shaded region labeled I) generally have larger halo masses and gas fractions than those that quench rapidly. However, these two factors are not always associated with each other. For example, we note an outlier (labeled C) which quenches rapidly despite having . While the satellite has a large halo mass, it has a particularly low gas fraction, which distinguishes it from similarly massive satellites and helps explain its much shorter quenching timescale. Similarly, while the galaxies labeled A and B have similar stellar masses and gas fractions, the lower halo mass of galaxy B helps explain its Gyr shorter timescale.
The right panel of Figure 6 combines the depth of the potential well () and the relative size of the gas reservoir () into a single parameter: the absolute gas mass at infall (). The quenching timescale is shown versus , and we see a strong correlation, as the satellites with quenching timescales of Gyr generally have large gas masses. On this panel, points are colored by the ram pressure felt by the satellite at infall, , where is the density of the CGM and is the satellite’s velocity relative to its host. We compute from a spherically-averaged gas density profile, centered on the main halo, measured at the radial distance of the satellite. Under this definition, decreases from at to at .
At intermediate gas masses, (points in the shaded region labeled II), the satellites with longer quenching timescales experience less ram pressure than others at the same mass. While additional quenching processes are likely at play, this dependence on suggests that ram-pressure stripping drives gas removal in these rapidly quenching satellites, reaffirming previous theoretical work (e.g. Mayer et al., 2006; Simpson et al., 2018; Tremmel et al., 2019) as well as interpretations of observations (Slater & Bell, 2014; Fillingham et al., 2015). Galaxies with even smaller gas reservoirs quench rapidly, regardless of the ram pressure they feel, implying that these galaxies have shallow gravitational potential wells, in addition to small amounts of gas.
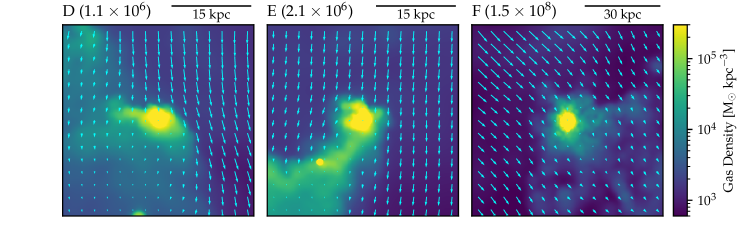
To further reaffirm the role of ram-pressure stripping in quenching intermediate-mass satellites, we introduce Figure 7, which shows gas density maps in three satellites at their respective infall times. These satellites are labeled as points D, E, and F in Figure 6, and vectors in Figure 7 indicate the velocity of the CGM relative to the satellite. Galaxies D and E both quench rapidly and have gas masses in the regime where we see a strong trend with , and indeed, they show strong trails of gas actively being stripped by ram pressure. In contrast, galaxy F is a high-mass galaxy that is unquenched at despite having infell Gyr ago. It does not show evidence of significant ram-pressure stripping, as we see only a small trail of low-density gas opposite its direction of motion.
We note that does not account for the complexity of a satellite’s orbit, which can be important when considering the effects of ram pressure. For example, we note an outlier in the right panel of Figure 6 with , a quenching timescale Gyr, and . This satellite shows a unique SFH, oscillating between bursts of star-formation and periods of quiescence in the few Gyr after infall. Though its relative velocity is large, its radial velocity in the direction towards the host halo is small, suggesting that it is on a low-eccentricity orbit and does not move quickly move towards regions of increasing density. Similarly, the slightly longer-quenching galaxy in region II with is a galaxy that is on a low-eccentricity orbit and does not experience a significant increase in ram pressure after infall.
Furthermore, considering orbital properties only at likely does not show the full picture for the satellites with longer quenching timescales. For rapidly quenching satellites, is an appropriate metric for assessing the role of ram pressure as , i.e. the ram pressure does not change significantly over the quenching timescale. However, for satellites that quench more slowly, the satellite’s velocity and the environment through which it moves can evolve significantly. In particular, as the satellite approaches the central galaxy, its radial velocity and the local density will both increase, resulting in higher values of ram pressure. Indeed, future work will explore the evolution of these satellites over their quenching timescales, and account for the local variations in the CGM density and temperature that can impact ram-pressure stripping.
Nevertheless, when examining the ram pressure at a single point in time, we argue that looking at the time of infall provides a reasonably fair comparison across satellites. Satellites that experience higher ram pressure force at the time of infall, are generally on faster, more radial orbits or accreting onto more massive hosts and so will continue to experience higher ram pressure forces. Additionally, since the local host CGM density changes slowly with radius, satellites accreting later and thus into a lower-density CGM will remain in lower-density material for a significant period of time.
We further argue that the fact that most satellites that quench environmentally do so near the time of infall indicates that examining the ram pressure at that time is appropriate for understanding quenching. In contrast, examining the ram pressure at the time of quenching would, in addition to being undefined for the unquenched satellites, introduce its own set of biases, as longer-quenching satellites would have their ram pressure measured when they were on closer orbits to the main halo.
Finally, the long quenching timescales for satellites with are consistent with those determined observationally (e.g. Fillingham et al., 2015; Phillips et al., 2015), and imply that environmental quenching of these satellites is much less efficient. Suppressed accretion of pristine gas, rather than ram-pressure stripping, may the dominant quenching mechanism in this mass regime (Wheeler et al., 2014). Evidence for the decreasing efficiency of ram-pressure stripping at these masses can be seen in the right panel of Figure 6: most satellites that remain star-forming do so in spite of high ram pressure. It is clear that higher-mass satellites are resistant to ram-pressure stripping. Likewise, the lack of quenched galaxies with implies all other quenching processes in this mass range must also be slow to the extent they are active at all. Indeed, our stellar mass threshold corresponds to , consistent with previous theoretical estimates of the maximum halo mass at which ram pressure, aided by tidal stripping, is efficient (Mayer et al., 2006).
5 Conclusions
Using the high-resolution DC Justice League simulations, we have explored the quenched fractions and quenching timescales of dwarf galaxies near Milky Way-mass hosts. Our conclusions are summarized as follows:
-
1.
The Justice League simulations accurately reproduce observations of the dwarf galaxies in the LG, both with regards to satellite luminosity functions and quenched fractions across 5 dex in stellar mass. While we see variability between individual simulations, this is largely consistent with observations of the LG and other nearby host-satellite systems.
-
2.
We find that intermediate-mass satellites () generally have short quenching timescales of Gyr, indicating that quenching is very efficient at this mass. However, several satellites in this mass range do not quench rapidly, instead continuing to form stars for as much as Gyr after infall. These special cases generally have larger gas fractions at infall than similarly luminous satellites that quench rapidly.
-
3.
We find a strong positive correlation between the quenching timescale and the satellite gas mass at infall. For satellites that quench rapidly, the quenching timescale is also inversely correlated with the ram pressure felt by the satellite at infall. These correlations suggests that ram-pressure stripping is the dominant quenching mechanism for dwarf satellites with . The presence of ram pressure trails in satellites within this mass range further corroborates this finding.
-
4.
We find a stellar mass threshold of , above which infalling satellites are largely resistant to rapid environmental quenching and can remain star-forming to for as much as Gyr after infall. Only one of our satellites with is quenched and it has a mass of . Below this threshold, only five satellites remain star-forming, all of which fell into their host halo – Gyr ago. This may point to a characteristic mass scale at which the quenching process—and with it the quenching efficiency—shifts.
There is much further work to be done in analyzing the Justice League suite of simulations. While this work primarily focuses on the overall populations of dwarf satellites in the Justice League, future work will investigate the evolution of individual systems and their contribution to the CGM. At present, we are using particle-tracking to investigate the spatial distribution, temperature, and density of satellite gas post-infall. Preliminary results indicate that gas stripping timescales are highly correlated with the quenching timescales of intermediate-mass satellites, though dependent on gas phase, and these results will appear in a future paper. While it remains unclear the precise role that each quenching mechanism may play in the quenching of dwarf satellites, the Justice League simulations provide a promising route by which to better understand these processes.
Missing in this analysis are the quenched fractions and quenching timescales of ultra-faint dwarfs (UFDs; ). Although the Justice League simulations used in this work are run at “near-mint” resolution, these dwarfs approach our resolution limit and may be subject to additional uncertainty in the modeling of baryonic physics. Additional Justice League runs at even higher “mint” resolution have been completed, allowing us to more throughly explore UFD quenching and the effects of reionization on these faint galaxies (Applebaum et al., 2021).
References
- Applebaum et al. (2021) Applebaum, E., Brooks, A. M., Christensen, C. R., et al. 2021, ApJ, 906, 96, doi: 10.3847/1538-4357/abcafa
- Bahé & McCarthy (2015) Bahé, Y. M., & McCarthy, I. G. 2015, MNRAS, 447, 969, doi: 10.1093/mnras/stu2293
- Bahé et al. (2013) Bahé, Y. M., McCarthy, I. G., Balogh, M. L., & Font, A. S. 2013, MNRAS, 430, 3017, doi: 10.1093/mnras/stu2293
- Bellovary et al. (2011) Bellovary, J., Volonteri, M., Governato, F., et al. 2011, ApJ, 742, 13, doi: 10.1088/0004-637X/742/1/13
- Bellovary et al. (2019) Bellovary, J. M., Cleary, C. E., Munshi, F., et al. 2019, MNRAS, 482, 2913, doi: 10.1093/mnras/sty2842
- Benítez-Llambay et al. (2015) Benítez-Llambay, A., Navarro, J. F., Abadi, M. G., et al. 2015, MNRAS, 450, 4207, doi: 10.1093/mnras/stv925
- Bennet et al. (2019) Bennet, P., Sand, D. J., Crnojević, D., et al. 2019, ApJ, 885, 153, doi: 10.3847/1538-4357/ab46ab
- Bressan et al. (2012) Bressan, A., Marigo, P., Girardi, L., et al. 2012, MNRAS, 427, 127, doi: 10.1111/j.1365-2966.2012.21948.x
- Brooks et al. (2013) Brooks, A. M., Kuhlen, M., Zolotov, A., & Hooper, D. 2013, ApJ, 765, 22, doi: 10.1088/0004-637X/765/1/22
- Brooks & Zolotov (2014) Brooks, A. M., & Zolotov, A. 2014, ApJ, 786, 87, doi: 10.1088/0004-637X/786/2/87
- Brown et al. (2014) Brown, T. M., Tumlinson, J., Geha, M., et al. 2014, ApJ, 796, 91, doi: 10.1088/0004-637X/796/2/91
- Buck et al. (2019) Buck, T., Macciò, A. V., Dutton, A. A., Obreja, A., & Frings, J. 2019, MNRAS, 483, 1314, doi: 10.1093/mnras/sty2913
- Caproni et al. (2015) Caproni, A., Lanfranchi, G. A., da Silva, A. L., & Falceta-Gonçalves, D. 2015, ApJ, 805, 109, doi: 10.1088/0004-637X/805/2/109
- Carlsten et al. (2020) Carlsten, S. G., Greene, J. E., Peter, A. H. G., Greco, J. P., & Beaton, R. L. 2020, ApJ, 902, 124, doi: 10.3847/1538-4357/abb60b
- Chiboucas et al. (2013) Chiboucas, K., Jacobs, B. A., Tully, R. B., & Karachentsev, I. D. 2013, ApJ, 146, 126, doi: 10.1088/0004-6256/146/5/126
- Christensen et al. (2012) Christensen, C., Quinn, T., Governato, F., et al. 2012, MNRAS, 425, 3058, doi: 10.1111/j.1365-2966.2012.21628.x
- Christensen et al. (2016) Christensen, C. R., Davé, R., Governato, F., et al. 2016, ApJ, 824, 57, doi: 10.3847/0004-637X/824/1/57
- Crnojević et al. (2019) Crnojević, D., Sand, D. J., Bennet, P., et al. 2019, ApJ, 872, 80, doi: 10.3847/1538-4357/aafbe7
- de Vaucouleurs et al. (1991) de Vaucouleurs, G., de Vaucouleurs, A., Corwin, Jr., H. G., et al. 1991, Third Reference Catalogue of Bright Galaxies. (New York, NY (USA): Springer)
- Digby et al. (2019) Digby, R., Navarro, J. F., Fattahi, A., et al. 2019, MNRAS, 485, 5423, doi: 10.1093/mnras/stz745
- Emerick et al. (2016) Emerick, A., Mac Low, M.-M., Grcevich, J., & Gatto, A. 2016, ApJ, 826, 148, doi: 10.3847/0004-637X/826/2/148
- Fillingham et al. (2015) Fillingham, S. P., Cooper, M. C., Wheeler, C., et al. 2015, MNRAS, 454, 2039, doi: 10.1093/mnras/stv2058
- Fillingham et al. (2019) Fillingham, S. P., Cooper, M. C., Kelley, T., et al. 2019, arXiv e-prints, arXiv:1906.04180
- Garrison-Kimmel et al. (2014) Garrison-Kimmel, S., Boylan-Kolchin, M., Bullock, J. S., & Lee, K. 2014, MNRAS, 438, 2578, doi: 10.1093/mnras/stt2377
- Garrison-Kimmel et al. (2017) Garrison-Kimmel, S., Wetzel, A., Bullock, J. S., et al. 2017, MNRAS, 471, 1709, doi: 10.1093/mnras/stx1710
- Garrison-Kimmel et al. (2019) Garrison-Kimmel, S., Wetzel, A., Hopkins, P. F., et al. 2019, arXiv e-prints, arXiv:1903.10515
- Geha et al. (2012) Geha, M., Blanton, M. R., Yan, R., & Tinker, J. L. 2012, ApJ, 757, 85, doi: 10.1088/0004-637X/757/1/85
- Geha et al. (2017) Geha, M., Wechsler, R. H., Mao, Y.-Y., et al. 2017, ApJ, 847, 4, doi: 10.3847/1538-4357/aa8626
- Governato et al. (2010) Governato, F., Brook, C., Mayer, L., et al. 2010, Nature, 463, 203, doi: 10.1038/nature08640
- Grcevich & Putman (2009) Grcevich, J., & Putman, M. E. 2009, ApJ, 696, 385, doi: 10.1088/0004-637X/696/1/385
- Haardt & Madau (2012) Haardt, F., & Madau, P. 2012, ApJ, 746, 125, doi: 10.1088/0004-637X/746/2/125
- Hopkins et al. (2014) Hopkins, P. F., Kereš, D., Oñorbe, J., et al. 2014, MNRAS, 445, 581, doi: 10.1093/mnras/stu1738
- Huang et al. (2012) Huang, S., Haynes, M. P., Giovanelli, R., et al. 2012, The Astronomical Journal, 143, 133, doi: 10.1088/0004-6256/143/6/133
- Hunter (2007) Hunter, J. D. 2007, Computing in Science Engineering, 9, 90, doi: 10.1109/MCSE.2007.55
- Jonsson et al. (2010) Jonsson, P., Groves, B. A., & Cox, T. J. 2010, MNRAS, 403, 17, doi: 10.1111/j.1365-2966.2009.16087.x
- Jung et al. (2018) Jung, S. L., Choi, H., Wong, O. I., et al. 2018, ApJ, 865, 156, doi: 10.3847/1538-4357/aadda2
- Kallivayalil et al. (2013) Kallivayalil, N., van der Marel, R. P., Besla, G., Anderson, J., & Alcock, C. 2013, ApJ, 764, 161, doi: 10.1088/0004-637X/764/2/161
- Karachentsev & Kudrya (2014) Karachentsev, I. D., & Kudrya, Y. N. 2014, AJ, 148, 50, doi: 10.1088/0004-6256/148/3/50
- Karachentsev et al. (2013) Karachentsev, I. D., Makarov, D. I., & Kaisina, E. I. 2013, AJ, 145, 101, doi: 10.1088/0004-6256/145/4/101
- Katz et al. (2020) Katz, H., Ramsoy, M., Rosdahl, J., et al. 2020, MNRAS, 494, 2200, doi: 10.1093/mnras/staa639
- Katz & White (1993) Katz, N., & White, S. D. M. 1993, ApJ, 412, 455, doi: 10.1086/172935
- Kazantzidis et al. (2017) Kazantzidis, S., Mayer, L., Callegari, S., Dotti, M., & Moustakas, L. A. 2017, ApJ, 836, L13, doi: 10.3847/2041-8213/aa5b8f
- Keller et al. (2014) Keller, B. W., Wadsley, J., Benincasa, S. M., & Couchman, H. M. P. 2014, MNRAS, 442, 3013, doi: 10.1093/mnras/stu1058
- Klypin et al. (1999) Klypin, A., Kravtsov, A. V., Valenzuela, O., & Prada, F. 1999, ApJ, 522, 82, doi: 10.1086/307643
- Knollmann & Knebe (2009) Knollmann, S. R., & Knebe, A. 2009, ApJS, 182, 608, doi: 10.1088/0067-0049/182/2/608
- Kroupa (2002) Kroupa, P. 2002, Science, 295, 82, doi: 10.1126/science.1067524
- Mao et al. (2020) Mao, Y.-Y., Geha, M., Wechsler, R. H., et al. 2020, arXiv e-prints, arXiv:2008.12783. https://arxiv.org/abs/2008.12783
- Mayer et al. (2006) Mayer, L., Mastropietro, C., Wadsley, J., Stadel, J., & Moore, B. 2006, MNRAS, 369, 1021, doi: 10.1111/j.1365-2966.2006.10403.x
- McConnachie (2012) McConnachie, A. W. 2012, AJ, 144, 4, doi: 10.1088/0004-6256/144/1/4
- McGee et al. (2014) McGee, S. L., Bower, R. G., & Balogh, M. L. 2014, MNRAS, 442, L105, doi: 10.1093/mnrasl/slu066
- McKee & Ostriker (1977) McKee, C. F., & Ostriker, J. P. 1977, ApJ, 218, 148, doi: 10.1086/155667
- Menon et al. (2015) Menon, H., Wesolowski, L., Zheng, G., et al. 2015, CompAC, 2, 1, doi: 10.1186/s40668-015-0007-9
- Murakami & Babul (1999) Murakami, I., & Babul, A. 1999, MNRAS, 309, 161, doi: 10.1046/j.1365-8711.1999.02810.x
- Nickerson et al. (2013) Nickerson, S., Stinson, G., Couchman, H. M. P., Bailin, J., & Wadsley, J. 2013, MNRAS, 429, 452, doi: 10.1093/mnras/sts348
- Oñorbe et al. (2017) Oñorbe, J., Hennawi, J. F., & Lukić, Z. 2017, ApJ, 837, 106, doi: 10.3847/1538-4357/aa6031
- Pallero et al. (2019) Pallero, D., Gómez, F. A., Padilla, N. D., et al. 2019, MNRAS, 488, 847, doi: 10.1093/mnras/stz1745
- Phillips et al. (2015) Phillips, J. I., Wheeler, C., Cooper, M. C., et al. 2015, MNRAS, 447, 698, doi: 10.1093/mnras/stu2192
- Planck Collaboration et al. (2016) Planck Collaboration, Ade, P. A. R., Aghanim, N., et al. 2016, A&A, 594, A13, doi: 10.1051/0004-6361/201525830
- Pontzen et al. (2013) Pontzen, A., Roškar, R., Stinson, G., & Woods, R. 2013, Astrophysics Source Code Library, ascl:1305.002
- Pontzen & Tremmel (2018) Pontzen, A., & Tremmel, M. 2018, ApJS, 237, 23, doi: 10.3847/1538-4365/aac832
- Quilis et al. (2000) Quilis, V., Moore, B., & Bower, R. 2000, Science, 288, 1617, doi: 10.1126/science.288.5471.1617
- Richings et al. (2020) Richings, J., Frenk, C., Jenkins, A., et al. 2020, MNRAS, 492, 5780, doi: 10.1093/mnras/stz3448
- Riley et al. (2019) Riley, A. H., Fattahi, A., Pace, A. B., et al. 2019, MNRAS, 486, 2679, doi: 10.1093/mnras/stz973
- Ritchie & Thomas (2001) Ritchie, B. W., & Thomas, P. A. 2001, MNRAS, 323, 743, doi: 10.1046/j.1365-8711.2001.04268.x
- Rodriguez Wimberly et al. (2019) Rodriguez Wimberly, M. K., Cooper, M. C., Fillingham, S. P., et al. 2019, MNRAS, 483, 4031, doi: 10.1093/mnras/sty3357
- Samuel et al. (2020) Samuel, J., Wetzel, A., Tollerud, E., et al. 2020, MNRAS, 491, 1471, doi: 10.1093/mnras/stz3054
- Shen et al. (2010) Shen, S., Wadsley, J., & Stinson, G. 2010, MNRAS, 407, 1581, doi: 10.1111/j.1365-2966.2010.17047.x
- Simpson et al. (2018) Simpson, C. M., Grand, R. J. J., Gómez, F. A., et al. 2018, MNRAS, 478, 548, doi: 10.1093/mnras/sty774
- Slater & Bell (2013) Slater, C. T., & Bell, E. F. 2013, ApJ, 773, 17, doi: 10.1088/0004-637X/773/1/17
- Slater & Bell (2014) —. 2014, ApJ, 792, 141, doi: 10.1088/0004-637X/792/2/141
- Smercina et al. (2018) Smercina, A., Bell, E. F., Price, P. A., et al. 2018, ApJ, 863, 152, doi: 10.3847/1538-4357/aad2d6
- Smercina et al. (2017) Smercina, A., Bell, E. F., Slater, C. T., et al. 2017, ApJ, 843, L6, doi: 10.3847/2041-8213/aa78fa
- Spekkens et al. (2014) Spekkens, K., Urbancic, N., Mason, B. S., Willman, B., & Aguirre, J. E. 2014, ApJ, 795, L5, doi: 10.1088/2041-8205/795/1/L5
- Springel (2010) Springel, V. 2010, MNRAS, 401, 791, doi: 10.1111/j.1365-2966.2009.15715.x
- Stadel (2001) Stadel, J. G. 2001, Ph.D. Thesis, 3657
- Stinson et al. (2006) Stinson, G., Seth, A., Katz, N., et al. 2006, MNRAS, 373, 1074, doi: 10.1111/j.1365-2966.2006.11097.x
- Stinson et al. (2012) Stinson, G. S., Brook, C., Prochaska, J. X., et al. 2012, Mon Not R Astron Soc, 425, 1270, doi: 10.1111/j.1365-2966.2012.21522.x
- Tonnesen & Bryan (2009) Tonnesen, S., & Bryan, G. L. 2009, ApJ, 694, 789, doi: 10.1088/0004-637X/694/2/789
- Tremmel et al. (2017) Tremmel, M., Karcher, M., Governato, F., et al. 2017, MNRAS, 470, 1121, doi: 10.1093/mnras/stx1160
- Tremmel et al. (2019) Tremmel, M., Quinn, T. R., Ricarte, A., et al. 2019, MNRAS, 483, 3336, doi: 10.1093/mnras/sty3336
- Trentham & Tully (2009) Trentham, N., & Tully, R. B. 2009, MNRAS, 398, 722, doi: 10.1111/j.1365-2966.2009.15189.x
- van der Walt et al. (2011) van der Walt, S., Colbert, S. C., & Varoquaux, G. 2011, Computing in Science Engineering, 13, 22, doi: 10.1109/MCSE.2011.37
- Wadsley et al. (2017) Wadsley, J. W., Keller, B. W., & Quinn, T. R. 2017, MNRAS, 471, 2357, doi: 10.1093/mnras/stx1643
- Wadsley et al. (2004) Wadsley, J. W., Stadel, J., & Quinn, T. 2004, New Astronomy, 9, 137, doi: 10.1016/j.newast.2003.08.004
- Weidemann (1987) Weidemann, V. 1987, A&A, 188, 74
- Weisz et al. (2014) Weisz, D. R., Dolphin, A. E., Skillman, E. D., et al. 2014, ApJ, 789, 148, doi: 10.1088/0004-637X/789/2/148
- Weisz et al. (2015) —. 2015, ApJ, 804, 136, doi: 10.1088/0004-637X/804/2/136
- Wetzel et al. (2015a) Wetzel, A. R., Deason, A. J., & Garrison-Kimmel, S. 2015a, ApJ, 807, 49, doi: 10.1088/0004-637X/807/1/49
- Wetzel et al. (2016) Wetzel, A. R., Hopkins, P. F., Kim, J.-h., et al. 2016, ApJ, 827, L23, doi: 10.3847/2041-8205/827/2/L23
- Wetzel et al. (2012) Wetzel, A. R., Tinker, J. L., & Conroy, C. 2012, MNRAS, 424, 232, doi: 10.1111/j.1365-2966.2012.21188.x
- Wetzel et al. (2013) Wetzel, A. R., Tinker, J. L., Conroy, C., & van den Bosch, F. C. 2013, MNRAS, 432, 336, doi: 10.1093/mnras/stt469
- Wetzel et al. (2015b) Wetzel, A. R., Tollerud, E. J., & Weisz, D. R. 2015b, ApJ, 808, L27, doi: 10.1088/2041-8205/808/1/L27
- Wheeler et al. (2014) Wheeler, C., Phillips, J. I., Cooper, M. C., Boylan-Kolchin, M., & Bullock, J. S. 2014, MNRAS, 442, 1396, doi: 10.1093/mnras/stu965
- Wilson (1927) Wilson, E. B. 1927, Journal of the American Statistical Association, 22, 209, doi: 10.1080/01621459.1927.10502953
- Wright et al. (2019) Wright, A. C., Brooks, A. M., Weisz, D. R., & Christensen, C. R. 2019, MNRAS, 482, 1176, doi: 10.1093/mnras/sty2759
- Zolotov et al. (2012) Zolotov, A., Brooks, A. M., Willman, B., et al. 2012, ApJ, 761, 71, doi: 10.1088/0004-637X/761/1/71