Different Fates of Young Star Clusters After Gas Expulsion
Abstract
We identify structures of the young star cluster NGC 2232 in the solar neighborhood (323.0 pc), and a newly discovered star cluster LP 2439 (289.1 pc). Member candidates are identified using the Gaia DR2 sky position, parallax and proper motion data, by an unsupervised machine learning method, StarGO. Member contamination from the Galactic disk is further removed using the color magnitude diagram. The four identified groups (NGC 2232, LP 2439 and two filamentary structures) of stars are coeval with an age of 25 Myr and were likely formed in the same giant molecular cloud. We correct the distance asymmetry from the parallax error with a Bayesian method. The 3D morphology shows the two spherical distributions of clusters NGC 2232 and LP 2439. Two filamentary structures are spatially and kinematically connected to NGC 2232. Both NGC 2232 and LP 2439 are expanding. The expansion is more significant in LP 2439, generating a loose spatial distribution with shallow volume number and mass density profiles. The expansion is suggested to be mainly driven by gas expulsion. NGC 2232, with 73 percent of the cluster mass bound, is currently experiencing a process of re-virialization, However, LP 2439, with 52 percent cluster mass being unbound, may fully dissolve in the near future. The different survivability traces different dynamical states of NGC 2232 and LP 2439 prior to the onset of gas expulsion. NGC 2232 may have been substructured and subvirial, while LP 2439 may either have been virial/supervirial, or it has experienced a much faster rate of gas removal.
1 Introduction
Star clusters form from dense gas clumps inside giant molecular clouds (GMCs). Only a fraction of the gas in a GMC is converted into stars, while the remainder of the gas is expelled from the cluster-forming clumps at later times. Therefore, the dynamics of star clusters embedded in the molecular cloud is dominated by the gravitational potential of the gas from which star clusters are formed (Lada & Lada, 2003). Feedback from high-mass stars, such as supernovae, stellar winds, and radiation, will remove the intra-cluster gas within several million years, which rapidly reduces the gravitational potential of the star cluster. This results in a star cluster expansion over a period of Myr, from an initial radius of pc, depending on how rapidly the gas is removed (see Kroupa, 2005; Baumgardt & Kroupa, 2007). Most star clusters will lose a significant fraction of their stellar mass after the phase gas dispersal, and often completely dissolve into the galactic field. This is usually referred to as infant mortality (de Grijs & Goodwin, 2008). In recent years, many studies investigated the processes and effects of gas dispersal on the evolution of young clusters (e.g., Hills, 1980; Goodwin & Bastian, 2006; Baumgardt & Kroupa, 2007; Banerjee & Kroupa, 2013; Brinkmann et al., 2017; Shukirgaliyev et al., 2017; Farias et al., 2018; Dinnbier & Kroupa, 2020a, b, and references therein).
The dynamical state of the star cluster at the onset of gas expulsion plays a crucial role in determining the the survival chances of a star cluster after the gas has been removed. If the gas expulsion occurs when the cluster is dynamically subvirial and has a substructured spatial distribution, the survival rate of the cluster is considerably higher (Goodwin, 2009; Farias et al., 2015, 2018). Moreover, the faster the gas is expelled from the cluster, the lower the bound fraction of mass for the remaining cluster members is (Brinkmann et al., 2017). If the stellar mass of a protocluster is more centrally-concentrated than that of the gas, as obtained in the cluster formation model of Parmentier & Pfalzner (2013), the survival rate of star clusters is also much higher (Adams, 2000; Shukirgaliyev et al., 2017).
The young star clusters that emerge from their parental molecular clouds shortly after gas expulsion will enter a phase of violent relaxation, which is the phase in which the star clusters evolve from a non-equilibrium state towards a new state of equilibrium (Lynden-Bell, 1967). If the cluster succeeds in obtaining virial equilibrium during this phase, it is said to have been re-virialized. Several young massive clusters, such as R 136, and Westerlund 1, manage to regain virialization within a time shorter than their present age (Banerjee & Kroupa, 2013; Cottaar et al., 2012). On the other hand, the re-virialization time is substantially longer than the age of several other young clusters, for example in the cases of IC 2602, IC 2391, and NGC 2547 (Bravi et al., 2018). These clusters are supervirial and continue to expand.
In addition to gas expulsion, the two-body relaxation process in a cluster can also trigger expansion of the cluster. However, the expansion rate induced by two-body relaxation is substantially smaller than that resulting from gas expulsion (see, e.g. Kroupa, 2005; Moeckel et al., 2012; Dinnbier & Kroupa, 2020a, b). Simultaneously, mass segregation occurs as a byproduct of two-body relaxation, as the cluster members attempt to achieve a state of energy-equipartition (e.g., Pang et al., 2013). Thus far, no astrometric efforts have been made to distinguish these two drivers of expansion in star clusters. Testing these scenarios using observations of young star clusters shortly after gas expulsion has occurred, is crucial to understand the disruption process of star clusters.
NGC 2232 is a young open cluster with an age of Myr (Currie et al., 2008; Liu & Pang, 2019), located south of the Galactic plane at the position of R.A.=, Decl.= (Gaia Collaboration et al., 2018b). Unlike its neighbor, the Orion star-forming complex, NGC 2232 has not attracted much attention. There exist only several comprehensive studies of this cluster. Claria (1972) carried out the first -photometry study of this cluster and estimate its age to be 20 Myr. They measured the interstellar reddening of the cluster as mag, and obtained a distance of 360 pc. The latter measurement of the reddening was refined to mag in the first spectroscopic study of sixteen cluster members by Levato & Malaroda (1974). Lyra et al. (2006) constrained the reddening in the colour–colour diagram by studying eight evolved B-type stars, which gave a best-fitting reddening of mag.
Young star clusters that are still partially embedded in the gas and dust of their parental molecular clouds tend to have a high interstellar reddening. This phenomenon is seen in the Orion Nebula Cluster, which has differential reddening of several orders of magnitude (Scandariato et al., 2011). Also, the reddening of the 1 Myr old cluster NGC 3603 can reach 1.5 mag (Pang et al., 2011). The low reddening of NGC 2232 thus indicates that it probably has already undergone gas expulsion.
Located right next to NGC 2232 (within 50 pc) is a newly-discovered star cluster, LP 2439, that was recently found by Liu & Pang (2019, ID:2439). This star cluster has not appeared in any study since its discovery in 2019. According to Liu & Pang (2019), LP 2439 has an age similar to that of NGC 2232. Note that a common age does not necessarily imply a similar dynamical evolutionary stage, as the dynamical ages of star clusters, which may be quantified using the number of crossing times since their formation (see Section 5). We therefore select both clusters as targets to investigate the expansion and dynamical state of star clusters after gas expulsion.
Using the data from Gaia DR 2, we explore the neighborhood of NGC 2232 and LP 2439, and investigate their dynamical state after gas expulsion. In Section 2, we discuss the quality and limitations of the Gaia DR 2 data, and describe our input data-set for structure identification. We then present the algorithm, StarGO, which is used to identify structures. Further confirmation of membership is performed using the the color-magnitude diagram. The properties of the identified member candidates are presented and discussed in Section 3, including the discussion of the evidence of gas expulsion. The 3D morphology of NGC 2232, LP 2439, and the nearby associated structures are discussed in Section 4 along with our interpretation of the results. The fate and dynamical state of both clusters are discussed in Section 5. Finally, we provide a brief summary in Section 6.
2 Data Analysis and Member Determination
2.1 Gaia DR 2 Data Processing and Analysis
The second data release (DR2) of Gaia (Gaia Collaboration et al., 2018a) has provided more than one billion sources with parallaxes () and proper motions (PMs; ) with unprecedented precision and sensitivity. The band ( nm) photometry ranges from mag to 21 mag. The median uncertainty of ranges from 0.04 mas for bright sources ( 14 mag) to 0.7 mas for faint ones ( 20 mag). The corresponding uncertainties of PMs for these sources are 0.05 mas yr-1 and 1.2 mas yr-1, respectively (Lindegren et al., 2018). Only 7.2 million stars have radial velocity (RV) measurements in the Gaia DR 2 (Cropper et al., 2018) with a typical uncertainty of 2 .
The spatial and kinematic structures of NGC 2232 and its neighboring cluster LP 2439 are investigated using Gaia DR 2 data within 100 pc from the center of NGC 2232. In Cartesian Galactocentric coordinates, the center of NGC 2232 is located at () = (, , ) pc 111 The Cartesian Galactic coordinate system adopted in our study is defined as follows. The Galactic center ( and ) is located at the origin of the coordinate system. The positive -axis points from the projection of the Sun’s position onto the Galactic mid-plane towards the Galactic center. The positive -axis points towards , and the positive –axis points towards . Further details about the coordinate system can be found in the appendix of Tang et al. (2019). . The distance to NGC 2232 is taken to be 325.6 pc (Gaia Collaboration et al., 2018b), and the equatorial coordinates of its center as (R.A.=, Decl.=, J2000) from Gaia Collaboration et al. (2018b).
We apply the same astrometric quality cuts as Lindegren et al. (2018, in their Appendix C) to exclude possible artifacts in the Gaia DR 2 from our sample. The final “cleaned” sample contains 131,066 sources. Hereafter, we refer to this set as “Sample I”. The stars in sample I have magnitudes ranging between 4.2 mag and 19.5 mag, and the sample becomes significantly incomplete for mag.
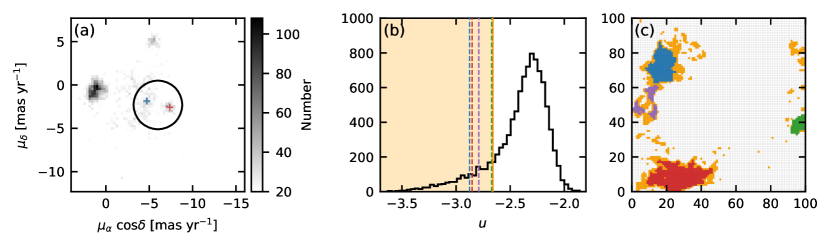
Figure 1 (a) shows a 2D density map of PMs that only shows bins with over-densities in Sample I. Several over-densities stand out. There is an over-density near the average PMs of NGC 2232 (indicated with a blue cross) (, )=(, ) provided by Liu & Pang (2019). Another over-density is seen at (, )=(, ) (red cross, Liu & Pang, 2019). This group corresponds to LP 2439.The notable clustering at and is the Orion star forming complex (Jerabkova et al., 2019). An isolated over-density around (, )=(, ) relates to another new star cluster discovered by Liu & Pang (2019) (ID: 2383), which is located at a distance of 377 pc (Liu & Pang, 2019) and does not show any spatial connection to NGC 2232. We apply a circular cut with a radius of 2.8 (the black circle in Figure 1 (a)), to only include NGC 2232 and LP 2439, for further analysis. This reduces the number of stars to 5,843; we refer to this set of stars as ”Sample II”, hereafter. The stars in this sample have magnitudes ranging between mag and mag, and the sample is complete for mag. Note that the stars in Sample II are typically fainter than the stars in Sample I, since the brightest stars, which reside in the Orion star forming complex, have been removed.
In this study we use 5D parameters of stars in Sample II (R.A., Decl., , , and ) from Gaia DR 2. Since only a fraction of the stars (12 percent) have RV measurements, RV measurements are used as supplementary data. Adopting a distance of , we compute for each source the Galactocentric Cartesian coordinates (). The transformation is performed by using the Python Astropy package (Astropy Collaboration et al., 2013, 2018). Considering the asymmetric error in the distance that arises from the direct inversion of , a Bayesian method is adopted to correct individual distances of stars in Section 4.
2.2 Member identification
The unsupervised machine learning method, StarGO (Yuan et al., 2018)222https://github.com/salamander14/StarGO is used for member candidate selection. This algorithm is based on the Self-Organizing-Map (SOM) method that map high-dimension data down to two dimensions, while preserving the topological structures of the data. StarGO has been successfully used in the identification of tidal structures in open clusters, such as the Coma Berenices cluster (Tang et al., 2019) and the Blanco 1 (Zhang et al., 2020).
We apply StarGO to map a 5D data set (, ) of the clusters NGC 2232, LP 2439 and their surrounding region (Sample II) onto a 2D neural network to identify member candidates. We adopt a network with 100100 neurons represented by the 100100 grid elements in Figure 1 (c), to study Sample II. Each neuron is assigned with a random 5D weight vector that has the same dimensions as the input 5D parameters (, ) obtained from observations. The weight vector of each neuron is updated during each iteration so that it is closer to the input vector of an observed star. This learning process is iterated 400 times until the weight vectors converge. The value of the difference of weight vectors between adjacent neurons, , is small when the 5D weight vectors of the adjacent neurons are similar, indicating stars associated with neurons are spatially and kinematically coherent. The neurons with small values of will group together in the 2D SOM map as patches (see Figure 1 (c)). Different patches correspond to different groupings of stars. Neurons located inside the patch have smaller value than neurons outside. Therefore, values of neurons inside patches generate an extended tail on the left (toward small value) in the histogram (see Figure 1 (b)).
A cut on the tail of the distribution is used for member selection. Tang et al. (2019) and Zhang et al. (2020) select member candidates in the extended tail of the distribution, with values less than the value of the peak minus the 99.85 percentile (; see their figure 3). Note that our samples cover the Galactic mid-plane. Therefore, contamination by field stars with similar PMs to those of cluster members is much higher than for Coma Berenice (Tang et al., 2019) and Blanco 1 (Zhang et al., 2020; Jackson et al., 2020), which are pc off the mid-plane. Applying the -cut criteria, (orange vertical line in Figure 1 (b)) results in a 13.3 percent field star contamination rate in selected patches showed up in the SOM (oragne patches in Figure 1 (c)), which is double the value of in Coma Berenice (Tang et al., 2019) and Blanco 1 (Zhang et al., 2020).
The contamination rate is evaluated from the smooth Galactic disk population using the Gaia DR 2 mock catalog (Rybizki et al., 2018), by applying the same PM cut as described in Section 2.1 to the mock catalog in the same volume of the sky. Each of these mock stars is attached to the trained SOM map, from which we can compute the number of field stars associated with selected patches.
In order to reduce field star contamination, the selection of is chosen to ensure a similar contamination rate of 5% for the different selected patches (blue, red, purple, and green dashed lines in Figure 1 (b)). We color the two major clusters, NGC 2232 and LP 2439 in blue and red, respectively. The two additional smaller groups are colored as purple and green. Three small purple patches merge into NGC 2232 as one big group (orange patches) if we apply a -cut of . Considering their similarity, purple patches are considered as one single group. Properties of NGC 2232, LP 2439, and the neighboring groups will be discussed further in Section 3. In the end, we have 182 member candidates for NGC 2232 (blue), 331 for LP 2439 (red), 79 for the purple group, and 61 for the green group.
2.3 Member Cleaning via the Color Magnitude Diagram
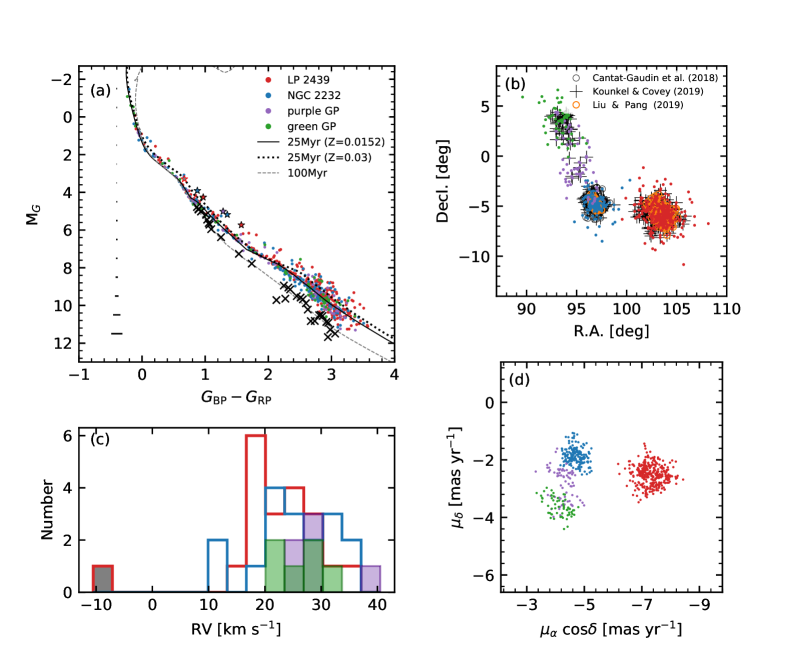
We construct a color-magnitude diagram (CMD) for the 653 candidate stars of the four groups in Figure 2 (a). Stars in the four groups surprisingly track a clear locus of a main-sequence together, which is consistent with the PARSEC isochrone of 25 Myr with the sensitivity curves provided by Weiler (2018) (black solid curve), adopting a reddening mag (Lyra et al., 2006) and a solar metallicity. Based on the nice fit of the isochrone to the data, the adopted age is in agreement with Currie et al. (2008), who obtained the age of NGC 2232 using ROSAT x-ray members. Different groups being coeval implies a common origin (see discussion in Section 3). Although NGC 2232 is suggested to be a metal-rich open cluster with a metallicity of [Fe/H]= (Monroe & Pilachowski, 2010), the isochrone with super-solar abundance (dotted curve in Figure 2 (a)) is clearly shifted from the main sequence locus towards redder colors due to the higher metallicity. Note that Monroe & Pilachowski (2010)’s measurement was based on spectroscopic observations of four pre-main-sequence stars, whose lithium abundance is higher than that of the main-sequence stars due to lower effective temperatures (Juarez et al., 2014).
A dozen of candidate stars are located below the main sequence locus ( mag), corresponding to an age equal to or older than 100 Myr (grey dashed curve in Figure 2 (a)). These stars are located on the outskirts of NGC 2232 and LP 2439. The RV of one star among these is four times larger than that of the other member candidates. Therefore, these are probably field stars. We use the 100 Myr isochrone as a reference and redden it to exclude possible contaminants. Around M mag is the transition region between pre-main-sequence stars to main-sequence stars. We redden the 100 Myr isochrone by 0.04 mag for magnitudes brighter than MG=8 mag, and by 0.1 mag for those with M8 mag. Stars bluer than the reddened isochrone are excluded from further analysis (black crosses in Figure 2 (a)). After the CMD cleaning, 621 stars are selected as member candidates, NGC 2232 (blue): 177, LP 2439 (red): 315, purple: 71; green: 58.
3 Properties of Identified Groups
3.1 Crossmatch with Previous Catalogs
Several new catalogs have recently been published for identifying new stellar groups with the multi-dimensional parameters from Gaia DR 2. Recent work by Liu & Pang (2019) has identified star clusters in Gaia DR 2 using the friend-of-friend (FoF) cluster finder in the five-dimensional parameter space (, and ). LP 2439 (the red group), is one of the 76 new clusters they discovered. Among their 148 members for LP 2439, we recover 129 (orange circles in Figure 2 (b)) in the present study. In addition, among the 177 member candidates that we identify in NGC 2232, 91 are cross-matched with the membership list of LP 2393 in Liu & Pang (2019, ID:2393). As can be seen in Figure 2 (b), members identified with the FoF cluster finder are all concentrated near the centers of the two clusters. Cantat-Gaudin et al. (2018) developed an unsupervised membership assignment code UPMASK to identify star clusters. In Cantat-Gaudin et al. (2018)’s study, 151 of the member candidates in NGC 2232 (blue) and 6 of the member candidates in the purple group (black circles in Figure 2 (b)) are identified as members of NGC 2232 in Cantat-Gaudin et al. (2018).
Kounkel & Covey (2019) applied an unsupervised machine learning techniques and identified 1900 star clusters and strings in the Galactic disk. The strings that they identified are co-moving groups with filamentary structures reaching up to 200 pc in length. They identified 328 strings with ages younger than 100 Myr in the Solar neighborhood. Kounkel & Covey (2019) classify NGC 2232 as a string spanning 40 degrees in the sky. The membership list of this NGC 2232 string in Kounkel & Covey (2019) cross-matches with 236 member candidates in LP 2439, 142 in NGC 2232, 32 candidates in the purple group, and 30 candidates in the green group (black crosses in Figure 2 (b)). Stars in strings are not only kinematically and spatially coherent, but also coeval. Kounkel & Covey (2019) suggest that the extended shape of strings are primordial structures that originated from giant molecular filaments (Zucker et al., 2018).
Unlike Kounkel & Covey (2019)’s claim, of a “lack of a central cluster” among strings, NGC 2232 and LP 2439 do not only stand out as two central clusters with significant overdensities in the space, but also show two distinct overdensities in the PM distribution (Figure 2 (d)). Their RV distributions slightly offset each other (Figure 2 (c)), with an average RV of 22.0 km s-1 and 25.4 km s-1 for LP 2439 and NGC 2232, respectively. The mean RV value obtained from Gaia DR 2 for NGC 2232 agrees well with the mean RV of 25.40 km s-1 that was measured by Jackson et al. (2020) using the Gaia-ESO Survey. Considering the coevality of the four groups, they were likely formed during the same star formation event in the same GMC. Two local high-density regions in the GMC formed clusters, NGC 2232 and LP 2439. The purple and green groups consist of stars formed along the primordial filaments associated with NGC 2232, since their PM distributions are similar to NGC 2232, instead of LP 2439 (Figure 2 (b)).
There is one member candidate in LP 2439 with a negative RV, 9.73 (the grey shaded bin in Figure 2 (c)), different from the majority in LP 2439. Considering its location along the binary sequence (the red outlined grey shaded asterisk in Figure 2 (a)), we conclude that it is a probable binary candidate. The other five member candidates with RV measurements are also binary candidates, being located along the binary sequence (filled asterisks in Figure 2 (a)). Further follow-up spectroscopy may further constrain the nature of these stars.
3.2 Evidence of Gas Expulsion
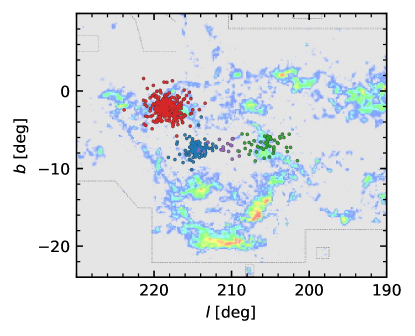
As indicated by the low reddening in NGC 2232 (Lyra et al., 2006), the gas content is very low in the region occupied by our member candidates. We over-plot member candidates on the map of a large scale CO survey of the Galactic plane (Dame et al., 2001, Figure 3). Towards the south of NGC 2232, are remarkably long and thin molecular filaments at and , which belong to the Orion cloud in the background (No. 27 in Table 1 in Dame et al., 2001, Figure 3) located at a distance of pc (Hirota et al., 2007; Menten et al., 2007). LP 2439 happens to overlap with the CO emission at (No. 31 in Table 1 in Dame et al., 2001, Figure 3), which is induced by molecular clouds at a distance of 12–18 kpc from the Galactic center (May et al., 1993). The Leiden-Dwingeloo 21-cm survey (Hartmann & Burton, 1997) also shows a very low column density of atomic hydrogen in the region of and . Therefore, the region at the distance of LP 2439, NGC 2232 and its related filamentary structures (the purple and green groups) can be considered free of gas and dust. This is direct evidence that the parental molecular gas from which the stars in NGC 2232 and LP 2439 were born, has already been expelled by supernovae and/or stellar winds. The two clusters enter a phase of violent relaxation after gas expulsion (see discussion in Section 5).
4 3D Morphology of NGC 2232 and LP 2439
4.1 Distance Correction
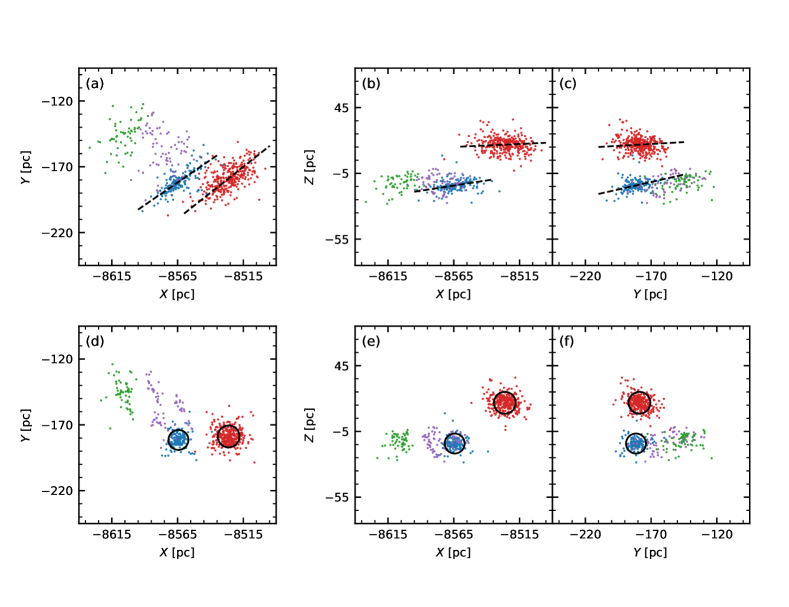
In Figure 4, panels (a) to (c), we show the 3D spatial distributions of member candidates in NGC 2232, in LP 2439, in the purple group, and in the green group. The shapes of these four groups are all stretched along the same direction: the line of sight (indicated with the black dashed lines). A similar phenomenon was observed in another star cluster, Blanco 1 (Zhang et al., 2020). This artificial elongation is generated by the distance computed by simply inverting the parallax, . The errors in the parallax measurements have a symmetric distribution function. After this reciprocation, the distance distribution becomes asymmetric. Member candidates in NGC 2232 and LP 2439 have ranging between mas and mas, respectively. In an earlier study, we performed Monte Carlo simulations to estimate the contribution of the error on the uncertainty in the evaluation of the , , and coordinates (Zhang et al., 2020). A typical of 0.19 mas (with a distance in the range pc), corresponds to an error of pc for our sample.
To correct for the pseudo-elongation generated by parallax errors, we follow the Bayesian inversion approach introduced by Bailer-Jones (2015). We compute the likelihood based on the measured parallax combined with its nominal error with a prior designed for star clusters and field stars. The prior assumes a Gaussian spatial distribution of the star cluster members, and an exponentially decreasing volume density for field stars (Bailer-Jones, 2015). We adopt the standard deviation of cluster-centric distance of individual stars as the scale radius of the Gaussian distribution. For each star, the field and the cluster prior are combined with weights proportional to the estimated membership probability, which we assume 95%, considering a 5% field star contamination rate (see Section 2.2). The corrected distance to each star is the mean value of the posterior distribution. A similar method has been applied to the star cluster M67 (Carrera et al., 2019, Appendix B); we refer to the latter work for further details on the method.
4.2 Interpretation of the 3D morphology
After having corrected the distance measurements obtained from the Bayesian method, we display the projection of member candidates onto the , and planes (Figure 4, panels (d) to (f)). The intrinsic shapes of NGC 2232 and LP 2439 are more or less spherical, while the purple and green groups resemble filamentary structures stretching out to distances up to 50 pc. Their association with NGC 2232 is further confirmed by the proximity in the spatial distribution. Similar filamentary structures have been found in previous studies. Jerabkova et al. (2019) discovered the Orion relic filament, which extends 90 pc in space and is coeval, at an age of 17 Myr. Additional 250 pc long filamentary structures with ages in the range of Myr were identified in the Vela OB2 region by Beccari et al. (2020). When assuming a prompt residual gas expulsion in a cluster with a star formation efficiency (SFE) of 1/3, a significantly elongated morphology will start to appear when star clusters are 80 Myr old (Dinnbier & Kroupa, 2020b). Galactic tides need at least 100 Myr to develop two symmetric tidal tails in star clusters (Dinnbier & Kroupa, 2020a). Therefore, the extended structures in both Orion and Vela OB2 are not tidal tails. This scenario is consistent with the observations that open clusters discovered with tidal tails have ages of at least 100 Myr (see Röser et al., 2019a, b; Tang et al., 2019; Zhang et al., 2020).
According to the numerical study of Dinnbier & Kroupa (2020b), a star cluster with an SFE of 1/3 and a phase of rapid gas expulsion (model C10G13), will have about 50% of unbound members (i.e., outside the tidal radius) at an age of 25 Myr. To test this scenario, we compute the tidal radii of NGC 2232 and LP 2439:
| (1) |
(Pinfield et al., 1998). Here, is the gravitational constant, is the total mass of the star cluster, and the parameters and are the Oort constants (, ; Bovy, 2017).
From the photometric masses of and , obtained using a 25 Myr isochrone, we compute tidal radii of and , for LP 2439 and NGC 2232, respectively. Errors are estimated from the 25 Myr isochrone with super-solar abundance (the black dotted curve in Figure 2 (a)). We assume that stars within the tidal radius are gravitationally bound to the star cluster, while those beyond the tidal radius are unbound. The tidal radius of LP 2439 is smaller than its half-mass radius of 8.8 pc, implying that more than half of the mass of the stellar grouping is gravitationally unbound. Note that the model cluster (model C10G13) in (Dinnbier & Kroupa, 2020b) is ten times more massive than LP 2439, therefore the required SFE should be higher to match the observed bound mass fraction in LP 2439 (48%). This implies that the scenario of an SFE higher than 1/3 and prompt gas expulsion may provide a good explanation of the observed properties of LP 2439.
NGC 2232, on the other hand, has a half-mass radius of 4.9 pc. Approximately 73% of its mass is gravitationally bound (i.e., within the tidal radius). For both LP 2439 and NGC 2232 we observe no tidal tails beyond the tidal radius. Instead, stars outside the tidal radius are more or less spherically distributed with respect to the cluster center.
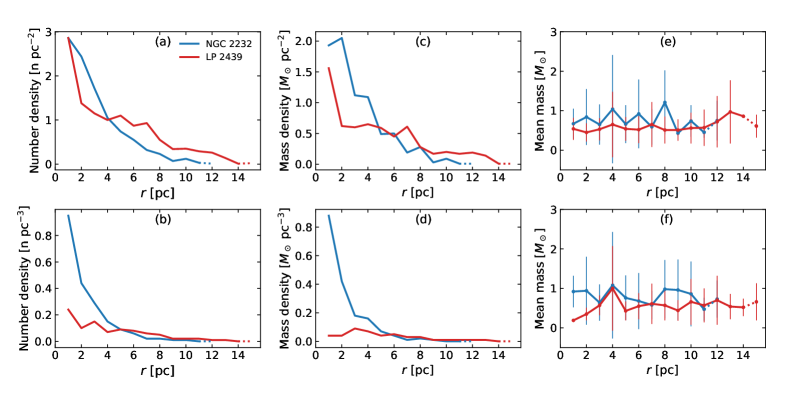
To further quantify the spatial distribution of the stars, we plot the radial distribution of the number density, the mass density, and the mean stellar mass within different annuli of the two star clusters in Figure 5. The surface number density profiles and surface mass density profiles are similar for both clusters, with higher values in the center and a decline toward larger radius (Figure 5 (a) and (c)). The volume number density profile and the volume mass density profile in NGC 2232 share similar trends as its surface number density profile and surface mass density profile (Figure 5 (b) and (d)). However, the case is quite different in LP 2439, where the volume number density profile and the volume mass density profile are both very shallow (almost flat); see Figure 5 (b) and (d). The members in LP 2439 has a larger number (315) than that of NGC 2232 (177), and a more extended spatial distribution (up to 32 pc) than NGC 2232 (up to 27 pc). The difference in surface and volume properties for LP 2439 originates in the projection effect of members located in larger 3D annuli onto 2D annuli.
The volume mass density of both NGC 2232 and LP 2439 are comparable to those of a “leaky cluster” (mass-loss cluster), as defined in Pfalzner (2009). A mass-loss cluster is undergoing mass loss through a range of processes (gas expulsion, stellar and dynamical evolution, and tidal field) and expands at a velocity of 2 pc Myr-1 at early times. The expansion is probably more significant in LP 2439 since its volume mass density is approaching the lower limit of the observed “leaky clusters” of 0.07 (Pfalzner, 2009). All identified members are brighter than the Gaia DR 2 photometric limit; deeper observations are therefore required to probe the contribution of faint members to the density profiles.
An inspection of the 2D and 3D spatial distribution of the member stars reveals no evidence of mass segregation in NGC 2232 and LP 2439 (see Figure 5 (e) and (f)). On the other hand, stars enclosed within the pc annulus are generally more massive, and have a somewhat larger dispersion.
5 Discussion
5.1 Expansions of LP 2439 and NGC 2232
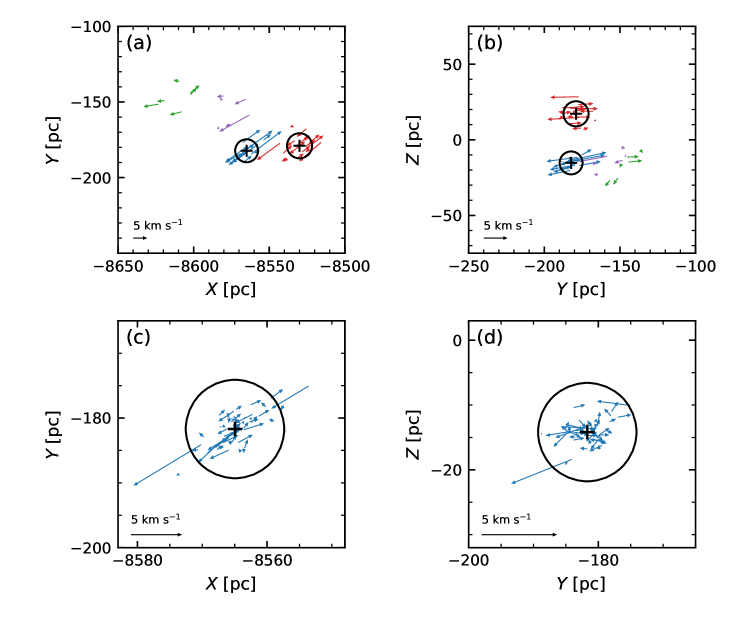
We investigate the expansion of LP 2439 and NGC 2232 using the 3D motions of the member stars (through combining PMs and RVs). Only 20 members in LP 2439 have RV measurements, and 17 in NGC 2232. We use the mean positions of the member candidates in each cluster as the respective cluster centers of LP 2439 and NGC 2232, and the mean velocity in each cluster as the reference frame, and present the relative 3D velocity in Figure 6 (a) and (b). For this analysis, we consider the purple and green groups associated with NGC 2232, and use the mean motion of NGC 2232 as the reference velocity for these groups.
It can be clearly seen that both clusters are expanding, as their members are moving away from the cluster center (Figure 6 (a) and (b)). However, the 3D velocity appears to be oriented primarily along the direction of the line-of-sight (see Figure 4). This can be explained by the orientation of the velocity error ellipsoid, of which the long axis is aligned with the line-of-sight. The typical error (median value) of Gaia DR 2 RV in our sample is 5.7 , while the typical error of proper motion is 0.25 . Therefore, the error of the 3D velocity is dominated by the RV error, and the 3D velocity ellipsoid is elongated along the line of sight. To reduce this effect, we include RV data of NGC 2232 from Jackson et al. (2020), who observed NGC 2232 using the Gaia ESO survey with an RV uncertainty of 0.4 . Among the members with membership probability larger than 90%, 51 members in Jackson et al. (2020) (blue vectors) cross-match with our members, which demonstrates the expansion within the tidal radius in NGC 2232 (see Figure 6 (c) and (d)). A similar expansion is found in the intermediate-age cluster Coma Berenices, for stars both within the tidal radius and those located in the tidal tails (Tang et al., 2019). Since LP 2439 is a newly-discovered star cluster, no high-resolution spectroscopic observations of its member stars are available as of yet.
The cluster expansion is initially spherically symmetric, until the gradient of the Galactic gravitational potential deflects the stellar orbits (Kroupa, 2005) and forms tidal tail-like structures. The spherical shapes of NGC 2232, and LP 2439 suggest that the Galactic tide has just started to affect the most distant candidates, and has not yet affected the global morphology of the star clusters. While majority of stars are moving outward, several members in both NGC 2232 and LP 2439 are falling back to the cluster, which may be a consequence of orbital epicyclic motions (Boily & Kroupa, 2003; Dinnbier & Kroupa, 2020a, b).
For a 25 Myr-old star cluster to spread over a region of 20 pc in size, an expansion velocity of at least 0.8 is required. The measured 3D velocity dispersion may be overestimated due to orbital motion in binary systems (e.g., Kouwenhoven & de Grijs, 2008). Since the latter affects RV measurements but not PMs, we compute the 2D velocity dispersion from PMs and obtain dispersions of 0.84 for LP 2439 and 0.62 for NGC 2232, with a typical error of 0.25 . Considering the above calculation of velocity dispersion, the loose spatial distributions in both clusters can be explained well by the expansion that started approximately Myr ago.
In addition to gas expulsion, two-body relaxation is another driver of expansion of the systems. This dynamical process drives massive stars to gradually sink to the cluster center, and lower-mass stars to migrate to the outskirts. However, the radial distribution of the mean stellar mass within different annuli does not show evidence of mass segregation (see Figure 5 (e) and (f)). Therefore, We propose that the expansion in both LP 2439 and NGC 2232 is mainly driven by gas expulsion, which has taken place on a time shorter than the initial timescale of mass segregation.
The gas expulsion effect often induces a gradient of velocity dispersion (Kroupa, 2005). The 2D velocity dispersion obtained from PMs does show a gradually increasing trend from the inner region towards the outskirts of the clusters. The 2D velocity dispersion starts at within tidal radius, and increases to outside tidal radius for LP 2439, and increases from to for NGC 2232. These results are consistent with the predictions of Parmentier & Baumgardt (2012) and Dinnbier & Kroupa (2020a) that an expanding population of stars driven by gas expulsion has a larger velocity dispersion than that of the population within tidal radius of the cluster, since escaping stars generally have “hotter” kinematics than the population of gravitationally-bound stars.
5.2 Different Fates of NGC 2232 and LP 2439
After gas expulsion, NGC 2232 and LP 2439 enter a phase of violent relaxation. Whether or not they can manage to be virialized again depends on the duration of the re-virialization process, which typically requires crossing times (Parker & Wright, 2016). To estimate how long it takes for cluster to be re-virialized, we compute the crossing time at the moment of gas expulsion, by assuming an initial cluster radius of 1 pc and adopting the 2D velocity dispersion obtained from proper motion (see Section 5.1). The crossing times are estimated as , where is the half-mass radius and is the 2D velocity dispersion obtained from proper motion (see Section 5.1). The crossing time of NGC 2232 is 1.6 Myr and that of LP 2439 is 1.2 Myr. Note that, as the velocity dispersion at the onset of gas expulsion is likely higher, the estimated crossing times provide upper limits. The age of 25 Myr corresponds to at least 17 in NGC 2232 and 21 in LP 2439. Considering the 73% bound mass and the unremarkable density profile (Figure 5), NGC 2232 may be in the process of re-virialization. On the other hand, with more than half of the mass unbound and a shallow volume density profile (Figure 5), LP 2439 is most likely in the process of dissolution.
Although NGC 2232 and LP 2439 originate from the same GMC, we witness two different dynamical fates, which stems from the different dynamical states right before the gas dispersal (Goodwin, 2009; Farias et al., 2018). Assuming the same timescale of gas expulsion and the same SFE in NGC 2232 and LP 2439, we may conclude that NGC 2232 is initially subvirial and substructured, supported by the observed associated filamentary structures. On the contrary, LP 2439 may be either in a virial or supervirial state before the onset of gas expulsion. Since LP 2439 is more massive, the gas expulsion timescale may be much faster in LP 2439 than in NGC 2232 considering stronger stellar feedback from massive stars. The faster gas expulsion, the faster the expansion of the cluster is. Therefore, this results in a lower survival rate of clusters (Kroupa et al., 2001; Baumgardt & Kroupa, 2007; Dinnbier & Kroupa, 2020b). Either scenario supports the dissolution of LP 2439. Bravi et al. (2018) measured radial velocities of three open clusters, IC 2602, IC 2391, and NGC 2547, in the age between 30 Myr and 50 Myr, and find that they are also expanding and dispersing. High-resolution spectroscopic data can be used to further constrain the dynamical history and fate of additional young star clusters in the Galactic field.
6 Summary
Utilizing high-precision Gaia DR 2 astrometry, we apply the cluster finding method, StarGO, to identify stellar structures around the NGC 2232, LP 2439 and their neighboring regions in the 5D phase space of stars (, ). Additional member cleaning is carried out using the location of the candidate members in the color-magnitude diagram. LP 2439 is a cluster newly discovered by Liu & Pang (2019) and in this study we quantify for the first time its dynamical state. Both clusters had their individual distance of member candidates corrected by a Bayesian method to further discuss their 3D morphology.
-
1.
We have identified four groupings of stars in the sample: the clusters NGC 2232 and LP 2439, as well as two neighboring filamentary structures related to NGC 2232. The identification of the member candidates of the two star clusters is in a good agreement with earlier studies. The ages of the four groups are consistent with an age of 25 Myr. This suggests that they all formed from the same GMC.
-
2.
The member stars in LP 2439 have an average distance of 289.1 pc, with the center at R.A.=, Decl.=, corresponding to Cartesian Galactocentric coordinates of () = (, , ) pc. The tidal radius (8.3 pc) of LP 2439 is smaller than its half-mass radius (8.8 pc). More than half of the mass in this cluster is gravitationally unbound.
-
3.
Member stars in NGC 2232 have an average distance of 323.0 pc, with the center at R.A.=, Decl.=, corresponding to Cartesian Galactocentric coordinates () = (, , ) pc. The tidal radius (7.6 pc) of NGC 2232 is larger than its half-mass radius (4.9 pc). More than 70% of the cluster’s mass is gravitationally bound. We identify two filamentary structures (which we refer to as the purple group and the green group) that are associated with NGC 2232.
-
4.
We observe no evidence of mass segregation among member candidates of LP 2439 and NGC 2232. We find an overall expansion in both star clusters, that is mainly driven by gas expulsion. The expansion generates a loose and roughly spherically symmetric spatial distribution of stars. We observe a shallow volume number density profile and volume mass density profile for LP 2439.
-
5.
Although NGC 2232 and LP 2439 are formed in the same GMC, our analysis suggests that these two star clusters will have different dynamical futures. LP 2439 is undergoing violent dissolution, while NGC 2232 may be in the process of re-virialization. We propose that this reflects different initial dynamical states prior to gas expulsion in the two clusters. We propose two possibilities to explain why how these star clusters have ended up in their current states: (i) prior to gas removal, NGC 2232 may have been substructured and subvirial, while at the same time, LP 2439 may have been either in virial equilibrium or supervirial; or (ii) gas expulsion in LP 2439 occurred at a much faster rate than in NGC 2232.
References
- Adams (2000) Adams, F. C. 2000, ApJ, 542, 964
- Astropy Collaboration et al. (2013) Astropy Collaboration, Robitaille, T. P., Tollerud, E. J., et al. 2013, A&A, 558, A33
- Astropy Collaboration et al. (2018) Astropy Collaboration, Price-Whelan, A. M., Sipőcz, B. M., et al. 2018, AJ, 156, 123
- Bailer-Jones (2015) Bailer-Jones, C. A. L. 2015, PASP, 127, 994
- Banerjee & Kroupa (2013) Banerjee, S., & Kroupa, P. 2013, ApJ, 764, 29
- Baumgardt & Kroupa (2007) Baumgardt, H., & Kroupa, P. 2007, MNRAS, 380, 1589
- Beccari et al. (2020) Beccari, G., Boffin, H. M. J., & Jerabkova, T. 2020, MNRAS, 491, 2205
- Boily & Kroupa (2003) Boily, C. M., & Kroupa, P. 2003, MNRAS, 338, 665
- Bovy (2017) Bovy, J. 2017, MNRAS, 468, L63
- Bravi et al. (2018) Bravi, L., Zari, E., Sacco, G. G., et al. 2018, A&A, 615, A37
- Brinkmann et al. (2017) Brinkmann, N., Banerjee, S., Motwani, B., et al. 2017, A&A, 600, A49
- Cantat-Gaudin et al. (2018) Cantat-Gaudin, T., Jordi, C., Vallenari, A., et al. 2018, A&A, 618, A93.
- Carrera et al. (2019) Carrera, R., Pasquato, M., Vallenari, A., et al. 2019, A&A, 627, A119
- Claria (1972) Claria, J. J. 1972, A&A, 19, 303
- Cottaar et al. (2012) Cottaar, M., Meyer, M. R., Andersen, M., et al. 2012, A&A, 539, A5
- Cropper et al. (2018) Cropper, M., Katz, D., Sartoretti, P., et al. 2018, A&A, 616, A5
- Currie et al. (2008) Currie, T., Plavchan, P., & Kenyon, S. J. 2008, ApJ, 688, 597
- Dame et al. (2001) Dame, T. M., Hartmann, D., & Thaddeus, P. 2001, ApJ, 547, 792
- de Grijs & Goodwin (2008) de Grijs, R., & Goodwin, S. P. 2008, MNRAS, 383, 1000
- Dinnbier & Kroupa (2020b) Dinnbier, F., & Kroupa, P. 2020, arXiv e-prints, arXiv:2007.00036
- Dinnbier & Kroupa (2020a) Dinnbier, F., & Kroupa, P. 2020, arXiv e-prints, arXiv:2006.14087
- Farias et al. (2018) Farias, J. P., Fellhauer, M., Smith, R., et al. 2018, MNRAS, 476, 5341
- Farias et al. (2015) Farias, J. P., Smith, R., Fellhauer, M., et al. 2015, MNRAS, 450, 2451
- Gaia Collaboration et al. (2018a) Gaia Collaboration, Babusiaux, C., van Leeuwen, F., et al. 2018, A&A, 616, A10
- Gaia Collaboration et al. (2018b) Gaia Collaboration, Brown, A. G. A., Vallenari, A., et al. 2018, A&A, 616, A1
- Goodwin (2009) Goodwin, S. P. 2009, Ap&SS, 324, 259
- Goodwin & Bastian (2006) Goodwin, S. P., & Bastian, N. 2006, MNRAS, 373, 752
- Hartmann & Burton (1997) Hartmann, D., & Burton, W. B. 1997, Cambridge, UK, Cambridge Univ. Press, 243
- Hirota et al. (2007) Hirota, T., Bushimata, T., Choi, Y. K., et al. 2007, PASJ, 59, 897
- Hills (1980) Hills, J. G. 1980, ApJ, 235, 986
- Jackson et al. (2020) Jackson, R. J., Jeffries, R. D., Wright, N. J., et al. 2020, MNRAS, doi:10.1093/mnras/staa1749
- Jerabkova et al. (2019) Jerabkova, T., Boffin, H. M. J., Beccari, G., et al. 2019, MNRAS, 489, 4418
- Juarez et al. (2014) Juarez, A. J., Cargile, P. A., James, D. J., & Stassun, K. G. 2014, ApJ, 795, 143
- Kounkel & Covey (2019) Kounkel, M., & Covey, K. 2019, AJ, 158, 122
- Kouwenhoven & de Grijs (2008) Kouwenhoven, M. B. N., & de Grijs, R. 2008, A&A, 480, 103
- Kroupa (2005) Kroupa, P. 2005, The Three-dimensional Universe with Gaia, 629
- Kroupa et al. (2001) Kroupa, P., Aarseth, S., & Hurley, J. 2001, MNRAS, 321, 699
- Lada & Lada (2003) Lada, C. J., & Lada, E. A. 2003, ARA&A, 41, 57
- Levato & Malaroda (1974) Levato, H., & Malaroda, S. 1974, AJ, 79, 890
- Lindegren et al. (2018) Lindegren, L., Hernández, J., Bombrun, A., et al. 2018, A&A, 616, A2
- Liu & Pang (2019) Liu, L., & Pang, X. 2019, ApJS, 245, 32
- Lynden-Bell (1967) Lynden-Bell, D. 1967, MNRAS, 136, 101
- Lyra et al. (2006) Lyra, W., Moitinho, A., van der Bliek, N. S., et al. 2006, A&A, 453, 101
- May et al. (1993) May, J., Bronfman, L., Alvarez, H., et al. 1993, A&AS, 99, 105
- Menten et al. (2007) Menten, K. M., Reid, M. J., Forbrich, J., et al. 2007, A&A, 474, 515
- Millman et al. (2011) Millman, K. J., Aivazis, M.. 2011, Computing in Science & Engineering, 13, 2, 9
- Moeckel et al. (2012) Moeckel, N., Holland, C., Clarke, C. J., et al. 2012, MNRAS, 425, 450
- Monroe & Pilachowski (2010) Monroe, T. R., & Pilachowski, C. A. 2010, AJ, 140, 2109
- Pang et al. (2013) Pang, X., Grebel, E. K., Allison, R. J., et al. 2013, ApJ, 764, 73
- Pang et al. (2011) Pang, X., Pasquali, A., & Grebel, E. K. 2011, AJ, 142, 132
- Parker & Wright (2016) Parker, R. J., & Wright, N. J. 2016, MNRAS, 457, 3430
- Parmentier & Pfalzner (2013) Parmentier, G., & Pfalzner, S. 2013, A&A, 549, A132
- Parmentier & Baumgardt (2012) Parmentier, G. & Baumgardt, H. 2012, MNRAS, 427, 1940
- Pfalzner (2009) Pfalzner, S. 2009, A&A, 498, L37
- Pinfield et al. (1998) Pinfield, D. J., Jameson, R. F., & Hodgkin, S. T. 1998, MNRAS, 299, 955
- Röser et al. (2019b) Röser, S., Schilbach, E., & Goldman, B. 2019, A&A, 621, L2
- Röser et al. (2019a) Röser, S., Schilbach, E., & Goldman, B. 2019, A&A, 621, L2
- Rybizki et al. (2018) Rybizki, J., Demleitner, M., Fouesneau, M., et al. 2018, PASP, 130, 74101.
- Scandariato et al. (2011) Scandariato, G., Robberto, M., Pagano, I., et al. 2011, A&A, 533, A38
- Shukirgaliyev et al. (2017) Shukirgaliyev, B., Parmentier, G., Berczik, P., et al. 2017, A&A, 605, A119
- Tang et al. (2019) Tang, S.-Y., Pang, X., Yuan, Z., et al. 2019, ApJ, 877, 12
- Taylor (2005) Taylor, M. B. 2005, Astronomical Data Analysis Software and Systems XIV, 29
- Weiler (2018) Weiler, M. 2018, A&A, 617, A138
- Yuan et al. (2018) Yuan, Z., Chang, J., Banerjee, P., et al. 2018, ApJ, 863, 26
- Zhang et al. (2020) Zhang, Y., Tang, S.-Y., Chen, W. P., et al. 2020, ApJ, 889, 99
- Zucker et al. (2018) Zucker, C., Battersby, C., & Goodman, A. 2018, ApJ, 864, 153