Magnetic, transport, and thermal properties of -phase UZr2
Abstract
Alloys of hexagonal -phase UZr2 have been synthesized and studied by means of heat capacity, magnetic susceptibility, magnetization, electrical resistivity, magnetoresistance, thermoelectric power, thermal conductivity measurements, for the first time, at temperatures from 1.8 to 300 K and in magnetic fields up to 8 T. The weak temperature dependence of the magnetic susceptibility and the small value of both Seebeck (0.75 V/K at room temperature) and of the Sommerfeld coefficient (13.5 mJ mol-1 K-2) point to 5-electrons in this material having a delocalized nature. The electrical resistivity and magnetoresistance indicate the presence of significant electronic disorder in -UZr2, consistent with the disorder in its crystal structure. Density functional theory calculations have been performed and compared to experimental results.
I Introduction
Actinide systems show a large variety of exotic behavior coming from 5-ligand hybridization. Depending on the strength of this process, unusual behavior has been observed in both actinide metals and alloys Moore and van der Laan (2009); Stewart (1984); Sarrao et al. (2002); Aoki et al. (2007); Gofryk et al. (2009). The binary U system in particular is an interesting playground for exploring behavior originating from the dual nature of 5-electrons, and a focus area for search for new electronic phenomena in actinide materials. As shown in Figure 1, the properties of these alloys vary from correlated magnetism, via spin fluctuations, to unconventional superconductivity. For example, USb2 shows both itinerant and localized characters of 5-electrons Guziewicz et al. (2004) with an antiferromagnetic (AFM) ordering below = 203 K Amoretti et al. (1984); Qi et al. (2013), while UAl2 exhibits delocalized 5-states and spin fluctuations Wire et al. (1984). More recently, Ran reported the discovery of spin-triplet superconductivity in UTe2, featuring a transition temperature of 1.6 K and a very large and anisotropic upper critical field exceeding 40 T Ran et al. (2019). For -UZr2, despite some information in the literature on its crystal structure and phase transformations Akabori et al. (1992); Basak et al. (2011); Paukov et al. (2018), its electronic, transport, and magnetic properties are mostly unknown.
Recently, there has been a renewed interest in the U-Zr system due to its technological importance as a promising metallic nuclear fuel. The intermediate phase is formed on cooling from the high temperature phase. Akabori . determined the homogeneity range of the phase, which is 64.2-78.2 at% Zr at 600 ∘C and 66.5-80.2 at% Zr at 550 ∘C Akabori et al. (1992). In the uranium-rich range of the U-Zr phase diagram, transmission electron microscopy (TEM) studies also reveal the coexistence of the and phases with an alternating lamellar structure McKeown et al. (2013). The phase has hexagonal structure with the lattice parameters = 5.034 and = 3.094 Basak et al. (2011). According to high-resolution neutron diffraction measurements Akabori et al. (1995) and density-functional calculations Landa et al. (2009), the corner (0, 0, 0) sites are occupied solely by the Zr atoms, whereas the two inner positions at (, , ) and (, , ) are randomly shared by U and Zr atoms, characteristic of disordered structures.
In this paper, we focus on the physical properties of -UZr2, for the first time, measured from 1.8 to 300 K and under magnetic fields up to 8 T. We show that all results obtained strongly point to the presence of delocalized 5-electrons in this material. Furthermore, the transport properties show characteristics typical of disordered metallic systems. We also performed electronic structure calculations and compare the results to experimental measurements.
II Experimental details
Polycrystalline samples with nominal compositions -UZr2 were synthesized by arc melting stoichiometric amounts of the elements in a Zr-gettered ultra-pure argon atmosphere Yao et al. (2020). The samples were examined by TEM and x-ray diffraction measurements. The crystal structure is shown to be hexagonal with the AlB2 structure type, S.G. P6/mmm with the lattice parameters = 5.036 and = 3.094 . The values of the lattice parameters are very close to those derived previously Basak et al. (2011). Also, no other diffraction peaks than expected for AlB2 of the structure were observed. Magnetization, resistivity, heat capacity, Seebeck effect, and thermal conductivity measurements have been performed using a Quantum Design PPMS DynaCool-9 system equipped with a 9 T superconducting magnet with VSM, ETO, HCP and TTO options. Density Functional Theory (DFT) calculations within the Local Density Approximation (LDA) Perdew and Zunger (1981) were performed using the Projector Augmented Wave (PAW) method Blöchl (1994); Kresse and Joubert (1999), as implemented in the VASP code Kresse and Hafner (1993, 1994); Kresse and Furthmüller (1996a, b). A plane wave basis with a kinetic energy cutoff of 520 eV was employed. We used a -centered k-point mesh of 202020. The crystal structure was relaxed, yielding lattice parameters of , , and , where = 5.12036Å, = 2.78937Å.
III Results and discussion
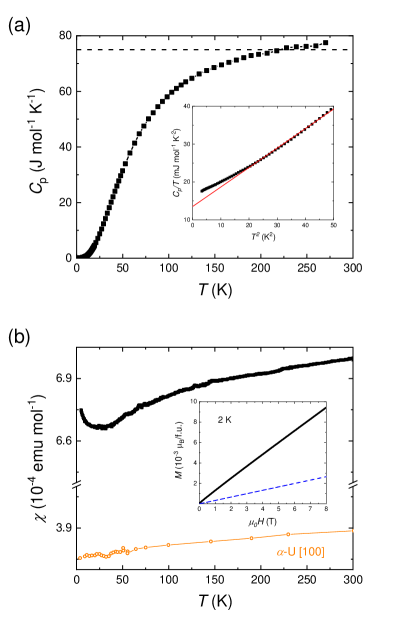
The temperature dependence of the heat capacity of -UZr2 measured from 1.8 to 270 K is shown in Fig. 2(a). At 270 K, the value of is close to 77.5 J mol-1 K-1. This value is slightly higher than the theoretical Dulong-Petit limit 3 = 74.8 J mol-1 K-1, where is the number of atoms per formula unit (f.u.) and is the gas constant. The inset shows the low-temperature heat capacity plotted as vs. . The red line is a fit of , where is the Sommerfeld coefficient that is proportional to the electronic DOS, and is a term related to the Debye temperature. A small deviation from the fit occurs below 4 K, which might indicate the presence of some additional low-energy excitations. The value obtained from the fit is 13.5 mJ mol-1 K-2. An estimation of the electronic heat capacity () at 270 K gives 3.6 J mol-1 K-1, which is close to the deviation 2.7 J mol-1 K-1 observed at 270 K. This indicates that the 5-electrons in the phase are only weakly correlated. The electronic DOS at the Fermi energy calculated by expression is about 5.7 states/(eV f.u.), where is Boltzmann constant and represents the Avogadro number. The Debye temperature of -UZr2 can be derived by the formula and equals to 225 K.
Figure 2(b) shows the temperature dependence of the magnetic susceptibility of -UZr2, measured from 5 to 300 K in magnetic field of 5 T. The shows a weak temperature dependence with no sign of magnetic phase transitions. Below 25 K an upturn is present, presumably due to the existence of very small amounts of paramagnetic impurities in the samples (most probably lanthanides), which follows the Curie-Weiss law. For comparison (marked by orange circles), we have also included the temperature dependence of the magnetic susceptibility of an -U single crystal along [100] (extracted from Ref. Ross and Lam (1968)). As can be seen, the magnetic susceptibility of -U is of the Pauli-type, which shows a very little temperature dependence with a small decrease as the temperature decreases across the whole temperature range. Ross and Lam suggested that the change of might be due to changes in the relative positions of the Brillouin zones and the Fermi surface as the sample contracts anisotropically with decreasing temperature Ross and Lam (1968). The overall magnitude and temperature dependence of the magnetic susceptibility of -UZr2 is similar to that of -U metal. In addition, the magnetic susceptibility of -UZr2 is larger than that of -U. This might indicate the presence of a slightly larger density of states (DOS) in -UZr2 than in -U. The inset displays the magnetic field dependence of magnetization measured at 2 K. The magnetic moment induced at 8 T is only 0.01 , suggesting delocalized 5-electrons. Take into account obtained above and using the free electron Fermi gas model, the zero-temperature Pauli magnetization could be calculated with , where is the vacuum permeability. As displayed by the blue dashed line, the so-obtained is compared to the measured magnetization of -UZr2. The underestimation of might be related to the presence of the small amount of paramagnetic impurities that are not taken into account in this analysis.
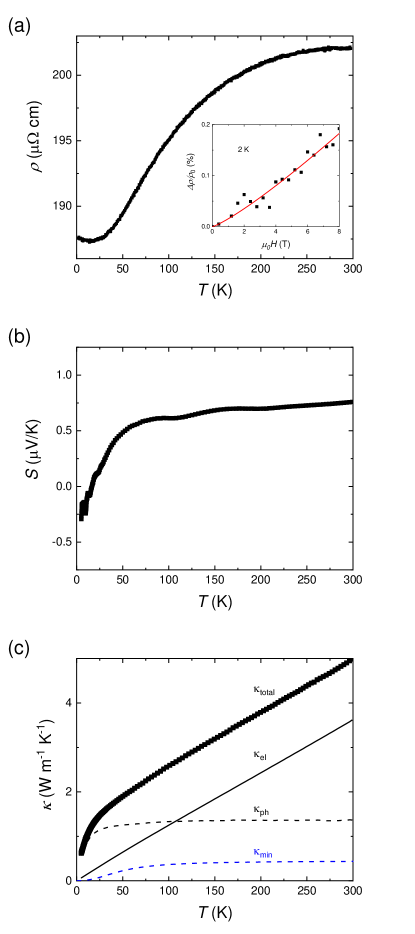
Temperature dependence of the electrical resistivity of -UZr2 is shown in Fig. 3(a). The overall shape and magnitude of is typical for uranium intermetallic compounds Brodsky et al. (1976); Antonio et al. (2018). The residual-resistivity ratio (RRR), defined as is low and estimated to be 1.05. This indicates that -UZr2 is an electronically disordered system, consistent with disorder in its crystal structure. In general, the low-temperature electron scattering on defects and dislocations results in just a shift in the electrical resistivity towards higher value and hence lowering the RRR value. It will not, however, affect the temperature dependence of resistivity. Besides the -shaped Brodsky et al. (1976), there is an upturn at low temperatures with the resistivity minimum at 15 K. The low-temperature resistivity upturn, observed in 4- and 5-electron materials is usually associated with Kondo effect Stankiewicz et al. (2012); Kuwai and Miyako (1994). However, in -UZr2, this seems to be unlikely because the magnetic susceptibility shows no signatures of localized 5-electrons and the magnetoresistance (MR) is small and positive (see below). Interestingly, the low-temperature resistivity upturn and positive MR have also been observed in ThAsSe Anders et al. (1997) and -As-Se ( = Zr, Hf, Th) phases Cichorek et al. (2010). Such behavior has been interpreted as a signature of the non-magnetic Kondo effect. However, to draw any firm conclusions on the nature of the low temperature behavior in this material, more studies are required. The inset of Fig. 3(a) shows the magnetic field dependence of MR, defined as , where is the resistivity under zero magnetic field. The value of MR exhibits a very weak field dependence and, at 2 K and 8 T, it reaches only 0.2%. The red line is a fit of to the experimental data, where and are fitting parameters. The analysis gives = 1.2 which is smaller than the value of 2 that is observed in normal metals.
Fig. 3(b) shows the temperature dependence of the Seebeck coefficient . The overall behavior and magnitude of is characteristic of metallic materials. The positive value of the Seebeck coefficient might indicate that hole-type carriers dominate the electrical and heat transport. In addition, assuming a single-band model and scattering from atomic disorder being dominant at high temperatures, the Fermi energy can be approximated by . This gives a value of = 9.78 eV being similar to those characterizing simple metals Bernard (1972). The estimated effective carrier concentration is of the order of 1028 m-3.
The thermal conductivity measured at room temperature is 5 W m-1 K-1, as shown in Fig. 3(c). In intermetallic samples, the thermal conductivity is the sum of electron and phonon contributions: . The solid line shows the temperature dependence of thermal conductivity of electrons, which is calculated by the formula , where is Lorentz number. After subtraction, the temperature dependence of the phonon contribution is shown as the dotted line. In the context of the presence of the atomic disorder in -UZr2 and its impact on thermal transport, it is worthwhile to compare the measured lattice thermal conductivity to the theoretically achievable minimum of the phonon contribution to the total thermal conductivity. If no distinction is made between the transverse and longitudinal acoustic phonon modes, the latter may be expressed by Cahill and Pohl (1989):
| (1) |
where . In the the above equation, is the phonon frequency, is the number of atoms per unit volume, and is the reduced Planck constant, respectively. By taking into account = 225 K and = 4.4 1028 m-3 appropriate for -UZr2, the obtained curve is shown in Fig. 3(c).
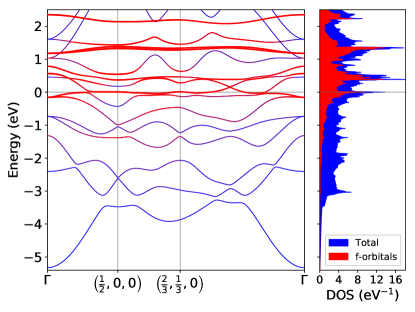
In order to gain insight into the electronic structure, we perform baseline calculations using DFT within LDA. Since the electronic correlations are not very strong in -UZr2 (as indicated by the relatively low value of Sommerfeld coefficient), this approach should give us an overall picture of the electronic structure in this material. We first note that DFT predicts a magnetic instability, in contradiction with experiments. The presence of magnetism within DFT suggests that local correlations will be relevant, and a detailed exploration of this is beyond our current scope. We restrict ourselves to the non-spin-polarized state, and characterize the electronic structure at this level. DFT results for the 5-projected electronic band structure and DOS are provided in Figure 4, where the width of the red points denotes the degree of 5-projection of the Kohn-Sham Eigenvector. The relatively flat -bands lead to large peaks in the DOS; one of which is nearly at the Fermi energy. The total DOS at the Fermi energy is approximately 12.3 states/(eV f.u.), larger than the experimental value of 5.7 states/(eV f.u.), though allowing magnetism and/or disorder would greatly reduce this value. This key comparison between experimental and theoretical results point to future work, using more sophisticated analysis such as DFT + DMFT (together with disorder effects), to properly capture the nonmagnetic, metallic state in this system.
IV Conclusions
In summary, we report on the magnetic, transport, and thermal properties of the -phase UZr2, for the first time, measured from 1.8 to 300 K and under magnetic fields up to 8 T. All the results obtained, especially a Pauli type of magnetic susceptibility, small Seebeck and Sommerfeld coefficient strongly point to the presence of delocalized 5-electrons in this material. Transport properties, especially the small RRR value, are indicative of electronic disorder in this metallic system, consistent with its disordered crystal structure. We also performed electronic structure calculations and compare the results to experimentally obtained for the total DOS at the Fermi energy. Although the calculations support the presence of the delocalized 5 states in -UZr2, some discrepancies exists, mainly due to the effects of strong electronic correlations that are not sufficiently captured by the LDA.
V Acknowledgments
This work was supported by the US DOE BES Energy Frontier Research Centre ”Thermal Energy Transport under Irradiation” (TETI). The electronic structure calculations have been performed using resources of the National Energy Research Scientific Computing Center, a DOE Office of Science User Facility supported by the Office of Science of the U.S. Department of Energy under Contract No. DE-AC02-05CH11231.
References
- Moore and van der Laan (2009) K. T. Moore and G. van der Laan, Rev. Mod. Phys. 81, 235 (2009).
- Stewart (1984) G. R. Stewart, Rev. Mod. Phys. 56, 755 (1984).
- Sarrao et al. (2002) J. L. Sarrao, L. A. Morales, J. D. Thompson, B. L. Scott, G. R. Stewart, F. Wastin, J. Rebizant, P. Boulet, E. Colineau, and G. H. Lander, Nature 420, 297 (2002).
- Aoki et al. (2007) D. Aoki, Y. Haga, T. D. Matsuda, N. Tateiwa, S. Ikeda, Y. Homma, H. Sakai, Y. Shiokawa, E. Yamamoto, A. Nakamura, R. Settai, and Y. Ōnuki, Journal of the Physical Society of Japan 76, 063701 (2007), https://doi.org/10.1143/JPSJ.76.063701 .
- Gofryk et al. (2009) K. Gofryk, J.-C. Griveau, E. Colineau, J. P. Sanchez, J. Rebizant, and R. Caciuffo, Phys. Rev. B 79, 134525 (2009).
- Guziewicz et al. (2004) E. Guziewicz, T. Durakiewicz, M. T. Butterfield, C. G. Olson, J. J. Joyce, A. J. Arko, J. L. Sarrao, D. P. Moore, and L. Morales, Phys. Rev. B 69, 045102 (2004).
- Amoretti et al. (1984) G. Amoretti, A. Blaise, and J. Mulak, Journal of Magnetism and Magnetic Materials 42, 65 (1984).
- Qi et al. (2013) J. Qi, T. Durakiewicz, S. A. Trugman, J.-X. Zhu, P. S. Riseborough, R. Baumbach, E. D. Bauer, K. Gofryk, J.-Q. Meng, J. J. Joyce, A. J. Taylor, and R. P. Prasankumar, Phys. Rev. Lett. 111, 057402 (2013).
- Wire et al. (1984) M. S. Wire, J. D. Thompson, and Z. Fisk, Phys. Rev. B 30, 5591 (1984).
- Ran et al. (2019) S. Ran, C. Eckberg, Q.-P. Ding, Y. Furukawa, T. Metz, S. R. Saha, I.-L. Liu, M. Zic, H. Kim, J. Paglione, and N. P. Butch, Science 365, 684 (2019).
- Akabori et al. (1992) M. Akabori, A. Itoh, T. Ogawa, F. Kobayashi, and Y. Suzuki, Journal of Nuclear Materials 188, 249 (1992).
- Basak et al. (2011) C. Basak, S. Neogy, D. Srivastava, G. Dey, and S. Banerjee, Philosophical Magazine 91, 3290 (2011).
- Paukov et al. (2018) M. Paukov, I. Tkach, F. Huber, T. Gouder, M. Cieslar, D. Drozdenko, P. Minarik, and L. Havela, Applied Surface Science 441, 113 (2018).
- McKeown et al. (2013) J. McKeown, S. Irukuvarghula, S. Ahn, M. Wall, L. Hsiung, S. McDeavitt, and P. Turchi, Journal of Nuclear Materials 436, 100–104 (2013).
- Akabori et al. (1995) M. Akabori, T. Ogawa, A. Itoh, and Y. Morii, Journal of Physics: Condensed Matter 7, 8249 (1995).
- Landa et al. (2009) A. Landa, P. Söderlind, and P. E. Turchi, Journal of Alloys and Compounds 478, 103 (2009).
- Lin and Kaufmann (1957) S. T. Lin and A. R. Kaufmann, Phys. Rev. 108, 1171 (1957).
- Ott et al. (1986) H. Ott, F. Hulliger, P. Delsing, H. Rudigier, and Z. Fisk, Journal of the Less Common Metals 124, 235 (1986).
- Paolasini et al. (1996) L. Paolasini, G. H. Lander, S. M. Shapiro, R. Caciuffo, B. Lebech, L.-P. Regnault, B. Roessli, and J.-M. Fournier, Phys. Rev. B 54, 7222 (1996).
- Mentink et al. (1992) S. Mentink, G. Nieuwenhuys, and J. Mydosh, Journal of Magnetism and Magnetic Materials 104-107, 697 (1992).
- Zentko et al. (1980) A. Zentko, J. Hřebík, J. Šternberk, and J. Turán, Physica B+C 102, 269 (1980).
- Brodsky et al. (1976) M. B. Brodsky, R. J. Trainor, A. J. Arko, and H. V. Culbert, AIP Conference Proceedings 29, 317 (1976), https://aip.scitation.org/doi/pdf/10.1063/1.30644 .
- Fournier et al. (1986) J. Fournier, A. Boeuf, P. Frings, M. Bonnet, J. Boucherle, A. Delapalme, and A. Menovsky, Journal of the Less Common Metals 121, 249 (1986), proceedings of Actinides 85, Aix en Provence - Part I.
- Frings et al. (1983) P. Frings, J. Franse, F. de Boer, and A. Menovsky, Journal of Magnetism and Magnetic Materials 31-34, 240 (1983).
- Pöttgen et al. (1996) R. Pöttgen, V. H. Tran, R.-D. Hoffmann, D. Kaczorowski, and R. Troc, J. Mater. Chem. 6, 429 (1996).
- Svanidze et al. (2019) E. Svanidze, A. Amon, R. Borth, Y. Prots, M. Schmidt, M. Nicklas, A. Leithe-Jasper, and Y. Grin, Phys. Rev. B 99, 220403(R) (2019).
- Kolomiets et al. (2015) A. V. Kolomiets, J.-C. Griveau, J. Prchal, A. V. Andreev, and L. Havela, Phys. Rev. B 91, 064405 (2015).
- Dancausse et al. (1992) J.-P. Dancausse, E. Gering, S. Heathman, U. Benedict, L. Gerward, S. S. Olsen, and F. Hulliger, Journal of Alloys and Compounds 189, 205 (1992).
- MATSUI (1972) H. MATSUI, Journal of Nuclear Science and Technology 9, 185 (1972).
- Remschnig et al. (1992) K. Remschnig, T. L. Bihan, H. Noël, and P. Rogl, Journal of Solid State Chemistry 97, 391 (1992).
- Ōnuki et al. (1992) Y. Ōnuki, I. Ukon, S. Won Yun, I. Umehara, K. Satoh, T. Fukuhara, H. Sato, S. Takayanagi, M. Shikama, and A. Ochiai, Journal of the Physical Society of Japan 61, 293 (1992), https://doi.org/10.1143/JPSJ.61.293 .
- Boulet and Noël (1998) P. Boulet and H. Noël, Solid State Communications 107, 135 (1998).
- Jones et al. (1952) W. M. Jones, J. Gordon, and E. A. Long, The Journal of Chemical Physics 20, 695 (1952), https://doi.org/10.1063/1.1700518 .
- Ikeda et al. (2008) S. Ikeda, H. Sakai, T. Matsuda, N. Tateiwa, A. Nakamura, E. Yamamoto, D. Aoki, Y. Homma, Y. Shiokawa, M. Hedo, Y. Uwatoko, Y. Haga, and Y. Ōunki, Physica B: Condensed Matter 403, 893 (2008).
- Shlyk et al. (1995) L. Shlyk, R. Troć, and D. Kaczorowski, Journal of Magnetism and Magnetic Materials 140-144, 1435 (1995), international Conference on Magnetism.
- Yao et al. (2020) T. Yao, A. R. Wagner, X. Liu, A. EI-Azab, J. M. Harp, J. Gan, D. H. Hurley, M. T. Benson, and L. He, Materialia 9, 100592 (2020).
- Perdew and Zunger (1981) J. P. Perdew and A. Zunger, Phys. Rev. B 23, 5048 (1981).
- Blöchl (1994) P. E. Blöchl, Phys. Rev. B 50, 17953 (1994).
- Kresse and Joubert (1999) G. Kresse and D. Joubert, Phys. Rev. B 59, 1758 (1999).
- Kresse and Hafner (1993) G. Kresse and J. Hafner, Phys. Rev. B 47, 558 (1993).
- Kresse and Hafner (1994) G. Kresse and J. Hafner, Phys. Rev. B 49, 14251 (1994).
- Kresse and Furthmüller (1996a) G. Kresse and J. Furthmüller, Computational Materials Science 6, 15 (1996a).
- Kresse and Furthmüller (1996b) G. Kresse and J. Furthmüller, Phys. Rev. B 54, 11169 (1996b).
- Ross and Lam (1968) J. W. Ross and D. J. Lam, Phys. Rev. 165, 617 (1968).
- Antonio et al. (2018) D. J. Antonio, K. Shrestha, J. M. Harp, C. A. Adkins, Y. Zhang, J. Carmack, and K. Gofryk, Journal of Nuclear Materials 508, 154 (2018).
- Stankiewicz et al. (2012) J. Stankiewicz, M. Evangelisti, Z. Fisk, P. Schlottmann, and L. P. Gor’kov, Phys. Rev. Lett. 108, 257201 (2012).
- Kuwai and Miyako (1994) T. Kuwai and Y. Miyako, Journal of the Physical Society of Japan 63, 3808 (1994), https://doi.org/10.1143/JPSJ.63.3808 .
- Anders et al. (1997) F. B. Anders, M. Jarrell, and D. L. Cox, Phys. Rev. Lett. 78, 2000 (1997).
- Cichorek et al. (2010) T. Cichorek, L. Bochenek, Z. Henkie, M. Schmidt, A. Czulucki, R. Kniep, and F. Steglich, Phys. Status Solidi B 24, 586 (2010).
- Bernard (1972) R. D. Bernard, Thermoelectricity in Metals and Alloys (Taylor and Francis, London, 1972).
- Cahill and Pohl (1989) D. G. Cahill and R. Pohl, Solid State Communications 70, 927 (1989).