Activity Detection from Encrypted Remote Desktop Protocol Traffic
Abstract
An increasing amount of Internet traffic has its content encrypted. We address the question of whether it is possible to predict the activities taking place over an encrypted channel, in particular Microsoft’s Remote Desktop Protocol. We show that the presence of five typical activities can be detected with precision greater than 97% and recall greater than 94% in 30-second traces. We also show that the design of the protocol exposes fine-grained actions such as keystrokes and mouse movements which may be leveraged to reveal properties such as lengths of passwords.
I Introduction
One response to the obvious security weaknesses of networks is to encrypt the payloads of packet traffic. It was estimated in 2018 that encryption was used in more than 70% of network communications [21] but the rate of penetration is quite variable because of the cost and complexity of public key infrastructure, particularly for small enterprises. We explore the question of how much can be detected about interactions, even when payloads are encrypted. In particular, we are concerned with activity detection: what is a user doing?
There are some legitimate reasons to be able to answer this question: determining usage to insure adequate provisioning, for example. It is also important to know how much an adversary could infer [34]. We focus on the Microsoft Remote Desktop Protocol (RDP), a popular protocol that provides an encrypted channel between a client and a host, allowing remote work on the host [10]. Five major interactions occur between client and host: file download, browsing on the host (i.e. a mixture of viewing, typing, and using the mouse), using an editor on the host, watching a video, and copying content from host to client or vice versa using the clipboard.
We show that, even though all traffic is encrypted, it is possible to detect which of these activities is underway from the traffic properties, even if two or more simultaneous activities are occurring. A heterogeneous ensemble classifier achieves precision greater than 97% and recall greater than 94%. We also discover that there are markers in the protocol that are directly related to fine-grained user actions.
II Related work
Traffic inspection and classification has two main purposes: security (detecting malicious activity [25]), and quality of service management (insuring resources are appropriate for traffic [23]). Traffic analysis can be done using: port structure (services being used) [9], deep packet inspection (signatures in payloads) [9], data analytics (per-packet or per-flow) [5], or behavioral classification (communication pattern graphs) [5].
To overcome the weaknesses associated with the port-based and payload-based approaches, data analytics has been proposed as a solution for network traffic classification [2, 13]. In particular, data-analytic approaches can detect novel traffic using anomaly detection [33].
Draper-Gil et al. [11] generated a dataset used by several researchers to predict traffic classes. It contains browsing, email, chat, streaming, file transfer, VoIP, and P2P traffic; each inside and outside of a VPN tunnel. However, each window contains only a single kind of traffic. Draper-Gil used k-Nearest Neighbor and decision tree predictors; Saber et al. [26] used under- and over-sampling, PCA, SVMs; Lotfollahi et al. [19] used stacked autoencoders and convolutional neural networks; and Vu et al. [30] used LSTMs. The best models on this dataset achieve F1 scores up to 0.98 on the single-class prediction problem.
Zhang et al. [32], in the closest work to ours, classify categories of seven types of activities: Browsing, Chat, Online Gaming, Downloading, Uploading, Online Video, and BitTorrent, using windows of different sizes. However, each window contains at most two simultaneous kinds of traffic. They achieve around 80% prediction accuracy for 5-second windows and over 90% accuracy for 1-minute traffic windows for the single class problem. Their accuracy decreases for some classes when there are two concurrent activities.
A finer-grained, and harder, version of the problem is to detect not only the kind of traffic but which application is being used. Taylor et al. [28] create an “Appscanner” tool to recognize smartphone apps in encrypted traffic. Their work was later improved by Taylor et al. [29] using bursts, packets grouped within a time window. They analyze one second bursts to deliver near real-time prediction for 110 out of 200 most popular free Google Play applications. Alan and Kaur [1] reduce computational complexity by analyzing only the first 64 packets to identify the application. Saltaformaggio et al. [27] achieve an average of 78% precision and 76% recall using KMeans and multi-class SVM and properties that could be captured by eavesdropping. In addition, they also paid attention to how easy it was to discover user properties from the traffic, and revealed some major privacy issues. Application identification is also possible in encrypted tunnels. Lotfollahi et al. [19] and Yamansavascilar et al. [31] run their experiments on the same VPN dataset by Draper-Gil et al. [11] to detect application instead of the broad traffic category.
A related problem is to detect what actions users are doing on their devices, that is behavioral detection. Conti et al. [7] analyze encrypted traffic from Android devices to discover user behaviors such as sending a new message with Gmail or opening the Dropbox app. Their study included seven Android applications: Facebook, Gmail, Twitter, Tumblr, Dropbox, Google+ and Evernote and they simulated user actions to obtain signatures of flows generated by use of these apps. Coull and Dyer analyze user behaviors in Apple iMessage [8] and showed that users’ actions, as well as language and length of messages exchanged, can be predicted. Park and Kim [24] predict KakaoTalk’s eleven behaviors in encrypted traffic. Liu et al. [18] predict whether a user is using Wechat, WhatsApp and Facebook and behaviors such as voice calling, video calling or picture sharing. Dubin et al. [12] trained a classifier to predict the most popular YouTube videos titles, basing on encrypted traffic statistics, notably the bits per peak.
III Approach
A real-world system was used to collect RDP traffic data about five classes of traffic. Derived data were computed from the base traffic data using Discrete Cosine Transform, singular value decomposition, and independent component analysis. A series of predictive models were then built and their performance assessed using standard measures as well as a custom measure designed for the problem.
III-A System setup
The Remote Desktop Protocol is designed to let a user at a client interact with a host as if sitting at that host. It provides the full interactivity of using the mouse, viewing the screen, and using the keyboard.
The client workstation, called Workstation01, is a 6-core Intel Xeon processor, 36 GB memory, 2 TB storage and Network Interface Card connected to a Local Area Network with an Internet gateway, running Microsoft Windows 10 Professional. For data analysis, Java Runtime Environment 1.8 was installed to run CIC FlowMeter v4.0 for attribute extraction, and Wireshark to capture RDP network traffic into .pcap files. As a Remote Desktop client, Workstation01 is configured to mount local drives, allow clipboard and runs in resolution 1366x768 with full user desktop experience.
Hyper-V service is enabled on Workstation01 for virtualization and there are two virtual machines running on it: Win01 and Centos-Miner. Win01 VM is a plain installation of a Windows 10 Professional 1809 virtual machine that acts as a Remote Desktop host. The VM is configured with 4 virtual cores and 8 GB of RAM. It has a static IP, Network Level Authentication, and a Windows firewall with an exception allowing incoming RDP traffic. This setup ensures that Workstation01 can connect freely to Win01 VM over both TCP and UDP protocols on port 3389.
CentOS-Miner is a CentOS 7.5 VM running on top of Workstation-01 Hyper-V. This Linux virtual machine has a Bash environment and Tshark installed and it is used for data exploration and additional attribute extraction.
A physically remote VM, CAC01, is hosted at Queen’s University’s Centre for Advanced Computing. The configuration is exactly the same as for Win01 VM except that it runs Windows 10 Education, and resides behind a firewall with NAT. CAC-01 has 4 virtual cores and 4 GB of RAM.
Traffic to Win01 is on the same IP subnet as the client, and only encounters the built-in Windows firewall on Win01 itself. Traffic to CAC01 passes through an Internet connection, the Queen’s University campus network, and a physical firewall that accepts connections on port 13389 and forwards them to CAC01 on port 3389. RDP uses TCP only for traffic outside a subnet, and a mixture of TCP and UDP for traffic within a subnet, so two different predictive models had to be developed.
Figure 1 shows the network setup with all the Virtual Machines used for data generation. The red path shows the traffic path for the local subnet scenario and the green path represents the distant scenario, traversing the Internet.

III-B Data Collection
The Remote Desktop traffic attributes were captured for 30 second windows of one or more of the following activity classes:
-
•
Download – file download from host to client;
-
•
Browsing – using a browser (Firefox and Chrome) on the host, driven from the client;
-
•
Notepad – editing on the host from the client (typing for more than 80% of the time window);
-
•
YouTube – playing a video on the host (Youtube or mp4s), viewed on the client; and
-
•
Clipboard – copying content from remote system to local using the clipboard mechanism.
Samples may be pure – a single activity for 30 seconds – or mixed, with up to four activities simultaneously in a 30-second window.
Attribute collection is performed by CIC Flow Meter and Tshark. The former is a tool developed by University of New Brunswick’s Canadian Institute for Cybersecurity [16]. CIC Flow Meter extracts a predefined number of attributes for each network traffic conversation from a .pcap file. There will be one conversation for TCP only traffic samples, and two conversations for TCP and UDP traffic samples. Predictive attributes include properties such as packet lengths, inter-arrival times and TCP SYN flag counts.
A Bash script extracts additional meaningful predictive attributes from the packet-level attributes of Tshark. The additional attributes include Packet Length Statistics from Wireshark, as shown in Figure 2, and include attributes discovered during exploratory data analysis. All of the data is preprocessed to insure that forward always refers to traffic from local to remote, and backward the converse, based on IP addresses.

Several derived attributes of the measured traffic attributes were also computed. The Discrete Cosine Transform expresses a sequence as a sum of cosine functions. It has often been observed that a single component of the DCT integrates the variability within a sequence [22]. We compute this value for each row of the dataset, that is for the collected traffic attributes of each traffic flow.
Singular Value Decomposition is an affine transformation of a vector space into a form where the greatest variability is captured by the first few axes of the transformed space. Truncation of the SVD amounts to a projection of a high-dimensional space into a low-dimensional one in a way that preserves maximal variation. We apply SVD to the matrix of windows traffic attributes and keep the first 20 columns of the left singular vector matrix.
Independent Component Analysis (ICA) [15] is another matrix transformation that decomposes a matrix into statistically independent components. We apply ICA to the windows traffic attributes and select the 20 columns of the left decomposition matrix111There are a number of sophisticated ways to select the most important columns, for example those with maximal kurtosis, but we retain the first 20 and leave it to attribute selection to find the best..
| Attributes | |||||||||||||||||||||||||||||||||||||||||||||||||||||||||||||||||||||||||||||||||||||||||||||||||||||||||||||||||||||||||||||||||||
|---|---|---|---|---|---|---|---|---|---|---|---|---|---|---|---|---|---|---|---|---|---|---|---|---|---|---|---|---|---|---|---|---|---|---|---|---|---|---|---|---|---|---|---|---|---|---|---|---|---|---|---|---|---|---|---|---|---|---|---|---|---|---|---|---|---|---|---|---|---|---|---|---|---|---|---|---|---|---|---|---|---|---|---|---|---|---|---|---|---|---|---|---|---|---|---|---|---|---|---|---|---|---|---|---|---|---|---|---|---|---|---|---|---|---|---|---|---|---|---|---|---|---|---|---|---|---|---|---|---|---|---|
|
|
|
|
||||||||||||||||||||||||||||||||||||||||||||||||||||||||||||||||||||||||||||||||||||||||||||||||||||||||||||||||||||||||||||||||
The final predictive attribute set is shown in Table I.
Shapley Values calculate the contributions to a final result made by individual players in a game theory context [17]. They have been successfully applied to attribute selection in predictors because of the development of fast approximation algorithms that avoid the implicit exponential number of attribute combinations to be evaluated. The two most popular Shapley value explainers are TreeExplainer [20], for tree-based predictors, and DeepExplainer, for neural networks predictors.
We use Shapley values for attribute selection. The selection process is run independently five times, each time for a different class. Shapley Values were computed with two different classification techniques as the backend: Neural Network (Deep Explainer) and Extreme Gradient Boosting (XGBoost).
III-C Individual Techniques and the Ensemble Predictor
For predictors, we use k-Nearest Neighbors, Support Vector Machines [3], decision trees, random forests [4], Adaboost [14], XGBoost [6], and multilayer perceptrons.
Each of the prediction techniques was run with 10-fold cross validation, with binary class labels (traffic class present or not). The final ensemble model consists of the top three most effective classifiers for each traffic class, chosen to maximize the precision, so that the ensemble classifier can determine with a high degree of certainty whenever a specific kind of traffic is present. A specific sample is predicted to contain a specific class of traffic when at least two of the three classifiers predict that class.
The output of the ensemble classifier is 5 binary values, predicting the presence of each of the 5 kinds of traffic in the sample. Three different performance measures are calculated:
-
•
The precision, recall and F1 score for each class;
-
•
A confusion matrix for each class;
-
•
An ensemble score function designed for the problem domain.
The ensemble score function assigns points to each record as follows:
-
•
For a true negative, no points;
-
•
For a true positive, add one point;
-
•
For a false positive, subtract two points;
-
•
For a false negative, no points.
For instance, if the model predicts download and clipboard, where the traffic actually contained download and browsing, it will assign point for download, 0 points for browsing as it was a false negative, 0 points for Notepad and YouTube as they were true negatives, and for false positive on clipboard. The aggregate of scores calculated on all test set rows is divided by the sum of all positive labels in the test set and multiplied by 100. The scoring function severely penalizes the ensemble whenever it predicts a traffic class that is not actually present. This insures that the model is reliable for predicting behavior.
III-D Dataset
The dataset consists of 2160 30-second data samples. The information relating to number of samples is summarized in Table II for the CAC-01 (Remote VM, TCP transport) and Table III for Win01 (Local subnet VM, TCP and UDP transport) traffic respectively. For simplicity, we will refer to the first kind of traffic as TCP and to the latter as UDP.
| Num samples | Download? | Browsing? | Notepad? | YouTube? | Clipboard? |
| 240 | 1 | 0 | 0 | 0 | 0 |
| 240 | 0 | 1 | 0 | 0 | 0 |
| 239 | 0 | 0 | 1 | 0 | 0 |
| 243 | 0 | 0 | 0 | 1 | 0 |
| 120 | 0 | 0 | 0 | 0 | 1 |
| 74 | 0 | 1 | 0 | 0 | 1 |
| 43 | 1 | 1 | 0 | 0 | 0 |
| 25 | 1 | 0 | 1 | 0 | 1 |
| 22 | 1 | 0 | 1 | 0 | 0 |
| 62 | 0 | 0 | 1 | 1 | 0 |
| 27 | 1 | 0 | 0 | 1 | 0 |
| 63 | 0 | 1 | 0 | 1 | 0 |
| 22 | 0 | 0 | 1 | 0 | 1 |
| 15 | 1 | 1 | 0 | 0 | 1 |
| 21 | 1 | 0 | 1 | 1 | 1 |
| 1456 | TOTAL | ||||
| Num samples | Download? | Browsing? | Notepad? | YouTube? | Clipboard? |
| 103 | 1 | 0 | 0 | 0 | 0 |
| 92 | 0 | 1 | 0 | 0 | 0 |
| 100 | 0 | 0 | 1 | 0 | 0 |
| 105 | 0 | 0 | 0 | 1 | 0 |
| 100 | 0 | 0 | 0 | 0 | 1 |
| 42 | 0 | 1 | 0 | 0 | 1 |
| 44 | 0 | 1 | 0 | 1 | 0 |
| 42 | 1 | 0 | 1 | 0 | 0 |
| 37 | 1 | 0 | 1 | 0 | 1 |
| 39 | 1 | 0 | 0 | 1 | 0 |
| 704 | TOTAL | ||||
When TCP is the only protocol used, it is easier to make accurate predictions. When UDP is added, the problem complexity grows because there are at least two conversations – one for the TCP stream and one for the UDP stream, in the same Remote Desktop session. UDP seems to be used for bulk transfers while TCP is used to send user inputs, such as keystrokes and mouse movements, and perhaps RDP session management details.
Every keystroke that is sent from local system to the remote system over Remote Desktop is carried by two 92-byte TCP frames in the forward direction. As a result, the total number of 92-byte frames in a window reveals how many keystrokes have been sent (except that actions such as pressing and holding a Shift key generates 92-byte frames, until the key is released).
The remote system also responds with packets that are revealing. 92-byte upward packets produce PSH-flagged packets whose payload size correlates with the visual change to the screen of the character echo – the more pixels changed, the larger the payload222There are hints that what is being returned is the delta of the character being displayed.. This suggests a potential attack against passwords, since the echoed character is typically not the character sent but a filler character. As a result, entering a password may produce an easily detectable signature.
Mouse movements generate packets of either 97 or 104 bytes, with 97-byte packets associated with mouse clicks. Observing the number of such packets allows mouse activity to be estimated; and the mixing with 92-byte packets allows even finer grained estimates – for example, the size of form data might be estimated by observing how many characters are typed in between mouse clicks and small mouse movements.
IV Results
Attribute ranking is computed for ten cases: 5 TCP activities and 5 UDP activities, and for each both the tree-based and neural-net based Shapley value computation. This results in twenty ranked lists of attribute significance. Tree based Shapley values also provide information about whether an attribute is associated with one class label or the other, and how strongly. These are shown as red and blue points in plots.
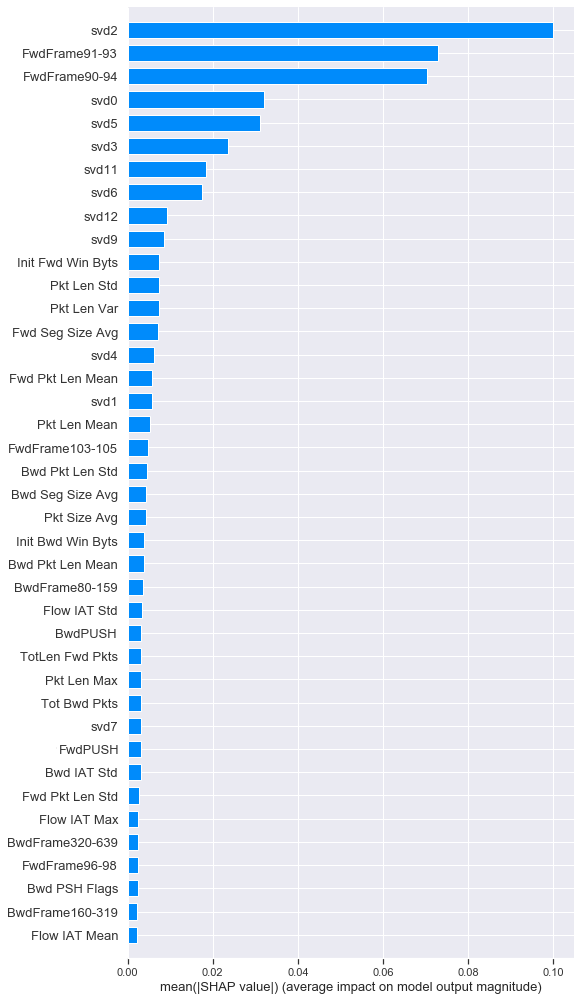
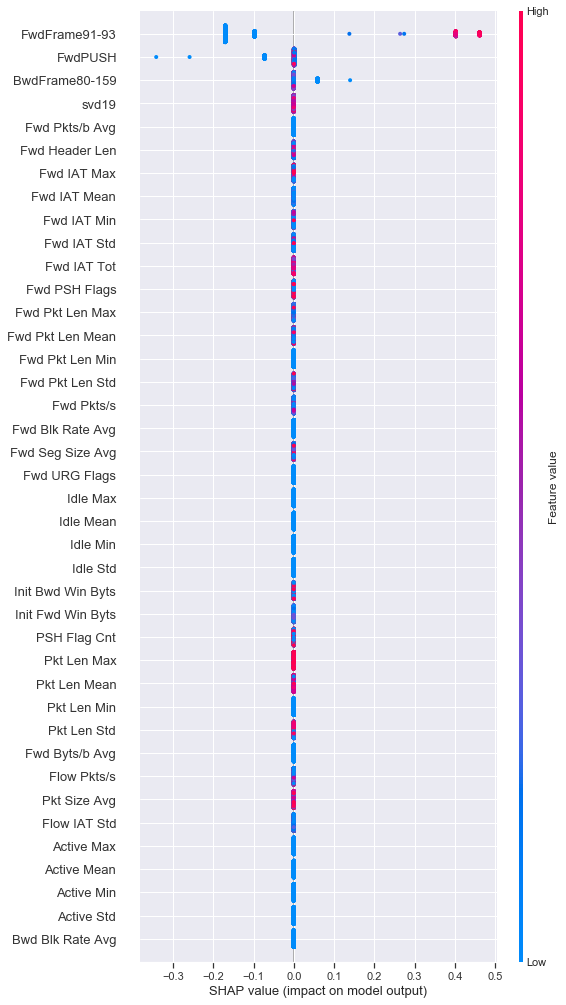
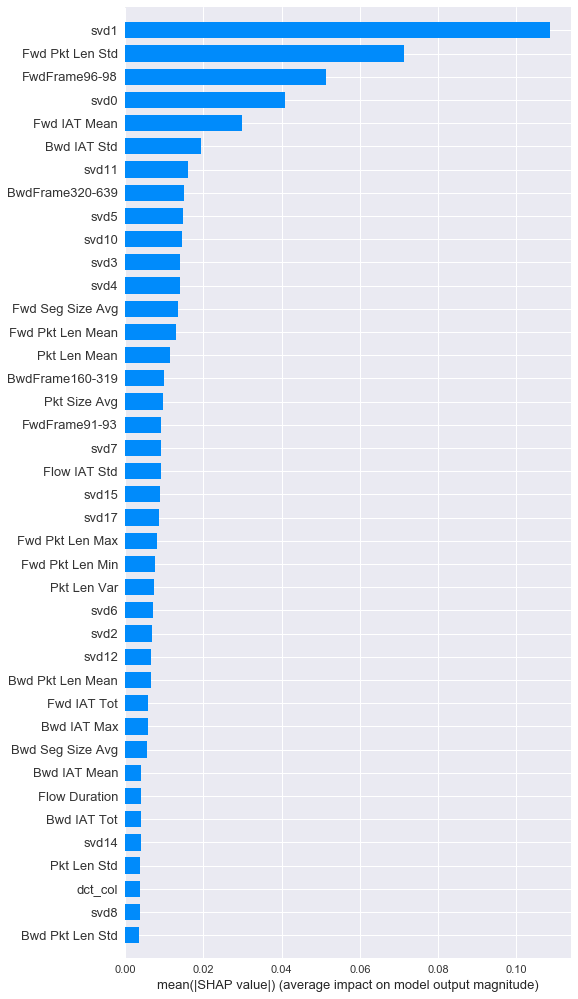
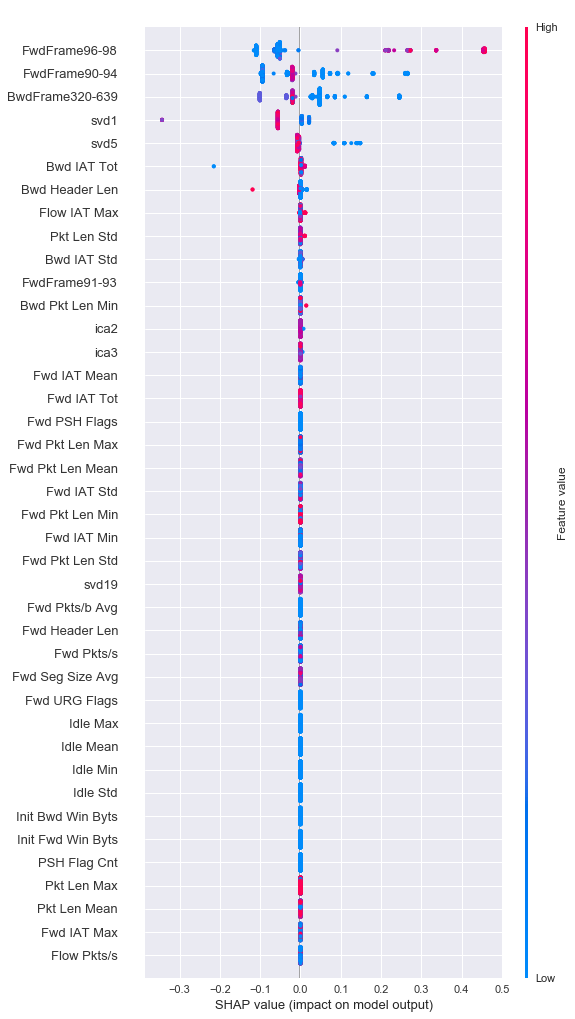
The most predictive attributes are fairly consistent using both the tree-based and network-based Shapley values. The 92- and 104-byte attributes rank highly, as do many of the SVD components, suggesting that the original attributes tend to capture traffic properties that are strongly correlated.
| TCP Download | TCP Browsing | TCP Notepad | TCP YouTube | TCP Clipboard | ||||||||||||||||||||||||||||||||||||||||||||||||||||||
|---|---|---|---|---|---|---|---|---|---|---|---|---|---|---|---|---|---|---|---|---|---|---|---|---|---|---|---|---|---|---|---|---|---|---|---|---|---|---|---|---|---|---|---|---|---|---|---|---|---|---|---|---|---|---|---|---|---|---|
|
|
|
|
|
| UDP Download | UDP Browsing | UDP Notepad | UDP YouTube | UDP Clipboard | ||||||||||||||||||||||||||||||||||||||||||||||||||
|---|---|---|---|---|---|---|---|---|---|---|---|---|---|---|---|---|---|---|---|---|---|---|---|---|---|---|---|---|---|---|---|---|---|---|---|---|---|---|---|---|---|---|---|---|---|---|---|---|---|---|---|---|---|---|
|
|
|
|
|
Table IV shows the best attributes for the TCP traffic classes and Table V shows the best attributes for the UDP traffic classes.
| Technique | Download | Browsing | Notepad | YouTube | Clipboard | ||||||||||
|---|---|---|---|---|---|---|---|---|---|---|---|---|---|---|---|
| NN |
|
|
|
|
|
||||||||||
| RF |
|
|
|
|
|
||||||||||
| XGB |
|
|
|
|
|
||||||||||
| SVM |
|
|
|
|
|
||||||||||
| Ada |
|
|
|
|
|
||||||||||
| KNN |
|
|
|
|
|
||||||||||
| DTC |
|
|
|
|
|
Table VI shows the performance summary for the predictors run on the TCP traffic and Table VII summarizes performance for the UDP traffic. Accuracies are over 10-fold cross validation.
For each TCP and UDP traffic class we select the top three best performing cross-validated predictors to build two ensemble predictors – the TCP Ensemble and the UDP Ensemble, shown in Figures 7 and 8.
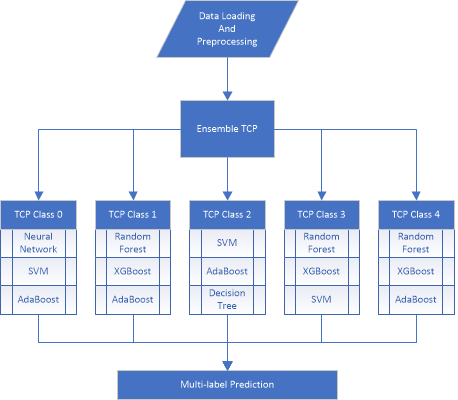
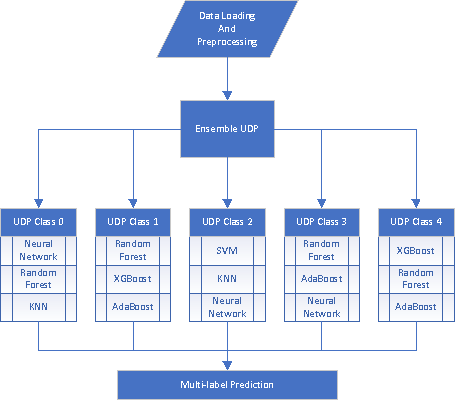
Table VIII provides the True Positives, False Positives, True Negatives, and False Negatives with five-fold cross-validation for the ensemble predictors. We then calculate Accuracy, Precision, Recall and F1 score.
| Class | FP | TP | FN | TN | Accu. | Prec. | Rec. | F1 |
|---|---|---|---|---|---|---|---|---|
| TCP Download | 1 | 391 | 2 | 1062 | 99.79 | 99.74 | 99.49 | 99.62 |
| TCP Browsing | 3 | 434 | 1 | 1018 | 99.73 | 99.31 | 99.77 | 99.54 |
| TCP Notepad | 0 | 390 | 1 | 1065 | 99.93 | 100.00 | 99.74 | 99.87 |
| TCP YouTube | 2 | 413 | 3 | 1038 | 99.66 | 99.52 | 99.28 | 99.40 |
| TCP Clipboard | 5 | 265 | 12 | 1174 | 98.83 | 98.15 | 95.67 | 96.89 |
| UDP Download | 0 | 221 | 0 | 483 | 100.00 | 100.00 | 100.00 | 100.00 |
| UDP Browsing | 2 | 175 | 3 | 524 | 99.29 | 98.87 | 98.31 | 98.59 |
| UDP Notepad | 1 | 178 | 1 | 524 | 99.72 | 99.44 | 99.44 | 99.44 |
| UDP YouTube | 0 | 188 | 0 | 516 | 100.00 | 100.00 | 100.00 | 100.00 |
| UDP Clipboard | 4 | 170 | 9 | 521 | 98.15 | 97.70 | 94.97 | 96.32 |
Table IX, summarizes the single ensemble scores obtained for each fold of the TCP and UDP models, along with the average. Voting makes a significant contribution towards reducing false positives.
| Fold | TCP Ensemble Score | UDP Ensemble Score | |||
|---|---|---|---|---|---|
| 1 | 98.18 | 95.36 | |||
| 2 | 97.86 | 97.47 | |||
| 3 | 97.19 | 97.85 | |||
| 4 | 97.95 | 96.22 | |||
| 5 | 98.13 | 98.90 | |||
|
|
|
For both UDP and TCP traffic, there are similarities when it comes to the most commonly misclassified traffic classes. For both TCP and UDP traffic, the most common misclassification misses the Clipboard class. This is reflected in the recall scores for the UDP Clipboard at only 94.97% and the TCP Clipboard at 95.67%, while other classes all have recall higher than 98%.
The most common error in TCP traffic is a mixture of Browsing and Clipboard being classified as Browsing only. Both Browsing and Clipboard involve mouse movements and mouse clicks, both right- and left-clicks, but it seems slightly surprising that these are difficult to distinguish.
The second most common error occurs when Browsing traffic is classified as Browsing and Clipboard, generating a false positive prediction for Clipboard. The third most common is for the combination of Download, Browsing and Clipboard where the Clipboard traffic is missed. The fourth most common is when a Download and YouTube mixture is classified as Download only. Misclassifications are rare the other way – mixtures of the two rarely get classified as YouTube only. Download has a potential to dominate YouTube, apparently because it generates significantly more and faster traffic; and it is possible that backward (remote to local) packet lengths could vary, especially when traversing the Internet. This could be caused by TCP adjusting the window size for transfers. Interestingly, there were no misclassifications relating to the 4-class TCP traffic.
For UDP traffic, the most common misclassification is again a False negative for the Clipboard class. Most often, this happens in the mixture of Download, Notepad and Clipboard, where Clipboard is missed and traffic is classified as Download and Notepad. Both Download and Notepad have many more visible traffic attributes than Clipboard does – the total number of backward bytes for Download and 92-byte frames for Notepad. There were some other misclassifications such as Browsing and Clipboard being identified as Browsing alone and Clipboard or Browsing being classified as none of the five classes.
We wondered if Browsing samples from web sites with lots of video and dynamic content would tend to get misclassified as the YouTube class. Such misclassifications are rare and the predictive model is apparently resilient to audio and video contents embedded in websites.
V Conclusions
We have shown that, for an encrypted protocol such as RDP, it is still possible to infer five common categories of activities with high reliability from traffic properties that cannot be concealed by encryption. It is conceivable that some of these predictions could be defeated by obfuscation in the protocol but protocol designers are caught between the need to conceal activity and the need to provide responsiveness. As we have shown, this has led to a design in which keystrokes, mouse activity, and visual rendering all leave traces in the encrypted traffic which could potentially be used for attacks.
A limitation of this model is that it only used traffic between Windows 10 systems. Different systems, and RDP updates, could conceivably change traffic structure in a macroscopic way, although the proof of concept here suggests that only model retraining would be needed. Other kinds of traffic were not examined: for example, two-way video such as Zoom or Skype might induce quite different traffic structure.
References
- [1] Hasan Faik Alan and Jasleen Kaur. Can android applications be identified using only TCP/IP headers of their launch time traffic? In Proceedings of the 9th ACM conference on security & privacy in wireless and mobile networks, pages 61–66. ACM, 2016.
- [2] Riyad Alshammari and A Nur Zincir-Heywood. Machine learning based encrypted traffic classification: Identifying SSH and Skype. In Computational Intelligence for Security and Defense Applications, 2009. CISDA 2009. IEEE Symposium on, pages 1–8. IEEE, 2009.
- [3] Robert Berwick. An Idiot’s guide to Support vector machines (SVMs). http://svms.org/tutorials/Berwick2003.pdf, 2003. Accessed: 2019-11-02.
- [4] Leo Breiman. Random forests. Machine learning, 45(1):5–32, 2001.
- [5] Zigang Cao, Gang Xiong, Yong Zhao, Zhenzhen Li, and Li Guo. A survey on encrypted traffic classification. In International Conference on Applications and Techniques in Information Security, pages 73–81. Springer, 2014.
- [6] Tianqi Chen and Carlos Guestrin. Xgboost: A scalable tree boosting system. In Proceedings of the 22nd ACM SIGKDD international conference on knowledge discovery and data mining, pages 785–794. ACM, 2016.
- [7] Mauro Conti, Luigi Vincenzo Mancini, Riccardo Spolaor, and Nino Vincenzo Verde. Analyzing Android encrypted network traffic to identify user actions. IEEE Transactions on Information Forensics and Security, 11(1):114–125, 2016.
- [8] Scott E Coull and Kevin P Dyer. Traffic analysis of encrypted messaging services: Apple imessage and beyond. ACM SIGCOMM Computer Communication Review, 44(5):5–11, 2014.
- [9] Alberto Dainotti, Antonio Pescape, and Kimberly C Claffy. Issues and future directions in traffic classification. IEEE network, 26(1):35–40, 2012.
- [10] Bekim Dautis. Installing and Configuring Windows 10:b 70-698 Exam Guide. PACKT Publishing Limited, 2018.
- [11] Gerard Draper-Gil, Arash Habibi Lashkari, Mohammad Saiful Islam Mamun, and Ali A Ghorbani. Characterization of Encrypted and VPN Traffic using Time-related Features. In Proceedings of the 2nd international conference on information systems security and privacy (ICISSP), pages 407–414, 2016.
- [12] Ran Dubin, Amit Dvir, Ofir Pele, and Ofer Hadar. I Know What You Saw Last Minute – Encrypted HTTP Adaptive Video Streaming title Classification. IEEE Transactions on Information Forensics and Security, 12(12):3039–3049, 2017.
- [13] Jeffrey Erman, Martin Arlitt, and Anirban Mahanti. Traffic classification using clustering algorithms. In Proceedings of the 2006 SIGCOMM workshop on Mining network data, pages 281–286. ACM, 2006.
- [14] Yoav Freund and Robert E Schapire. A decision-theoretic generalization of on-line learning and an application to boosting. Journal of computer and system sciences, 55(1):119–139, 1997.
- [15] Aapo Hyvarinen. Fast ICA for noisy data using Gaussian moments. In ISCAS’99. Proceedings of the 1999 IEEE International Symposium on Circuits and Systems VLSI (Cat. No. 99CH36349), volume 5, pages 57–61. IEEE, 1999.
- [16] Arash Habibi Lashkari, Gerard Draper-Gil, Mohammad Saiful Islam Mamun, and Ali A Ghorbani. Characterization of Tor Traffic using Time based Features. In ICISSP, pages 253–262, 2017.
- [17] David Liben-Nowell, Alexa Sharp, Tom Wexler, and Kevin Woods. Computing Shapley Value in supermodular coalitional games. In International Computing and Combinatorics Conference, pages 568–579. Springer, 2012.
- [18] Junming Liu, Yanjie Fu, Jingci Ming, Yong Ren, Leilei Sun, and Hui Xiong. Effective and real-time in-app activity analysis in encrypted internet traffic streams. In Proceedings of the 23rd ACM SIGKDD International Conference on Knowledge Discovery and Data Mining, pages 335–344. ACM, 2017.
- [19] Mohammad Lotfollahi, Mahdi Jafari Siavoshani, Ramin Shirali Hossein Zade, and Mohammdsadegh Saberian. Deep packet: A novel approach for encrypted traffic classification using deep learning. Soft Computing, pages 1–14, 2017.
- [20] Scott M Lundberg, Gabriel Erion, Hugh Chen, Alex DeGrave, Jordan M Prutkin, Bala Nair, Ronit Katz, Jonathan Himmelfarb, Nisha Bansal, and Su-In Lee. Explainable AI for Trees: From Local Explanations to Global Understanding. arXiv preprint arXiv:1905.04610, 2019.
- [21] John Maddison. Encrypted Traffic Reaches A New Threshold. https://www.networkcomputing.com/network-security/encrypted-traffic-reaches-new-threshold, Nov 2018. [Online; accessed 17-Nov-2019].
- [22] John Makhoul. A fast cosine transform in one and two dimensions. IEEE Transactions on Acoustics Speech and Signal Processing, 28(1):27–34, 1980.
- [23] Irena Orsolic, Dario Pevec, Mirko Suznjevic, and Lea Skorin-Kapov. A machine learning approach to classifying YouTube QoE based on encrypted network traffic. Multimedia tools and applications, 76(21):22267–22301, 2017.
- [24] Kyungwon Park and Hyoungshick Kim. Encryption Is Not Enough: Inferring user activities on KakaoTalk with traffic analysis. In International Workshop on Information Security Applications, pages 254–265. Springer, 2015.
- [25] Tamara Radivilova, Lyudmyla Kirichenko, Dmytro Ageyev, Maxim Tawalbeh, and Vitalii Bulakh. Decrypting SSL/TLS traffic for hidden threats detection. In 2018 IEEE 9th International Conference on Dependable Systems, Services and Technologies (DESSERT), pages 143–146. IEEE, 2018.
- [26] Abid Saber, Belkacem Fergani, and Moncef Abbas. Encrypted Traffic Classification: Combining Over-and Under-Sampling through a PCA-SVM. In 2018 3rd International Conference on Pattern Analysis and Intelligent Systems (PAIS), pages 1–5. IEEE, 2018.
- [27] Brendan Saltaformaggio, Hongjun Choi, Kristen Johnson, Yonghwi Kwon, Qi Zhang, Xiangyu Zhang, Dongyan Xu, and John Qian. Eavesdropping on fine-grained user activities within smartphone apps over encrypted network traffic. In 10th USENIX Workshop on Offensive Technologies (WOOT 16), 2016.
- [28] Vincent F Taylor, Riccardo Spolaor, Mauro Conti, and Ivan Martinovic. Appscanner: Automatic fingerprinting of smartphone apps from encrypted network traffic. In 2016 IEEE European Symposium on Security and Privacy (EuroS&P), pages 439–454. IEEE, 2016.
- [29] Vincent F Taylor, Riccardo Spolaor, Mauro Conti, and Ivan Martinovic. Robust smartphone app identification via encrypted network traffic analysis. IEEE Transactions on Information Forensics and Security, 13(1):63–78, 2018.
- [30] Ly Vu, Hoang V Thuy, Quang Uy Nguyen, Tran N Ngoc, Diep N Nguyen, Dinh Thai Hoang, and Eryk Dutkiewicz. Time Series Analysis for Encrypted Traffic Classification: A Deep Learning Approach. In 2018 18th International Symposium on Communications and Information Technologies (ISCIT), pages 121–126. IEEE, 2018.
- [31] Baris Yamansavascilar, M Amac Guvensan, A Gokhan Yavuz, and M Elif Karsligil. Application identification via network traffic classification. In 2017 International Conference on Computing, Networking and Communications (ICNC), pages 843–848. IEEE, 2017.
- [32] Fan Zhang, Wenbo He, Xue Liu, and Patrick G Bridges. Inferring users’ online activities through traffic analysis. In Proceedings of the fourth ACM conference on Wireless network security, pages 59–70. ACM, 2011.
- [33] Jun Zhang, Xiao Chen, Yang Xiang, Wanlei Zhou, and Jie Wu. Robust network traffic classification. IEEE/ACM Transactions on Networking (TON), 23(4):1257–1270, 2015.
- [34] Wei Zhang, Yan Meng, Yugeng Liu, Xiaokuan Zhang, Yinqian Zhang, and Haojin Zhu. Homonit: Monitoring smart home apps from encrypted traffic. In Proceedings of the 2018 ACM SIGSAC Conference on Computer and Communications Security, pages 1074–1088. ACM, 2018.