The influence of the electric polarization of hydrogen atoms
on the red shift of its spectral lines
Abstract
The Lorentz oscillator system is studied to interpret the spectral lines of hydrogen atoms. The dielectric constant of this system is analyzed, which takes into account the electrical polarization of hydrogen atoms.
This dielectric constant gives the red shift of the spectral line and the appearance of the optical spectrum dip. This dip is on the blue side of the spectral position of the shifted line.
The value of this red shift and the width of this dip strongly depend on the hydrogen atom concentration and the spectral position of the not shifted line. This red shift increases with an increase in the hydrogen atom concentration.
pacs:
32.70.Jz, 33.70.Jg, 51.70.+f, 98.62.PyI Introduction
The substance spectral line research is the subject of optical spectroscopy since its origin. Modern physics and astrophysics use it Bakhshiev (1987); Sobolev (1985); Pradhan and Nahar (2011); Rybicki and Lightman (2004); Römer (2005). The Lorentz oscillator gives a simple but successful classical model of the spectral line. It is widely utilized to interpret substance spectral lines Pradhan and Nahar (2011); Rybicki and Lightman (2004); Römer (2005).
The dielectric constant of a substance expressed through this substance electrical conductivity gives optical properties of this substance Römer (2005); Platzman and Volf (1975); Iinskiy and Keldysh (1989); Landau and Lifshitz (1982). However, both the external electrical conductivity of this substance and its internal electrical conductivity characterize this substance Kubo (1966); Izuyma (1961); Eykholt (1986).
According to the definition of the dielectric constant of a substance, the internal electrical conductivity of this substance determines this constant Platzman and Volf (1975); Iinskiy and Keldysh (1989); Landau and Lifshitz (1982); Kubo (1966); Izuyma (1961); Eykholt (1986).
The external electrical conductivity of a substance is used traditionally instead of its internal electrical conductivity in the dielectric constant of this substance. This use is the approximation that does not take into account the electrical polarization of charge carriers of this substance Severin (1990, 1994); Vakulenko and Severin (2007a, b); Severin (2009, 2012, 2017). The difference between the external electromagnetic field acting on this substance and the internal electromagnetic field acting in this substance is absent in this approximation.
Optical transitions of electrical charges in a substance take place under the influence of the internal electromagnetic field in this substance. Molecular spectroscopy considers the effect of the difference between external and internal electromagnetic fields in a substance. Molecular spectroscopy shows the single-molecule spectrum that can differ from the molecule system spectrum Bakhshiev (1987).
The article is organized as follows: Sec. II discusses the difference between external and internal electrical conductivities. Sec. III gives optical properties of the substance modeled by the Lorentz oscillator system that does take into account the electrical polarization of this system. Sec. IV considers the application of the results of Sec. III to the spectral lines of hydrogen atoms. Sec. III gives the final discussion and conclusions. This article uses Gaussian units.
II External and internal electrical conductivities
The article considers an optically isotropic substance. Let the external electrical conductivity and the internal electrical conductivity of this substance be scalars but not tensors. They depend on the frequency of the light wave but do not depend on its wave vector. Hence, the dependence of the external electric field and the internal electric field on the wave vector not considered.
Let the external electric field act on the substance. Here, t is time; is the this field amplitude. The electric current density that has the amplitude arises in the substance under this field action. The following equation gives this current density
| (1) |
Here, is the internal electric field that acts in the substance.
The relation (1) defines two different conductivities Kubo (1966); Izuyma (1961); Eykholt (1986). The external conductivity is determined by the Kubo formula Kubo (1966). It differs from the internal conductivity . This difference between and is due to the difference between the fields and because the following equation takes place
| (2) |
Here, is the substance electrical polarization vector as well as Römer (2005); Platzman and Volf (1975); Iinskiy and Keldysh (1989); Landau and Lifshitz (1982); Kubo (1966); Izuyma (1961); Eykholt (1986)
| (3) |
The following relationship determines the substance dielectric constant Römer (2005); Platzman and Volf (1975); Iinskiy and Keldysh (1989); Landau and Lifshitz (1982); Kubo (1966); Izuyma (1961); Eykholt (1986)
| (4) |
| (5) |
Further, we have the following from Eqs. (1), (4)
| (6) |
In addition, Eqs. (5), (6) give the following relationship between s and
| (7) |
The conductivities s and of the Lorentz oscillator system were considered in Severin (2009).
III Electrical polarization influence on spectral lines
Let us consider the system of identical Lorentz oscillators having the concentration n. Let m be the oscillator mass, e be the oscillator charge, and be the damping oscillator factor. Lat be the frequency of one oscillator before taking into account the electrical polarization of the oscillator system. The frequencies of these oscillators are associated with the spectral lines of atoms in this article.
The dielectric constant of this Lorentz oscillator system that does take into account the electric polarization has the form of Severin (2009)
| (8) |
Here, the following formulas give the frequencies and
| (9) |
| (10) |
The frequency is the frequency of one oscillator after taking into account the electrical polarization of this oscillator system Severin (2009).
The dielectric constant of this system of Lorentz oscillators that does not take into account the electric polarization has the form of Severin (2009)
| (11) |
Eq. (10) gives the decrease in the frequency when the oscillator concentration n increases. There is an agreement between this theoretical result and the experimental results of the optical spectra of lattice vibrations Severin (2009).
Let us consider the spectral line of a substance atom. We believe that Eqs. (8)–(11) give the dielectric constant of this substance, in which n is the atom concentration, e is the electron charge, and m is the electron mass. In this case, is the spectral line frequency of an isolated atom or the oscillator frequency without taking into account the electric polarization of the oscillator system. However, is the spectral line frequency of a substance atom or the oscillator frequency with taking into account this electrical polarization.
The following formulas give the real and the imaginary part of the dielectric constants and
| (12) |
| (13) |
| (14) |
| (15) |
Light waves do not pass through a substance in which the real part of the dielectric constant of this substance is negative at the frequency of these waves. Therefore, the optical spectrum of this substance has a dip at these wave frequencies. If there is the approximation , then Eq. (12) gives that the condition takes place at the frequency range
| (16) |
However, in the same approximation, Eq. (14) gives that the condition takes place at the frequency range
| (17) |
Eqs. (16) and (17) give the fact that the model of the Lorentz oscillator system that takes the electrical polarization of this system into account and the model of the Lorentz oscillator system that not takes the electrical polarization of this system into account have the dip in optical spectrum in different frequency ranges.
The maximum of the imaginary part of the dielectric constant determines the spectral line place if the frequency dependence of the real part of this dielectric constant not taken into account. This article uses such a method. In this case, formulas (13) and (15) give different places of the spectral line.
The wavelength of light corresponds to the Lorentz oscillator system without taking into account the polarization. This wavelength gives the spectral line of an isolated atom in the optical spectrum. Here, c is the light velocity in free space.
The wavelength of light corresponds to the Lorentz oscillator system taking into account the electrical polarization. It gives the spectral line of a substance atom. This polarization gives the next wavelength shift to the red side . Besides, following Eq. (9), the dip in the optical spectrum is on the blue side relative to the place of this shifted line.
The redshift parameter of the spectral line is . Eq. (10) gives
| (18) |
Let be . Then, Eq. (18) gives
| (19) |
Here,
| (20) |
is the characteristic concentration that depends on the wavelength and the parameter . If m be the electron mass and e be the electron charge, this parameter is the classical electron radius.
According to Eq. (18), only if the condition takes place, the line having the wavelength is observed in the spectrum. Otherwise, the limit gives . The vibrations of the oscillator disappear in this limit. In that case, the spectral line vanishes.
Namely, the observed wavelength of the spectral line of the substance is present in its spectrum only if the initial wavelength is less than the wavelength . Therefore, the following condition must take place to observe this line
| (21) |
IV Spectral lines of hydrogen atoms
Let us consider hydrogen atom spectral lines in terms of the results of the previous section.
Hydrogen exists in the molecular state under usual laboratory conditions. A small part of its molecules are destroyed to atoms (for example, by an electric discharge) to observe the spectrum of hydrogen atoms. However, the dependence of the spectral place of the hydrogen atom line on the hydrogen atom concentration is not studied. On the other hand, the interstellar medium has hydrogen atoms having different concentrations. There are many experimental results of their optical spectra.
As stated above, the wavelength of the spectral line of hydrogen atoms depends strongly on the atom concentration n and the characteristic concentration determined by the spectral line wavelength of an isolated atom .
Figure 1 shows the dependence of on the wavelength . It gives that the value of is very high in the optical range of the wavelengths . However, the value of the red shift parameter of the rarefied gas of hydrogen atoms is very little in this wave range. The interstellar medium has the hydrogen atom concentration n in the range of (Table 1.3 Draine (2011)). At this atom concentration, the red shift of spectral line may be significant in the radio-frequency range of wavelengths. For instance, the concentration is about at the wavelength .
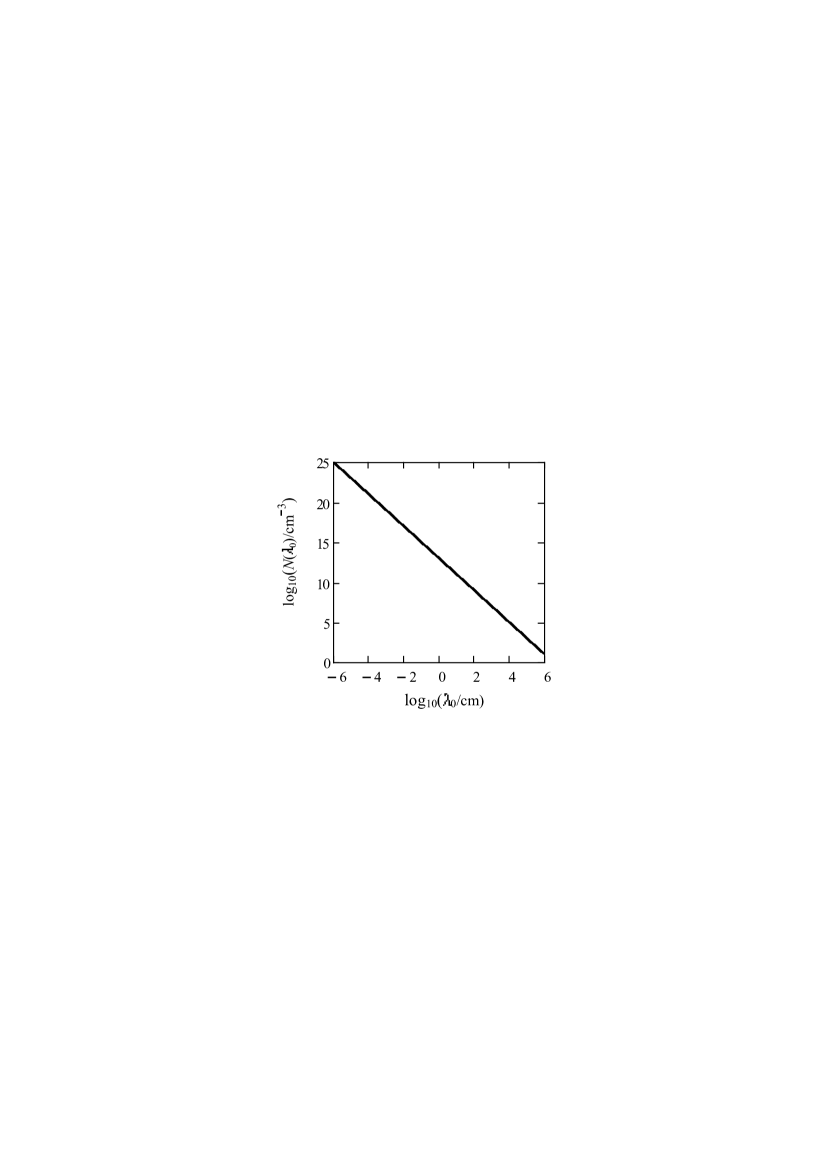
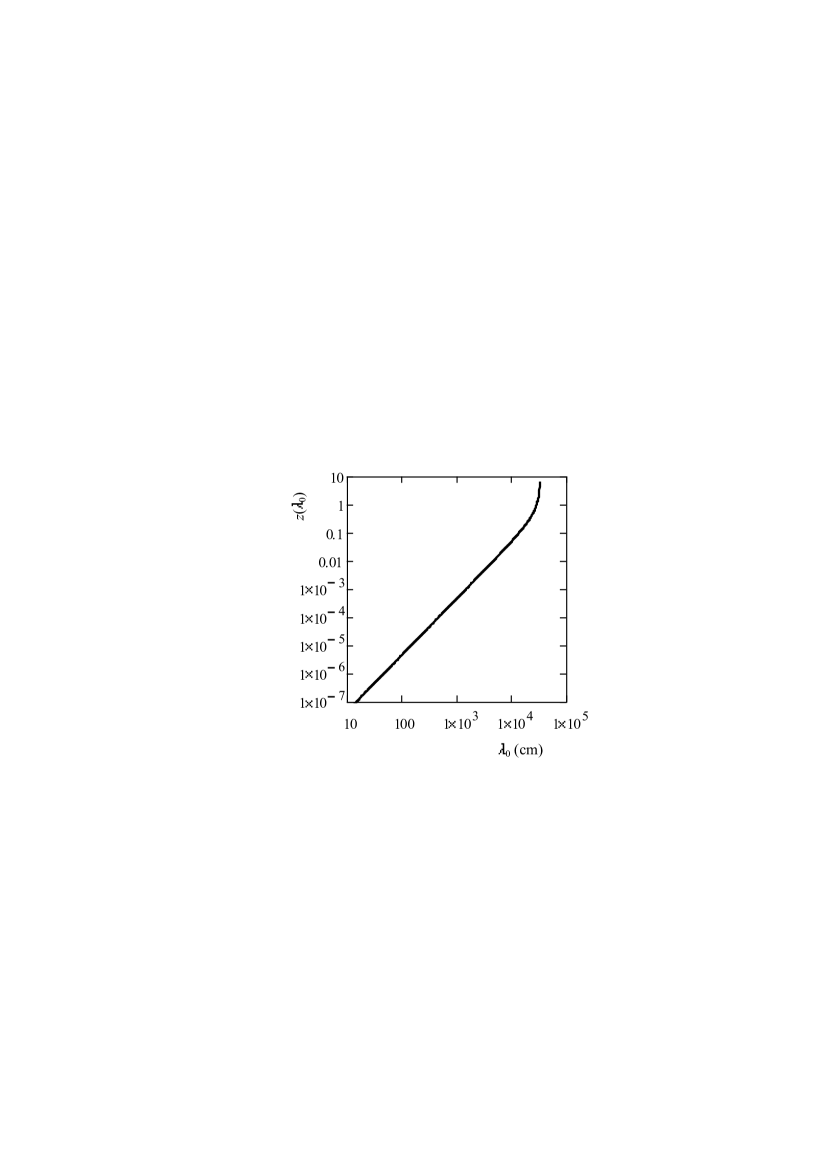
Figure 2 shows the dependence of the red shift parameter on the wavelength at the concentration . It gives that the red shift parameter strongly depends on the wavelength .
The interstellar matter exists both in the gas state and in the dust state Sobolev (1985); Draine (2011); Dyson and Williams (1997); Boren and Huffman (1986). Hydrogen is the main component of the interstellar matter Sobolev (1985); Draine (2011). Because of the low temperature of interstellar medium, the dust surface may be covered by frozen hydrogen Draine (2011); Dyson and Williams (1997); Boren and Huffman (1986). Hydrogen atoms can penetrate some solids and reach a high atom concentration that comparable to the atom concentration of solids Gamburg et al. (1989); Fukai (2005). However, at the same time, they can remain in the atomic state Gamburg et al. (1989); Fukai (2005).
Dust clouds are of great importance for the physical processes in quasars Fan (2006). Possibly, depending on the conditions of the dust particles, the hydrogen atom concentration in these particles can vary from small values to values that are inherent in solids.
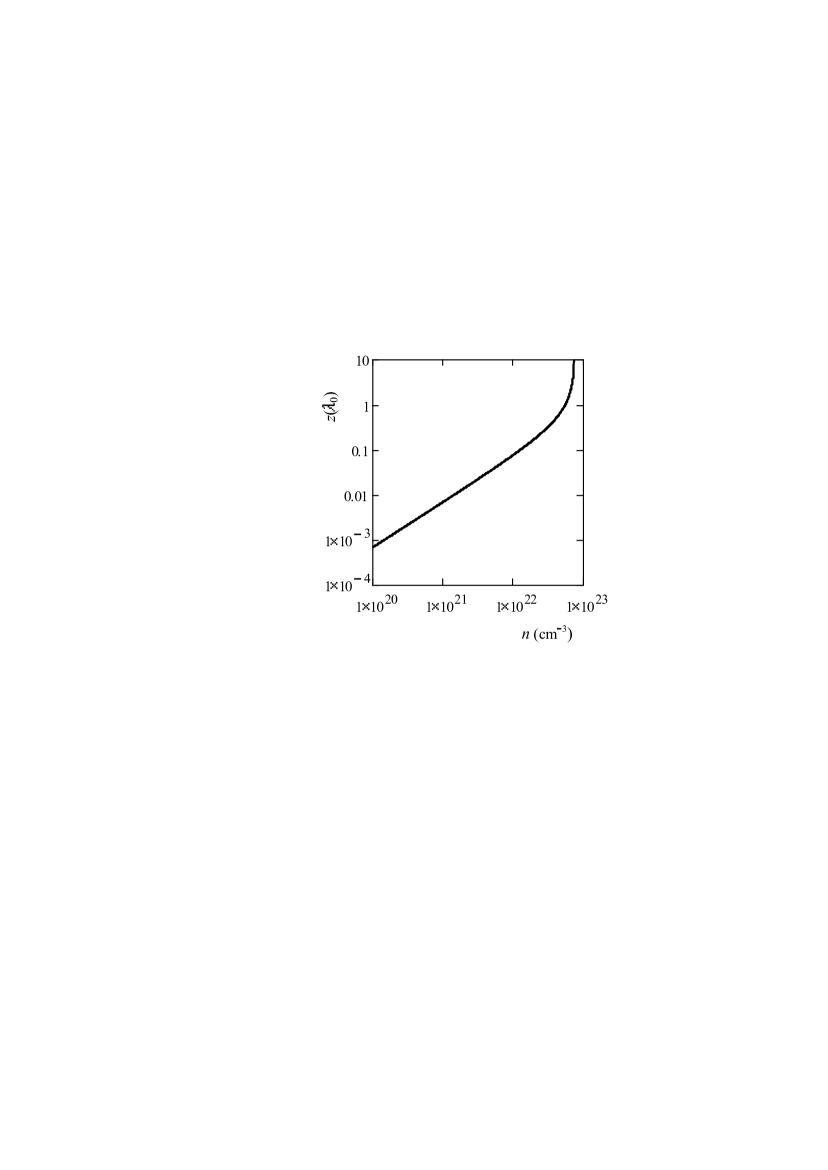
The Ly line of optical spectrum of an isolated hydrogen atom has the wavelength . Eq. (20) gives the value at this value of . Such a value of is close to the atom concentration in a solid. Solid bodies have the atom concentration of the order of . Therefore, Eq. (19) gives at the hydrogen atom concentration in dust particles that are close to this value of . Figure 3 shows the dependence of the redshift parameter on the hydrogen atom concentration at the wavelength . It gives that a quasar dust cloud can give a high value of this parameter if the dust particles of this cloud have a high hydrogen atom concentration.
V Discussion and conclusions
If we take into account the electrical polarization of hydrogen atoms, then the red shift of spectral lines of these atoms and the dip in their optical spectrum appear. This dip is on the blue side relative to the place of the shifted line. The red shift value and the width of the dip strongly depend on the hydrogen atom concentration and the place of the not shifted line.
This effect is significant for interstellar hydrogen atoms if the wavelength of the spectral lines of these atoms is in the radio frequency range.
The value of this effect can be significant for the optical spectrum of hydrogen atoms that can be in interstellar dust clouds. Perhaps this is due to the high concentration of hydrogen atoms in the dust substance.
Quasars in which dust clouds are of significant importance Fan (2006) give experimental spectra with such features Pradhan and Nahar (2011); Fan (2006, 2012). The line Ly of hydrogen atoms of quasars has a high red shift (Fig. 14.4 Pradhan and Nahar (2011), Fig. 1 Fan (2006), and Fig. 8 Fan (2012)). Besides, this line has a dip on the blue side relative to the shifted line (Fig. 14.4 Pradhan and Nahar (2011), Fig. 1 Fan (2006), and Fig. 8 Fan (2012)).
These results are essential for astrophysics. Therefore, it is desirable to test them experimentally in terrestrial laboratories. Indeed, in laboratory conditions, there are methods to obtain and stabilize hydrogen atoms both in the state of free gas Leonas (1981); Silvera and Walraven (1982); Gamburg et al. (1989) and as part of a solid Gamburg et al. (1989); Fukai (2005).
References
- Bakhshiev (1987) N. G. Bakhshiev, Introduction to Molecular Spectroscopy, 2nd ed. (Izdat. Leningr. Univ., Leningrad, 1987) in Russian.
- Sobolev (1985) V. V. Sobolev, Course in Theoretical Astrophysics, 3rd ed. (Nauka Press, Moscow, 1985) in Russian.
- Pradhan and Nahar (2011) A. K. Pradhan and S. N. Nahar, Atomic Astrophysics and Spectroscopy (Cambridge University Press, Cambridge, 2011).
- Rybicki and Lightman (2004) G. B. Rybicki and A. P. Lightman, Radiative Processes in Astrophysics (Wiley-VCH Verlag GmbH & Co. KGaA, Weinheim, 2004).
- Römer (2005) H. Römer, Theoretical Optics. An Introduction (Wiley-VCH Verlag GmbH & Co. KGaA, Weinheim, 2005).
- Platzman and Volf (1975) P. M. Platzman and P. A. Volf, Waves and Interactions in Solid State Plasmas (Mir, Moscow, 1975) russian translation.
- Iinskiy and Keldysh (1989) Y. A. Iinskiy and L. Keldysh, Interaction of Electromagnetic Radiation with Matter (Moscow State University, Moscow, 1989) in Russian.
- Landau and Lifshitz (1982) L. D. Landau and E. M. Lifshitz, Electrodynamics of Continuous Media (Nauka Press, Moscow, 1982) in Russian.
- Kubo (1966) R. Kubo, Rep. Progr. Phys. 29, 255 (1966).
- Izuyma (1961) T. Izuyma, Progr. Theor. Phys. 25, 964 (1961).
- Eykholt (1986) R. Eykholt, Phys. Rev. B 34, 6669 (1986).
- Severin (1990) V. S. Severin, Opt. Spectrosk. [Opt. Spectros. (USSR)] 69, 212 (1990), in Russian.
- Severin (1994) V. S. Severin, Ukr. Fiz. Zh. (Ukr. Ed.) [Ukr. Phys. J.] 39, 799 (1994), in Ukrainian.
- Vakulenko and Severin (2007a) O. V. Vakulenko and V. S. Severin, Metallofizika I noveyshiye tekhnologii 29, 41 (2007a), in Russian.
- Vakulenko and Severin (2007b) O. V. Vakulenko and V. S. Severin, Semiconductor Physics, Quantum Electronics & Optoelectronics 10, 55 (2007b).
- Severin (2009) V. S. Severin, Semiconductor Physics, Quantum Electronics & Optoelectronics 12, 366 (2009).
- Severin (2012) V. S. Severin, Metallofizika I noveyshiye tekhnologii 34, 25 (2012), in Russian.
- Severin (2017) V. S. Severin, arXiv:1707.06518 [physics.optics] (2017).
- Draine (2011) B. T. Draine, Physics of the Interstellar and Intergalactic Medium (Princeton University Press, Princeton and Oxford, 2011).
- Dyson and Williams (1997) J. E. Dyson and D. A. Williams, The Physics of the Interstellar Medium, 2nd ed. (Institute of Physics Publishing, Bristol and Philadelphia, 1997).
- Boren and Huffman (1986) C. F. Boren and D. R. Huffman, Absorption and Scattering of Light by Small Particles (Mir Press, Moscow, 1986) russian translation.
- Gamburg et al. (1989) D. Y. Gamburg, V. P. Semenov, N. F. Dubovkin, and L. N. Smirnova, Hydrogen. Properties, Reception, Storage, Transportation, Application. Handbook, edited by D. Y. Gamburg and N. F. Dubovkin (Khimiya Press, Moscow, 1989) in Russian.
- Fukai (2005) Y. Fukai, The Metal-Hydrogen System: Basic Bulk Properties, 2nd ed. (Springer-Verlag Berlin Heidelberg, 2005).
- Fan (2006) X. Fan, New Astronomy Reviews 50, 665 (2006).
- Fan (2012) X. Fan, Research in Astronomy and Astrophysics 12, 865 (2012).
- Leonas (1981) V. B. Leonas, Usp. Fiz. Nauk [Sov. Phys. Usp.] 24, 318 (1981).
- Silvera and Walraven (1982) I. F. Silvera and J. Walraven, Sci. Am. 246, 66 (1982).