Exploring reionisation and high- galaxy observables with recent multi-redshift MWA upper limits on the 21-cm signal
Abstract
We use the latest multi-redshift () upper limits on the 21-cm signal from the Murchison Widefield Array (MWA) to explore astrophysical models which are inconsistent with the data. These upper limits are achieved using 298 h of carefully excised data over four observing seasons. To explore these upper limits in the context of reionisation astrophysics, we use 21CMMC, a Monte Carlo Markov Chain sampler of full 3D semi-numerical simulations of the cosmic 21-cm signal from 21CMFAST. Further, we connect these disfavoured regions of parameter space to existing observational constraints on the epoch of reionisation such as high- galaxy ultra-violet (UV) luminosity functions, background UV photoionisation rate, intergalactic medium (IGM) neutral fraction, the electron scattering optical depth and the soft-band X-ray emissivity. We find that the vast majority of astrophysical models disfavoured by the latest MWA limits are already inconsistent with existing observational constraints. These inconsistent models arise from two classes of models: (i) ‘cold’ reionisation and (ii) pure matter density fluctuations (i.e. no reionisation). However, there are a small subsample of models which are consistent. This implies that the existing MWA limits are already beginning to provide unique information to disfavour astrophysical models of reionisation, albeit extremely weakly. Using these latest MWA upper limits on the 21-cm signal, we provide the first limits on the soft-band X-ray emissivity from galaxies at high redshifts. We find lower limits of erg s-1 Mpc-3. Finally, we place limits on the IGM spin temperature, disfavouring values below 1.3, 1.4, 1.5, 1.8, 2.1, 2.4 K at at 95 per cent confidence. We infer from this that the IGM must have undergone, at the very least, a small amount of X-ray heating. Note that the limits on both and are conditional on the IGM neutral fraction.
keywords:
cosmology: theory – dark ages, reionisation, first stars – diffuse radiation – early Universe – galaxies: high-redshift – intergalactic medium1 Introduction
Prior to the formation of the first stars and galaxies, the Universe is opaque to visible radiation due to the neutral hydrogen fog that pervades. This fog can only be lifted once the cumulative ionising radiation escaping from the stars and galaxies exceed the recombination rate of the neutral hydrogen. This transition is referred to as the Epoch of Reionisation (EoR), and corresponds to the final major baryonic phase change of the Universe. Observing this phase transition is vitally important as it can reveal insights into the properties of the first astrophysical sources.
Our most promising avenue for detecting the EoR is through observing the 21-cm hyperfine transition of the neutral hydrogen in the intergalactic medium (IGM) (see e.g. Furlanetto et al., 2006; Morales & Wyithe, 2010; Pritchard & Loeb, 2012; Zaroubi, 2013; Barkana, 2016). The radiation from these first stars and galaxies leaves an imprint on the thermal and ionisation state of the IGM, detectable via this 21-cm signal. Importantly, since it is a line transition, the spatial and frequency (redshift) dependence of the 21-cm signal can yield a three dimensional time-lapse of the history of the IGM. From this, we will be able to infer the ultra-violet (UV) and X-ray properties of the astrophysical sources responsible for reionisation.
Unfortunately, observing the cosmic 21-cm signal is extremely difficult, owing to the fact that the signal is five orders of magnitude fainter than the astrophysical foregrounds. Nevertheless this has not deterred numerous experiments from embarking on detecting this elusive signal. These experiments can be broadly classified into two types: (i) global signal experiments which spatially average the signal over the entire sky and (ii) large-scale interferometers sensitive to the spatial fluctuations in the 21-cm signal.
Global signal experiments are conceptually simpler as they typically consist of only a single dipole. Completed or ongoing experiments include, the Experiment to Detect the Global EoR Signature (EDGES; Bowman & Rogers 2010), the Sonda Cosmológica de las Islas para la Detección de Hidrógeno Neutro (SCI-HI; Voytek et al. 2014), the Shaped Antenna measurement of the background RAdio Spectrum (SARAS; Patra et al. 2015), Broadband Instrument for Global HydrOgen ReioNisation Signal (BIGHORNS; Sokolowski et al. 2015), the Large Aperture Experiment to detect the Dark Ages (LEDA; Greenhill & Bernardi 2012; Bernardi et al. 2016a), Probing Radio Intensity at high-Z from Marion (PRIZM; Philip et al. 2019) and the Netherlands-China Low-Frequency Explorer (NCLE111https://www.isispace.nl/projects/ncle-the-netherlands-china-low-frequency-explorer/).
The first generation of large-scale radio interferometers, the Low-Frequency Array (LOFAR; van Haarlem et al. 2013), the Murchison Wide Field Array (MWA; Tingay et al. 2013; Wayth et al. 2018) and the Precision Array for Probing the Epoch of Reionisation (PAPER; Parsons et al. 2010) have limited sensitivities, requiring long integration times to potentially yield a low signal-to-noise detection of the cosmic 21-cm signal. These experiments have additionally informed the development of the next generation of significantly larger interferometers; the Hydrogen Epoch of Reionization Array (HERA; DeBoer et al. 2017) and the Square Kilometre Array (SKA; Mellema et al. 2013; Koopmans et al. 2015). With these next generation instruments, not only should we be able to provide high signal-to-noise statistical detections across multiple redshifts, we should also be able to provide the first three-dimensional tomographic images of the EoR.
Other than a reported detection of an absorption feature near by EDGES (Bowman et al., 2018a), whose cosmological origins are still heavily questioned (see e.g. Hills et al., 2018; Draine & Miralda-Escudé, 2018; Bowman et al., 2018b; Bradley et al., 2019; Singh & Subrahmanyan, 2019), we are left only with upper limits on the 21-cm signal. For example, limits on the sky-averaged signal have been obtained with LEDA (Bernardi et al., 2016b), EDGES high-band (Monsalve et al., 2017) and SARAS2 (Singh et al., 2017). Upper limits on the 21-cm spatial fluctuations, measured through the power spectrum (PS), have been measured at many frequencies (redshifts) and spatial scales throughout the literature, making direct comparisons complicated. The first upper limits were achieved with the Giant Metrewave Radio Telescope (GMRT; Paciga et al. 2013) at . Since then, upper limits have been published by LOFAR at (Patil et al., 2017) and (Gehlot et al., 2019), PAPER at (Cheng et al., 2018; Kolopanis et al., 2019), MWA at (Dillon et al., 2015; Beardsley et al., 2016; Barry et al., 2019; Li et al., 2019) and by the Owens Valley Radio Observatory Long Wavelength Array (OVRO-LWA; Eastwood et al. 2019) at .
Recently, both LOFAR (Mertens et al., 2020) and the MWA (Trott et al., 2020) published their current best upper limits on the 21-cm PS. For LOFAR this culminated in a best upper limit at from 141 hours of observations. In the case of the MWA, following careful quality control of the data, deep multi-redshift limits were achieved from 298 h of observations at six separate redshifts spanning . While these new limits still remain a few orders of magnitude above fiducial theoretical models, they are aggressive enough to explore extreme models of reionisation. For example, ‘cold’ reionisation, where the 21-cm PS amplitude can be in excess of due to large temperature contrasts between the neutral and ionised IGM (e.g. Mesinger et al., 2014; Parsons et al., 2014). This occurs when the neutral IGM undergoes little to no heating and adiabatically cools faster than the Cosmic Microwave Background (CMB) temperature with the expansion of the Universe.
In this work, we shall focus explicitly on exploring the astrophysical models inconsistent with the MWA multi-redshift limits from Trott et al. (2020). Similar analyses have already been performed for LOFAR in the context of general IGM properties such as the neutral fraction and spin temperature (Ghara et al., 2020), the excess radio background (Mondal et al., 2020) and high- galaxy and reionisation observables Greig et al. (2020). Here, we follow the same approach as Greig et al. (2020).
Our exploration takes advantage of 21CMMC222https://github.com/BradGreig/21CMMC (Greig & Mesinger, 2015, 2017, 2018; Park et al., 2019), a Monte-Carlo Markov Chain (MCMC) sampler of the semi-numerical reionisation code 21CMFAST333https://github.com/andreimesinger/21cmFAST(Mesinger & Furlanetto, 2007; Mesinger et al., 2011). 21CMMC forward models the full 3D cosmic 21-cm signal provided by 21CMFAST in a fully Bayesian framework allowing us to compare against observations of the first billion years of the Universe. In particular, we adopt the Park et al. (2019) galaxy model parameterisation allowing direct comparison against high- galaxy ultra-violet (UV) luminosity functions (LFs).
The outline of this work is as follows. In Section 2, we summarise the 21CMFAST astrophysical model before outlining the 21CMMC setup in Section 3. In Section 4 we discuss our main results before providing our conclusions in Section 5. Unless otherwise stated, all quantities are in co-moving units with the following adopted cosmological parameters: (, , , , , ) = (0.69, 0.31, 0.048, 0.97, 0.81, 68 km s-1 Mpc-1), consistent with recent results from the Planck mission (Planck Collaboration XIII, 2016).
2 Modelling the 21-cm signal
The cosmic 21-cm signal is modelled using the semi-numerical simulation code, 21CMFAST (Mesinger & Furlanetto, 2007; Mesinger et al., 2011). In particular, we use the Park et al. (2019) astrophysical parameterisation, which allows the star-formation rate and ionising escape fraction to depend on the mass of the host dark matter halo. This, following some simple conversions, enables 21CMFAST to produce UV LFs that are able to be compared against observed high- galaxy LFs. Additionally, we also include a recipe for an on-the-fly ionising photon non-conservation correction (Park et al., in prep) to account for the fact that 3D excursion set approaches that track ionisations are not photon conserving (e.g. McQuinn et al., 2005; Zahn et al., 2007; Paranjape & Choudhury, 2014; Paranjape et al., 2016; Hassan et al., 2017; Choudhury & Paranjape, 2018; Hutter, 2018; Molaro et al., 2019). Below, we shall outline the important aspects of 21CMFAST which lead to the modelling of the 21-cm signal, and defer the reader to the aforementioned publications for further details.
2.1 Galaxy UV Properties
The typical stellar mass of a galaxy, , is assumed to be directly related to its host halo mass, (e.g. Kuhlen & Faucher-Giguère, 2012; Dayal et al., 2014; Behroozi & Silk, 2015; Mitra et al., 2015; Mutch et al., 2016; Ocvirk et al., 2016; Sun & Furlanetto, 2016; Yue et al., 2016; Hutter et al., 2020):
| (1) |
where is the fraction of galactic gas in stars given by:
| (2) |
with being its normalisation and a power-law444A power-law dependence between and at is consistent with the mean behaviour of both semi-analytic model predictions (e.g Mutch et al., 2016; Yung et al., 2019; Hutter et al., 2020) and semi-empirical fits to observations (e.g. Harikane et al., 2016; Tacchella et al., 2018; Behroozi et al., 2019). index, .
The star-formation rate (SFR) is then estimated by dividing the stellar mass by a characteristic time-scale,
| (3) |
where is a free parameter allowed to vary between zero and unity and is the Hubble time.
A galaxy’s UV ionising escape fraction, , is equivalently allowed to vary with halo mass,
| (4) |
with normalisation set by and a power-law index, .
Finally, to account for inefficient cooling and/or feedback processes which can prevent small mass halos from hosting active, star-forming galaxies, a duty-cycle is included to suppress their contribution:
| (5) |
This results in a fraction, , of host haloes which do not host star-forming galaxies, whose suppression scale is controlled by (e.g. Shapiro et al., 1994; Giroux et al., 1994; Hui & Gnedin, 1997; Barkana & Loeb, 2001; Springel & Hernquist, 2003; Mesinger & Dijkstra, 2008; Okamoto et al., 2008; Sobacchi & Mesinger, 2013a, b).
In summary, we have six free parameters, , , , , and , which describe the galaxy UV properties.
2.2 Galaxy X-ray Properties
In the early Universe, X-rays escaping from the first galaxies, likely from stellar remnants, are thought to be responsible for the heating of the IGM. X-ray heating in 21CMFAST is modelled by calculating the cell-by-cell angle-averaged specific X-ray intensity, , (in erg s-1 keV-1 cm-2 sr-1). This is obtained by integrating the co-moving X-ray specific emissivity, back along the light-cone:
| (6) |
where accounts for attenuation by the IGM. In the emitted frame, , the co-moving specific emissivity is,
| (7) |
where is the mean, non-linear density in a shell around and the quantity in square brackets is the SFR density along the light-cone.
This expression is normalised by the specific X-ray luminosity per unit star formation escaping the host galaxies, (erg s-1 keV-1 yr). The X-ray luminosity is assumed to be a power-law with respect to photon energy, , which is attenuated below a threshold energy, , to account for absorption of low energy X-rays by a neutral interstellar medium within the host galaxy. Finally, this specific luminosity is then normalised to an integrated soft-band ( keV) luminosity per SFR (in erg s-1 yr), which is a free parameter in the model:
| (8) |
A limit of corresponds to a mean-free path of the order of the Hubble length at high redshifts, implying harder X-ray photons do not contribute to IGM heating (e.g. McQuinn, 2012).
In summary, there are three free model parameters describing the X-ray properties of the first galaxies, , and .
2.3 Ionisation and Thermal State of the IGM
At any redshift within 21CMFAST the evolved IGM density and velocity fields are obtained following second-order Lagrange perturbation theory (e.g Scoccimarro, 1998) from an initial high resolution linear density field. The ionisation field is then determined from the evolved density field by the excursion-set approach (Furlanetto et al., 2004), whereby the balance between the cumulative number of ionising photons and the number of neutral hydrogen atoms plus cumulative recombinations are tracked within spheres of decreasing radii. A cell is considered ionised when,
| (9) |
where is the cumulative number of recombinations (e.g. Sobacchi & Mesinger, 2014) and , corresponds to ionisations by X-rays, which are expected to contribute at the per cent level (e.g. Ricotti & Ostriker, 2004; Mesinger et al., 2013; Madau & Fragos, 2017; Ross et al., 2017; Eide et al., 2018). This first term, , is the cumulative number of IGM ionising photons per baryon inside a spherical region of size, and corresponding overdensity, ,
| (10) |
where is the mean baryon density and is the number of ionising photons per stellar baryon555We assume , corresponding to a Salpeter initial mass function (Salpeter, 1955); however note that this is highly degenerate with the fraction of galactic gas in stars, ..
2.4 Ionising Photon Non-Conservation Correction
Excursion-set approaches for tracking ionisations in three dimensions, like that employed by 21CMFAST, do not conserve ionising photons. This is driven by the surplus of ionising photons remaining within a cell after exceeding the ionisation criteria (Eq. 9) that are not propagated further into the IGM. In effect, this results in an effective bias on the ionising escape fraction, . This behaviour has been studied extensively in the literature and has been shown to result in a loss of per cent of the ionising photons (e.g. McQuinn et al., 2005; Zahn et al., 2007; Paranjape & Choudhury, 2014; Paranjape et al., 2016; Hassan et al., 2017; Choudhury & Paranjape, 2018; Hutter, 2018; Molaro et al., 2019).
Recently, explicit photon conserving algorithms for semi-numerical simulations have been introduced by Choudhury & Paranjape (2018) and Molaro et al. (2019). However, despite being orders of magnitude faster than full radiative-transfer simulations they remain too slow when forward modelling the 21-cm signal in the high-dimensional parameter spaces required to characterise the ionising, soft UV, and X-ray properties of the first galaxies.
Alternatively, Park et al., in prep, introduce an approximate correction to the effective bias on by analytically solving for the evolution of the ionisation fraction given a source model, assuming no correlations between the sources and sinks666This assumption only breaks down for the final per cent of the EoR (Sobacchi & Mesinger, 2014).. By comparing this analytic expression against a calibration curve (generated from 21CMFAST including only ionisations) the delay in the resultant reionisation history (owing to the loss of photons) can be corrected for by modifying the redshift at which ionisations are determined. For the duration of the EoR, this correction results in a shift in redshift of .
2.5 21-cm Brightness Temperature
Finally, the observed 21-cm signal is measured as a brightness temperature contrast relative to the CMB temperature, (e.g. Furlanetto et al., 2006):
| (11) |
where is the optical depth of the 21-cm line,
| (12) |
Here, corresponds to the neutral hydrogen fraction, is the gas density, is the Hubble parameter, is the line-of-sight component of the velocity gradient and is the gas spin temperature. All quantities, obtained following the method described in the previous sections are evaluated at redshift , where is the 21-cm frequency and we drop the spatial dependence for brevity. Redshift space distortions along the line-of-sight are additionally included as outlined in Mao et al. (2012); Jensen et al. (2013); Greig & Mesinger (2018).
3 21CMMC setup
21CMMC (Greig & Mesinger, 2015, 2017, 2018; Park et al., 2019) is the publicly available, massively parallel MCMC sampler of the 3D semi-numerical reionisation simulation code 21CMFAST (Mesinger & Furlanetto, 2007; Mesinger et al., 2011). It is based on the publicly available Python module CosmoHammer (Akeret et al., 2013). MCMC sampling is performed using the Emcee Python module (Foreman-Mackey et al., 2013), which is an affine invariant ensemble sampler from Goodman & Weare (2010). For each proposed parameter set in the MCMC, 21CMMC performs an independent 3D realisation of the 21-cm signal, allowing any quantity to be sampled (e.g. the 21-cm PS). Below, we outline the astrophysical parameter set to be explored within this work (Section 3.1), the interpretation of the MWA upper limits (Section 3.2) and the 21CMMC setup (Section 3.3).
3.1 Astrophysical parameter set
For the adopted model described in Section 2, we have nine astrophysical parameters. Below, we summarise each parameter as well as the corresponding assumed parameter ranges (which we have adopted based on previous works, e.g. Greig et al. 2017; Park et al. 2019). Additionally, we summarise these parameter ranges in the top row of Table 1. Throughout, we assume flat priors on each astrophysical parameters.
-
(i)
: the fraction of galactic gas in stars evaluated at a halo mass of 10. The log quantity is allowed to vary as, .
-
(ii)
: the power-law index for the halo mass dependent star-formation. This is varied between, .
-
(iii)
: the ionising UV escape fraction evaluated at a halo mass of 10. The log of this quantity varies between, .
-
(iv)
: the power-law index for halo mass dependent ionising UV escape fraction. This is varied between, .
-
(v)
: the star-formation time scale as a fraction of the Hubble time, which is varied in the range, .
-
(vi)
: the characteristic halo mass below which the abundance of active star-forming galaxies are exponentially suppressed by a duty cycle (see Equation 5). We allow this to vary between, .
-
(vii)
: the minimum energy threshold above which X-ray photons can escape their host galaxy. We allow this to vary between, keV, which corresponds of an integrated column density of, .
-
(viii)
: the soft-band X-ray luminosity per unit star-formation from the keV energy band. We vary this between, . This lower bound is considerably lower than what is typically adopted (i.e. Park et al., 2019) in-order to explore extreme ‘cold’ reionisation scenarios.
-
(iv)
: the power-law index of the X-ray source spectral energy distribution (SED), which we allow to vary between .
3.2 The latest MWA 21-cm upper limits
Recently, Trott et al. (2020) published deep, multi-redshift upper limits on the 21-cm signal from the EoR using the MWA. These limits are obtained at across six redshift bins from using 298 h of carefully selected clean observations over four observing seasons. At , these correspond to the lowest yet available upper limits on the reionisation epoch.
Unfortunately, these upper limits are still too large to begin to provide statistical constraints on astrophysical models of reionisation. However, we can instead use these upper limits to explore astrophysical models that exceed (i.e. are disfavoured by) the existing observational limits placed by the MWA. This follows the same approach to that applied to the recent upper limits on the 21-cm signal at achieved by LOFAR (Ghara et al. 2020; Greig et al. 2020; Mondal et al. 2020).
In order to explore astrophysical models disfavoured by the MWA, we construct a likelihood function of the following form:
| (13) |
Here, corresponds to the astrophysical parameter set (i.e. model), is the model 21-cm PS (from 21CMFAST) as a function of and and is the probability of the model 21-cm PS exceeding the MWA upper-limit. The integral over the range accounts for uncertainties on the amplitude of the modelled 21-cm PS.
The probability of the 21-cm PS to be in excess of the upper limits is obtained from the true, measured probability density functions (PDFs) of the 21-cm PS amplitude used to construct the observed upper limits from Trott et al. (2020). In effect, goes to zero for decreasing 21-cm PS amplitudes below the MWA upper limits and approaches unity for model 21-cm PS amplitudes far in excess of the upper-limit.
In this work, we combine the data from all six redshift bins ( and 8.7) with the first four Fourier bins, and 0.35 Mpc-1. Note that for smaller scales (i.e. larger ), the upper limits (and associated errors) become sufficiently large that they provide very little additional information (see e.g. Figure 1).
3.3 Simulations
Now, with our likelihood described as above, we outline the simulation setup adopted for 21CMMC. In order to sufficiently sample the upper-limit at the largest spatial scale ( Mpc-1), we perform 3D realisations of the 21-cm signal in a volume with length 250 Mpc and 128 voxels per side-length. For our total uncertainty, , on the modelled 21-cm PS we sum in quadrature a conservative 20 per cent multiplicative modelling uncertainty777This modelling uncertainty is motivated by approximations adopted in semi-numerical simulations relative to radiative-transfer simulations (e.g. Zahn et al., 2011; Ghara et al., 2018; Hutter, 2018). on the sampled 21-cm PS with the estimated sample variance from our simulation setup. Note that for this simulation setup, the estimated sample variance on the 21-cm PS at Mpc-1 is per cent.
4 Results
4.1 Disfavoured 21-cm PS
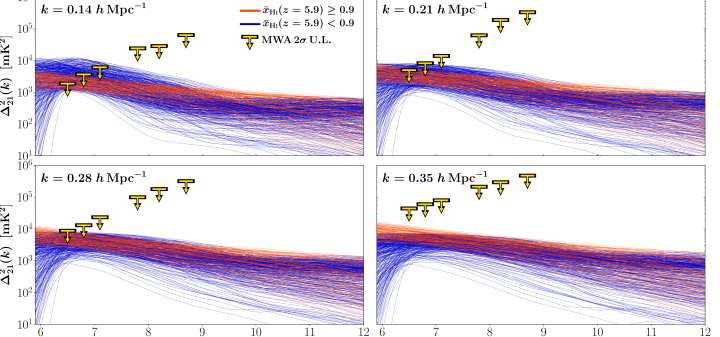
Before exploring the implications of the latest MWA upper limits (Trott et al., 2020) on the individual astrophysical parameters describing reionisation, it is first illustrative to explore the 21-cm PS which are disfavoured by the observational limits. In Figure 1 we show the evolution in the 21-cm PS as a function of redshift for the first four Fourier modes (). The thin blue and red curves correspond to 500 randomly sampled 21-cm PS which are separated by the resultant neutral fraction at in order to distinguish between two types of models.
Typically, when presenting the 21-cm PS evolution as a function of redshift, one expects to observe three distinctive peaks at large-scales in the PS amplitude (e.g. Pritchard & Furlanetto, 2007; Baek et al., 2010; Mesinger et al., 2011). These are, in order of increasing redshift, driven by (i) reionisation, (ii) X-ray heating and (iii) Wouthuysen–Field (WF) coupling. In the case of these extreme ‘cold’ reionisation models (i.e. absence of X-ray heating), we expect no secondary peak, with a single large amplitude peak during reionisation along with a WF-coupling peak at higher redshifts.
This reionisation peak is clearly exhibited by the blue curves in Figure 1, which corresponds to IGM neutral fractions below 90 per cent at . Here, the 21-cm PS amplitude peaks at before rapidly dropping in amplitude as reionisation completes. These models are indicative of these ‘cold’ reionisation models, with the fluctuations being driven by the patchy nature of reionisation and the amplitude as a result of the large temperature contrasts in the cold, neutral IGM. These astrophysical models clearly exceed the recent upper limits presented by the MWA (Trott et al., 2020), highlighting that the MWA can already begin to rule out such extreme models.
Note however that the 21-cm PS can only exceed the latest MWA upper limits at the largest scale (). For larger (smaller scales) the MWA upper limits increase significantly to render all models consistent with the data. Thus, almost all of the constraining power arises from the redshift evolution of the large-scale power. This highlights that, in order to produce the largest gains in ruling out regions of astrophysical parameter space, in the short term observational efforts should focus on improving the 21-cm PS upper limits at large scales, where this ‘bump’ in the redshift evolution occurs as a result of reionisation.
For the second type of models, corresponding to an IGM neutral fraction above 90 per cent at (denoted by the red curves in Figure 1), we observe no distinctive features. The 21-cm PS amplitude exhibits a smooth increase in amplitude with decreasing redshift. Again, the large amplitudes are driven by the large temperature contrasts in the cold, neutral IGM, however, the high neutral fractions (as indicated by the large IGM neutral fraction at ) are indicative of models where reionisation has yet to commence. Thus, these smooth, featureless 21-cm PS are simply driven by fluctuations in the underlying matter density field. This is the first time astrophysical models driven by pure matter density fluctuations have been found to be disfavoured by limits from the 21-cm signal.
4.2 Disfavoured astrophysical parameters
| Prior ranges | [-3.0, 0.0] | [-0.5,1.0] | [-3.0, 0.0] | [-1.0,0.5] | [8.0,10.0] | (0.0,1.0] | [30.0,42.0] | [0.2,1.5] | [-1.0,3.0] |
|---|---|---|---|---|---|---|---|---|---|
| 68th percentile limits | [-2.40, -0.75] | [-0.5, 0.75] | [-3.0, -1.75] | [-1.0, 0.21] | [8.40, 10.0] | (0.0, 0.55] | [30.0, 35.9] | [0.35,1.5] | [-1.0,3.0] |
| 95th percentile limits | [-2.88, -0.11] | [-0.5, 0.96] | [-3.0, -0.80] | [-1.0, 0.45] | [8.06, 10.0] | (0.0, 0.91] | [30.0, 37.8] | [0.14,1.5] | [-1.0,3.0] |
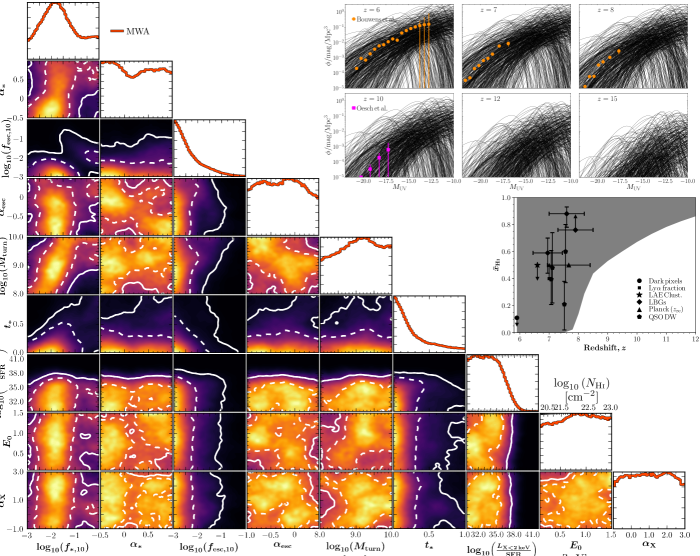
In Figure 2, we present the marginalised one and two dimensional posterior distributions recovered from 21CMMC for the nine astrophysical parameters disfavoured by the multi-frequency upper limits on the 21-cm PS from the MWA (Trott et al., 2020). It is important to note that these posteriors are obtained using only the MWA upper limits, with no other existing observation constraints used. Dashed (solid) white contours on the two dimensional posteriors correspond to the 68th (95th) percentile limits. The one dimensional marginalised 68th and 95th percentile limits on each parameter are summarised in Table 1.
At this point it is important to remember that these marginalised posteriors only contain information about the astrophysical models which can exceed the recent MWA upper limits on the 21-cm signal. These marginalised posteriors do not imply that these regions of astrophysical parameter space are ruled out at any statistical significance. Rather, it is indicative of the types of extreme astrophysical models that observational experiments such as the MWA are already starting to disfavour888These extreme models occupy only a very small sub-volume of the total allowed parameter volume, thus they are not significant enough to result in actual constrains once we marginalise over the full parameter space. Further, it is a demonstration of the necessity of forward modelling tools such as 21CMMC for exploring and interpreting observational data. Nevertheless, below we discuss some of the implications on the EoR that can be made from the recent MWA upper limits.
Additionally, it is also worth noting that the results presented in this work are specific to the underlying astrophysical model assumptions. For example, the astrophysical parameterisation used in 21CMFAST assumes only a single ionising source population and further, ignores any explicit redshift dependence on the escape fraction or stellar mass. However, there is currently no evidence for a more complex parameterisation as the simple Park et al. (2019) model has been shown to be consistent with galaxy UV LFs, semi-numerical SAMs and hydrodynamical simulations.
The main observation we can take from Figure 2 are the limits on the soft-band X-ray luminosity, . The primary role of this X-ray luminosity is to control the amount of heating the IGM incurs between the dark ages and the EoR as a result the thermal energy deposited by the X-rays. Low values of this quantity are responsible for producing both: (i) the extreme ‘cold’ reionisation scenarios represented by the blue curves in Figure 1 and (ii) the large amplitude 21-cm PS due only to the matter density fluctuations (red curves in Figure 1). With these latest MWA upper limits we recover, at 95 per cent confidence, disfavoured limits of , implying the MWA disfavours models with lower soft-band X-ray luminosities. Presently, these disfavoured limits sit well below our current expectations from observations of analogue low-redshift star-forming galaxies (Mineo et al., 2012), stacked Chandra observations (Lehmer et al., 2016) and predictions at high-redshift from population synthesis models (Fragos et al., 2013) (see Section 4.3.5 for more details). In contrast, for the remaining two galaxy X-ray properties, and , we recover no meaningful limits, owing to the fact we are disfavouring low amplitude soft-band X-ray luminosities. In the absence of X-ray heating, the shape of the X-ray SED does not matter.
Unfortunately, as we are only exploring models in excess of the 21-cm upper limits, it is not fair to perform direct comparisons between these results and those presented by LOFAR at . The primary reason for this is that this approach is sensitive only to models that maximise the 21-cm PS (in order to exceed the upper limits on the 21-cm signal). In this work, the MWA upper limits are most sensitive to reionisation models that produce 21-cm PS that peak at (see Figure 1), whereas the current LOFAR limits are sensitive to only a single redshift at . Further, the existing LOFAR limits are more sensitive to the larger spatial scales (i.e. Mpc-1). Thus the disfavoured regions of each experiment are sensitive to different reionisation models. Nevertheless, one could in principal combine the recent limits from both the MWA and LOFAR, to improve our understanding of these disfavoured regions, however we postpone that to future work.
In terms of the galaxy UV properties, the strongest disfavoured limits are on the fraction of galactic gas in stars, , the escape fraction, , and the SFR time-scale, . Again, these limits are driven by seeking to maximise the 21-cm PS amplitude between (the reionisation ‘peak’ at in Figure 1). Qualitatively speaking, this occurs when reionisation is roughly close to its midpoint (i.e. ; Mellema et al. 2006; Lidz et al. 2008)999However, note that this dependence between the peak of the 21-cm PS and is strongly model dependent.. For example, both and , which are highly-degenerate in the absence of constraints from UV LFs (e.g. Park et al., 2019), control the timing of reionisation. Thus, limits on these quantities are driven to very low values (minimising the number of ionising photons produced), pushing reionisation to occur at lower redshifts (i.e. ). However, rather than producing a limit for , we see a clear peak for at . This is driven by the overlap of the resultant posteriors for the two distinct models outlined in the previous section (i.e. ‘cold’ reionisation and the matter density fluctuations).
For , the disfavoured limits are driven by their degeneracy with the soft-band X-ray luminosity101010Again, this degeneracy only exists in the absence of other constraints on , such as from observed UV galaxy LFs (e.g. Park et al., 2019).. In this model the number of X-ray photons produced are inversely proportional to the SFR time-scale. For extremely short SFR time-scales, this can result in a large number of X-ray photons, subsequently heating the IGM and decreasing the amplitude of the resultant 21-cm PS. As a result, this places a disfavoured limit on short star-formation time-scales.
4.3 Comparison against existing observations
Now that we have explored the disfavoured astrophysical parameters above, we now shift our focus towards how these models compare against existing observational constraints on the reionisation epoch.
4.3.1 Reionisation history
In the middle right panel of Figure 2, we explore the reionisation histories of these disfavoured astrophysical models. In the shaded region, we present the full range of reionisation histories inconsistent with the latest MWA upper limits on the 21-cm signal. Overlaid on this, we highlight all existing constraints on the IGM neutral fraction. These include limits from the dark pixel statistics of high- quasars (QSOs; McGreer et al. 2015), the Ly fraction (Mesinger et al., 2015), the clustering of Ly emitters (LAEs; Sobacchi & Mesinger 2015), the Ly equivalent width distribution of Lyman-break galaxies (LBGs; Mason et al. 2018; Hoag et al. 2019; Mason et al. 2019), the neutral IGM damping wing imprint from high- QSOs (Greig et al., 2017; Davies et al., 2018; Greig et al., 2019) and the midpoint of reionisation () from Planck (Planck Collaboration et al., 2018). Note that this shaded region represents only those models disfavoured by (i.e. exceed) the recent MWA upper limits. The vast majority of astrophysical models consistent with the existing observational constraints produce 21-cm PS which are below the existing upper limits from MWA.
Importantly, since the range of disfavoured reionisation histories is completely consistent with existing observational constraints, this implies that the latest MWA upper limits on the 21-cm signal are already sufficient to disfavour models which would otherwise be consistent with existing observations. That is, the MWA is already providing unique constraining power on the astrophysics of reionisation. However, owing to the still large amplitude limits, this constraining power is extremely weak. This differs from the picture presented in the equivalent analysis of the LOFAR upper limits (Greig et al., 2020), where the disfavoured models were already inconsistent with constraints on the IGM neutral fraction. The primary reason for this difference is the fact that the recent MWA limits are at multiple redshift (significantly broadening the range of disfavoured reionisation histories). For example, the models currently disfavoured by LOFAR exceed the upper limits at , whereas the models currently disfavoured by the MWA exceed the upper limits anywhere between .
4.3.2 UV luminosity functions
In the top right panel of Figure 2, we show 500 randomly drawn UV LFs (thin black curves) from the posterior of models disfavoured by the MWA upper limits from Trott et al. (2020) against observations of unlensed UV LFs at (orange circles; Bouwens et al. 2015; Bouwens et al. 2017) and at (pink squares; (Oesch et al., 2018)). This shows that the vast majority of UV LFs disfavoured by the current MWA limits are inconsistent with existing UV galaxy limits by several orders of magnitude. In fact, most of these would be strongly ruled out by existing UV LF observations owing to the relatively small observational uncertainties. Nevertheless, there are still some model UV LFs disfavoured by the current MWA limits consistent with these existing observations, again highlighting that the Trott et al. (2020) limits are providing additional (albeit very weak) constraining power.
It is at this point we emphasise the importance of using 21CMFAST in our Bayesian forward modelling approach. The in-built parameterisation of the ionising sources is able to directly output UV LFs which are capable of being compared to existing observational data. Additionally, this further highlights the synergy between observations of the cosmic 21-cm signal and galaxy UV LFs. Existing galaxy observations already place relatively tight constraints on the UV LF bright end, whereas observing the cosmic 21-cm signal can provide limits on both the very faint end of the underlying UV galaxy LFs and to much higher redshifts. However, we note that interpreting results from the 21-cm signal into galaxy UV LFs is entirely model dependent.
4.3.3 Electron scattering optical depth,
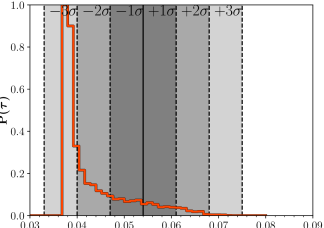
In Figure 3, we compare the electron scattering optical depth, , from the models disfavoured by the latest MWA upper limits (Trott et al., 2020) to the latest constraints measured by Planck (; Planck Collaboration et al. 2018). The solid vertical line denotes the mean value from Planck, with dashed vertical lines (and shaded regions) denoting , , from the mean value. The red curve represents a histogram of the calculated from all models in excess of at least one of the current MWA upper limits.
The vast majority of the models disfavoured by the latest MWA upper limits are inconsistent with existing observations at . These models prefer very low values, consistent with the preference for reionisation occurring as late as possible to exceed the MWA upper limits at (as discussed in Section 4.2). It is these models that produce the upper envelope of the shaded region for the disfavoured reionisation histories shown in Figure 2. Interestingly, the histogram exhibits an extremely long tail toward larger , crossing the observational constraints from Planck. Again, this implies there are reionisation models consistent with existing observational constraints that are already being disfavoured by the existing MWA upper limits (albeit extremely weakly).
4.3.4 Mean UV photo-ionisation rate,
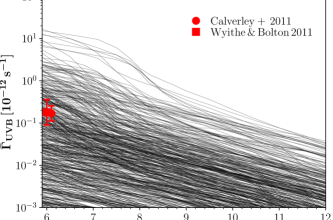
Finally, in Figure 4 we compare against the observational constraints on the mean UV background photoionisation rate (red data points) extracted from the proximity zones of QSOs (e.g. Calverley et al., 2011; Wyithe & Bolton, 2011). Again, we present 500 models (thin black curves) randomly drawn from the posterior of models disfavoured by the latest MWA upper limits (Trott et al., 2020). Once again, the vast majority of these disfavoured models are already ruled out by existing observational constraints, as highlighted by the large scatter (of several orders of magnitude) in the mean UV background photoionisation rate obtained from the 21CMFAST simulations. Further, the disfavoured models tend to lie on average below the existing observational constraints, implying a reduced output of ionising photons. This is consistent with what we have established from the previous sections. That being, in order to be able to exceed the current MWA upper limits, reionisation is preferred to occur at lower redshifts (or not at all), resulting in a smaller mean photo-ionisation background due to the lower numbers of ionising photons being produced.
4.3.5 X-ray emissivity,
Previously, we have shown that the models disfavoured by the existing MWA upper limits correspond to low X-ray luminosities (i.e. at 95 per cent confidence). This implies that the neutral IGM is cold, regardless of whether the fluctuations are driven by the patchy EoR or the underlying matter density field (blue and red curves in Figure 1, respectively). As a result, we can place limits on the soft-band X-ray emissivity () of high redshift galaxies (or indeed any source of energy injection into the neutral IGM). At we obtain lower limits on the soft band X-ray emissivity from the latest MWA upper limits of at . Note that as these limits are drawn from models that are disfavoured by the current MWA data, thus these limits are conditional on the resultant IGM neutral fraction.
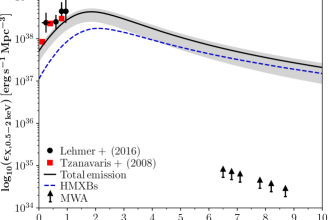
In Figure 5 we compare the resultant lower limits on the soft band (0.5 – 2 keV) X-ray emissivity implied by the latest MWA upper limits against existing observational constraints. The observational constraints were obtained from large samples of low redshift () galaxies obtained with Chandra; Tzanavaris & Georgantopoulos (2008) (red squares) and Lehmer et al. (2016) (black circles). All curves are obtained from Lehmer et al. (2016). The solid curve corresponds to the theoretical best-estimates for the evolution of the total X-ray emissivity, with contributions from low-mass X-ray binaries (LMXBs), high-mass X-ray binaries (HMXBs) and a hot interstellar medium. The corresponding shaded region accounts for uncertainties in the measurements of the SFR densities and stellar mass densities (e.g. Madau & Dickinson, 2014) as well as uncertainties in the XRB SED due to absorption. The blue dashed curve corresponds to the HMXB component, which is expected to dominate at high-redshifts.
Although our limits on the soft band X-ray emissivity are still 3 orders of magnitude below the expected values, these are the first such limits at these high redshifts. Further, these are obtained from the 21-cm signal, indicating the wealth of information available from the 21-cm signal on the physical properties of the first astrophysical sources. As the lower limits on the 21-cm signal continue to improve, these limits on the X-ray emissivity will approach the theoretical estimates, enabling constraints on the evolution of the X-ray sources to be inferred.
4.4 Disfavoured IGM properties
After exploring the astrophysical models disfavoured by the latest MWA upper limits (Trott et al., 2020) on the 21-cm signal against existing observations, we now investigate the inferred limits on the globally averaged IGM spin temperature. Note that the IGM spin temperature is not a free parameter of the model, rather it is self-consistently calculated within each simulation voxel within 21CMFAST (see e.g. Mesinger et al. 2011).
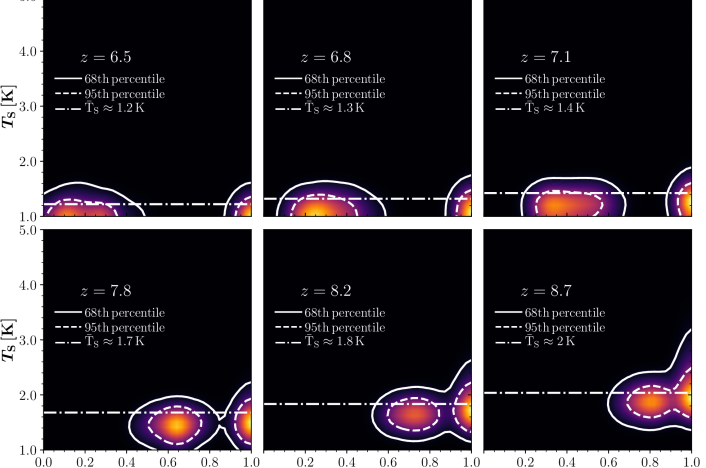
In Figure 6, we present the two dimensional marginalised posteriors for the IGM spin temperature, and the IGM neutral fraction, for each of the six redshift limits presented in Trott et al. (2020). These two dimensional posteriors are constructed after marginalising the output simulation data by the full posterior of astrophysical model parameters. Dashed (solid) contours correspond to the 68th (95th) percentiles. The vertical dot-dashed line corresponds to the value of the adiabatically cooled neutral IGM calculated at mean density, obtained from (RECFAST; Seager et al., 1999, 2000).
We recover two distinct islands for the constraints, driven by the two models outlined in Section 4.1. Firstly, we have an island at , which corresponds to fluctuations solely from the matter density field (i.e. no reionisation). Secondly, an island whose neutral fraction decreases for decreasing redshift as reionisation progresses (the ‘cold’ reionisation scenario). Both islands provide disfavoured limits on the IGM spin temperature, which are driven entirely by astrophysical models that produce little to no heating of the IGM (i.e. at 95 per cent confidence from Section 4.2). In the absence of any heating source, the neutral gas in the IGM adiabatically cools with the expansion of the Universe (represented by the vertical dot-dashed line). Note that in Figure 6, the disfavoured regions extend below the limit set by RECFAST, however, this is driven by the fact that 21CMFAST computes the IGM spin temperature on-the-fly in a non-uniform IGM. Due to non-linear structure evolution more of the simulation volume is contained within voids, resulting in the volume averaged IGM spin temperature dropping below the limit set for the neutral IGM at mean density (the horizontal dot-dashed line).
In order to recover disfavoured limits on just the IGM spin temperature, we marginalise our 2D posteriors over the IGM neutral fraction. In Figure 7, we present the disfavoured limits on the IGM spin temperature for all six redshifts presented in Trott et al. (2020). Here, the black (red) arrows denote the 68th (95th) percentiles of the disfavoured limits on the IGM spin temperature from the latest MWA upper limits and the black dot-dashed curve corresponds to the value for a neutral IGM at mean density obtained from RECFAST.
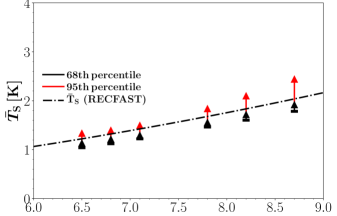
For the six redshift bins with upper limits on the 21-cm signal provided in Trott et al. (2020), we recover disfavoured limits on the IGM spin temperature 1.12 (1.32), 1.20 (1.38), 1.28 (1.48), 1.54 (1.82), 1.70 (2.09), 1.90 (2.43) K at 68th (95th) per cent confidence. As the disfavoured limits extend beyond the adiabatically cooled value for a neutral IGM (dot-dashed curve), this implies that the IGM must have undergone a small amount of heating by X-rays. This is broadly consistent with the interpretation of the recent upper limits from LOFAR at , which also prefer a small amount of X-ray heating (disfavoured limits of for Greig et al. 2020, for Ghara et al. 2020 and for Mondal et al. 2020 at 95 per cent confidence). Note however that the limits at higher redshifts (i.e. ) are completely driven by the 21-cm PS upper limits at lower redshifts (i.e. ), where the 21-cm upper limits are lower in amplitude. This explains the broadening disfavoured regions out to higher redshift, where the variation in the redshift evolution of the IGM spin temperature increases with increasing distance from the better constraining lower redshift upper limits.
5 Conclusion
The MWA recently published deep, multi-redshift upper limits at on the 21-cm PS in the reionisation epoch (Trott et al., 2020). These were obtained from 298 hours of carefully excised data from four observing seasons, to produce the best upper limits on the 21-cm signal to date at . At present, these upper limits are still too large to begin to rule out regions of astrophysical parameter space. Instead, following a similar approach to that of the recent analyses of the LOFAR upper limits at (Ghara et al., 2020; Greig et al., 2020; Mondal et al., 2020), we explore regions of astrophysical parameter space that are inconsistent with the observational data. We then extend this further to explore how these disfavoured astrophysical models compare against existing observational constraints on the reionisation epoch. We perform this analysis by directly forward modelling the 3D cosmic 21-cm signal using 21CMMC, an MCMC sampler of 3D reionisation simulations.
We find two classes of astrophysical models disfavoured by the recent MWA upper limits. These are (i) ‘cold’ reionisation models, whereby reionisation proceeds in a cold IGM owing to the lack of a heating source (e.g. no X-ray heating) or (ii) pure matter density fluctuations (i.e. no reionisation). This is the first work to disfavour a signal driven solely by matter density fluctuations.
With respect to the astrophysical parameters, we find that the latest MWA upper limits primarily restrict the soft-band X-ray luminosity of the first galaxies. At 95 per cent confidence, we recover disfavoured limits of . These limits sit below our current expectations from observations of analogue low-redshift star-forming galaxies (Mineo et al., 2012), stacked Chandra observations (Lehmer et al., 2016) and predictions at high-redshift from population synthesis models (Fragos et al., 2013).
In terms of galaxy UV properties, the strongest disfavoured limits are for low values of the parameters controlling the normalisation of the halo mass dependent power-laws for the fraction of galactic gas in stars, and the ionising escape fraction, and also the star-formation time-scale, . In order to exceed the existing MWA upper limits, the model 21-cm PS needs to be near its peak, which qualitatively occurs roughly around the mid-point of reionisation. Since the lowest amplitude upper limits are achieved at (i.e. ), reionisation must be at its mid-point near , which can only be achieved by minimising the number of ionising photons available for reionisation (i.e. low and ). For , the limits arise due to the degeneracy with the X-ray luminosity. The number density of X-ray photons is inversely proportional to the star-formation time-scale, thus in-order to minimise the amount of X-ray heating to produce large amplitude 21-cm signals, we strongly disfavour short star-formation time-scales.
Next, we extended our exploration to compare the astrophysical models disfavoured by the latest MWA upper limits to existing observation constraints on the reionisation epoch. We compared against: (i) a census of constraints and limits on the IGM neutral fraction, (ii) observed UV galaxy LFs, (iii) the electron scattering optical depth, (iv) the mean UV background photoionisation rate and (v) the soft-band X-ray emissivity. For all, we found that the vast majority of astrophysical models disfavoured by the existing MWA upper limits were already inconsistent with existing constraints. However, we found a small sample of models which were consistent with existing constraints. This implies that the MWA is already bringing unique constraining information to the astrophysics of reionisation, albeit extremely weakly. Using these latest MWA upper limits on the 21-cm signal, we were able to infer the first ever limits on the X-ray properties of galaxies at high redshifts. For the soft-band X-ray emissivity, conditional on the IGM neutral fraction, we recover lower limits of at .
Finally, we explored the conditional limits on the IGM spin temperature, with the IGM neutral fraction. At 95 per cent confidence, we recover disfavoured limits of 1.3, 1.4, 1.5, 1.8, 2.1, 2.4 K at , respectively. These limits are found to be above the limits placed by a neutral IGM at mean density undergoing purely adiabatic expansion, implying that the IGM must have undergone some level of X-ray heating. This picture is consistent with that found by Ghara et al. (2020) and Greig et al. (2020), for the recent LOFAR upper limits.
This exploration showcases the value of tools such as 21CMMC, which forward model the cosmic 21-cm signal in a fully Bayesian framework. In doing so, we are able to infer information about the astrophysics of reionisation from observations of the 21-cm signal. However, note that the astrophysical interpretations within this work are specific to our astrophysical parameterisation and underlying model assumptions. In the near future, as the upper limits on the 21-cm signal continue to improve, we will soon be able to begin to rule out currently viable regions of astrophysical parameter space. Specifically the MWA in the near term should focus on reducing the amplitude of the 21-cm power at the largest scales, (i.e. Mpc) and lowest redshifts (), to maximise the total disfavoured parameter volume.
Acknowledgements
We thank Andrei Mesinger for comments on an early version of this draft. We also thank Bret Lehmer for providing the X-ray emissivity data. Parts of this research were supported by the Australian Research Council Centre of Excellence for All Sky Astrophysics in 3 Dimensions (ASTRO 3D), through project number CE170100013. CMT is supported by an ARC Future Fellowship under grant FT180100321. The International Centre for Radio Astronomy Research (ICRAR) is a Joint Venture of Curtin University and The University of Western Australia, funded by the Western Australian State government. Parts of this work were performed on the OzSTAR national facility at Swinburne University of Technology. OzSTAR is funded by Swinburne University of Technology.
Data Availability
The data underlying this article will be shared on reasonable request to the corresponding author.
References
- Akeret et al. (2013) Akeret J., Seehars S., Amara A., Refregier A., Csillaghy A., 2013, Astron. Comput., 2, 27
- Baek et al. (2010) Baek S., Semelin B., Matteo P. D., Revaz Y., Combes F., 2010, A&A, 523, A4
- Barkana (2016) Barkana R., 2016, Phys. Rep., 645, 1
- Barkana & Loeb (2001) Barkana R., Loeb A., 2001, Phys. Rep., 349, 125
- Barry et al. (2019) Barry N., et al., 2019, ApJ, 884, 1
- Beardsley et al. (2016) Beardsley A. P., et al., 2016, ApJ, 833, 102
- Behroozi & Silk (2015) Behroozi P. S., Silk J., 2015, ApJ, 799, 32
- Behroozi et al. (2019) Behroozi P., Wechsler R. H., Hearin A. P., Conroy C., 2019, MNRAS, 488, 3143
- Bernardi et al. (2016a) Bernardi G., et al., 2016a, MNRAS, 461, 2847
- Bernardi et al. (2016b) Bernardi G., et al., 2016b, MNRAS, 461, 2847
- Bouwens et al. (2015) Bouwens R. J., et al., 2015, ApJ, 803, 34
- Bouwens et al. (2017) Bouwens R. J., Oesch P. A., Illingworth G. D., Ellis R. S., Stefanon M., 2017, ApJ, 843, 129
- Bowman & Rogers (2010) Bowman J. D., Rogers A. E. E., 2010, Nature, 468, 796
- Bowman et al. (2018a) Bowman J. D., Rogers A. E. E., Monsalve R. A., Mozdzen T. J., Mahesh N., 2018a, Nature, 555, 67
- Bowman et al. (2018b) Bowman J. D., Rogers A. E. E., Monsalve R. A., Mozdzen T. J., Mahesh N., 2018b, Nature, 564, E35
- Bradley et al. (2019) Bradley R. F., Tauscher K., Rapetti D., Burns J. O., 2019, ApJ, 874, 153
- Calverley et al. (2011) Calverley A. P., Becker G. D., Haehnelt M. G., Bolton J. S., 2011, MNRAS, 412, 2543
- Cheng et al. (2018) Cheng C., et al., 2018, ApJ, 868, 26
- Choudhury & Paranjape (2018) Choudhury T. R., Paranjape A., 2018, MNRAS, 481, 3821
- Davies et al. (2018) Davies F. B., et al., 2018, ApJ, 864, 142
- Dayal et al. (2014) Dayal P., Ferrara A., Dunlop J. S., Pacucci F., 2014, MNRAS, 445, 2545
- DeBoer et al. (2017) DeBoer D. R., et al., 2017, PASP, 129, 045001
- Dillon et al. (2015) Dillon J. S., et al., 2015, Phys. Rev. D, 91, 123011
- Draine & Miralda-Escudé (2018) Draine B. T., Miralda-Escudé J., 2018, ApJ, 858, L10
- Eastwood et al. (2019) Eastwood M. W., et al., 2019, AJ, 158, 84
- Eide et al. (2018) Eide M. B., Graziani L., Ciardi B., Feng Y., Kakiichi K., Di Matteo T., 2018, MNRAS, 476, 1174
- Foreman-Mackey et al. (2013) Foreman-Mackey D., Hogg D. W., Lang D., Goodman J., 2013, PASP, 125, 306
- Fragos et al. (2013) Fragos T., et al., 2013, ApJ, 764, 41
- Furlanetto et al. (2004) Furlanetto S. R., Zaldarriaga M., Hernquist L., 2004, ApJ, 613, 1
- Furlanetto et al. (2006) Furlanetto S. R., Oh S. P., Briggs F. H., 2006, Phys. Rep., 433, 181
- Gehlot et al. (2019) Gehlot B. K., et al., 2019, MNRAS, 488, 4271
- Ghara et al. (2018) Ghara R., Mellema G., Giri S. K., Choudhury T. R., Datta K. K., Majumdar S., 2018, MNRAS, 476, 1741
- Ghara et al. (2020) Ghara R., et al., 2020, MNRAS,
- Giroux et al. (1994) Giroux M. L., Sutherland R. S., Shull J. M., 1994, ApJ, 435, L97
- Goodman & Weare (2010) Goodman J., Weare J., 2010, Commun. Appl. Math. Comput. Sci., 5, 1
- Greenhill & Bernardi (2012) Greenhill L. J., Bernardi G., 2012, preprint (arXiv:1201.1700)
- Greig & Mesinger (2015) Greig B., Mesinger A., 2015, MNRAS, 449, 4246
- Greig & Mesinger (2017) Greig B., Mesinger A., 2017, MNRAS, 472, 2651
- Greig & Mesinger (2018) Greig B., Mesinger A., 2018, MNRAS, 477, 3217
- Greig et al. (2017) Greig B., Mesinger A., Haiman Z., Simcoe R. A., 2017, MNRAS, 466, 4239
- Greig et al. (2019) Greig B., Mesinger A., Bañados E., 2019, MNRAS, 484, 5094
- Greig et al. (2020) Greig B., et al., 2020, arXiv e-prints: (arXiv:2006.03203),
- Harikane et al. (2016) Harikane Y., et al., 2016, ApJ, 821, 123
- Hassan et al. (2017) Hassan S., Davé R., Finlator K., Santos M. G., 2017, MNRAS, 468, 122
- Hills et al. (2018) Hills R., Kulkarni G., Meerburg P. D., Puchwein E., 2018, Nature, 564, E32
- Hoag et al. (2019) Hoag A., et al., 2019, ApJ, 878, 12
- Hui & Gnedin (1997) Hui L., Gnedin N. Y., 1997, MNRAS, 292, 27
- Hutter (2018) Hutter A., 2018, MNRAS, 477, 1549
- Hutter et al. (2020) Hutter A., Dayal P., Yepes G., Gottlöber S., Legrand L., Ucci G., 2020, arXiv e-prints, p. arXiv:2004.08401
- Jensen et al. (2013) Jensen H., et al., 2013, MNRAS, 435, 460
- Kolopanis et al. (2019) Kolopanis M., et al., 2019, ApJ, 883, 133
- Koopmans et al. (2015) Koopmans L., et al., 2015, in Advancing Astrophysics with the Square Kilometre Array (AASKA14), preprint (arXiv:1505.07568). (arXiv:1505.07568)
- Kuhlen & Faucher-Giguère (2012) Kuhlen M., Faucher-Giguère C.-A., 2012, MNRAS, 423, 862
- Lehmer et al. (2016) Lehmer B. D., et al., 2016, ApJ, 825, 7
- Li et al. (2019) Li W., et al., 2019, ApJ, 887, 141
- Lidz et al. (2008) Lidz A., Zahn O., McQuinn M., Zaldarriaga M., Hernquist L., 2008, ApJ, 680, 962
- Madau & Dickinson (2014) Madau P., Dickinson M., 2014, ARA&A, 52, 415
- Madau & Fragos (2017) Madau P., Fragos T., 2017, ApJ, 840, 39
- Mao et al. (2012) Mao Y., Shapiro P. R., Mellema G., Iliev I. T., Koda J., Ahn K., 2012, MNRAS, 422, 926
- Mason et al. (2018) Mason C. A., Treu T., Dijkstra M., Mesinger A., Trenti M., Pentericci L., de Barros S., Vanzella E., 2018, ApJ, 856, 2
- Mason et al. (2019) Mason C. A., et al., 2019, MNRAS, 485, 3947
- McGreer et al. (2015) McGreer I. D., Mesinger A., D’Odorico V., 2015, MNRAS, 447, 499
- McQuinn (2012) McQuinn M., 2012, MNRAS, 426, 1349
- McQuinn et al. (2005) McQuinn M., Furlanetto S. R., Hernquist L., Zahn O., Zaldarriaga M., 2005, ApJ, 630, 643
- Mellema et al. (2006) Mellema G., Iliev I. T., Pen U.-L., Shapiro P. R., 2006, MNRAS, 372, 679
- Mellema et al. (2013) Mellema G., et al., 2013, Exp. Astron., 36, 235
- Mertens et al. (2020) Mertens F. G., et al., 2020, MNRAS, 493, 1662
- Mesinger & Dijkstra (2008) Mesinger A., Dijkstra M., 2008, MNRAS, 390, 1071
- Mesinger & Furlanetto (2007) Mesinger A., Furlanetto S., 2007, ApJ, 669, 663
- Mesinger et al. (2011) Mesinger A., Furlanetto S., Cen R., 2011, MNRAS, 411, 955
- Mesinger et al. (2013) Mesinger A., Ferrara A., Spiegel D. S., 2013, MNRAS, 431, 621
- Mesinger et al. (2014) Mesinger A., Ewall-Wice A., Hewitt J., 2014, MNRAS, 439, 3262
- Mesinger et al. (2015) Mesinger A., Aykutalp A., Vanzella E., Pentericci L., Ferrara A., Dijkstra M., 2015, MNRAS, 446, 566
- Mineo et al. (2012) Mineo S., Gilfanov M., Sunyaev R., 2012, MNRAS, 419, 2095
- Mitra et al. (2015) Mitra S., Choudhury T. R., Ferrara A., 2015, MNRAS, 454, L76
- Molaro et al. (2019) Molaro M., Davé R., Hassan S., Santos M. G., Finlator K., 2019, MNRAS, 489, 5594
- Mondal et al. (2020) Mondal R., et al., 2020, arXiv e-prints, p. arXiv:2004.00678
- Monsalve et al. (2017) Monsalve R. A., Rogers A. E. E., Bowman J. D., Mozdzen T. J., 2017, ApJ, 847, 64
- Morales & Wyithe (2010) Morales M. F., Wyithe J. S. B., 2010, ARA&A, 48, 127
- Mutch et al. (2016) Mutch S. J., Geil P. M., Poole G. B., Angel P. W., Duffy A. R., Mesinger A., Wyithe J. S. B., 2016, MNRAS, 462, 250
- Ocvirk et al. (2016) Ocvirk P., et al., 2016, MNRAS, 463, 1462
- Oesch et al. (2018) Oesch P. A., Bouwens R. J., Illingworth G. D., Labbé I., Stefanon M., 2018, ApJ, 855, 105
- Okamoto et al. (2008) Okamoto T., Gao L., Theuns T., 2008, MNRAS, 390, 920
- Paciga et al. (2013) Paciga G., et al., 2013, MNRAS, 433, 1174
- Paranjape & Choudhury (2014) Paranjape A., Choudhury T. R., 2014, MNRAS, 442, 1470
- Paranjape et al. (2016) Paranjape A., Choudhury T. R., Padmanabhan H., 2016, MNRAS, 460, 1801
- Park et al. (2019) Park J., Mesinger A., Greig B., Gillet N., 2019, MNRAS, 484, 933
- Parsons et al. (2010) Parsons A. R., et al., 2010, AJ, 139, 1468
- Parsons et al. (2014) Parsons A. R., et al., 2014, ApJ, 788, 106
- Patil et al. (2017) Patil A. H., et al., 2017, ApJ, 838, 65
- Patra et al. (2015) Patra N., Subrahmanyan R., Sethi S., Shankar N. U., Raghunathan A., 2015, ApJ, 801, 138
- Philip et al. (2019) Philip L., et al., 2019, Journal of Astronomical Instrumentation, 8, 1950004
- Planck Collaboration XIII (2016) Planck Collaboration XIII 2016, A&A, 594, A13
- Planck Collaboration et al. (2018) Planck Collaboration et al., 2018, preprint (arXiv:1807.06209), p. arXiv:1807.06209
- Pritchard & Furlanetto (2007) Pritchard J. R., Furlanetto S. R., 2007, MNRAS, 376, 1680
- Pritchard & Loeb (2012) Pritchard J. R., Loeb A., 2012, Rep. Prog. Phys., 75, 086901
- Ricotti & Ostriker (2004) Ricotti M., Ostriker J. P., 2004, MNRAS, 350, 539
- Ross et al. (2017) Ross H. E., Dixon K. L., Iliev I. T., Mellema G., 2017, MNRAS, 468, 3785
- Salpeter (1955) Salpeter E. E., 1955, ApJ, 121, 161
- Scoccimarro (1998) Scoccimarro R., 1998, MNRAS, 299, 1097
- Seager et al. (1999) Seager S., Sasselov D. D., Scott D., 1999, ApJ, 523, L1
- Seager et al. (2000) Seager S., Sasselov D. D., Scott D., 2000, ApJS, 128, 407
- Shapiro et al. (1994) Shapiro P. R., Giroux M. L., Babul A., 1994, ApJ, 427, 25
- Singh & Subrahmanyan (2019) Singh S., Subrahmanyan R., 2019, ApJ, 880, 26
- Singh et al. (2017) Singh S., et al., 2017, ApJL, 845, L12
- Sobacchi & Mesinger (2013a) Sobacchi E., Mesinger A., 2013a, MNRAS, 432, L51
- Sobacchi & Mesinger (2013b) Sobacchi E., Mesinger A., 2013b, MNRAS, 432, 3340
- Sobacchi & Mesinger (2014) Sobacchi E., Mesinger A., 2014, MNRAS, 440, 1662
- Sobacchi & Mesinger (2015) Sobacchi E., Mesinger A., 2015, MNRAS, 453, 1843
- Sokolowski et al. (2015) Sokolowski M., et al., 2015, PASA, 32, e004
- Springel & Hernquist (2003) Springel V., Hernquist L., 2003, MNRAS, 339, 312
- Sun & Furlanetto (2016) Sun G., Furlanetto S. R., 2016, MNRAS, 460, 417
- Tacchella et al. (2018) Tacchella S., Bose S., Conroy C., Eisenstein D. J., Johnson B. D., 2018, ApJ, 868, 92
- Tingay et al. (2013) Tingay S. J., et al., 2013, PASA, 30, 7
- Trott et al. (2020) Trott C. M., et al., 2020, MNRAS,
- Tzanavaris & Georgantopoulos (2008) Tzanavaris P., Georgantopoulos I., 2008, A&A, 480, 663
- Voytek et al. (2014) Voytek T. C., Natarajan A., García J. M. J., Peterson J. B., López-Cruz O., 2014, ApJL, 782, L9
- Wayth et al. (2018) Wayth R., et al., 2018, Publ. Astron. Soc. Australia, 35, 33
- Wyithe & Bolton (2011) Wyithe J. S. B., Bolton J. S., 2011, MNRAS, 412, 1926
- Yue et al. (2016) Yue B., Ferrara A., Xu Y., 2016, MNRAS, 463, 1968
- Yung et al. (2019) Yung L. Y. A., Somerville R. S., Popping G., Finkelstein S. L., Ferguson H. C., Davé R., 2019, MNRAS, p. 2437
- Zahn et al. (2007) Zahn O., Lidz A., McQuinn M., Dutta S., Hernquist L., Zaldarriaga M., Furlanetto S. R., 2007, ApJ, 654, 12
- Zahn et al. (2011) Zahn O., Mesinger A., McQuinn M., Trac H., Cen R., Hernquist L. E., 2011, MNRAS, 414, 727
- Zaroubi (2013) Zaroubi S., 2013, The First Galaxies, Astrophysics and Space Science Library, Vol. 396. Springer-Verlag, Berlin, p. 45
- van Haarlem et al. (2013) van Haarlem M. P., et al., 2013, A&A, 556, 2